Zip Codes with the Highest Percentage of Population Employed in Legal Services & Support in Danville, VA
RELATED REPORTS & OPTIONS
Legal Services & Support
Danville
Compare Zip Codes
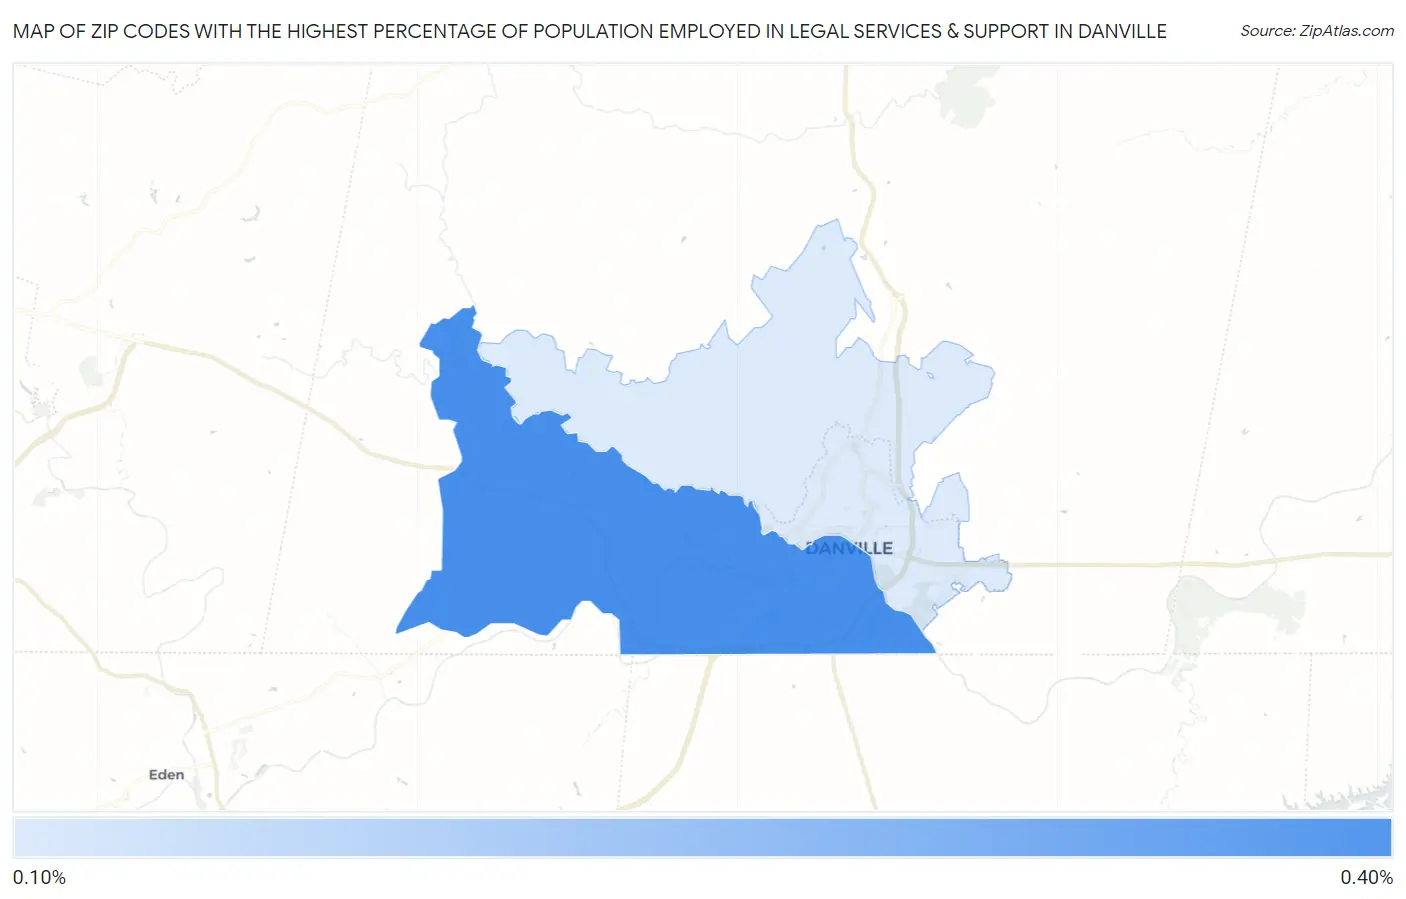
Map of Zip Codes with the Highest Percentage of Population Employed in Legal Services & Support in Danville
0.0%
0.40%
Zip Codes with the Highest Percentage of Population Employed in Legal Services & Support in Danville, VA
| Zip Code | % Employed | vs State | vs National | |
| 1. | 24541 | 0.31% | 1.6%(-1.31)#406 | 1.2%(-0.871)#14,884 |
| 2. | 24540 | 0.14% | 1.6%(-1.48)#444 | 1.2%(-1.04)#16,768 |
1
Common Questions
What are the Top Zip Codes with the Highest Percentage of Population Employed in Legal Services & Support in Danville, VA?
Top Zip Codes with the Highest Percentage of Population Employed in Legal Services & Support in Danville, VA are:
What zip code has the Highest Percentage of Population Employed in Legal Services & Support in Danville, VA?
24541 has the Highest Percentage of Population Employed in Legal Services & Support in Danville, VA with 0.31%.
What is the Percentage of Population Employed in Legal Services & Support in Danville, VA?
Percentage of Population Employed in Legal Services & Support in Danville is 0.27%.
What is the Percentage of Population Employed in Legal Services & Support in Virginia?
Percentage of Population Employed in Legal Services & Support in Virginia is 1.6%.
What is the Percentage of Population Employed in Legal Services & Support in the United States?
Percentage of Population Employed in Legal Services & Support in the United States is 1.2%.