Zip Codes with the Highest Percentage of Population Employed in Architecture & Engineering in Danville, VA
RELATED REPORTS & OPTIONS
Architecture & Engineering
Danville
Compare Zip Codes
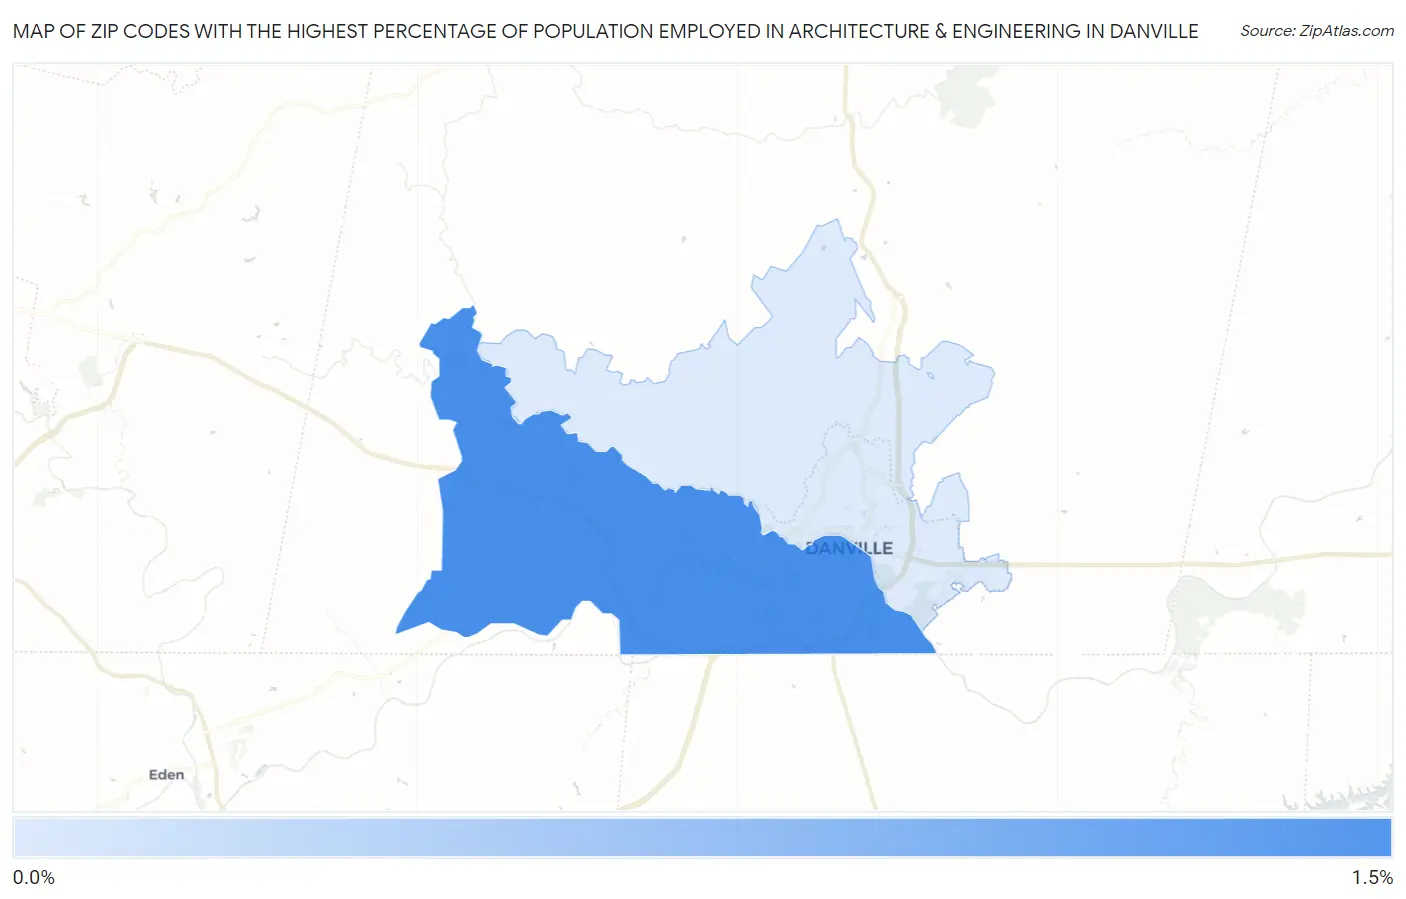
Map of Zip Codes with the Highest Percentage of Population Employed in Architecture & Engineering in Danville
0.0%
1.5%
Zip Codes with the Highest Percentage of Population Employed in Architecture & Engineering in Danville, VA
| Zip Code | % Employed | vs State | vs National | |
| 1. | 24541 | 1.0% | 2.3%(-1.26)#436 | 2.1%(-1.11)#16,285 |
| 2. | 24540 | 0.44% | 2.3%(-1.86)#527 | 2.1%(-1.71)#20,653 |
1
Common Questions
What are the Top Zip Codes with the Highest Percentage of Population Employed in Architecture & Engineering in Danville, VA?
Top Zip Codes with the Highest Percentage of Population Employed in Architecture & Engineering in Danville, VA are:
What zip code has the Highest Percentage of Population Employed in Architecture & Engineering in Danville, VA?
24541 has the Highest Percentage of Population Employed in Architecture & Engineering in Danville, VA with 1.0%.
What is the Percentage of Population Employed in Architecture & Engineering in Danville, VA?
Percentage of Population Employed in Architecture & Engineering in Danville is 0.76%.
What is the Percentage of Population Employed in Architecture & Engineering in Virginia?
Percentage of Population Employed in Architecture & Engineering in Virginia is 2.3%.
What is the Percentage of Population Employed in Architecture & Engineering in the United States?
Percentage of Population Employed in Architecture & Engineering in the United States is 2.1%.