Zip Codes with the Highest Percentage of Population Employed in Health Diagnosing & Treating in Springfield, VA
RELATED REPORTS & OPTIONS
Health Diagnosing & Treating
Springfield
Compare Zip Codes
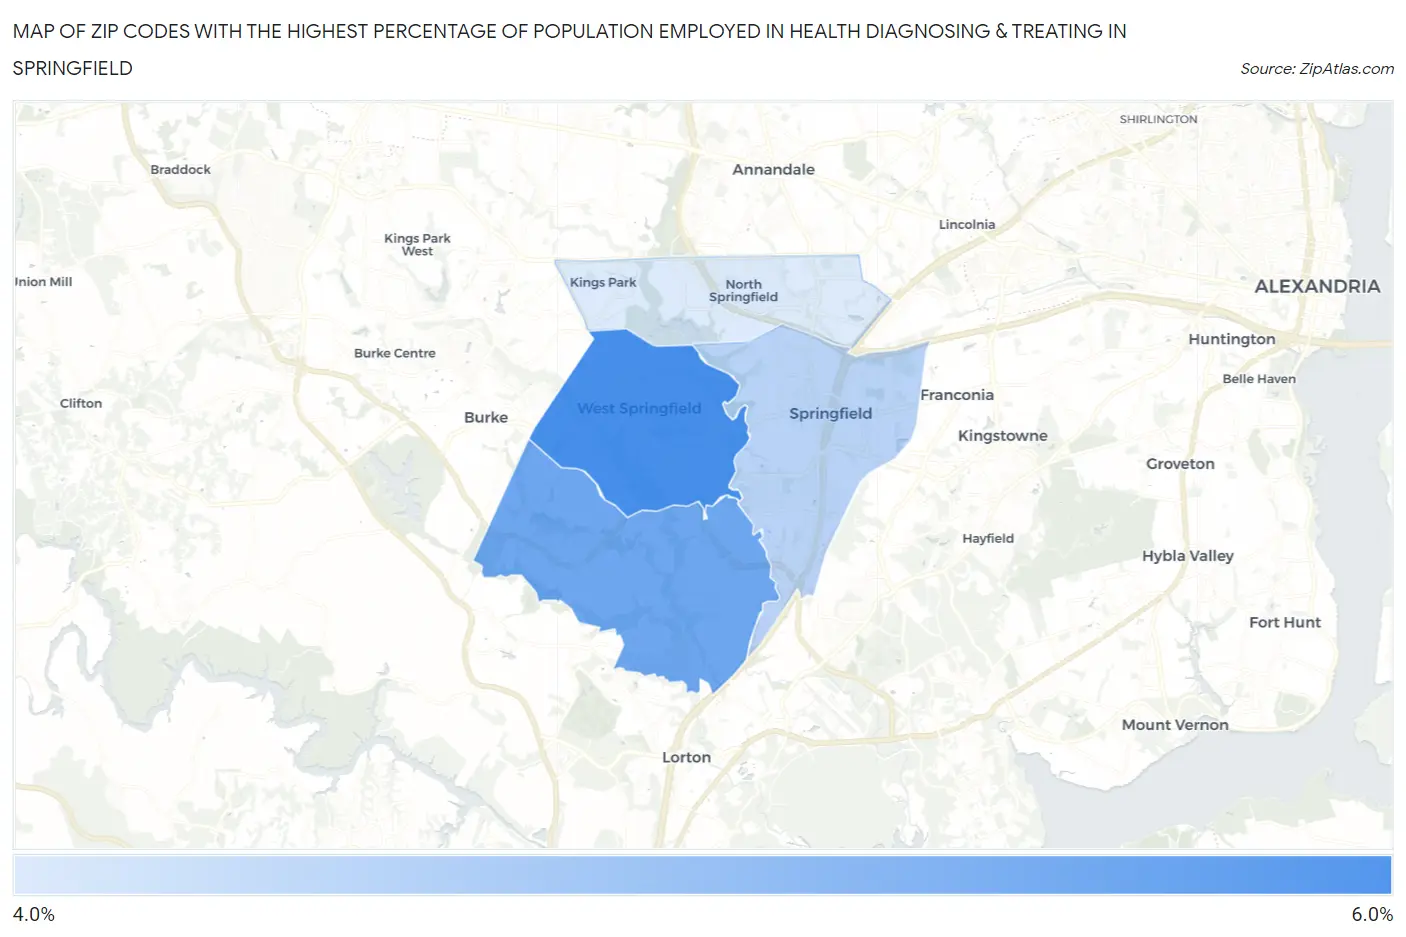
Map of Zip Codes with the Highest Percentage of Population Employed in Health Diagnosing & Treating in Springfield
0.0%
6.0%
Zip Codes with the Highest Percentage of Population Employed in Health Diagnosing & Treating in Springfield, VA
| Zip Code | % Employed | vs State | vs National | |
| 1. | 22152 | 5.0% | 5.7%(-0.622)#421 | 6.2%(-1.21)#17,562 |
| 2. | 22153 | 4.8% | 5.7%(-0.852)#448 | 6.2%(-1.44)#18,479 |
| 3. | 22150 | 4.4% | 5.7%(-1.27)#494 | 6.2%(-1.86)#20,041 |
| 4. | 22151 | 4.2% | 5.7%(-1.48)#510 | 6.2%(-2.07)#20,776 |
1
Common Questions
What are the Top 3 Zip Codes with the Highest Percentage of Population Employed in Health Diagnosing & Treating in Springfield, VA?
Top 3 Zip Codes with the Highest Percentage of Population Employed in Health Diagnosing & Treating in Springfield, VA are:
What zip code has the Highest Percentage of Population Employed in Health Diagnosing & Treating in Springfield, VA?
22152 has the Highest Percentage of Population Employed in Health Diagnosing & Treating in Springfield, VA with 5.0%.
What is the Percentage of Population Employed in Health Diagnosing & Treating in Springfield, VA?
Percentage of Population Employed in Health Diagnosing & Treating in Springfield is 4.4%.
What is the Percentage of Population Employed in Health Diagnosing & Treating in Virginia?
Percentage of Population Employed in Health Diagnosing & Treating in Virginia is 5.7%.
What is the Percentage of Population Employed in Health Diagnosing & Treating in the United States?
Percentage of Population Employed in Health Diagnosing & Treating in the United States is 6.2%.