Zip Codes with the Highest Percentage of Population Taking Taxi / Cab to Work in Danville, VA
RELATED REPORTS & OPTIONS
Taxi / Cab
Danville
Compare Zip Codes
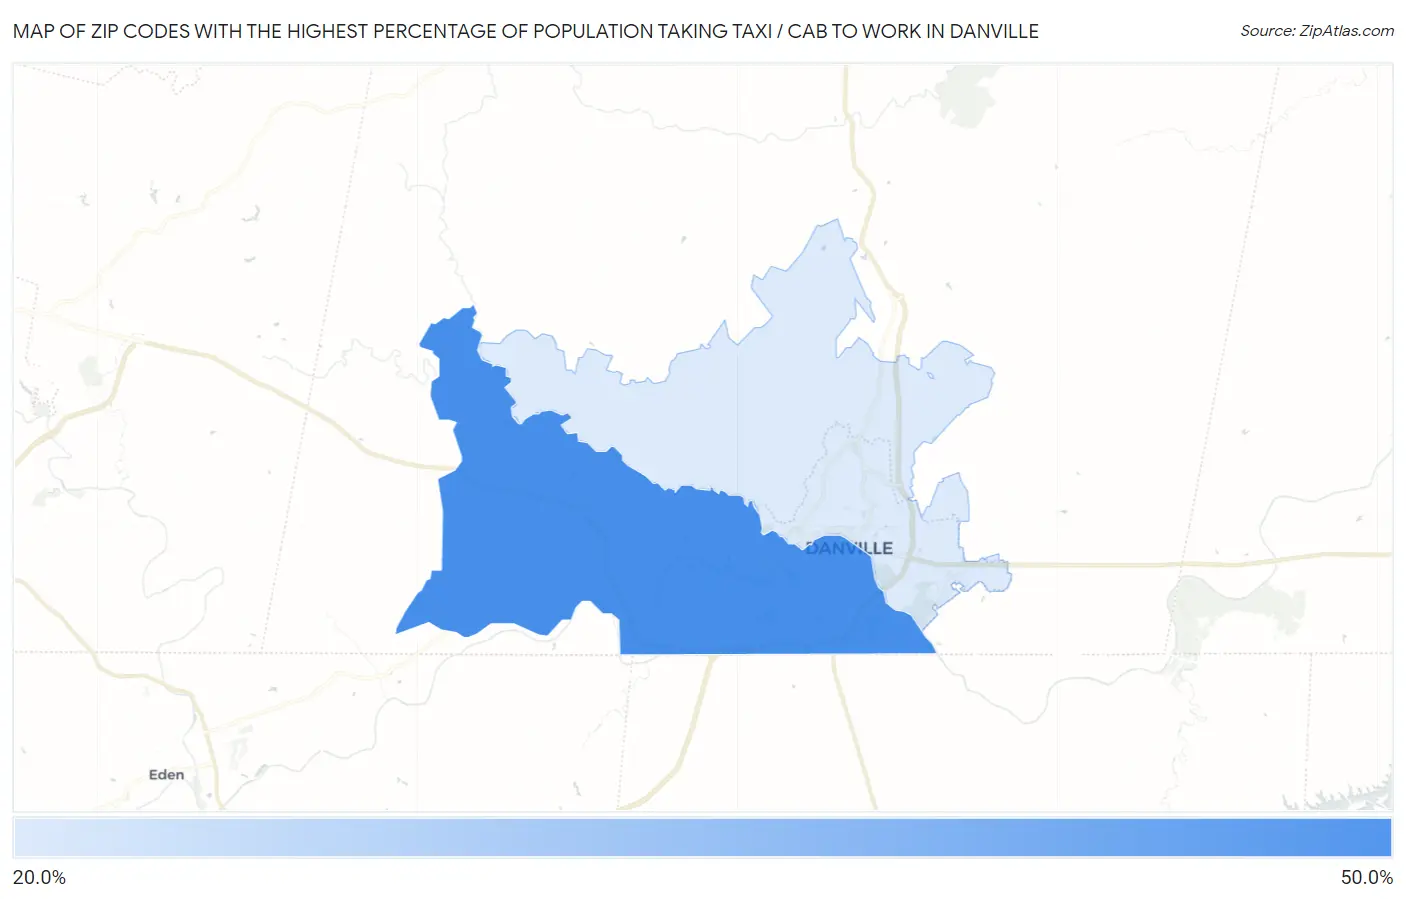
Map of Zip Codes with the Highest Percentage of Population Taking Taxi / Cab to Work in Danville
0.0%
50.0%
Zip Codes with the Highest Percentage of Population Taking Taxi / Cab to Work in Danville, VA
| Zip Code | % Take Taxi / Cab | vs State | vs National | |
| 1. | 24541 | 48.7% | 39.4%(+9.30)#67 | 38.2%(+10.5)#3,353 |
| 2. | 24540 | 27.0% | 39.4%(-12.4)#279 | 38.2%(-11.2)#11,799 |
1
Common Questions
What are the Top Zip Codes with the Highest Percentage of Population Taking Taxi / Cab to Work in Danville, VA?
Top Zip Codes with the Highest Percentage of Population Taking Taxi / Cab to Work in Danville, VA are:
What zip code has the Highest Percentage of Population Taking Taxi / Cab to Work in Danville, VA?
24541 has the Highest Percentage of Population Taking Taxi / Cab to Work in Danville, VA with 48.7%.
What is the Percentage of Population Taking Taxi / Cab to Work in Danville, VA?
Percentage of Population Taking Taxi / Cab to Work in Danville is 47.8%.
What is the Percentage of Population Taking Taxi / Cab to Work in Virginia?
Percentage of Population Taking Taxi / Cab to Work in Virginia is 39.4%.
What is the Percentage of Population Taking Taxi / Cab to Work in the United States?
Percentage of Population Taking Taxi / Cab to Work in the United States is 38.2%.