Zip Codes with the Highest Percentage of Population Employed in Health Diagnosing & Treating in Winchester, VA
RELATED REPORTS & OPTIONS
Health Diagnosing & Treating
Winchester
Compare Zip Codes
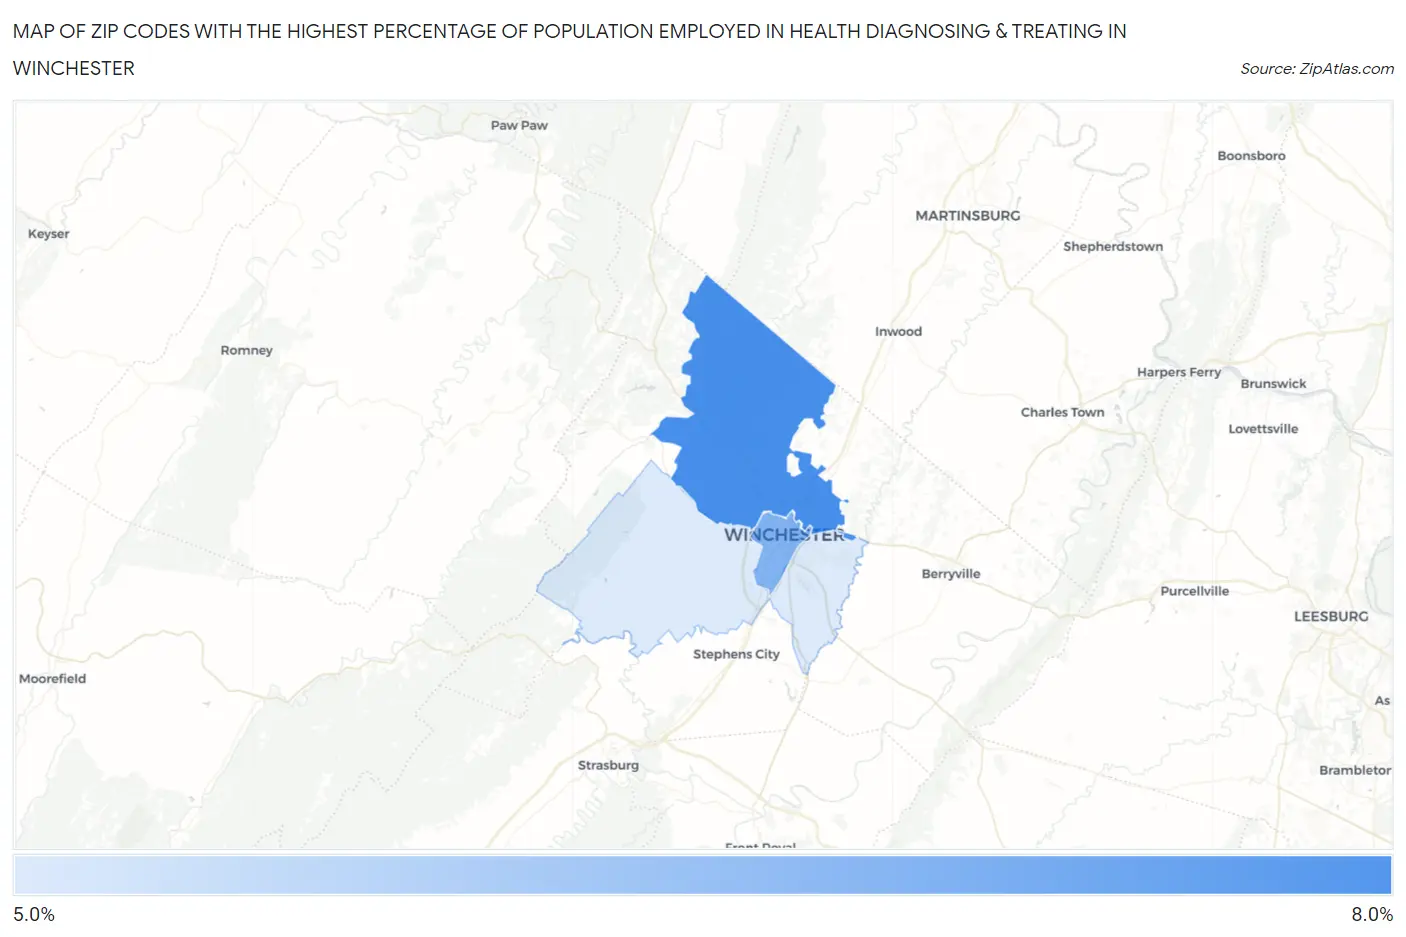
Map of Zip Codes with the Highest Percentage of Population Employed in Health Diagnosing & Treating in Winchester
0.0%
8.0%
Zip Codes with the Highest Percentage of Population Employed in Health Diagnosing & Treating in Winchester, VA
| Zip Code | % Employed | vs State | vs National | |
| 1. | 22603 | 7.4% | 5.7%(+1.78)#227 | 6.2%(+1.19)#9,014 |
| 2. | 22601 | 6.8% | 5.7%(+1.12)#275 | 6.2%(+0.530)#11,079 |
| 3. | 22602 | 5.7% | 5.7%(+0.083)#351 | 6.2%(-0.505)#14,837 |
1
Common Questions
What are the Top Zip Codes with the Highest Percentage of Population Employed in Health Diagnosing & Treating in Winchester, VA?
Top Zip Codes with the Highest Percentage of Population Employed in Health Diagnosing & Treating in Winchester, VA are:
What zip code has the Highest Percentage of Population Employed in Health Diagnosing & Treating in Winchester, VA?
22603 has the Highest Percentage of Population Employed in Health Diagnosing & Treating in Winchester, VA with 7.4%.
What is the Percentage of Population Employed in Health Diagnosing & Treating in Winchester, VA?
Percentage of Population Employed in Health Diagnosing & Treating in Winchester is 6.7%.
What is the Percentage of Population Employed in Health Diagnosing & Treating in Virginia?
Percentage of Population Employed in Health Diagnosing & Treating in Virginia is 5.7%.
What is the Percentage of Population Employed in Health Diagnosing & Treating in the United States?
Percentage of Population Employed in Health Diagnosing & Treating in the United States is 6.2%.