Zip Codes with the Highest Percentage of Population Employed in Architecture & Engineering in West Valley City, UT
RELATED REPORTS & OPTIONS
Architecture & Engineering
West Valley City
Compare Zip Codes
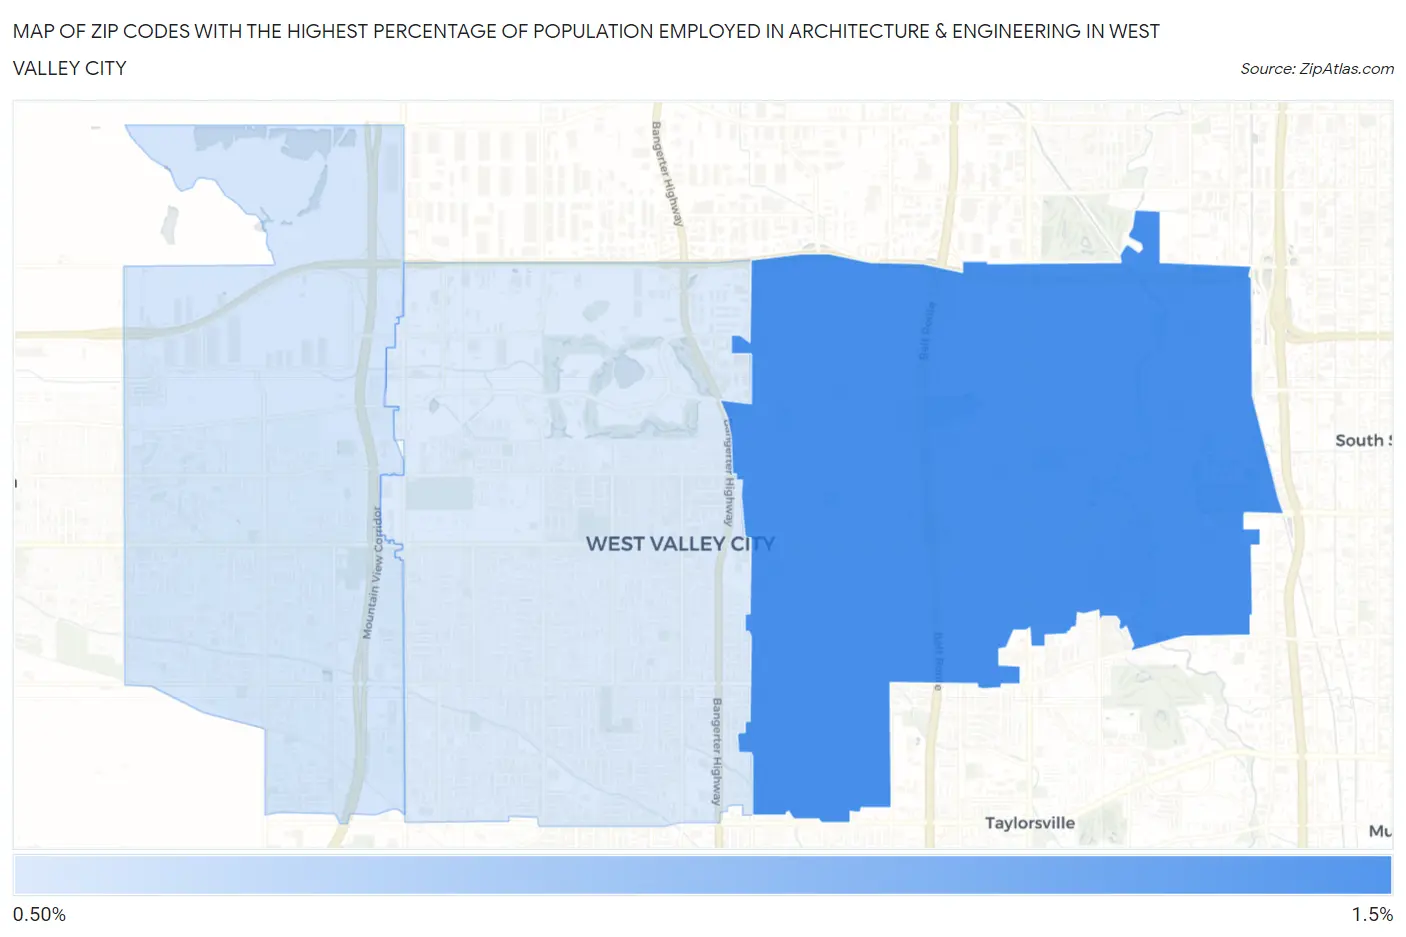
Map of Zip Codes with the Highest Percentage of Population Employed in Architecture & Engineering in West Valley City
0.0%
1.5%
Zip Codes with the Highest Percentage of Population Employed in Architecture & Engineering in West Valley City, UT
| Zip Code | % Employed | vs State | vs National | |
| 1. | 84119 | 1.2% | 2.2%(-0.982)#155 | 2.1%(-0.974)#15,274 |
| 2. | 84128 | 1.0% | 2.2%(-1.14)#159 | 2.1%(-1.13)#16,448 |
| 3. | 84120 | 1.0% | 2.2%(-1.15)#160 | 2.1%(-1.14)#16,508 |
1
Common Questions
What are the Top Zip Codes with the Highest Percentage of Population Employed in Architecture & Engineering in West Valley City, UT?
Top Zip Codes with the Highest Percentage of Population Employed in Architecture & Engineering in West Valley City, UT are:
What zip code has the Highest Percentage of Population Employed in Architecture & Engineering in West Valley City, UT?
84119 has the Highest Percentage of Population Employed in Architecture & Engineering in West Valley City, UT with 1.2%.
What is the Percentage of Population Employed in Architecture & Engineering in West Valley City, UT?
Percentage of Population Employed in Architecture & Engineering in West Valley City is 1.1%.
What is the Percentage of Population Employed in Architecture & Engineering in Utah?
Percentage of Population Employed in Architecture & Engineering in Utah is 2.2%.
What is the Percentage of Population Employed in Architecture & Engineering in the United States?
Percentage of Population Employed in Architecture & Engineering in the United States is 2.1%.