Zip Codes with the Highest Percentage of Population Employed in Architecture & Engineering in Layton, UT
RELATED REPORTS & OPTIONS
Architecture & Engineering
Layton
Compare Zip Codes
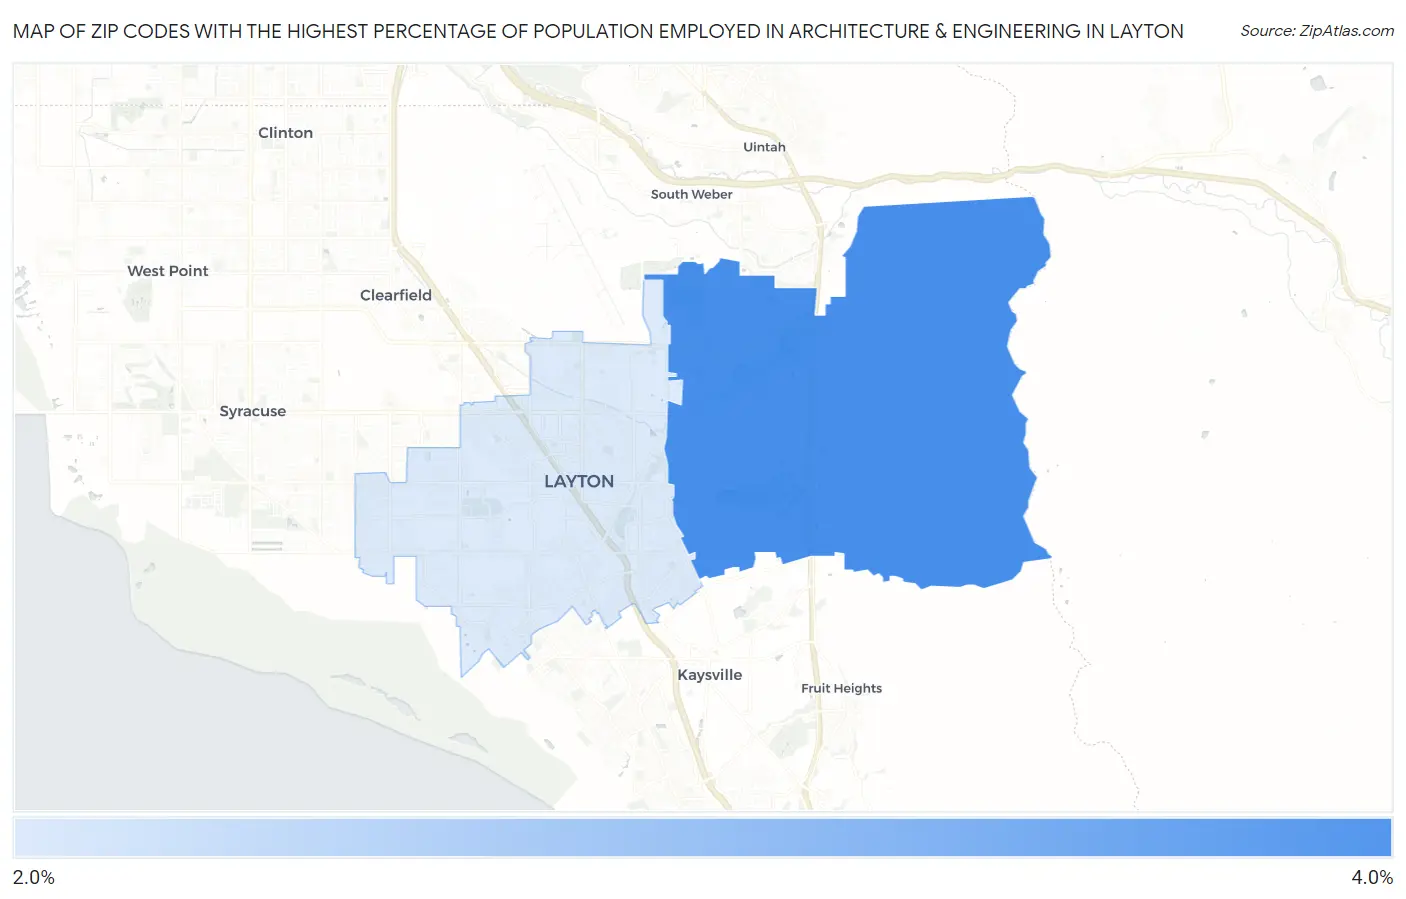
Map of Zip Codes with the Highest Percentage of Population Employed in Architecture & Engineering in Layton
0.0%
4.0%
Zip Codes with the Highest Percentage of Population Employed in Architecture & Engineering in Layton, UT
| Zip Code | % Employed | vs State | vs National | |
| 1. | 84040 | 3.4% | 2.2%(+1.22)#40 | 2.1%(+1.23)#3,993 |
| 2. | 84041 | 2.5% | 2.2%(+0.319)#73 | 2.1%(+0.328)#7,098 |
1
Common Questions
What are the Top Zip Codes with the Highest Percentage of Population Employed in Architecture & Engineering in Layton, UT?
Top Zip Codes with the Highest Percentage of Population Employed in Architecture & Engineering in Layton, UT are:
What zip code has the Highest Percentage of Population Employed in Architecture & Engineering in Layton, UT?
84040 has the Highest Percentage of Population Employed in Architecture & Engineering in Layton, UT with 3.4%.
What is the Percentage of Population Employed in Architecture & Engineering in Layton, UT?
Percentage of Population Employed in Architecture & Engineering in Layton is 2.8%.
What is the Percentage of Population Employed in Architecture & Engineering in Utah?
Percentage of Population Employed in Architecture & Engineering in Utah is 2.2%.
What is the Percentage of Population Employed in Architecture & Engineering in the United States?
Percentage of Population Employed in Architecture & Engineering in the United States is 2.1%.