Zip Codes with the Highest Percentage of Population Employed in Architecture & Engineering in Provo, UT
RELATED REPORTS & OPTIONS
Architecture & Engineering
Provo
Compare Zip Codes
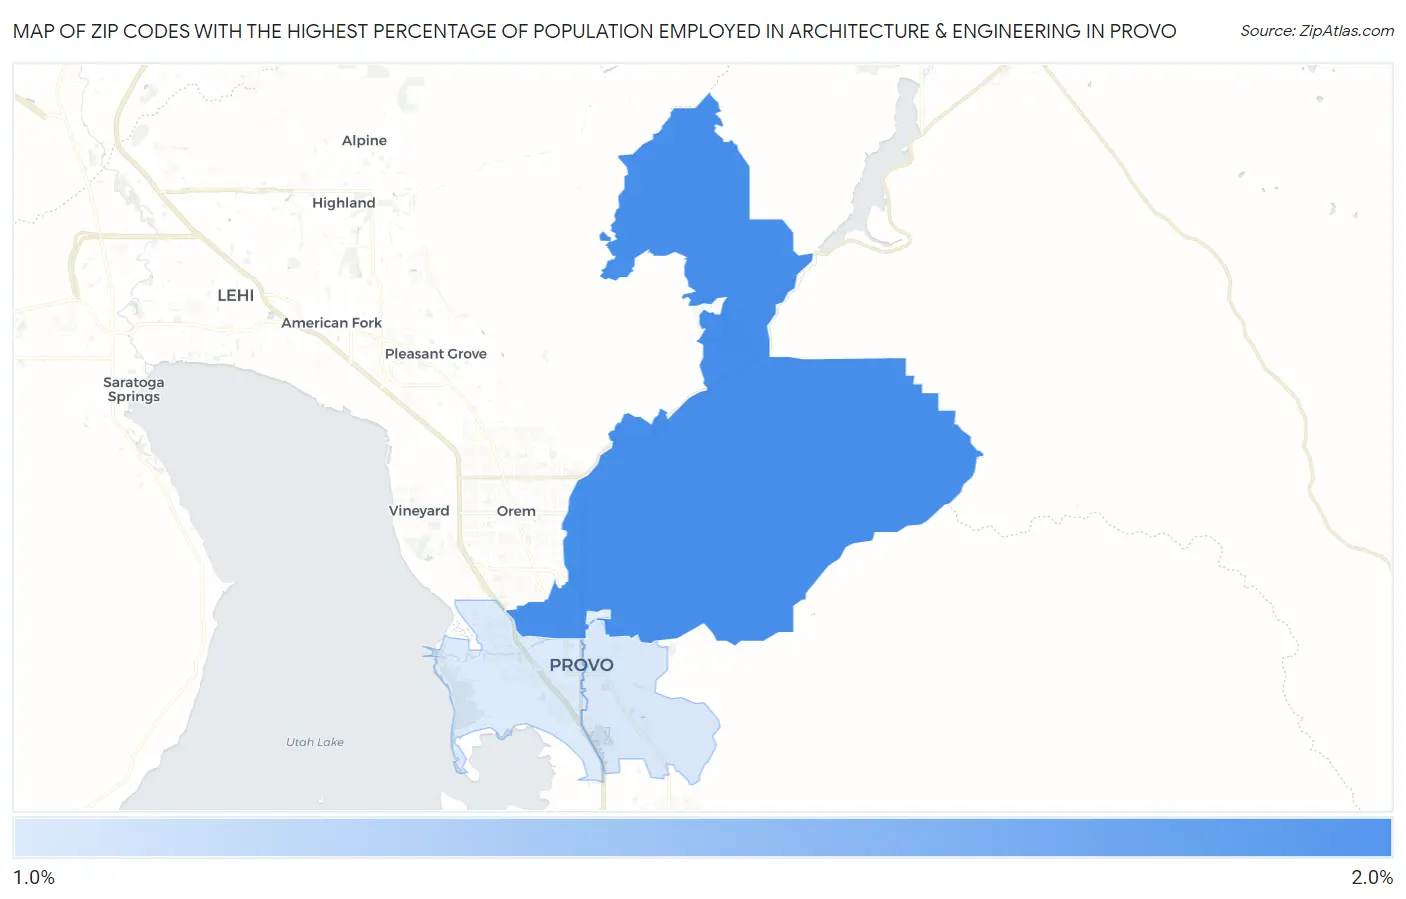
Map of Zip Codes with the Highest Percentage of Population Employed in Architecture & Engineering in Provo
0.0%
2.0%
Zip Codes with the Highest Percentage of Population Employed in Architecture & Engineering in Provo, UT
| Zip Code | % Employed | vs State | vs National | |
| 1. | 84604 | 1.7% | 2.2%(-0.451)#121 | 2.1%(-0.442)#11,433 |
| 2. | 84606 | 1.5% | 2.2%(-0.691)#139 | 2.1%(-0.682)#13,112 |
| 3. | 84601 | 1.5% | 2.2%(-0.698)#140 | 2.1%(-0.689)#13,154 |
1
Common Questions
What are the Top 3 Zip Codes with the Highest Percentage of Population Employed in Architecture & Engineering in Provo, UT?
Top 3 Zip Codes with the Highest Percentage of Population Employed in Architecture & Engineering in Provo, UT are:
What zip code has the Highest Percentage of Population Employed in Architecture & Engineering in Provo, UT?
84604 has the Highest Percentage of Population Employed in Architecture & Engineering in Provo, UT with 1.7%.
What is the Percentage of Population Employed in Architecture & Engineering in Provo, UT?
Percentage of Population Employed in Architecture & Engineering in Provo is 1.5%.
What is the Percentage of Population Employed in Architecture & Engineering in Utah?
Percentage of Population Employed in Architecture & Engineering in Utah is 2.2%.
What is the Percentage of Population Employed in Architecture & Engineering in the United States?
Percentage of Population Employed in Architecture & Engineering in the United States is 2.1%.