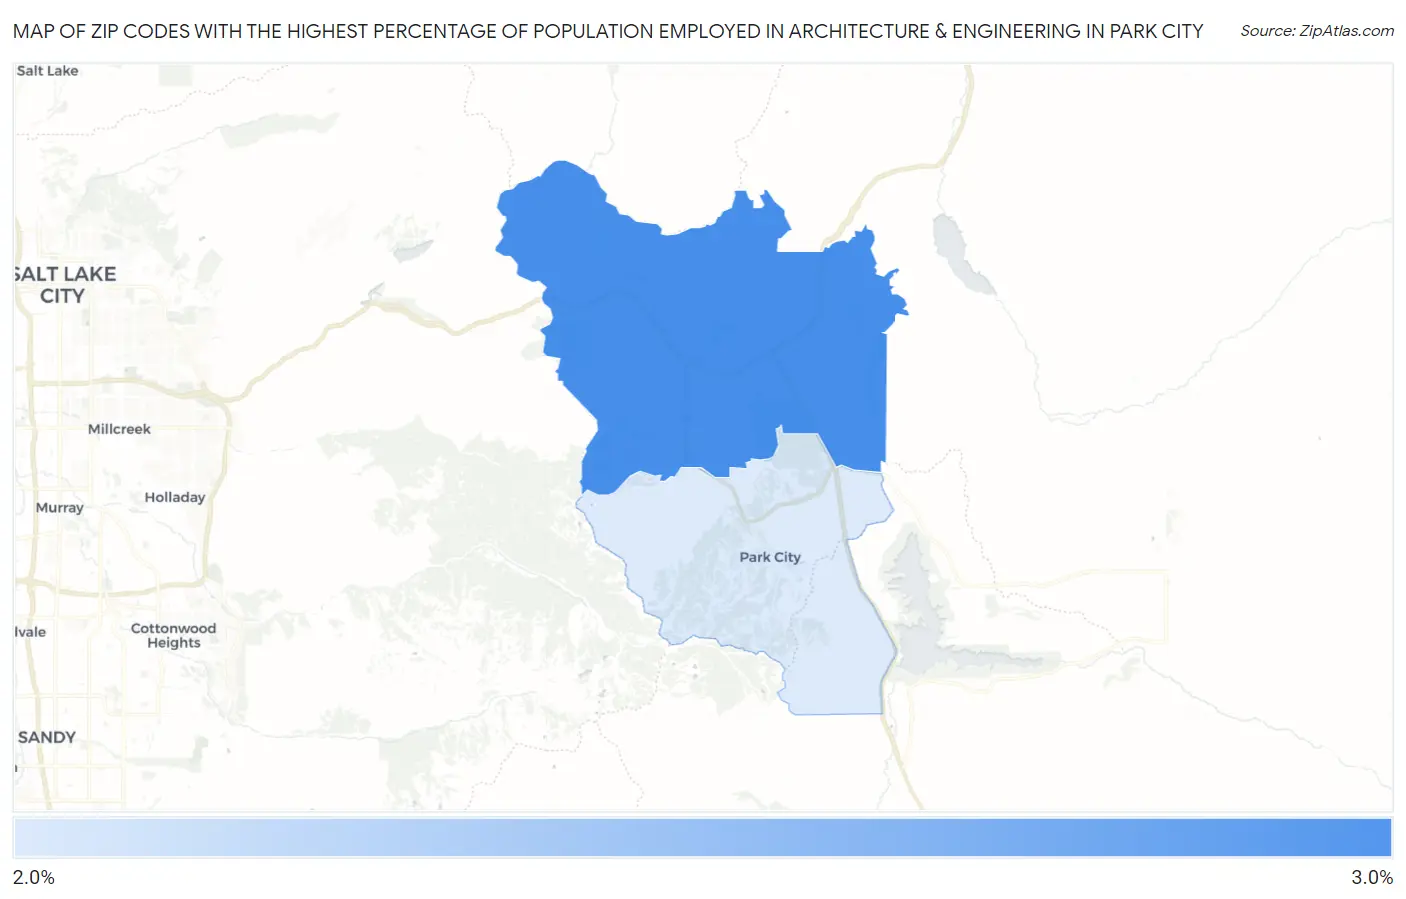
Zip Codes with the Highest Percentage of Population Employed in Architecture & Engineering in Park City, UT
RELATED REPORTS & OPTIONS
Architecture & Engineering
Park City
Compare Zip Codes
Map of Zip Codes with the Highest Percentage of Population Employed in Architecture & Engineering in Park City
0.0%
3.0%
Zip Codes with the Highest Percentage of Population Employed in Architecture & Engineering in Park City, UT
| Zip Code | % Employed | vs State | vs National | |
| 1. | 84098 | 2.5% | 2.2%(+0.347)#69 | 2.1%(+0.356)#6,972 |
| 2. | 84060 | 2.4% | 2.2%(+0.195)#85 | 2.1%(+0.204)#7,704 |
1
Common Questions
What are the Top Zip Codes with the Highest Percentage of Population Employed in Architecture & Engineering in Park City, UT?
Top Zip Codes with the Highest Percentage of Population Employed in Architecture & Engineering in Park City, UT are:
What zip code has the Highest Percentage of Population Employed in Architecture & Engineering in Park City, UT?
84098 has the Highest Percentage of Population Employed in Architecture & Engineering in Park City, UT with 2.5%.
What is the Percentage of Population Employed in Architecture & Engineering in Park City, UT?
Percentage of Population Employed in Architecture & Engineering in Park City is 2.4%.
What is the Percentage of Population Employed in Architecture & Engineering in Utah?
Percentage of Population Employed in Architecture & Engineering in Utah is 2.2%.
What is the Percentage of Population Employed in Architecture & Engineering in the United States?
Percentage of Population Employed in Architecture & Engineering in the United States is 2.1%.