Zip Codes with the Highest Percentage of Population Employed in Architecture & Engineering in West Jordan, UT
RELATED REPORTS & OPTIONS
Architecture & Engineering
West Jordan
Compare Zip Codes
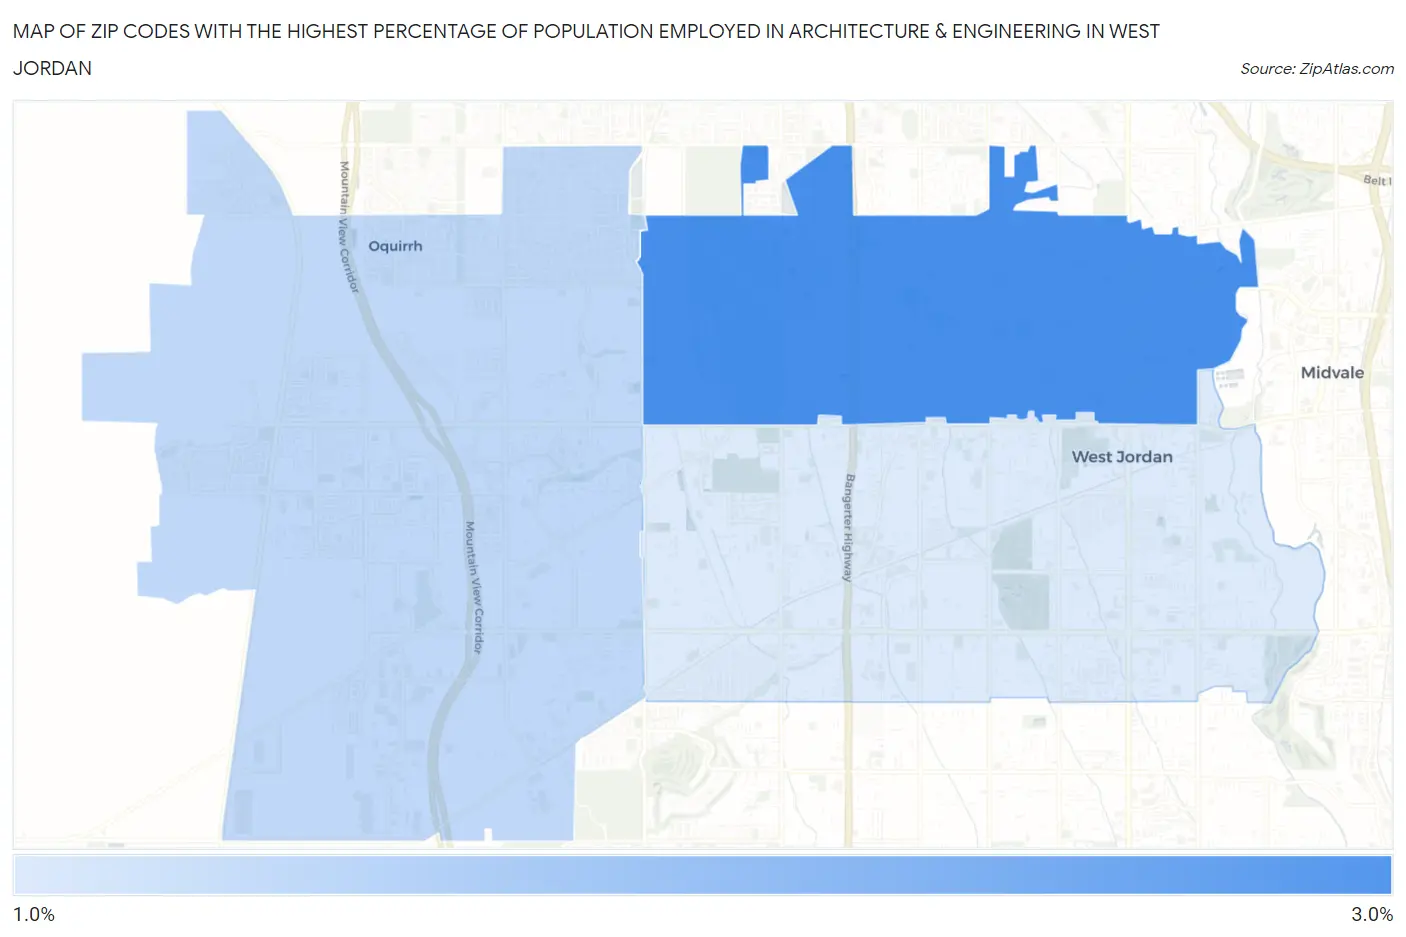
Map of Zip Codes with the Highest Percentage of Population Employed in Architecture & Engineering in West Jordan
0.0%
3.0%
Zip Codes with the Highest Percentage of Population Employed in Architecture & Engineering in West Jordan, UT
| Zip Code | % Employed | vs State | vs National | |
| 1. | 84084 | 2.6% | 2.2%(+0.448)#63 | 2.1%(+0.457)#6,555 |
| 2. | 84081 | 1.8% | 2.2%(-0.394)#117 | 2.1%(-0.385)#11,044 |
| 3. | 84088 | 1.6% | 2.2%(-0.600)#132 | 2.1%(-0.591)#12,448 |
1
Common Questions
What are the Top Zip Codes with the Highest Percentage of Population Employed in Architecture & Engineering in West Jordan, UT?
Top Zip Codes with the Highest Percentage of Population Employed in Architecture & Engineering in West Jordan, UT are:
What zip code has the Highest Percentage of Population Employed in Architecture & Engineering in West Jordan, UT?
84084 has the Highest Percentage of Population Employed in Architecture & Engineering in West Jordan, UT with 2.6%.
What is the Percentage of Population Employed in Architecture & Engineering in West Jordan, UT?
Percentage of Population Employed in Architecture & Engineering in West Jordan is 1.9%.
What is the Percentage of Population Employed in Architecture & Engineering in Utah?
Percentage of Population Employed in Architecture & Engineering in Utah is 2.2%.
What is the Percentage of Population Employed in Architecture & Engineering in the United States?
Percentage of Population Employed in Architecture & Engineering in the United States is 2.1%.