Zip Codes with the Highest Percentage of Population Employed in Agriculture, Fishing & Hunting in West Valley City, UT
RELATED REPORTS & OPTIONS
Agriculture, Fishing & Hunting
West Valley City
Compare Zip Codes
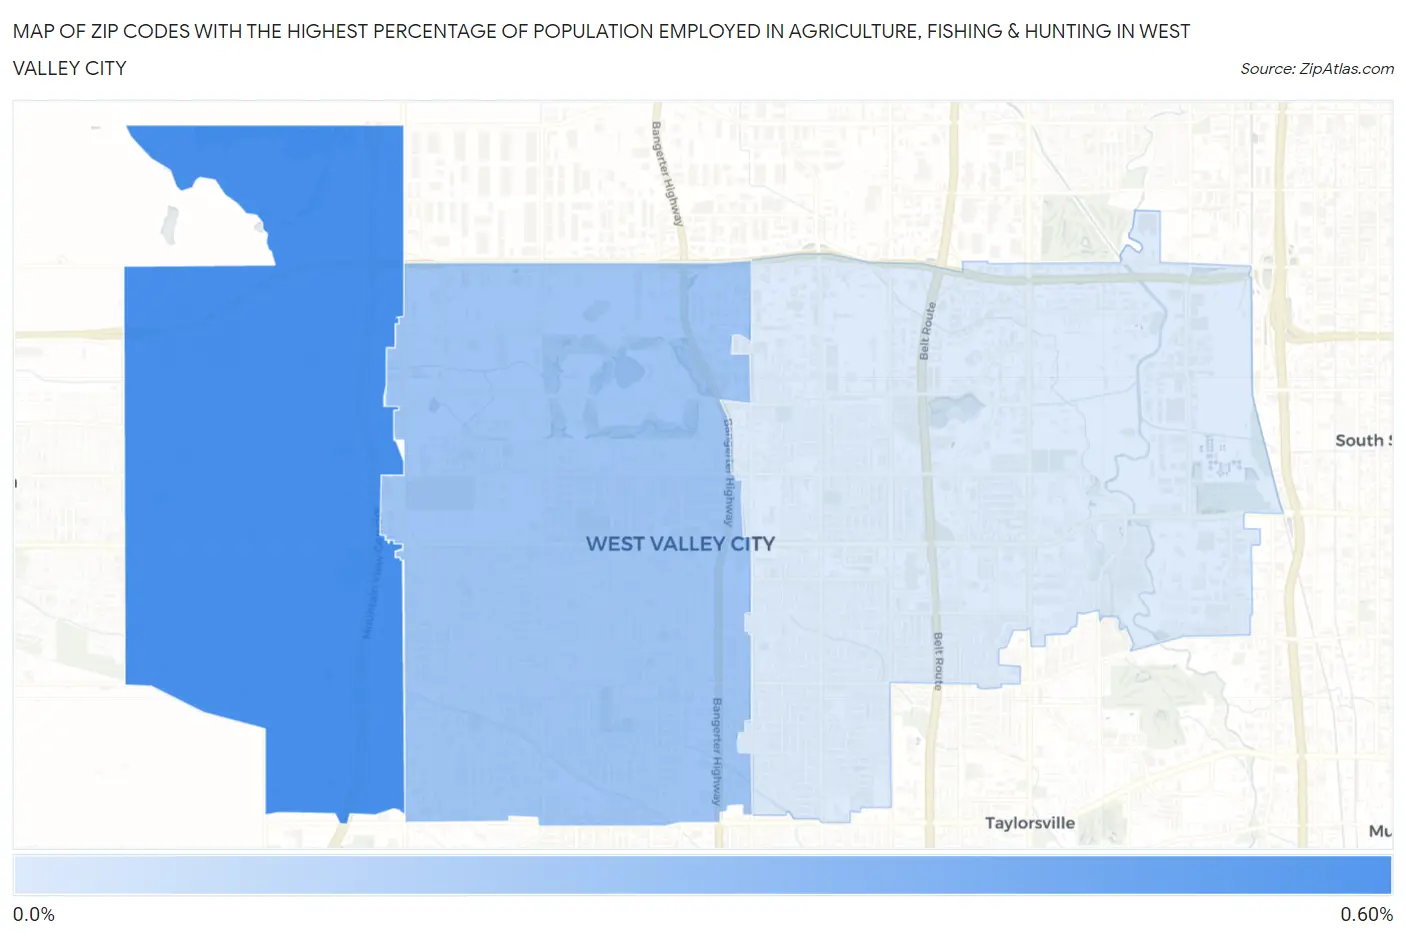
Map of Zip Codes with the Highest Percentage of Population Employed in Agriculture, Fishing & Hunting in West Valley City
0.0%
0.60%
Zip Codes with the Highest Percentage of Population Employed in Agriculture, Fishing & Hunting in West Valley City, UT
| Zip Code | % Employed | vs State | vs National | |
| 1. | 84128 | 0.50% | 0.72%(-0.221)#167 | 1.2%(-0.697)#19,265 |
| 2. | 84120 | 0.26% | 0.72%(-0.460)#197 | 1.2%(-0.936)#21,610 |
| 3. | 84119 | 0.089% | 0.72%(-0.634)#220 | 1.2%(-1.11)#23,840 |
1
Common Questions
What are the Top Zip Codes with the Highest Percentage of Population Employed in Agriculture, Fishing & Hunting in West Valley City, UT?
Top Zip Codes with the Highest Percentage of Population Employed in Agriculture, Fishing & Hunting in West Valley City, UT are:
What zip code has the Highest Percentage of Population Employed in Agriculture, Fishing & Hunting in West Valley City, UT?
84128 has the Highest Percentage of Population Employed in Agriculture, Fishing & Hunting in West Valley City, UT with 0.50%.
What is the Percentage of Population Employed in Agriculture, Fishing & Hunting in West Valley City, UT?
Percentage of Population Employed in Agriculture, Fishing & Hunting in West Valley City is 0.24%.
What is the Percentage of Population Employed in Agriculture, Fishing & Hunting in Utah?
Percentage of Population Employed in Agriculture, Fishing & Hunting in Utah is 0.72%.
What is the Percentage of Population Employed in Agriculture, Fishing & Hunting in the United States?
Percentage of Population Employed in Agriculture, Fishing & Hunting in the United States is 1.2%.