Zip Codes with the Most Immigrants from South Eastern Asia in Park City, UT
RELATED REPORTS & OPTIONS
South Eastern Asia
Park City
Compare Zip Codes
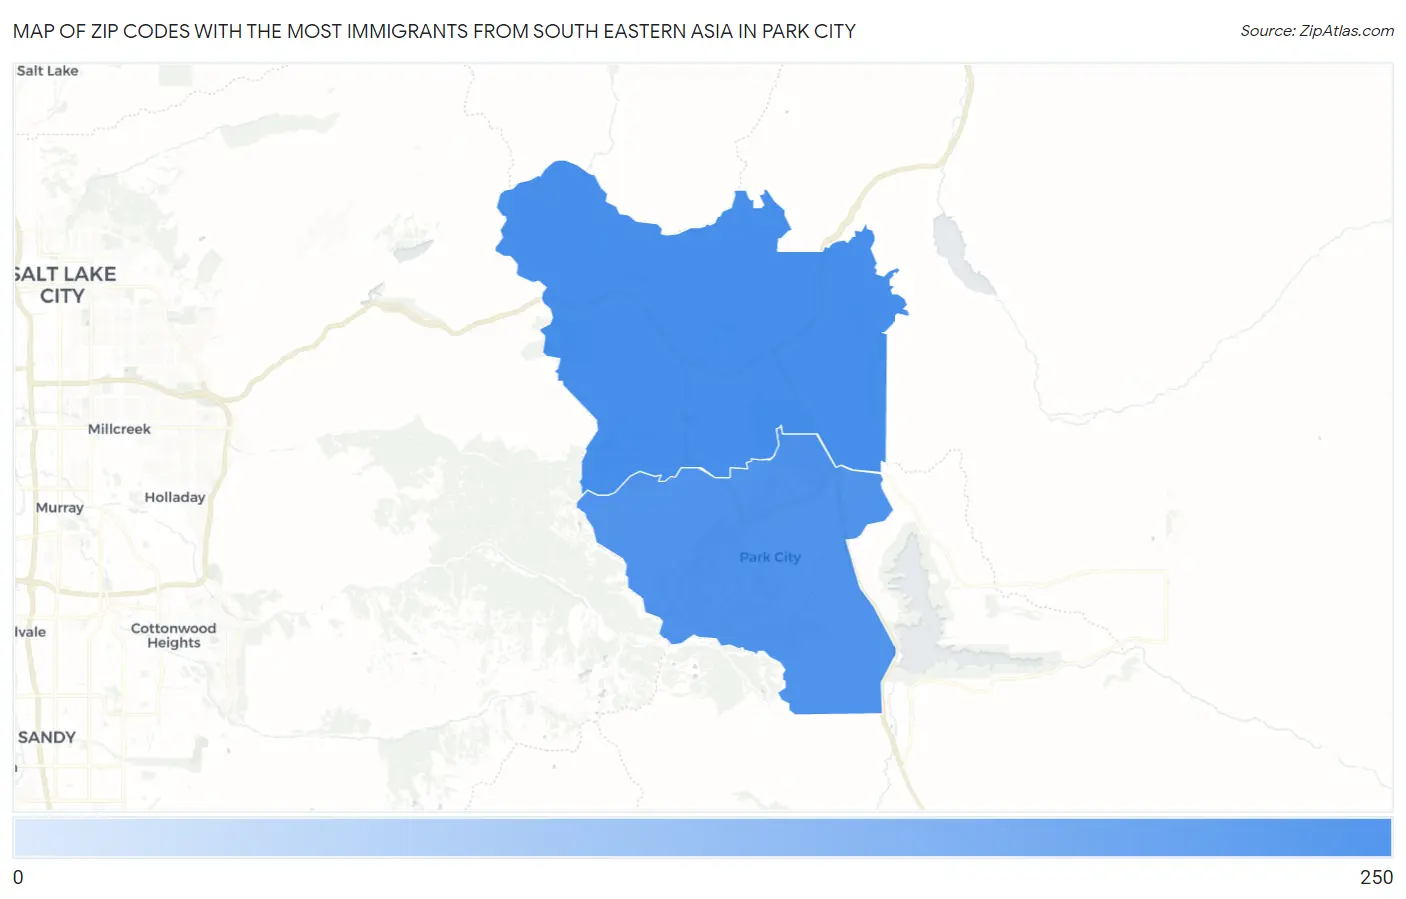
Map of Zip Codes with the Most Immigrants from South Eastern Asia in Park City
0
250
Zip Codes with the Most Immigrants from South Eastern Asia in Park City, UT
| Zip Code | South Eastern Asia | vs State | vs National | |
| 1. | 84098 | 237 | 20,802(1.14%)#30 | 4,292,058(0.01%)#3,563 |
| 2. | 84060 | 190 | 20,802(0.91%)#36 | 4,292,058(0.00%)#4,161 |
1
Common Questions
What are the Top Zip Codes with the Most Immigrants from South Eastern Asia in Park City, UT?
Top Zip Codes with the Most Immigrants from South Eastern Asia in Park City, UT are:
What zip code has the Most Immigrants from South Eastern Asia in Park City, UT?
84098 has the Most Immigrants from South Eastern Asia in Park City, UT with 237.
What is the Total Immigrants from South Eastern Asia in Park City, UT?
Total Immigrants from South Eastern Asia in Park City is 190.
What is the Total Immigrants from South Eastern Asia in Utah?
Total Immigrants from South Eastern Asia in Utah is 20,802.
What is the Total Immigrants from South Eastern Asia in the United States?
Total Immigrants from South Eastern Asia in the United States is 4,292,058.