Paraguayan vs Seminole Unemployment Among Women with Children Ages 6 to 17 years

COMPARE

Paraguayan
Race
Ancestry
AfghanAfricanAlaska NativeAlaskan AthabascanAlbanianAleutAlsatianAmericanApacheArabArapahoArgentineanArmenianAssyrian/Chaldean/SyriacAustralianAustrianBahamianBangladeshiBarbadianBasqueBelgianBelizeanBermudanBhutaneseBlackfeetBolivianBrazilianBritishBritish West IndianBulgarianBurmeseCajunCambodianCanadianCape VerdeanCarpatho RusynCelticCentral AmericanCentral American IndianCherokeeCheyenneChickasawChileanChineseChippewaChoctawColombianColvilleComancheCosta RicanCreeCreekCroatianCrowCubanCypriotCzechCzechoslovakianDanishDelawareDominicanDutchDutch West IndianEastern EuropeanEcuadorianEgyptianEnglishEstonianEthiopianEuropeanFijianFilipinoFinnishFrenchFrench American IndianFrench CanadianGermanGerman RussianGhanaianGreekGuamanian/ChamorroGuatemalanGuyaneseHaitianHmongHonduranHopiHoumaHungarianIcelanderIndian (Asian)IndonesianInupiatIranianIraqiIrishIroquoisIsraeliItalianJamaicanJapaneseJordanianKenyanKiowaKoreanLaotianLatvianLebaneseLiberianLithuanianLumbeeLuxembourgerMacedonianMalaysianMalteseMarshalleseMenomineeMexicanMexican American IndianMongolianMoroccanNative HawaiianNavajoNepaleseNew ZealanderNicaraguanNigerianNorthern EuropeanNorwegianOkinawanOsageOttawaPaiutePakistaniPalestinianPanamanianParaguayanPennsylvania GermanPeruvianPimaPolishPortuguesePotawatomiPuebloPuerto RicanPuget Sound SalishRomanianRussianSalvadoranSamoanScandinavianScotch-IrishScottishSenegaleseSerbianShoshoneSierra LeoneanSiouxSlavicSlovakSloveneSomaliSouth AfricanSouth AmericanSouth American IndianSoviet UnionSpaniardSpanishSpanish AmericanSpanish American IndianSri LankanSubsaharan AfricanSudaneseSwedishSwissSyrianTaiwaneseThaiTlingit-HaidaTohono O'OdhamTonganTrinidadian and TobagonianTsimshianTurkishU.S. Virgin IslanderUgandanUkrainianUruguayanUteVenezuelanVietnameseWelshWest IndianYakamaYaquiYugoslavianYumanYup'ikZimbabwean
Immigration
NonimmigrantsImmigrantsAfghanistanAfricaAlbaniaArgentinaArmeniaAsiaAustraliaAustriaBahamasBangladeshBarbadosBelarusBelgiumBelizeBoliviaBosnia and HerzegovinaBrazilBulgariaBurma/MyanmarCabo VerdeCambodiaCameroonCanadaCaribbeanCentral AmericaChileChinaColombiaCongoCosta RicaCroatiaCubaCzechoslovakiaDenmarkDominicaDominican RepublicEastern AfricaEastern AsiaEastern EuropeEcuadorEgyptEl SalvadorEnglandEritreaEthiopiaEuropeFijiFranceGermanyGhanaGreeceGrenadaGuatemalaGuyanaHaitiHondurasHong KongHungaryIndiaIndonesiaIranIraqIrelandIsraelItalyJamaicaJapanJordanKazakhstanKenyaKoreaKuwaitLaosLatin AmericaLatviaLebanonLiberiaLithuaniaMalaysiaMexicoMicronesiaMiddle AfricaMoldovaMoroccoNepalNetherlandsNicaraguaNigeriaNorth AmericaNorth MacedoniaNorthern AfricaNorthern EuropeNorwayOceaniaPakistanPanamaPeruPhilippinesPolandPortugalRomaniaRussiaSaudi ArabiaScotlandSenegalSerbiaSierra LeoneSingaporeSomaliaSouth AfricaSouth AmericaSouth Central AsiaSouth Eastern AsiaSouthern EuropeSpainSri LankaSt. Vincent and the GrenadinesSudanSwedenSwitzerlandSyriaTaiwanThailandTrinidad and TobagoTurkeyUgandaUkraineUruguayUzbekistanVenezuelaVietnamWest IndiesWestern AfricaWestern AsiaWestern EuropeYemenZaireZimbabweAzores
Seminole
Race
Ancestry
AfghanAfricanAlaska NativeAlaskan AthabascanAlbanianAleutAlsatianAmericanApacheArabArapahoArgentineanArmenianAssyrian/Chaldean/SyriacAustralianAustrianBahamianBangladeshiBarbadianBasqueBelgianBelizeanBermudanBhutaneseBlackfeetBolivianBrazilianBritishBritish West IndianBulgarianBurmeseCajunCambodianCanadianCape VerdeanCarpatho RusynCelticCentral AmericanCentral American IndianCherokeeCheyenneChickasawChileanChineseChippewaChoctawColombianColvilleComancheCosta RicanCreeCreekCroatianCrowCubanCypriotCzechCzechoslovakianDanishDelawareDominicanDutchDutch West IndianEastern EuropeanEcuadorianEgyptianEnglishEstonianEthiopianEuropeanFijianFilipinoFinnishFrenchFrench American IndianFrench CanadianGermanGerman RussianGhanaianGreekGuamanian/ChamorroGuatemalanGuyaneseHaitianHmongHonduranHopiHoumaHungarianIcelanderIndian (Asian)IndonesianInupiatIranianIraqiIrishIroquoisIsraeliItalianJamaicanJapaneseJordanianKenyanKiowaKoreanLaotianLatvianLebaneseLiberianLithuanianLumbeeLuxembourgerMacedonianMalaysianMalteseMarshalleseMenomineeMexicanMexican American IndianMongolianMoroccanNative HawaiianNavajoNepaleseNew ZealanderNicaraguanNigerianNorthern EuropeanNorwegianOkinawanOsageOttawaPaiutePakistaniPalestinianPanamanianPennsylvania GermanPeruvianPimaPolishPortuguesePotawatomiPuebloPuerto RicanPuget Sound SalishRomanianRussianSalvadoranSamoanScandinavianScotch-IrishScottishSeminoleSenegaleseSerbianShoshoneSierra LeoneanSiouxSlavicSlovakSloveneSomaliSouth AfricanSouth AmericanSouth American IndianSoviet UnionSpaniardSpanishSpanish AmericanSpanish American IndianSri LankanSubsaharan AfricanSudaneseSwedishSwissSyrianTaiwaneseThaiTlingit-HaidaTohono O'OdhamTonganTrinidadian and TobagonianTsimshianTurkishU.S. Virgin IslanderUgandanUkrainianUruguayanUteVenezuelanVietnameseWelshWest IndianYakamaYaquiYugoslavianYumanYup'ikZimbabwean
Immigration
NonimmigrantsImmigrantsAfghanistanAfricaAlbaniaArgentinaArmeniaAsiaAustraliaAustriaBahamasBangladeshBarbadosBelarusBelgiumBelizeBoliviaBosnia and HerzegovinaBrazilBulgariaBurma/MyanmarCabo VerdeCambodiaCameroonCanadaCaribbeanCentral AmericaChileChinaColombiaCongoCosta RicaCroatiaCubaCzechoslovakiaDenmarkDominicaDominican RepublicEastern AfricaEastern AsiaEastern EuropeEcuadorEgyptEl SalvadorEnglandEritreaEthiopiaEuropeFijiFranceGermanyGhanaGreeceGrenadaGuatemalaGuyanaHaitiHondurasHong KongHungaryIndiaIndonesiaIranIraqIrelandIsraelItalyJamaicaJapanJordanKazakhstanKenyaKoreaKuwaitLaosLatin AmericaLatviaLebanonLiberiaLithuaniaMalaysiaMexicoMicronesiaMiddle AfricaMoldovaMoroccoNepalNetherlandsNicaraguaNigeriaNorth AmericaNorth MacedoniaNorthern AfricaNorthern EuropeNorwayOceaniaPakistanPanamaPeruPhilippinesPolandPortugalRomaniaRussiaSaudi ArabiaScotlandSenegalSerbiaSierra LeoneSingaporeSomaliaSouth AfricaSouth AmericaSouth Central AsiaSouth Eastern AsiaSouthern EuropeSpainSri LankaSt. Vincent and the GrenadinesSudanSwedenSwitzerlandSyriaTaiwanThailandTrinidad and TobagoTurkeyUgandaUkraineUruguayUzbekistanVenezuelaVietnamWest IndiesWestern AfricaWestern AsiaWestern EuropeYemenZaireZimbabweAzores
Unemployment Among Women with Children Ages 6 to 17 years
Income
Poverty
Unemployment
Labor Participation
Family Structure
Vehicle Availability
Education Level
Disability

Unemployment Among Women with Children Ages 6 to 17 years Comparison

Paraguayans

Seminole

Tragic
Tragic
10.2%
UNEMPLOYMENT AMONG WOMEN WITH CHILDREN AGES 6 TO 17 YEARS
0.0/ 100
METRIC RATING
306th/ 347
METRIC RANK
9.7%
UNEMPLOYMENT AMONG WOMEN WITH CHILDREN AGES 6 TO 17 YEARS
0.1/ 100
METRIC RATING
280th/ 347
METRIC RANK

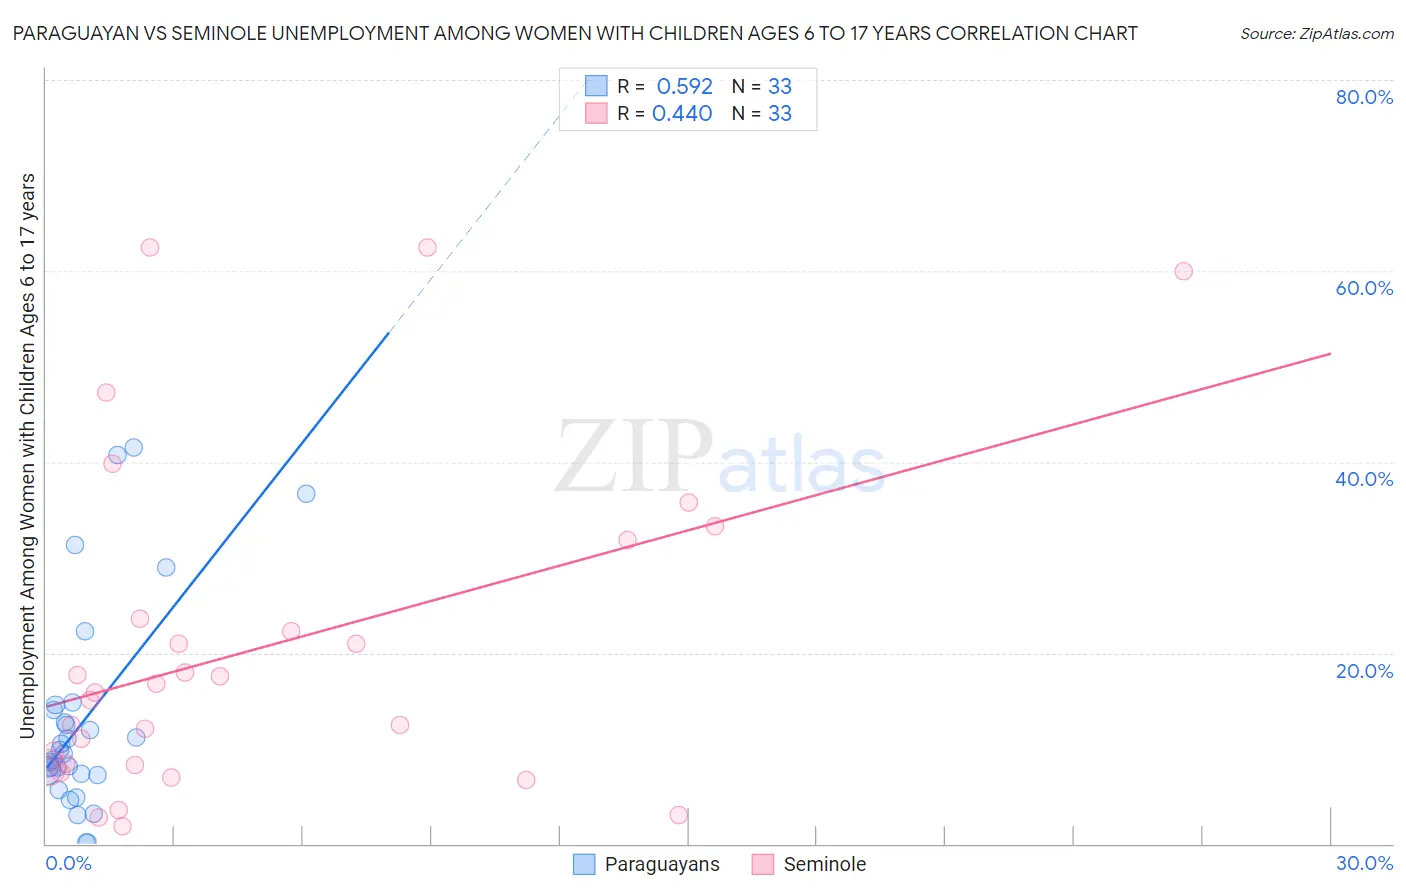
Paraguayan vs Seminole Unemployment Among Women with Children Ages 6 to 17 years Correlation Chart

The statistical analysis conducted on geographies consisting of 81,717,447 people shows a substantial positive correlation between the proportion of Paraguayans and unemployment rate among women with children between the ages 6 and 17 in the United States with a correlation coefficient (R) of 0.592 and weighted average of 10.2%. Similarly, the statistical analysis conducted on geographies consisting of 102,585,790 people shows a moderate positive correlation between the proportion of Seminole and unemployment rate among women with children between the ages 6 and 17 in the United States with a correlation coefficient (R) of 0.440 and weighted average of 9.7%, a difference of 5.2%.
Paraguayan vs Seminole Unemployment Among Women with Children Ages 6 to 17 years

Unemployment Among Women with Children Ages 6 to 17 years Correlation Summary

MeasurementParaguayanSeminole
Minimum0.10%1.8%
Maximum41.5%62.5%
Range41.4%60.7%
Mean12.9%20.5%
Median9.4%15.9%
Interquartile 25% (IQ1)7.2%8.2%
Interquartile 75% (IQ3)14.3%27.7%
Interquartile Range (IQR)7.0%19.5%
Standard Deviation (Sample)10.9%17.2%
Standard Deviation (Population)10.7%16.9%

Similar Demographics by Unemployment Among Women with Children Ages 6 to 17 years

Demographics Similar to Paraguayans by Unemployment Among Women with Children Ages 6 to 17 years

In terms of unemployment among women with children ages 6 to 17 years, the demographic groups most similar to Paraguayans are Immigrants from Senegal (10.2%, a difference of 0.23%), Dutch West Indian (10.2%, a difference of 0.24%), Immigrants from Nigeria (10.2%, a difference of 0.29%), Immigrants from Venezuela (10.2%, a difference of 0.35%), and Immigrants from Ecuador (10.2%, a difference of 0.44%).
DemographicsRating | RankUnemployment Among Women with Children Ages 6 to 17 years
Immigrants | Honduras
0.0
/100
|
#299
Tragic
10.1%
Nigerians
0.0
/100
|
#300
Tragic
10.1%
Immigrants | Bahamas
0.0
/100
|
#301
Tragic
10.1%
Venezuelans
0.0
/100
|
#302
Tragic
10.2%
Immigrants | Ecuador
0.0
/100
|
#303
Tragic
10.2%
Immigrants | Venezuela
0.0
/100
|
#304
Tragic
10.2%
Immigrants | Nigeria
0.0
/100
|
#305
Tragic
10.2%
Paraguayans
0.0
/100
|
#306
Tragic
10.2%
Immigrants | Senegal
0.0
/100
|
#307
Tragic
10.2%
Dutch West Indians
0.0
/100
|
#308
Tragic
10.2%
French Canadians
0.0
/100
|
#309
Tragic
10.3%
Alaska Natives
0.0
/100
|
#310
Tragic
10.3%
Immigrants | Liberia
0.0
/100
|
#311
Tragic
10.3%
Africans
0.0
/100
|
#312
Tragic
10.4%
Americans
0.0
/100
|
#313
Tragic
10.4%

Demographics Similar to Seminole by Unemployment Among Women with Children Ages 6 to 17 years

In terms of unemployment among women with children ages 6 to 17 years, the demographic groups most similar to Seminole are Scotch-Irish (9.7%, a difference of 0.19%), French (9.7%, a difference of 0.22%), British West Indian (9.7%, a difference of 0.29%), Immigrants from Portugal (9.7%, a difference of 0.35%), and U.S. Virgin Islander (9.7%, a difference of 0.36%).
DemographicsRating | RankUnemployment Among Women with Children Ages 6 to 17 years
Whites/Caucasians
0.1
/100
|
#273
Tragic
9.6%
Aleuts
0.1
/100
|
#274
Tragic
9.6%
U.S. Virgin Islanders
0.1
/100
|
#275
Tragic
9.7%
Immigrants | Portugal
0.1
/100
|
#276
Tragic
9.7%
British West Indians
0.1
/100
|
#277
Tragic
9.7%
French
0.1
/100
|
#278
Tragic
9.7%
Scotch-Irish
0.1
/100
|
#279
Tragic
9.7%
Seminole
0.1
/100
|
#280
Tragic
9.7%
Jamaicans
0.0
/100
|
#281
Tragic
9.8%
Slovaks
0.0
/100
|
#282
Tragic
9.8%
Central American Indians
0.0
/100
|
#283
Tragic
9.9%
Yakama
0.0
/100
|
#284
Tragic
9.9%
Hispanics or Latinos
0.0
/100
|
#285
Tragic
9.9%
Choctaw
0.0
/100
|
#286
Tragic
9.9%
Sierra Leoneans
0.0
/100
|
#287
Tragic
9.9%