Immigrants from Somalia vs Immigrants from El Salvador Unemployment Among Women with Children Ages 6 to 17 years
COMPARE
Immigrants from Somalia
Immigrants from El Salvador
Unemployment Among Women with Children Ages 6 to 17 years
Unemployment Among Women with Children Ages 6 to 17 years Comparison
Immigrants from Somalia
Immigrants from El Salvador
8.0%
UNEMPLOYMENT AMONG WOMEN WITH CHILDREN AGES 6 TO 17 YEARS
100.0/ 100
METRIC RATING
42nd/ 347
METRIC RANK
9.3%
UNEMPLOYMENT AMONG WOMEN WITH CHILDREN AGES 6 TO 17 YEARS
5.3/ 100
METRIC RATING
224th/ 347
METRIC RANK
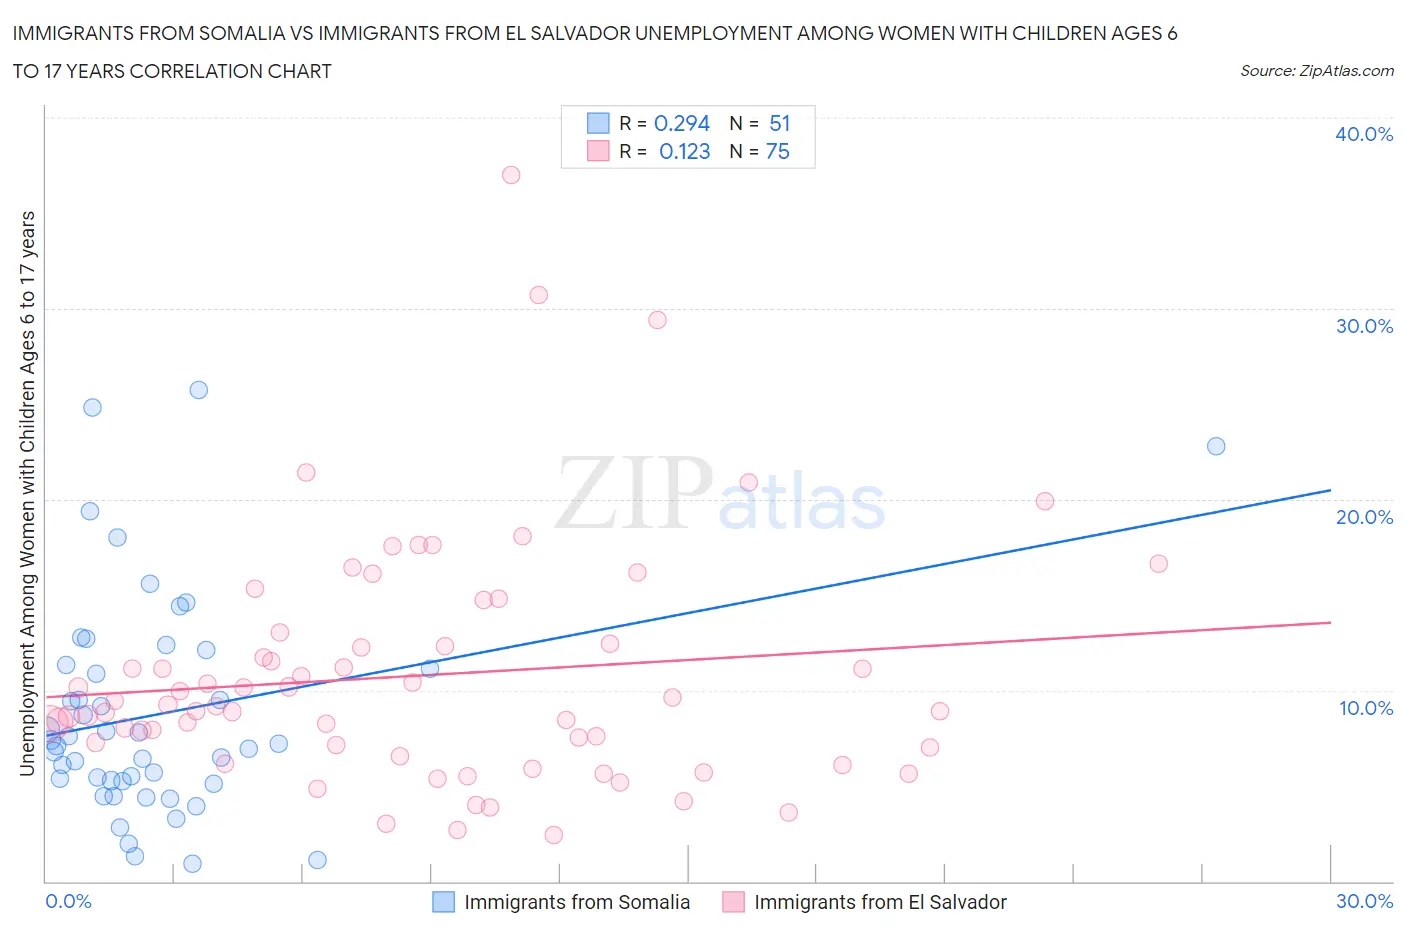
Immigrants from Somalia vs Immigrants from El Salvador Unemployment Among Women with Children Ages 6 to 17 years Correlation Chart
The statistical analysis conducted on geographies consisting of 81,291,755 people shows a weak positive correlation between the proportion of Immigrants from Somalia and unemployment rate among women with children between the ages 6 and 17 in the United States with a correlation coefficient (R) of 0.294 and weighted average of 8.0%. Similarly, the statistical analysis conducted on geographies consisting of 271,257,789 people shows a poor positive correlation between the proportion of Immigrants from El Salvador and unemployment rate among women with children between the ages 6 and 17 in the United States with a correlation coefficient (R) of 0.123 and weighted average of 9.3%, a difference of 15.0%.
Unemployment Among Women with Children Ages 6 to 17 years Correlation Summary
| Measurement | Immigrants from Somalia | Immigrants from El Salvador |
| Minimum | 0.90% | 2.4% |
| Maximum | 25.7% | 37.0% |
| Range | 24.8% | 34.6% |
| Mean | 8.8% | 10.8% |
| Median | 7.2% | 9.2% |
| Interquartile 25% (IQ1) | 5.2% | 7.0% |
| Interquartile 75% (IQ3) | 11.3% | 12.4% |
| Interquartile Range (IQR) | 6.1% | 5.4% |
| Standard Deviation (Sample) | 5.7% | 6.3% |
| Standard Deviation (Population) | 5.7% | 6.3% |
Similar Demographics by Unemployment Among Women with Children Ages 6 to 17 years
Demographics Similar to Immigrants from Somalia by Unemployment Among Women with Children Ages 6 to 17 years
In terms of unemployment among women with children ages 6 to 17 years, the demographic groups most similar to Immigrants from Somalia are Bhutanese (8.1%, a difference of 0.14%), Immigrants from Sweden (8.1%, a difference of 0.18%), Immigrants from Bulgaria (8.1%, a difference of 0.22%), Icelander (8.1%, a difference of 0.24%), and Iranian (8.0%, a difference of 0.27%).
| Demographics | Rating | Rank | Unemployment Among Women with Children Ages 6 to 17 years |
| Immigrants | South Central Asia | 100.0 /100 | #35 | Exceptional 7.9% |
| Burmese | 100.0 /100 | #36 | Exceptional 8.0% |
| Asians | 100.0 /100 | #37 | Exceptional 8.0% |
| Alsatians | 100.0 /100 | #38 | Exceptional 8.0% |
| Somalis | 100.0 /100 | #39 | Exceptional 8.0% |
| Immigrants | Zimbabwe | 100.0 /100 | #40 | Exceptional 8.0% |
| Iranians | 100.0 /100 | #41 | Exceptional 8.0% |
| Immigrants | Somalia | 100.0 /100 | #42 | Exceptional 8.0% |
| Bhutanese | 100.0 /100 | #43 | Exceptional 8.1% |
| Immigrants | Sweden | 100.0 /100 | #44 | Exceptional 8.1% |
| Immigrants | Bulgaria | 100.0 /100 | #45 | Exceptional 8.1% |
| Icelanders | 100.0 /100 | #46 | Exceptional 8.1% |
| Immigrants | Switzerland | 100.0 /100 | #47 | Exceptional 8.1% |
| Immigrants | Asia | 100.0 /100 | #48 | Exceptional 8.1% |
| Immigrants | Oceania | 100.0 /100 | #49 | Exceptional 8.1% |
Demographics Similar to Immigrants from El Salvador by Unemployment Among Women with Children Ages 6 to 17 years
In terms of unemployment among women with children ages 6 to 17 years, the demographic groups most similar to Immigrants from El Salvador are Chinese (9.3%, a difference of 0.010%), Immigrants from Eritrea (9.2%, a difference of 0.10%), Immigrants from Southern Europe (9.2%, a difference of 0.11%), Crow (9.2%, a difference of 0.12%), and Immigrants from the Azores (9.3%, a difference of 0.15%).
| Demographics | Rating | Rank | Unemployment Among Women with Children Ages 6 to 17 years |
| Germans | 7.2 /100 | #217 | Tragic 9.2% |
| Syrians | 6.9 /100 | #218 | Tragic 9.2% |
| Immigrants | Scotland | 6.6 /100 | #219 | Tragic 9.2% |
| Belgians | 6.4 /100 | #220 | Tragic 9.2% |
| Crow | 5.8 /100 | #221 | Tragic 9.2% |
| Immigrants | Southern Europe | 5.8 /100 | #222 | Tragic 9.2% |
| Immigrants | Eritrea | 5.8 /100 | #223 | Tragic 9.2% |
| Immigrants | El Salvador | 5.3 /100 | #224 | Tragic 9.3% |
| Chinese | 5.2 /100 | #225 | Tragic 9.3% |
| Immigrants | Azores | 4.6 /100 | #226 | Tragic 9.3% |
| Panamanians | 4.5 /100 | #227 | Tragic 9.3% |
| Estonians | 4.4 /100 | #228 | Tragic 9.3% |
| Lumbee | 4.3 /100 | #229 | Tragic 9.3% |
| Welsh | 4.0 /100 | #230 | Tragic 9.3% |
| Macedonians | 3.9 /100 | #231 | Tragic 9.3% |