Immigrants from France vs Immigrants from Nepal Unemployment Among Women with Children Ages 6 to 17 years
COMPARE
Immigrants from France
Immigrants from Nepal
Unemployment Among Women with Children Ages 6 to 17 years
Unemployment Among Women with Children Ages 6 to 17 years Comparison
Immigrants from France
Immigrants from Nepal
8.6%
UNEMPLOYMENT AMONG WOMEN WITH CHILDREN AGES 6 TO 17 YEARS
98.0/ 100
METRIC RATING
104th/ 347
METRIC RANK
8.3%
UNEMPLOYMENT AMONG WOMEN WITH CHILDREN AGES 6 TO 17 YEARS
99.8/ 100
METRIC RATING
72nd/ 347
METRIC RANK
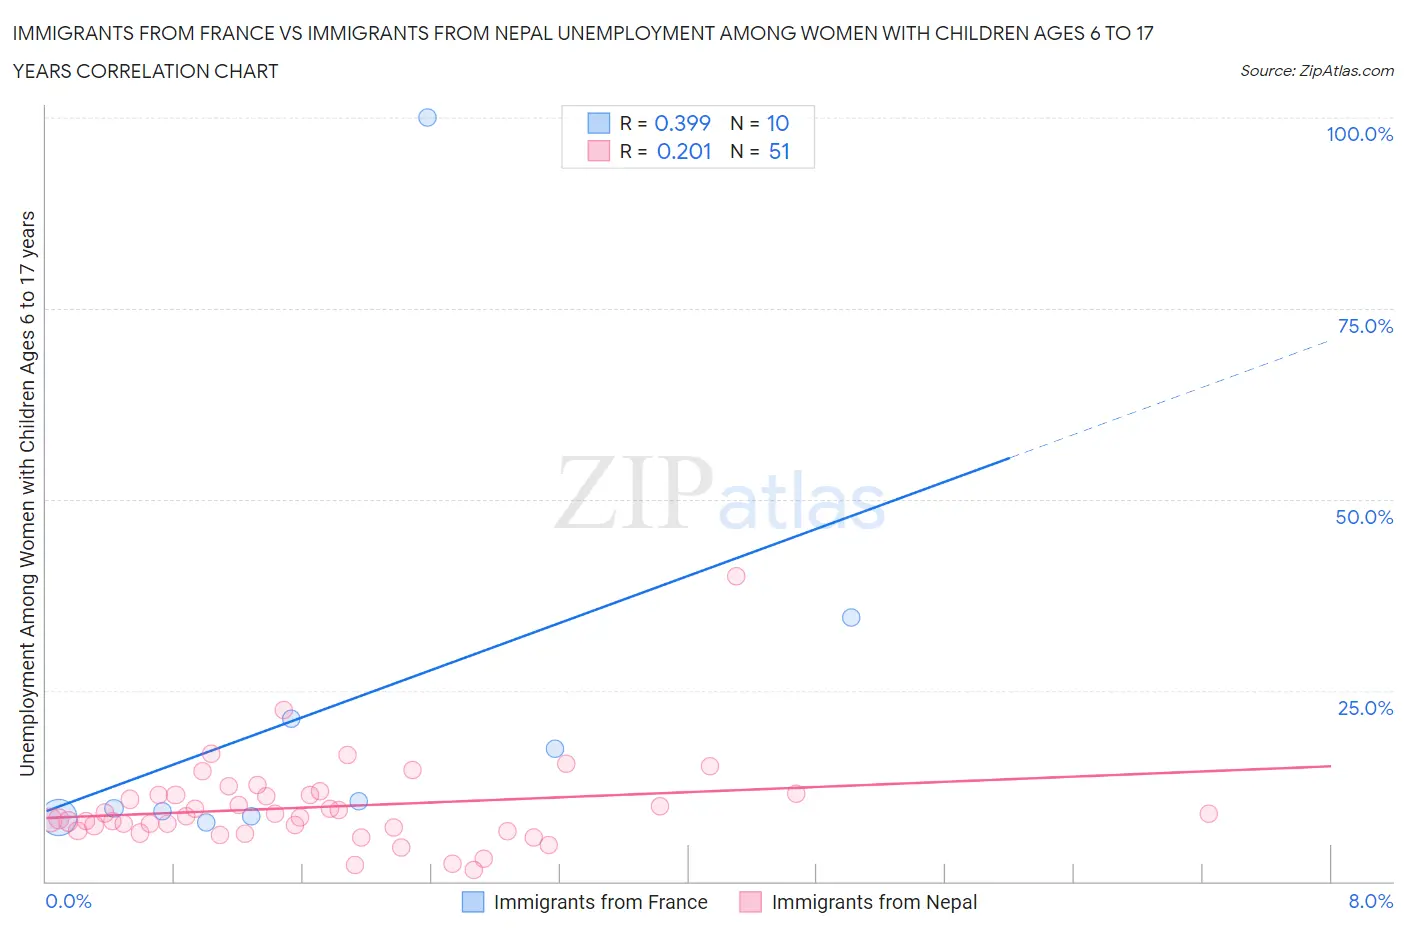
Immigrants from France vs Immigrants from Nepal Unemployment Among Women with Children Ages 6 to 17 years Correlation Chart
The statistical analysis conducted on geographies consisting of 216,894,654 people shows a mild positive correlation between the proportion of Immigrants from France and unemployment rate among women with children between the ages 6 and 17 in the United States with a correlation coefficient (R) of 0.399 and weighted average of 8.6%. Similarly, the statistical analysis conducted on geographies consisting of 151,183,417 people shows a weak positive correlation between the proportion of Immigrants from Nepal and unemployment rate among women with children between the ages 6 and 17 in the United States with a correlation coefficient (R) of 0.201 and weighted average of 8.3%, a difference of 3.0%.
Unemployment Among Women with Children Ages 6 to 17 years Correlation Summary
| Measurement | Immigrants from France | Immigrants from Nepal |
| Minimum | 7.8% | 1.4% |
| Maximum | 100.0% | 40.0% |
| Range | 92.2% | 38.6% |
| Mean | 22.7% | 9.7% |
| Median | 10.0% | 8.5% |
| Interquartile 25% (IQ1) | 8.6% | 6.6% |
| Interquartile 75% (IQ3) | 21.3% | 11.3% |
| Interquartile Range (IQR) | 12.7% | 4.7% |
| Standard Deviation (Sample) | 28.5% | 5.9% |
| Standard Deviation (Population) | 27.0% | 5.8% |
Similar Demographics by Unemployment Among Women with Children Ages 6 to 17 years
Demographics Similar to Immigrants from France by Unemployment Among Women with Children Ages 6 to 17 years
In terms of unemployment among women with children ages 6 to 17 years, the demographic groups most similar to Immigrants from France are Immigrants from Norway (8.6%, a difference of 0.15%), Scandinavian (8.6%, a difference of 0.18%), Immigrants from South Africa (8.6%, a difference of 0.19%), Immigrants from Serbia (8.6%, a difference of 0.19%), and Immigrants from Lithuania (8.6%, a difference of 0.22%).
| Demographics | Rating | Rank | Unemployment Among Women with Children Ages 6 to 17 years |
| Bolivians | 98.5 /100 | #97 | Exceptional 8.5% |
| Malaysians | 98.5 /100 | #98 | Exceptional 8.6% |
| Immigrants | Lithuania | 98.4 /100 | #99 | Exceptional 8.6% |
| New Zealanders | 98.4 /100 | #100 | Exceptional 8.6% |
| Immigrants | Pakistan | 98.4 /100 | #101 | Exceptional 8.6% |
| Immigrants | South Africa | 98.3 /100 | #102 | Exceptional 8.6% |
| Scandinavians | 98.3 /100 | #103 | Exceptional 8.6% |
| Immigrants | France | 98.0 /100 | #104 | Exceptional 8.6% |
| Immigrants | Norway | 97.8 /100 | #105 | Exceptional 8.6% |
| Immigrants | Serbia | 97.7 /100 | #106 | Exceptional 8.6% |
| Chickasaw | 97.6 /100 | #107 | Exceptional 8.6% |
| Swedes | 97.6 /100 | #108 | Exceptional 8.6% |
| Immigrants | Romania | 97.5 /100 | #109 | Exceptional 8.6% |
| Latvians | 97.4 /100 | #110 | Exceptional 8.6% |
| Immigrants | Ukraine | 97.4 /100 | #111 | Exceptional 8.6% |
Demographics Similar to Immigrants from Nepal by Unemployment Among Women with Children Ages 6 to 17 years
In terms of unemployment among women with children ages 6 to 17 years, the demographic groups most similar to Immigrants from Nepal are Immigrants from Australia (8.3%, a difference of 0.040%), Norwegian (8.3%, a difference of 0.10%), Immigrants from Thailand (8.3%, a difference of 0.18%), Marshallese (8.3%, a difference of 0.21%), and Armenian (8.3%, a difference of 0.29%).
| Demographics | Rating | Rank | Unemployment Among Women with Children Ages 6 to 17 years |
| Immigrants | Albania | 99.9 /100 | #65 | Exceptional 8.3% |
| Luxembourgers | 99.9 /100 | #66 | Exceptional 8.3% |
| Armenians | 99.9 /100 | #67 | Exceptional 8.3% |
| Marshallese | 99.9 /100 | #68 | Exceptional 8.3% |
| Immigrants | Thailand | 99.9 /100 | #69 | Exceptional 8.3% |
| Norwegians | 99.9 /100 | #70 | Exceptional 8.3% |
| Immigrants | Australia | 99.8 /100 | #71 | Exceptional 8.3% |
| Immigrants | Nepal | 99.8 /100 | #72 | Exceptional 8.3% |
| Spanish Americans | 99.8 /100 | #73 | Exceptional 8.4% |
| Samoans | 99.7 /100 | #74 | Exceptional 8.4% |
| Immigrants | Sri Lanka | 99.7 /100 | #75 | Exceptional 8.4% |
| Immigrants | Moldova | 99.7 /100 | #76 | Exceptional 8.4% |
| Iraqis | 99.7 /100 | #77 | Exceptional 8.4% |
| Pakistanis | 99.6 /100 | #78 | Exceptional 8.4% |
| Mongolians | 99.6 /100 | #79 | Exceptional 8.4% |