Aleut vs Dutch West Indian Unemployment Among Women with Children Ages 6 to 17 years

COMPARE

Aleut
Race
Ancestry
AfghanAfricanAlaska NativeAlaskan AthabascanAlbanianAleutAlsatianAmericanApacheArabArapahoArgentineanArmenianAssyrian/Chaldean/SyriacAustralianAustrianBahamianBangladeshiBarbadianBasqueBelgianBelizeanBermudanBhutaneseBlackfeetBolivianBrazilianBritishBritish West IndianBulgarianBurmeseCajunCambodianCanadianCape VerdeanCarpatho RusynCelticCentral AmericanCentral American IndianCherokeeCheyenneChickasawChileanChineseChippewaChoctawColombianColvilleComancheCosta RicanCreeCreekCroatianCrowCubanCypriotCzechCzechoslovakianDanishDelawareDominicanDutchEastern EuropeanEcuadorianEgyptianEnglishEstonianEthiopianEuropeanFijianFilipinoFinnishFrenchFrench American IndianFrench CanadianGermanGerman RussianGhanaianGreekGuamanian/ChamorroGuatemalanGuyaneseHaitianHmongHonduranHopiHoumaHungarianIcelanderIndian (Asian)IndonesianInupiatIranianIraqiIrishIroquoisIsraeliItalianJamaicanJapaneseJordanianKenyanKiowaKoreanLaotianLatvianLebaneseLiberianLithuanianLumbeeLuxembourgerMacedonianMalaysianMalteseMarshalleseMenomineeMexicanMexican American IndianMongolianMoroccanNative HawaiianNavajoNepaleseNew ZealanderNicaraguanNigerianNorthern EuropeanNorwegianOkinawanOsageOttawaPaiutePakistaniPalestinianPanamanianParaguayanPennsylvania GermanPeruvianPimaPolishPortuguesePotawatomiPuebloPuerto RicanPuget Sound SalishRomanianRussianSalvadoranSamoanScandinavianScotch-IrishScottishSeminoleSenegaleseSerbianShoshoneSierra LeoneanSiouxSlavicSlovakSloveneSomaliSouth AfricanSouth AmericanSouth American IndianSoviet UnionSpaniardSpanishSpanish AmericanSpanish American IndianSri LankanSubsaharan AfricanSudaneseSwedishSwissSyrianTaiwaneseThaiTlingit-HaidaTohono O'OdhamTonganTrinidadian and TobagonianTsimshianTurkishU.S. Virgin IslanderUgandanUkrainianUruguayanUteVenezuelanVietnameseWelshWest IndianYakamaYaquiYugoslavianYumanYup'ikZimbabwean
Immigration
NonimmigrantsImmigrantsAfghanistanAfricaAlbaniaArgentinaArmeniaAsiaAustraliaAustriaBahamasBangladeshBarbadosBelarusBelgiumBelizeBoliviaBosnia and HerzegovinaBrazilBulgariaBurma/MyanmarCabo VerdeCambodiaCameroonCanadaCaribbeanCentral AmericaChileChinaColombiaCongoCosta RicaCroatiaCubaCzechoslovakiaDenmarkDominicaDominican RepublicEastern AfricaEastern AsiaEastern EuropeEcuadorEgyptEl SalvadorEnglandEritreaEthiopiaEuropeFijiFranceGermanyGhanaGreeceGrenadaGuatemalaGuyanaHaitiHondurasHong KongHungaryIndiaIndonesiaIranIraqIrelandIsraelItalyJamaicaJapanJordanKazakhstanKenyaKoreaKuwaitLaosLatin AmericaLatviaLebanonLiberiaLithuaniaMalaysiaMexicoMicronesiaMiddle AfricaMoldovaMoroccoNepalNetherlandsNicaraguaNigeriaNorth AmericaNorth MacedoniaNorthern AfricaNorthern EuropeNorwayOceaniaPakistanPanamaPeruPhilippinesPolandPortugalRomaniaRussiaSaudi ArabiaScotlandSenegalSerbiaSierra LeoneSingaporeSomaliaSouth AfricaSouth AmericaSouth Central AsiaSouth Eastern AsiaSouthern EuropeSpainSri LankaSt. Vincent and the GrenadinesSudanSwedenSwitzerlandSyriaTaiwanThailandTrinidad and TobagoTurkeyUgandaUkraineUruguayUzbekistanVenezuelaVietnamWest IndiesWestern AfricaWestern AsiaWestern EuropeYemenZaireZimbabweAzores
Dutch West Indian
Race
Ancestry
AfghanAfricanAlaska NativeAlaskan AthabascanAlbanianAlsatianAmericanApacheArabArapahoArgentineanArmenianAssyrian/Chaldean/SyriacAustralianAustrianBahamianBangladeshiBarbadianBasqueBelgianBelizeanBermudanBhutaneseBlackfeetBolivianBrazilianBritishBritish West IndianBulgarianBurmeseCajunCambodianCanadianCape VerdeanCarpatho RusynCelticCentral AmericanCentral American IndianCherokeeCheyenneChickasawChileanChineseChippewaChoctawColombianColvilleComancheCosta RicanCreeCreekCroatianCrowCubanCypriotCzechCzechoslovakianDanishDelawareDominicanDutchDutch West IndianEastern EuropeanEcuadorianEgyptianEnglishEstonianEthiopianEuropeanFijianFilipinoFinnishFrenchFrench American IndianFrench CanadianGermanGerman RussianGhanaianGreekGuamanian/ChamorroGuatemalanGuyaneseHaitianHmongHonduranHopiHoumaHungarianIcelanderIndian (Asian)IndonesianInupiatIranianIraqiIrishIroquoisIsraeliItalianJamaicanJapaneseJordanianKenyanKiowaKoreanLaotianLatvianLebaneseLiberianLithuanianLumbeeLuxembourgerMacedonianMalaysianMalteseMarshalleseMenomineeMexicanMexican American IndianMongolianMoroccanNative HawaiianNavajoNepaleseNew ZealanderNicaraguanNigerianNorthern EuropeanNorwegianOkinawanOsageOttawaPaiutePakistaniPalestinianPanamanianParaguayanPennsylvania GermanPeruvianPimaPolishPortuguesePotawatomiPuebloPuerto RicanPuget Sound SalishRomanianRussianSalvadoranSamoanScandinavianScotch-IrishScottishSeminoleSenegaleseSerbianShoshoneSierra LeoneanSiouxSlavicSlovakSloveneSomaliSouth AfricanSouth AmericanSouth American IndianSoviet UnionSpaniardSpanishSpanish AmericanSpanish American IndianSri LankanSubsaharan AfricanSudaneseSwedishSwissSyrianTaiwaneseThaiTlingit-HaidaTohono O'OdhamTonganTrinidadian and TobagonianTsimshianTurkishU.S. Virgin IslanderUgandanUkrainianUruguayanUteVenezuelanVietnameseWelshWest IndianYakamaYaquiYugoslavianYumanYup'ikZimbabwean
Immigration
NonimmigrantsImmigrantsAfghanistanAfricaAlbaniaArgentinaArmeniaAsiaAustraliaAustriaBahamasBangladeshBarbadosBelarusBelgiumBelizeBoliviaBosnia and HerzegovinaBrazilBulgariaBurma/MyanmarCabo VerdeCambodiaCameroonCanadaCaribbeanCentral AmericaChileChinaColombiaCongoCosta RicaCroatiaCubaCzechoslovakiaDenmarkDominicaDominican RepublicEastern AfricaEastern AsiaEastern EuropeEcuadorEgyptEl SalvadorEnglandEritreaEthiopiaEuropeFijiFranceGermanyGhanaGreeceGrenadaGuatemalaGuyanaHaitiHondurasHong KongHungaryIndiaIndonesiaIranIraqIrelandIsraelItalyJamaicaJapanJordanKazakhstanKenyaKoreaKuwaitLaosLatin AmericaLatviaLebanonLiberiaLithuaniaMalaysiaMexicoMicronesiaMiddle AfricaMoldovaMoroccoNepalNetherlandsNicaraguaNigeriaNorth AmericaNorth MacedoniaNorthern AfricaNorthern EuropeNorwayOceaniaPakistanPanamaPeruPhilippinesPolandPortugalRomaniaRussiaSaudi ArabiaScotlandSenegalSerbiaSierra LeoneSingaporeSomaliaSouth AfricaSouth AmericaSouth Central AsiaSouth Eastern AsiaSouthern EuropeSpainSri LankaSt. Vincent and the GrenadinesSudanSwedenSwitzerlandSyriaTaiwanThailandTrinidad and TobagoTurkeyUgandaUkraineUruguayUzbekistanVenezuelaVietnamWest IndiesWestern AfricaWestern AsiaWestern EuropeYemenZaireZimbabweAzores
Unemployment Among Women with Children Ages 6 to 17 years
Income
Poverty
Unemployment
Labor Participation
Family Structure
Vehicle Availability
Education Level
Disability

Unemployment Among Women with Children Ages 6 to 17 years Comparison

Aleuts

Dutch West Indians

Tragic
Tragic
9.6%
UNEMPLOYMENT AMONG WOMEN WITH CHILDREN AGES 6 TO 17 YEARS
0.1/ 100
METRIC RATING
274th/ 347
METRIC RANK
10.2%
UNEMPLOYMENT AMONG WOMEN WITH CHILDREN AGES 6 TO 17 YEARS
0.0/ 100
METRIC RATING
308th/ 347
METRIC RANK

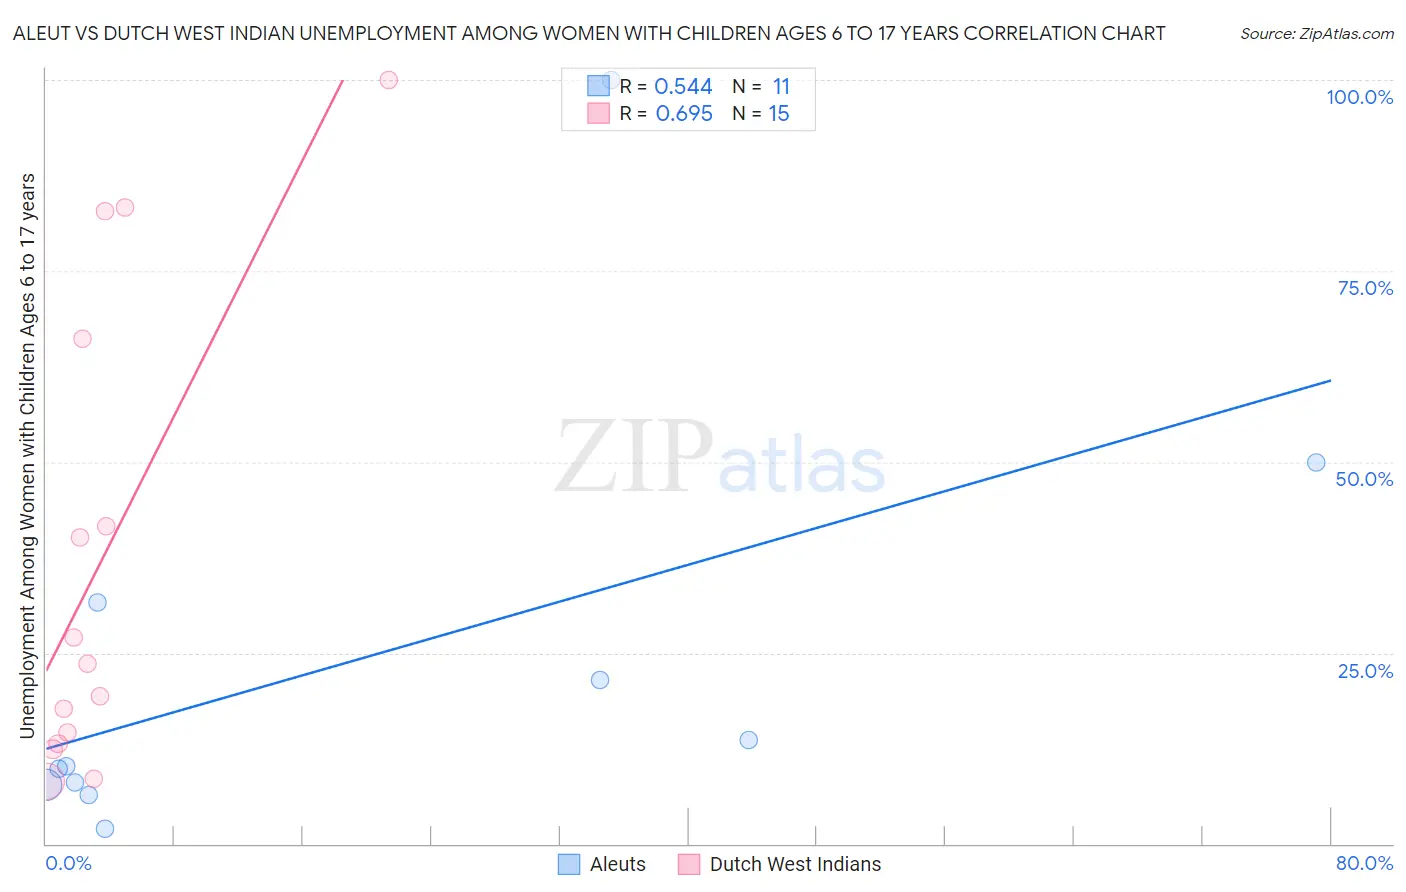
Aleut vs Dutch West Indian Unemployment Among Women with Children Ages 6 to 17 years Correlation Chart

The statistical analysis conducted on geographies consisting of 54,998,269 people shows a substantial positive correlation between the proportion of Aleuts and unemployment rate among women with children between the ages 6 and 17 in the United States with a correlation coefficient (R) of 0.544 and weighted average of 9.6%. Similarly, the statistical analysis conducted on geographies consisting of 73,777,912 people shows a significant positive correlation between the proportion of Dutch West Indians and unemployment rate among women with children between the ages 6 and 17 in the United States with a correlation coefficient (R) of 0.695 and weighted average of 10.2%, a difference of 6.3%.
Aleut vs Dutch West Indian Unemployment Among Women with Children Ages 6 to 17 years

Unemployment Among Women with Children Ages 6 to 17 years Correlation Summary

MeasurementAleutDutch West Indian
Minimum1.9%8.2%
Maximum100.0%100.0%
Range98.1%91.8%
Mean23.7%37.2%
Median10.1%23.6%
Interquartile 25% (IQ1)7.7%13.0%
Interquartile 75% (IQ3)31.6%66.1%
Interquartile Range (IQR)23.9%53.1%
Standard Deviation (Sample)28.9%30.9%
Standard Deviation (Population)27.5%29.9%

Similar Demographics by Unemployment Among Women with Children Ages 6 to 17 years

Demographics Similar to Aleuts by Unemployment Among Women with Children Ages 6 to 17 years

In terms of unemployment among women with children ages 6 to 17 years, the demographic groups most similar to Aleuts are White/Caucasian (9.6%, a difference of 0.050%), Kiowa (9.6%, a difference of 0.060%), Immigrants from Latin America (9.6%, a difference of 0.12%), U.S. Virgin Islander (9.7%, a difference of 0.44%), and Immigrants from Portugal (9.7%, a difference of 0.44%).
DemographicsRating | RankUnemployment Among Women with Children Ages 6 to 17 years
Irish
0.3
/100
|
#267
Tragic
9.5%
Ghanaians
0.2
/100
|
#268
Tragic
9.6%
Blackfeet
0.2
/100
|
#269
Tragic
9.6%
Immigrants | Nicaragua
0.2
/100
|
#270
Tragic
9.6%
Immigrants | Latin America
0.1
/100
|
#271
Tragic
9.6%
Kiowa
0.1
/100
|
#272
Tragic
9.6%
Whites/Caucasians
0.1
/100
|
#273
Tragic
9.6%
Aleuts
0.1
/100
|
#274
Tragic
9.6%
U.S. Virgin Islanders
0.1
/100
|
#275
Tragic
9.7%
Immigrants | Portugal
0.1
/100
|
#276
Tragic
9.7%
British West Indians
0.1
/100
|
#277
Tragic
9.7%
French
0.1
/100
|
#278
Tragic
9.7%
Scotch-Irish
0.1
/100
|
#279
Tragic
9.7%
Seminole
0.1
/100
|
#280
Tragic
9.7%
Jamaicans
0.0
/100
|
#281
Tragic
9.8%

Demographics Similar to Dutch West Indians by Unemployment Among Women with Children Ages 6 to 17 years

In terms of unemployment among women with children ages 6 to 17 years, the demographic groups most similar to Dutch West Indians are Immigrants from Senegal (10.2%, a difference of 0.010%), Paraguayan (10.2%, a difference of 0.24%), Immigrants from Nigeria (10.2%, a difference of 0.53%), French Canadian (10.3%, a difference of 0.54%), and Immigrants from Venezuela (10.2%, a difference of 0.59%).
DemographicsRating | RankUnemployment Among Women with Children Ages 6 to 17 years
Immigrants | Bahamas
0.0
/100
|
#301
Tragic
10.1%
Venezuelans
0.0
/100
|
#302
Tragic
10.2%
Immigrants | Ecuador
0.0
/100
|
#303
Tragic
10.2%
Immigrants | Venezuela
0.0
/100
|
#304
Tragic
10.2%
Immigrants | Nigeria
0.0
/100
|
#305
Tragic
10.2%
Paraguayans
0.0
/100
|
#306
Tragic
10.2%
Immigrants | Senegal
0.0
/100
|
#307
Tragic
10.2%
Dutch West Indians
0.0
/100
|
#308
Tragic
10.2%
French Canadians
0.0
/100
|
#309
Tragic
10.3%
Alaska Natives
0.0
/100
|
#310
Tragic
10.3%
Immigrants | Liberia
0.0
/100
|
#311
Tragic
10.3%
Africans
0.0
/100
|
#312
Tragic
10.4%
Americans
0.0
/100
|
#313
Tragic
10.4%
Immigrants | Cabo Verde
0.0
/100
|
#314
Tragic
10.4%
Bahamians
0.0
/100
|
#315
Tragic
10.4%