Zip Codes with the Highest Percentage of Population Employed in Agriculture, Fishing & Hunting in Cordova, TN
RELATED REPORTS & OPTIONS
Agriculture, Fishing & Hunting
Cordova
Compare Zip Codes
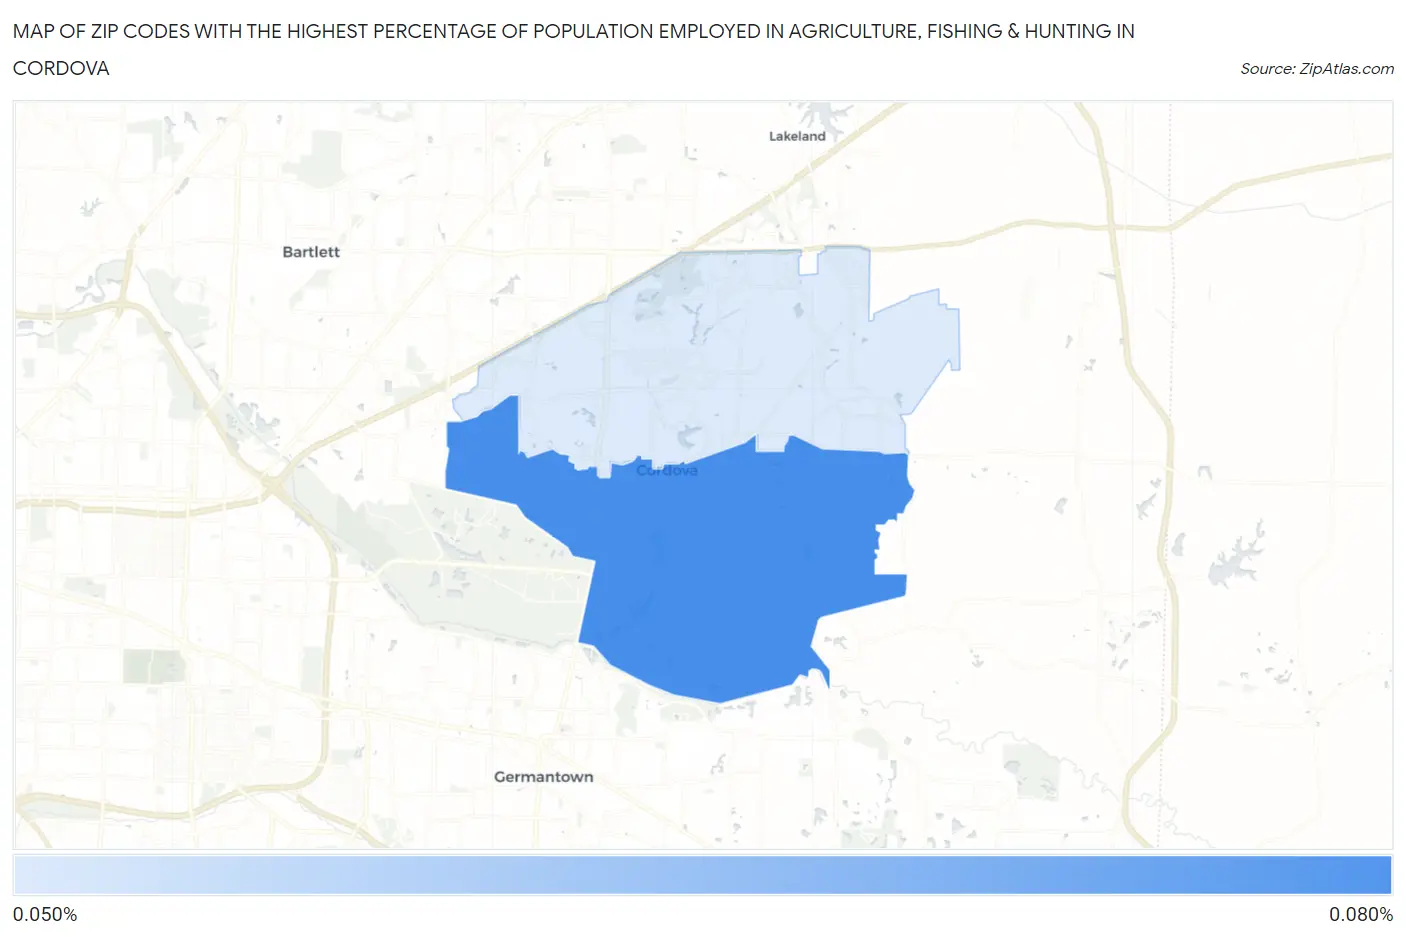
Map of Zip Codes with the Highest Percentage of Population Employed in Agriculture, Fishing & Hunting in Cordova
0.0%
0.080%
Zip Codes with the Highest Percentage of Population Employed in Agriculture, Fishing & Hunting in Cordova, TN
| Zip Code | % Employed | vs State | vs National | |
| 1. | 38018 | 0.076% | 0.74%(-0.661)#455 | 1.2%(-1.12)#24,017 |
| 2. | 38016 | 0.053% | 0.74%(-0.684)#461 | 1.2%(-1.15)#24,312 |
1
Common Questions
What are the Top Zip Codes with the Highest Percentage of Population Employed in Agriculture, Fishing & Hunting in Cordova, TN?
Top Zip Codes with the Highest Percentage of Population Employed in Agriculture, Fishing & Hunting in Cordova, TN are:
What zip code has the Highest Percentage of Population Employed in Agriculture, Fishing & Hunting in Cordova, TN?
38018 has the Highest Percentage of Population Employed in Agriculture, Fishing & Hunting in Cordova, TN with 0.076%.
What is the Percentage of Population Employed in Agriculture, Fishing & Hunting in Tennessee?
Percentage of Population Employed in Agriculture, Fishing & Hunting in Tennessee is 0.74%.
What is the Percentage of Population Employed in Agriculture, Fishing & Hunting in the United States?
Percentage of Population Employed in Agriculture, Fishing & Hunting in the United States is 1.2%.