Zip Codes with the Highest Percentage of Population Employed in Computer, Engineering & Science in Cordova, TN
RELATED REPORTS & OPTIONS
Computer, Engineering & Science
Cordova
Compare Zip Codes
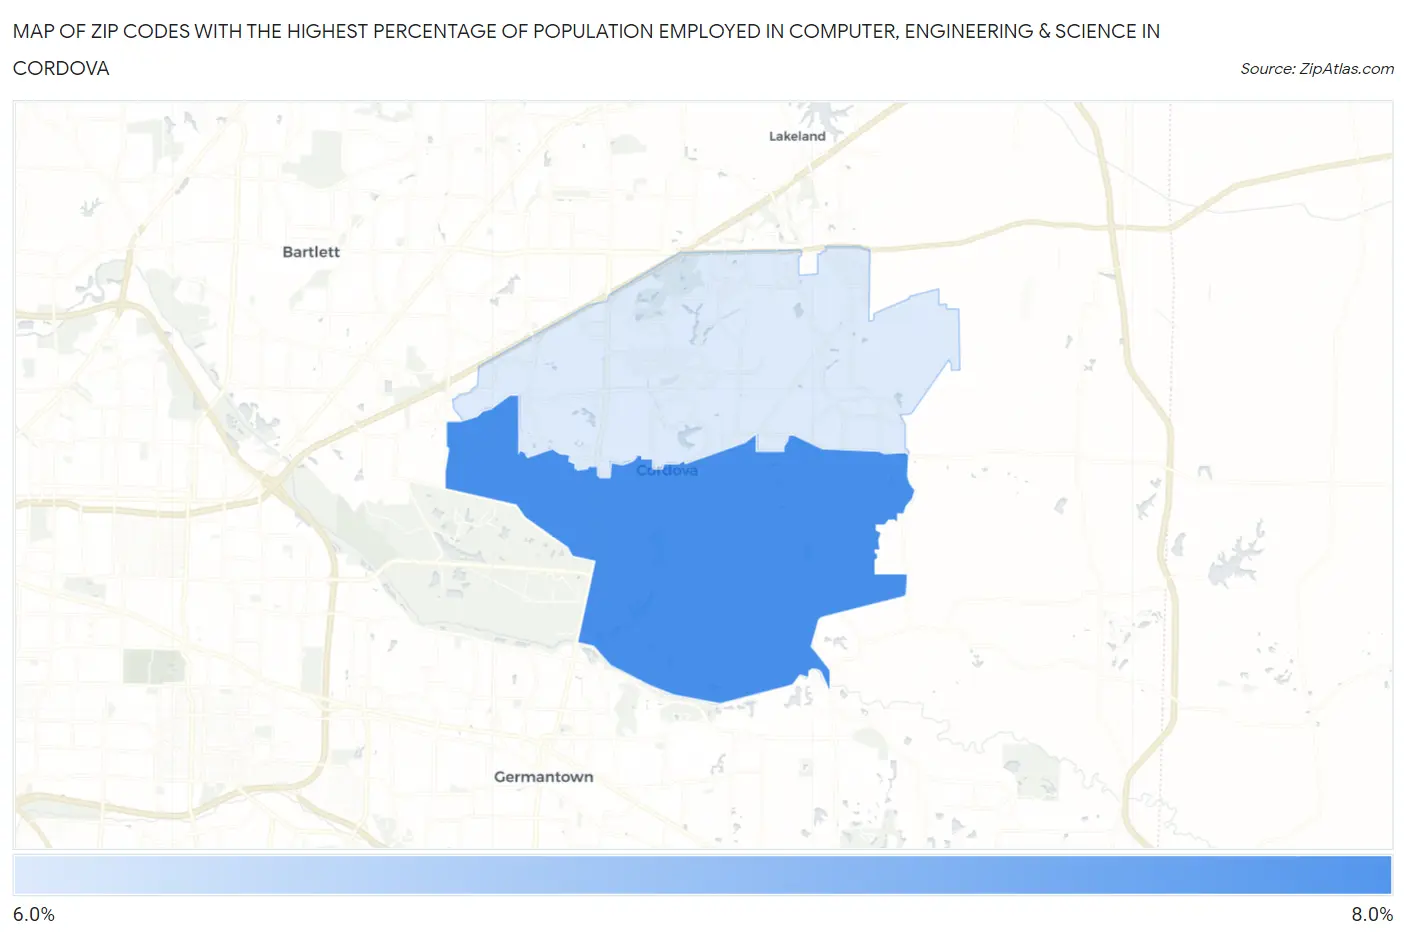
Map of Zip Codes with the Highest Percentage of Population Employed in Computer, Engineering & Science in Cordova
0.0%
8.0%
Zip Codes with the Highest Percentage of Population Employed in Computer, Engineering & Science in Cordova, TN
| Zip Code | % Employed | vs State | vs National | |
| 1. | 38018 | 7.3% | 5.1%(+2.21)#83 | 6.8%(+0.527)#6,320 |
| 2. | 38016 | 6.4% | 5.1%(+1.32)#103 | 6.8%(-0.363)#7,930 |
1
Common Questions
What are the Top Zip Codes with the Highest Percentage of Population Employed in Computer, Engineering & Science in Cordova, TN?
Top Zip Codes with the Highest Percentage of Population Employed in Computer, Engineering & Science in Cordova, TN are:
What zip code has the Highest Percentage of Population Employed in Computer, Engineering & Science in Cordova, TN?
38018 has the Highest Percentage of Population Employed in Computer, Engineering & Science in Cordova, TN with 7.3%.
What is the Percentage of Population Employed in Computer, Engineering & Science in Tennessee?
Percentage of Population Employed in Computer, Engineering & Science in Tennessee is 5.1%.
What is the Percentage of Population Employed in Computer, Engineering & Science in the United States?
Percentage of Population Employed in Computer, Engineering & Science in the United States is 6.8%.