Woonsocket, SD
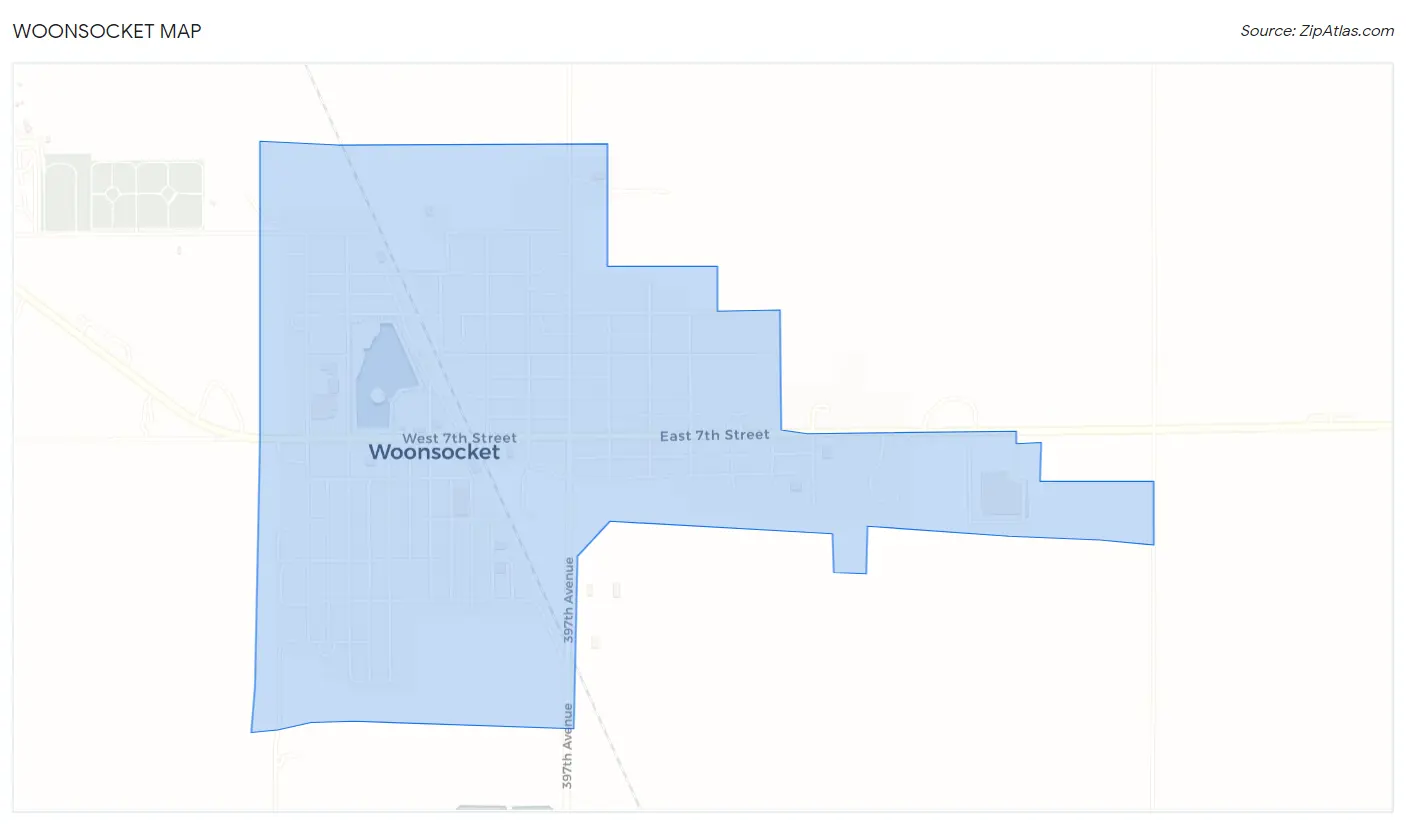
Woonsocket Map
Woonsocket Overview
710
TOTAL POPULATION
297
MALE POPULATION
413
FEMALE POPULATION
71.91
MALES / 100 FEMALES
139.06
FEMALES / 100 MALES
42.2
MEDIAN AGE
3.1
AVG FAMILY SIZE
2.2
AVG HOUSEHOLD SIZE
$29,590
PER CAPITA INCOME
$65,938
AVG FAMILY INCOME
$48,177
AVG HOUSEHOLD INCOME
23.2%
WAGE / INCOME GAP [ % ]
76.8¢/ $1
WAGE / INCOME GAP [ $ ]
0.44
INEQUALITY / GINI INDEX
343
LABOR FORCE [ PEOPLE ]
64.4%
PERCENT IN LABOR FORCE
1.8%
UNEMPLOYMENT RATE
Woonsocket Zip Codes
Woonsocket Area Codes
Race in Woonsocket
The most populous races in Woonsocket are White / Caucasian (691 | 97.3%), Hispanic or Latino (21 | 3.0%), and Some other Race (11 | 1.5%).
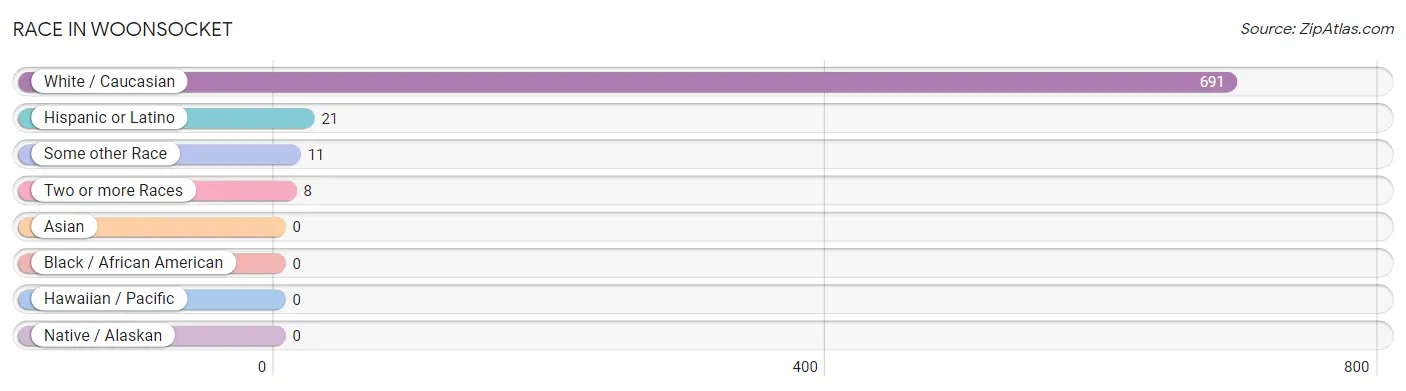
| Race | # Population | % Population |
| Asian | 0 | 0.0% |
| Black / African American | 0 | 0.0% |
| Hawaiian / Pacific | 0 | 0.0% |
| Hispanic or Latino | 21 | 3.0% |
| Native / Alaskan | 0 | 0.0% |
| White / Caucasian | 691 | 97.3% |
| Two or more Races | 8 | 1.1% |
| Some other Race | 11 | 1.5% |
| Total | 710 | 100.0% |
Ancestry in Woonsocket
The most populous ancestries reported in Woonsocket are German (302 | 42.5%), American (102 | 14.4%), Norwegian (60 | 8.5%), Swedish (55 | 7.7%), and English (46 | 6.5%), together accounting for 79.6% of all Woonsocket residents.
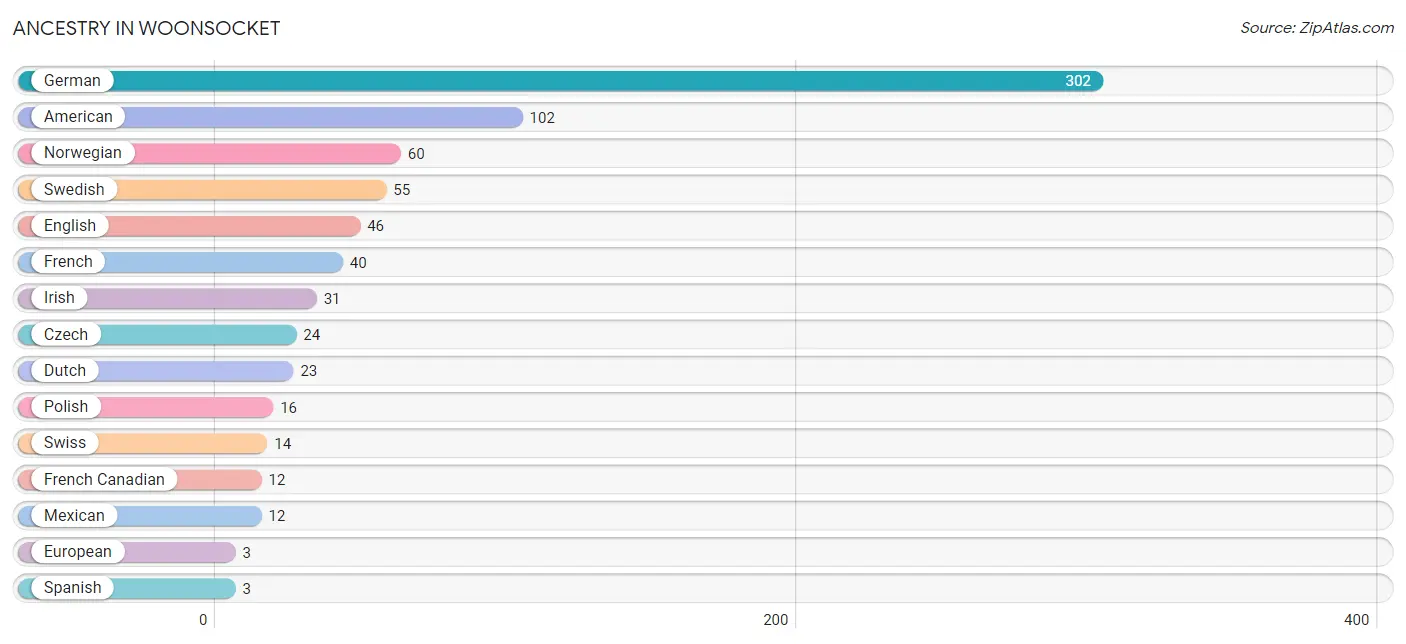
| Ancestry | # Population | % Population |
| American | 102 | 14.4% |
| Belgian | 2 | 0.3% |
| Czech | 24 | 3.4% |
| Dutch | 23 | 3.2% |
| English | 46 | 6.5% |
| European | 3 | 0.4% |
| French | 40 | 5.6% |
| French Canadian | 12 | 1.7% |
| German | 302 | 42.5% |
| Irish | 31 | 4.4% |
| Mexican | 12 | 1.7% |
| Norwegian | 60 | 8.5% |
| Polish | 16 | 2.2% |
| Puerto Rican | 2 | 0.3% |
| Scandinavian | 2 | 0.3% |
| Scotch-Irish | 2 | 0.3% |
| Spanish | 3 | 0.4% |
| Swedish | 55 | 7.7% |
| Swiss | 14 | 2.0% |
| Welsh | 2 | 0.3% | View All 20 Rows |
Immigrants in Woonsocket
The most numerous immigrant groups reported in Woonsocket came from Central America (1 | 0.1%), Latin America (1 | 0.1%), and Mexico (1 | 0.1%), together accounting for 0.4% of all Woonsocket residents.
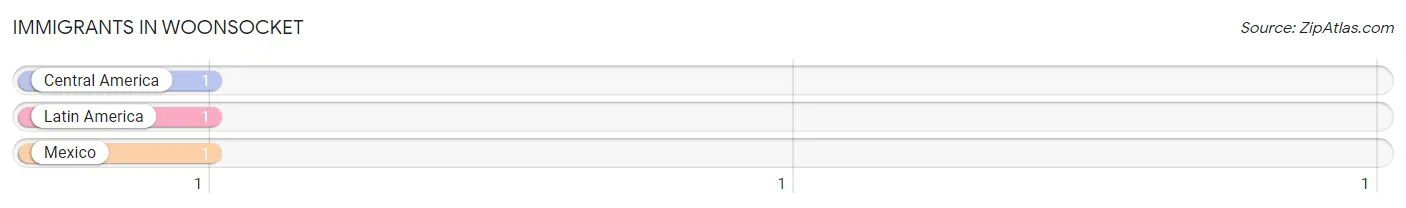
| Immigration Origin | # Population | % Population |
| Central America | 1 | 0.1% |
| Latin America | 1 | 0.1% |
| Mexico | 1 | 0.1% | View All 3 Rows |
Sex and Age in Woonsocket
Sex and Age in Woonsocket
The most populous age groups in Woonsocket are 60 to 64 Years (36 | 12.1%) for men and 15 to 19 Years (46 | 11.1%) for women.
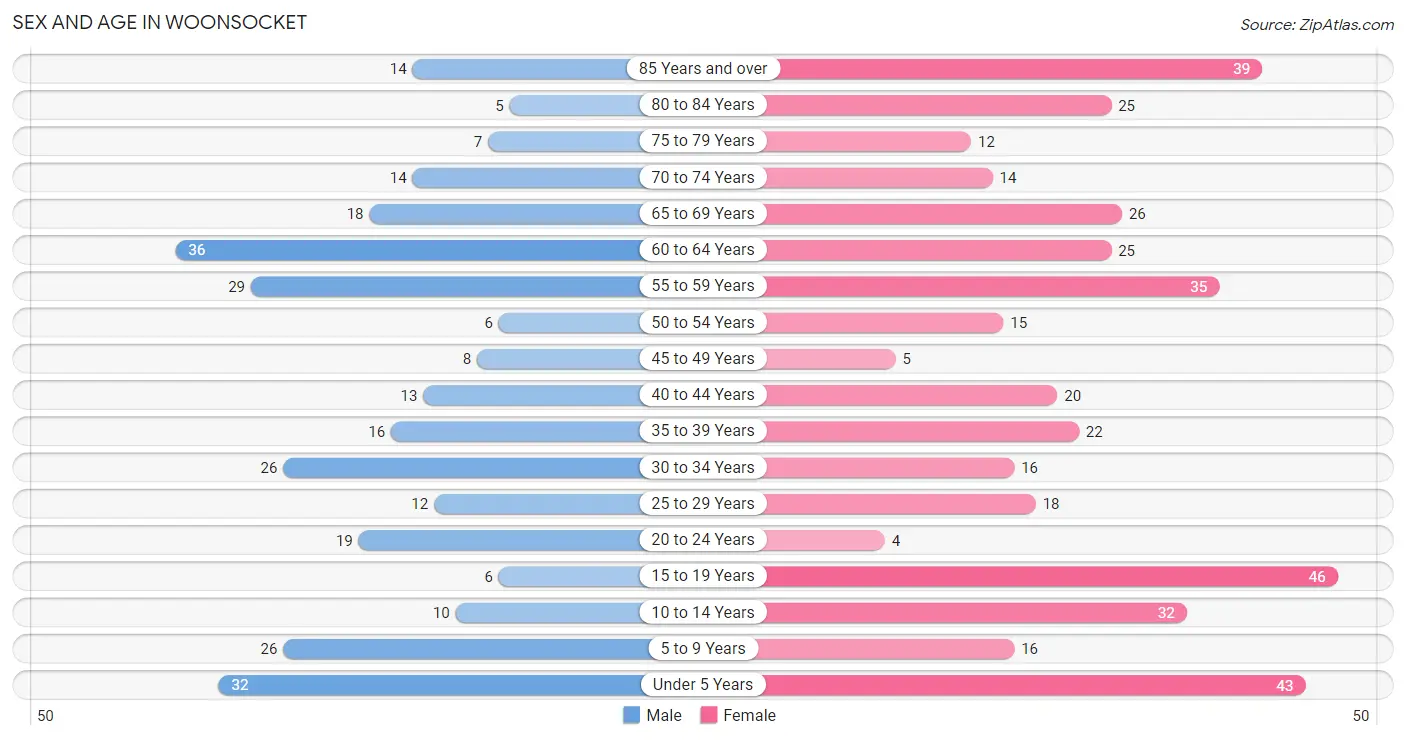
| Age Bracket | Male | Female |
| Under 5 Years | 32 (10.8%) | 43 (10.4%) |
| 5 to 9 Years | 26 (8.7%) | 16 (3.9%) |
| 10 to 14 Years | 10 (3.4%) | 32 (7.7%) |
| 15 to 19 Years | 6 (2.0%) | 46 (11.1%) |
| 20 to 24 Years | 19 (6.4%) | 4 (1.0%) |
| 25 to 29 Years | 12 (4.0%) | 18 (4.4%) |
| 30 to 34 Years | 26 (8.7%) | 16 (3.9%) |
| 35 to 39 Years | 16 (5.4%) | 22 (5.3%) |
| 40 to 44 Years | 13 (4.4%) | 20 (4.8%) |
| 45 to 49 Years | 8 (2.7%) | 5 (1.2%) |
| 50 to 54 Years | 6 (2.0%) | 15 (3.6%) |
| 55 to 59 Years | 29 (9.8%) | 35 (8.5%) |
| 60 to 64 Years | 36 (12.1%) | 25 (6.0%) |
| 65 to 69 Years | 18 (6.1%) | 26 (6.3%) |
| 70 to 74 Years | 14 (4.7%) | 14 (3.4%) |
| 75 to 79 Years | 7 (2.4%) | 12 (2.9%) |
| 80 to 84 Years | 5 (1.7%) | 25 (6.0%) |
| 85 Years and over | 14 (4.7%) | 39 (9.4%) |
| Total | 297 (100.0%) | 413 (100.0%) |
Families and Households in Woonsocket
Median Family Size in Woonsocket
The median family size in Woonsocket is 3.12 persons per family, with single male/father families (8 | 5.0%) accounting for the largest median family size of 3.75 persons per family. On the other hand, married-couple families (122 | 76.7%) represent the smallest median family size with 3.03 persons per family.
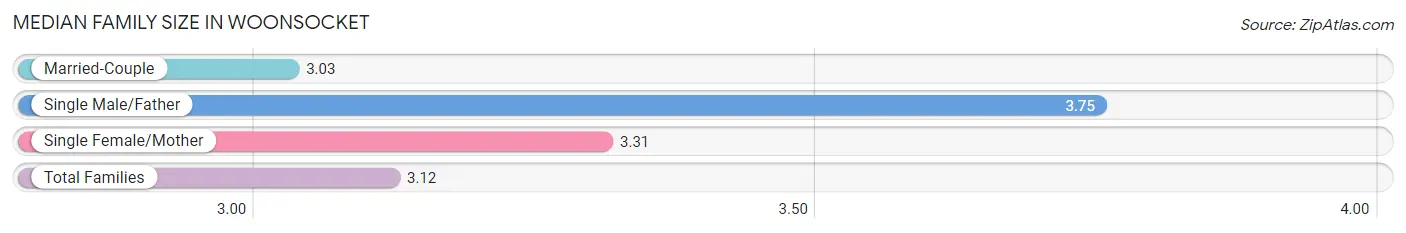
| Family Type | # Families | Family Size |
| Married-Couple | 122 (76.7%) | 3.03 |
| Single Male/Father | 8 (5.0%) | 3.75 |
| Single Female/Mother | 29 (18.2%) | 3.31 |
| Total Families | 159 (100.0%) | 3.12 |
Median Household Size in Woonsocket
The median household size in Woonsocket is 2.18 persons per household, with single male/father households (8 | 2.7%) accounting for the largest median household size of 4.5 persons per household. non-family households (140 | 46.8%) represent the smallest median household size with 1.01 persons per household.
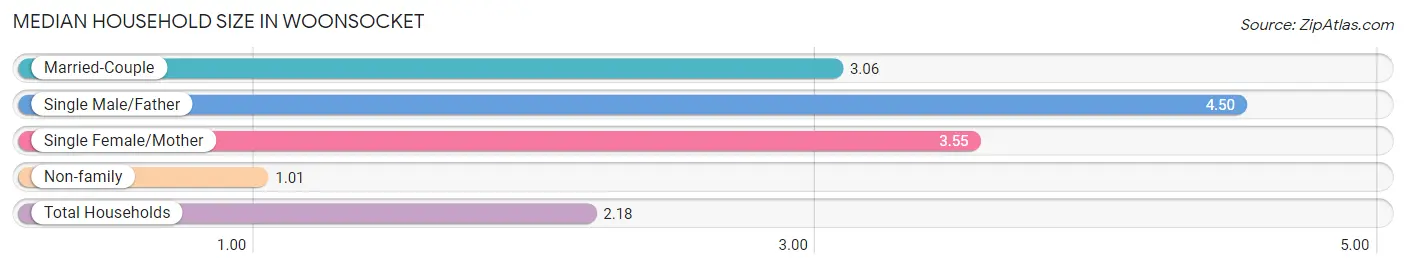
| Household Type | # Households | Household Size |
| Married-Couple | 122 (40.8%) | 3.06 |
| Single Male/Father | 8 (2.7%) | 4.50 |
| Single Female/Mother | 29 (9.7%) | 3.55 |
| Non-family | 140 (46.8%) | 1.01 |
| Total Households | 299 (100.0%) | 2.18 |
Household Size by Marriage Status in Woonsocket
Out of a total of 299 households in Woonsocket, 159 (53.2%) are family households, while 140 (46.8%) are nonfamily households. The most numerous type of family households are 2-person households, comprising 81, and the most common type of nonfamily households are 1-person households, comprising 136.
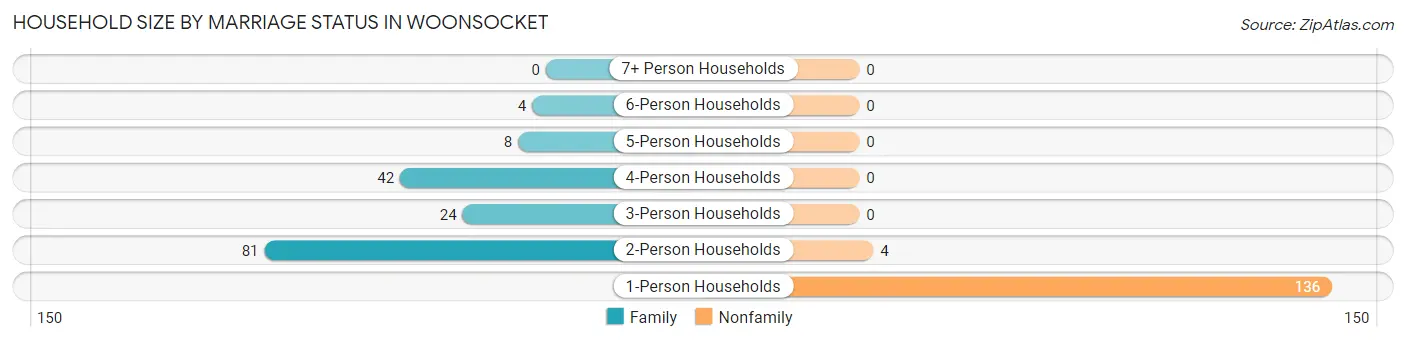
| Household Size | Family Households | Nonfamily Households |
| 1-Person Households | - | 136 (45.5%) |
| 2-Person Households | 81 (27.1%) | 4 (1.3%) |
| 3-Person Households | 24 (8.0%) | 0 (0.0%) |
| 4-Person Households | 42 (14.1%) | 0 (0.0%) |
| 5-Person Households | 8 (2.7%) | 0 (0.0%) |
| 6-Person Households | 4 (1.3%) | 0 (0.0%) |
| 7+ Person Households | 0 (0.0%) | 0 (0.0%) |
| Total | 159 (53.2%) | 140 (46.8%) |
Female Fertility in Woonsocket
Fertility by Age in Woonsocket
Average fertility rate in Woonsocket is 75.0 births per 1,000 women. Women in the age bracket of 20 to 34 years have the highest fertility rate with 263.0 births per 1,000 women. Women in the age bracket of 20 to 34 years acount for 100.0% of all women with births.
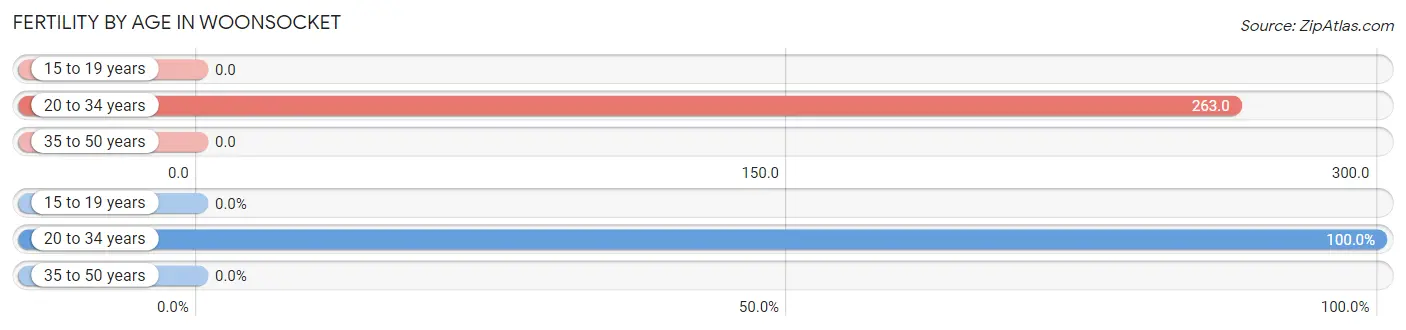
| Age Bracket | Women with Births | Births / 1,000 Women |
| 15 to 19 years | 0 (0.0%) | 0.0 |
| 20 to 34 years | 10 (100.0%) | 263.0 |
| 35 to 50 years | 0 (0.0%) | 0.0 |
| Total | 10 (100.0%) | 75.0 |
Fertility by Age by Marriage Status in Woonsocket
70.0% of women with births (10) in Woonsocket are married. The highest percentage of unmarried women with births falls into 20 to 34 years age bracket with 30.0% of them unmarried at the time of birth, while the lowest percentage of unmarried women with births belong to 20 to 34 years age bracket with 30.0% of them unmarried.
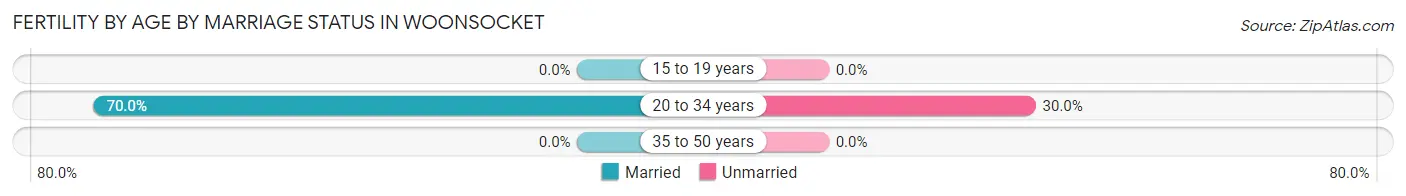
| Age Bracket | Married | Unmarried |
| 15 to 19 years | 0 (0.0%) | 0 (0.0%) |
| 20 to 34 years | 7 (70.0%) | 3 (30.0%) |
| 35 to 50 years | 0 (0.0%) | 0 (0.0%) |
| Total | 7 (70.0%) | 3 (30.0%) |
Fertility by Education in Woonsocket
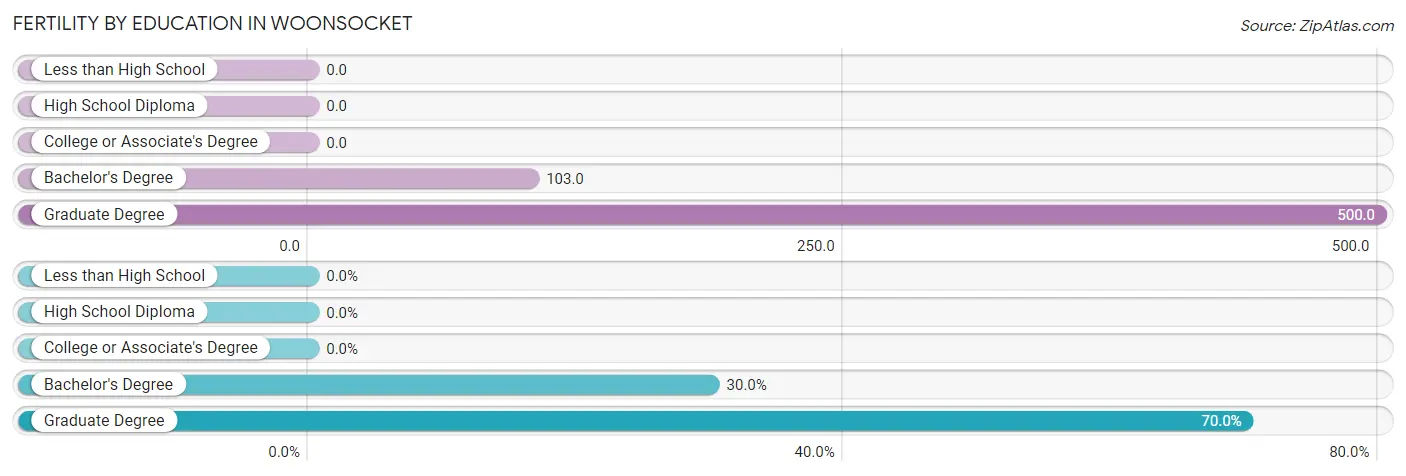
| Educational Attainment | Women with Births | Births / 1,000 Women |
| Less than High School | 0 (0.0%) | 0.0 |
| High School Diploma | 0 (0.0%) | 0.0 |
| College or Associate's Degree | 0 (0.0%) | 0.0 |
| Bachelor's Degree | 3 (30.0%) | 103.0 |
| Graduate Degree | 7 (70.0%) | 500.0 |
| Total | 10 (100.0%) | 75.0 |
Fertility by Education by Marriage Status in Woonsocket
30.0% of women with births in Woonsocket are unmarried. Women with the educational attainment of bachelor's degree are most likely to be married with 100.0% of them married at childbirth, while women with the educational attainment of graduate degree are least likely to be married with 42.9% of them unmarried at childbirth.
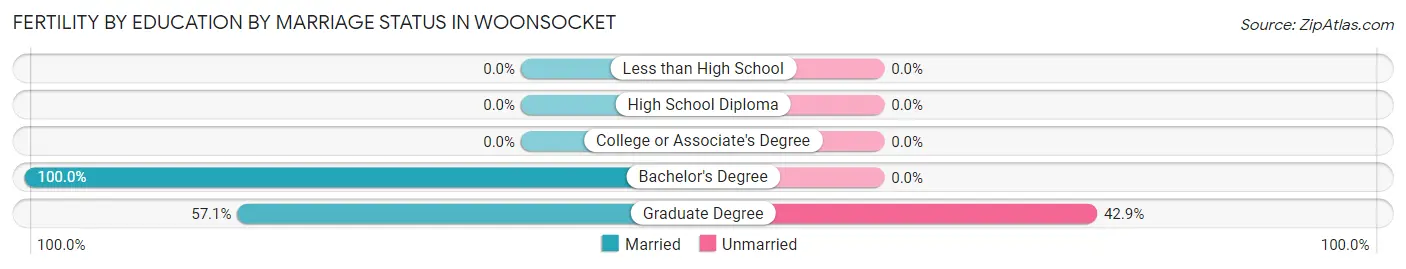
| Educational Attainment | Married | Unmarried |
| Less than High School | 0 (0.0%) | 0 (0.0%) |
| High School Diploma | 0 (0.0%) | 0 (0.0%) |
| College or Associate's Degree | 0 (0.0%) | 0 (0.0%) |
| Bachelor's Degree | 3 (100.0%) | 0 (0.0%) |
| Graduate Degree | 4 (57.1%) | 3 (42.9%) |
| Total | 7 (70.0%) | 3 (30.0%) |
Income in Woonsocket
Income Overview in Woonsocket
Per Capita Income in Woonsocket is $29,590, while median incomes of families and households are $65,938 and $48,177 respectively.
| Characteristic | Number | Measure |
| Per Capita Income | 710 | $29,590 |
| Median Family Income | 159 | $65,938 |
| Mean Family Income | 159 | $86,270 |
| Median Household Income | 299 | $48,177 |
| Mean Household Income | 299 | $63,828 |
| Income Deficit | 159 | $0 |
| Wage / Income Gap (%) | 710 | 23.23% |
| Wage / Income Gap ($) | 710 | 76.77¢ per $1 |
| Gini / Inequality Index | 710 | 0.44 |
Earnings by Sex in Woonsocket
Average Earnings in Woonsocket are $35,125, $37,813 for men and $29,028 for women, a difference of 23.2%.
| Sex | Number | Average Earnings |
| Male | 163 (47.4%) | $37,813 |
| Female | 181 (52.6%) | $29,028 |
| Total | 344 (100.0%) | $35,125 |
Earnings by Sex by Income Bracket in Woonsocket
The most common earnings brackets in Woonsocket are $75,000 to $99,999 for men (27 | 16.6%) and $35,000 to $39,999 for women (26 | 14.4%).
| Income | Male | Female |
| $2,499 or less | 0 (0.0%) | 10 (5.5%) |
| $2,500 to $4,999 | 6 (3.7%) | 8 (4.4%) |
| $5,000 to $7,499 | 0 (0.0%) | 8 (4.4%) |
| $7,500 to $9,999 | 3 (1.8%) | 25 (13.8%) |
| $10,000 to $12,499 | 24 (14.7%) | 5 (2.8%) |
| $12,500 to $14,999 | 0 (0.0%) | 2 (1.1%) |
| $15,000 to $17,499 | 14 (8.6%) | 0 (0.0%) |
| $17,500 to $19,999 | 0 (0.0%) | 0 (0.0%) |
| $20,000 to $22,499 | 0 (0.0%) | 17 (9.4%) |
| $22,500 to $24,999 | 0 (0.0%) | 10 (5.5%) |
| $25,000 to $29,999 | 2 (1.2%) | 9 (5.0%) |
| $30,000 to $34,999 | 23 (14.1%) | 5 (2.8%) |
| $35,000 to $39,999 | 13 (8.0%) | 26 (14.4%) |
| $40,000 to $44,999 | 8 (4.9%) | 8 (4.4%) |
| $45,000 to $49,999 | 13 (8.0%) | 10 (5.5%) |
| $50,000 to $54,999 | 7 (4.3%) | 0 (0.0%) |
| $55,000 to $64,999 | 9 (5.5%) | 26 (14.4%) |
| $65,000 to $74,999 | 14 (8.6%) | 9 (5.0%) |
| $75,000 to $99,999 | 27 (16.6%) | 0 (0.0%) |
| $100,000+ | 0 (0.0%) | 3 (1.7%) |
| Total | 163 (100.0%) | 181 (100.0%) |
Earnings by Sex by Educational Attainment in Woonsocket
Average earnings in Woonsocket are $44,583 for men and $36,136 for women, a difference of 19.0%. Men with an educational attainment of high school diploma enjoy the highest average annual earnings of $66,250, while those with graduate degree education earn the least with $39,063. Women with an educational attainment of graduate degree earn the most with the average annual earnings of $55,833, while those with high school diploma education have the smallest earnings of $23,000.
| Educational Attainment | Male Income | Female Income |
| Less than High School | - | - |
| High School Diploma | $66,250 | $23,000 |
| College or Associate's Degree | $57,188 | $40,000 |
| Bachelor's Degree | $41,667 | $37,500 |
| Graduate Degree | $39,063 | $55,833 |
| Total | $44,583 | $36,136 |
Family Income in Woonsocket
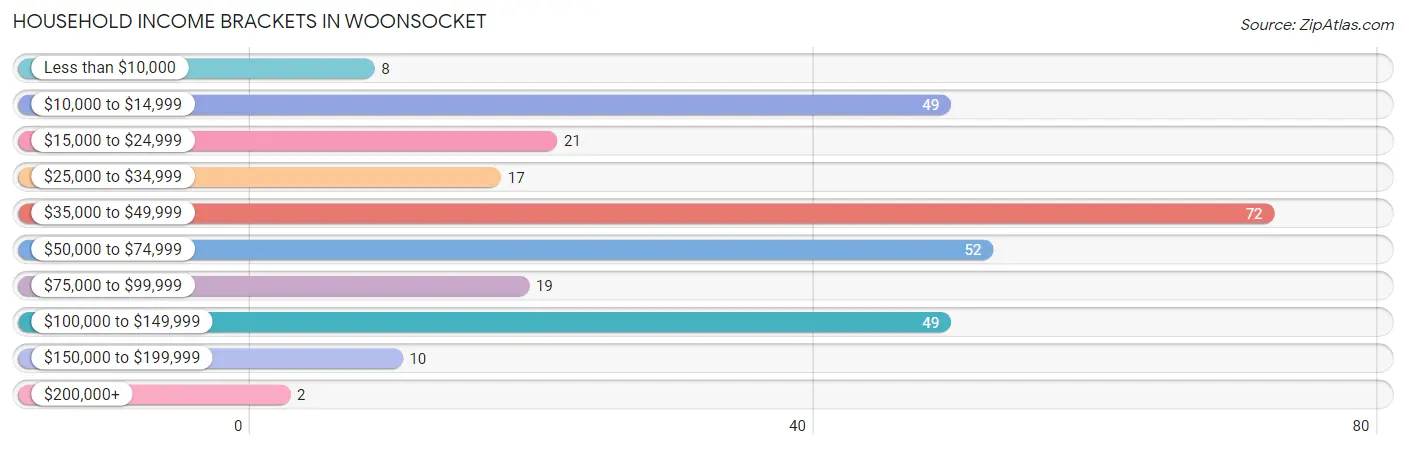
Family Income Brackets in Woonsocket
According to the Woonsocket family income data, there are 47 families falling into the $35,000 to $49,999 income range, which is the most common income bracket and makes up 29.6% of all families.
| Income Bracket | # Families | % Families |
| Less than $10,000 | 8 | 5.0% |
| $10,000 to $14,999 | 0 | 0.0% |
| $15,000 to $24,999 | 0 | 0.0% |
| $25,000 to $34,999 | 0 | 0.0% |
| $35,000 to $49,999 | 47 | 29.6% |
| $50,000 to $74,999 | 40 | 25.2% |
| $75,000 to $99,999 | 14 | 8.8% |
| $100,000 to $149,999 | 42 | 26.4% |
| $150,000 to $199,999 | 6 | 3.8% |
| $200,000+ | 2 | 1.3% |
Family Income by Famaliy Size in Woonsocket
5-person families (8 | 5.0%) account for the highest median family income in Woonsocket with $106,429 per family, while 2-person families (87 | 54.7%) have the highest median income of $26,042 per family member.
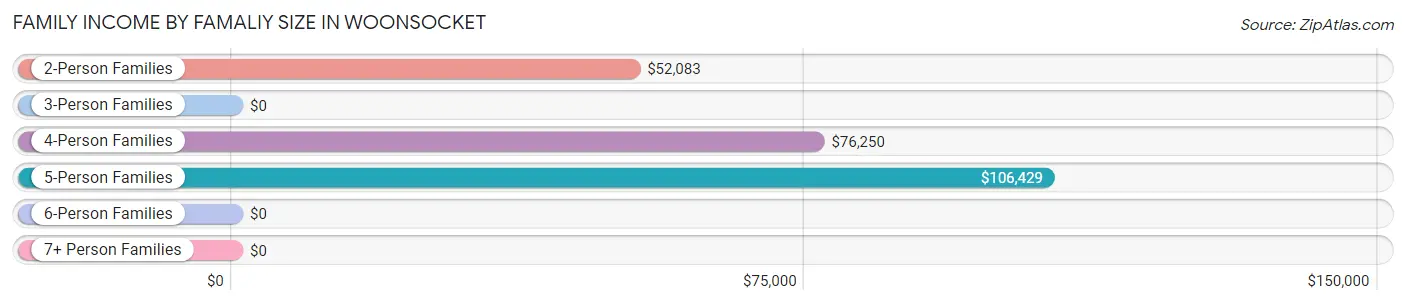
| Income Bracket | # Families | Median Income |
| 2-Person Families | 87 (54.7%) | $52,083 |
| 3-Person Families | 27 (17.0%) | $0 |
| 4-Person Families | 33 (20.7%) | $76,250 |
| 5-Person Families | 8 (5.0%) | $106,429 |
| 6-Person Families | 4 (2.5%) | $0 |
| 7+ Person Families | 0 (0.0%) | $0 |
| Total | 159 (100.0%) | $65,938 |
Family Income by Number of Earners in Woonsocket
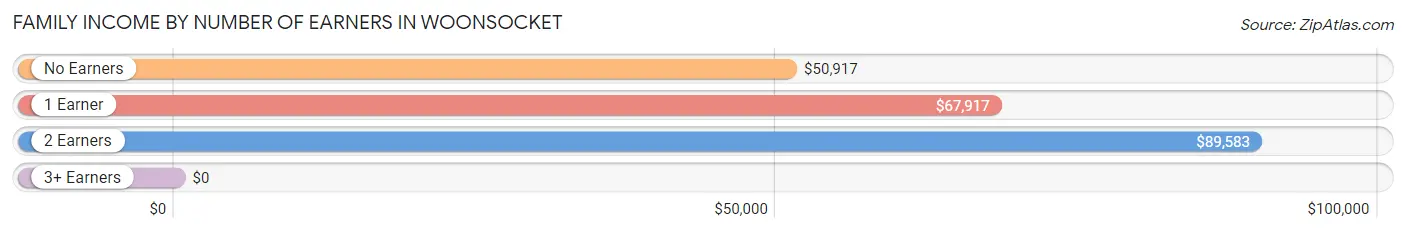
| Number of Earners | # Families | Median Income |
| No Earners | 27 (17.0%) | $50,917 |
| 1 Earner | 25 (15.7%) | $67,917 |
| 2 Earners | 97 (61.0%) | $89,583 |
| 3+ Earners | 10 (6.3%) | $0 |
| Total | 159 (100.0%) | $65,938 |
Household Income in Woonsocket
Household Income Brackets in Woonsocket
With 72 households falling in the category, the $35,000 to $49,999 income range is the most frequent in Woonsocket, accounting for 24.1% of all households. In contrast, only 2 households (0.7%) fall into the $200,000+ income bracket, making it the least populous group.
| Income Bracket | # Households | % Households |
| Less than $10,000 | 8 | 2.7% |
| $10,000 to $14,999 | 49 | 16.4% |
| $15,000 to $24,999 | 21 | 7.0% |
| $25,000 to $34,999 | 17 | 5.7% |
| $35,000 to $49,999 | 72 | 24.1% |
| $50,000 to $74,999 | 52 | 17.4% |
| $75,000 to $99,999 | 19 | 6.4% |
| $100,000 to $149,999 | 49 | 16.4% |
| $150,000 to $199,999 | 10 | 3.3% |
| $200,000+ | 2 | 0.7% |
Household Income by Householder Age in Woonsocket
The median household income in Woonsocket is $48,177, with the highest median household income of $67,083 found in the 25 to 44 years age bracket for the primary householder. A total of 94 households (31.4%) fall into this category. Meanwhile, the 15 to 24 years age bracket for the primary householder has the lowest median household income of $0, with 18 households (6.0%) in this group.
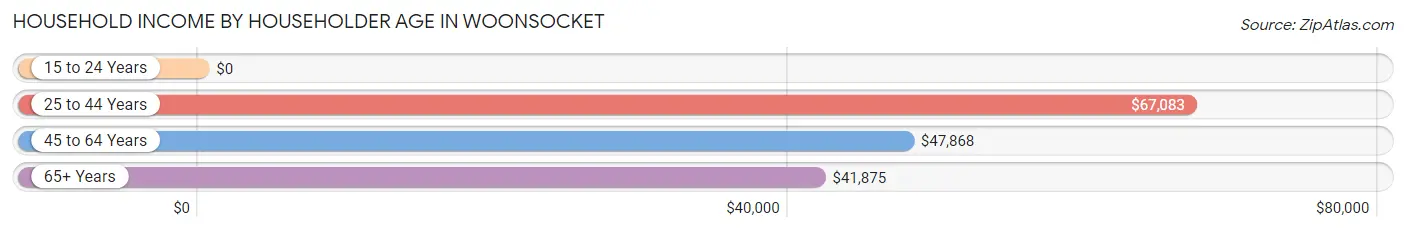
| Income Bracket | # Households | Median Income |
| 15 to 24 Years | 18 (6.0%) | $0 |
| 25 to 44 Years | 94 (31.4%) | $67,083 |
| 45 to 64 Years | 91 (30.4%) | $47,868 |
| 65+ Years | 96 (32.1%) | $41,875 |
| Total | 299 (100.0%) | $48,177 |
Poverty in Woonsocket
Income Below Poverty by Sex and Age in Woonsocket
With 7.0% poverty level for males and 9.6% for females among the residents of Woonsocket, 55 to 64 year old males and 12 to 14 year old females are the most vulnerable to poverty, with 18 males (27.7%) and 9 females (40.9%) in their respective age groups living below the poverty level.
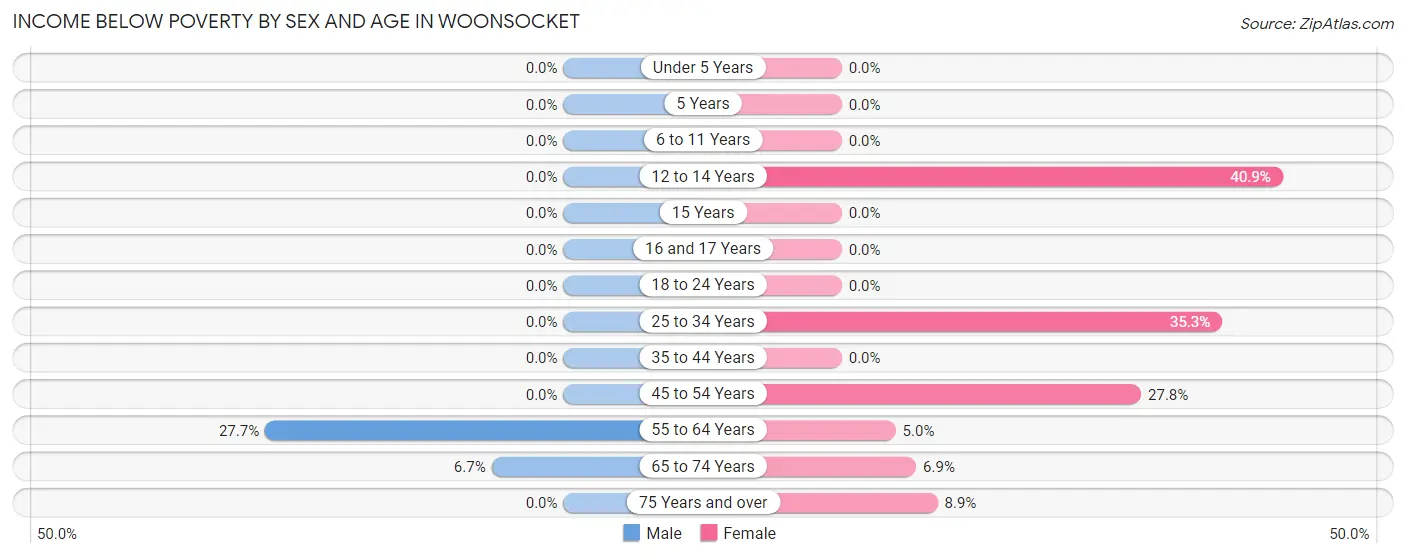
| Age Bracket | Male | Female |
| Under 5 Years | 0 (0.0%) | 0 (0.0%) |
| 5 Years | 0 (0.0%) | 0 (0.0%) |
| 6 to 11 Years | 0 (0.0%) | 0 (0.0%) |
| 12 to 14 Years | 0 (0.0%) | 9 (40.9%) |
| 15 Years | 0 (0.0%) | 0 (0.0%) |
| 16 and 17 Years | 0 (0.0%) | 0 (0.0%) |
| 18 to 24 Years | 0 (0.0%) | 0 (0.0%) |
| 25 to 34 Years | 0 (0.0%) | 12 (35.3%) |
| 35 to 44 Years | 0 (0.0%) | 0 (0.0%) |
| 45 to 54 Years | 0 (0.0%) | 5 (27.8%) |
| 55 to 64 Years | 18 (27.7%) | 3 (5.0%) |
| 65 to 74 Years | 2 (6.7%) | 2 (6.9%) |
| 75 Years and over | 0 (0.0%) | 4 (8.9%) |
| Total | 20 (7.0%) | 35 (9.6%) |
Income Above Poverty by Sex and Age in Woonsocket
According to the poverty statistics in Woonsocket, males aged under 5 years and females aged under 5 years are the age groups that are most secure financially, with 100.0% of males and 100.0% of females in these age groups living above the poverty line.
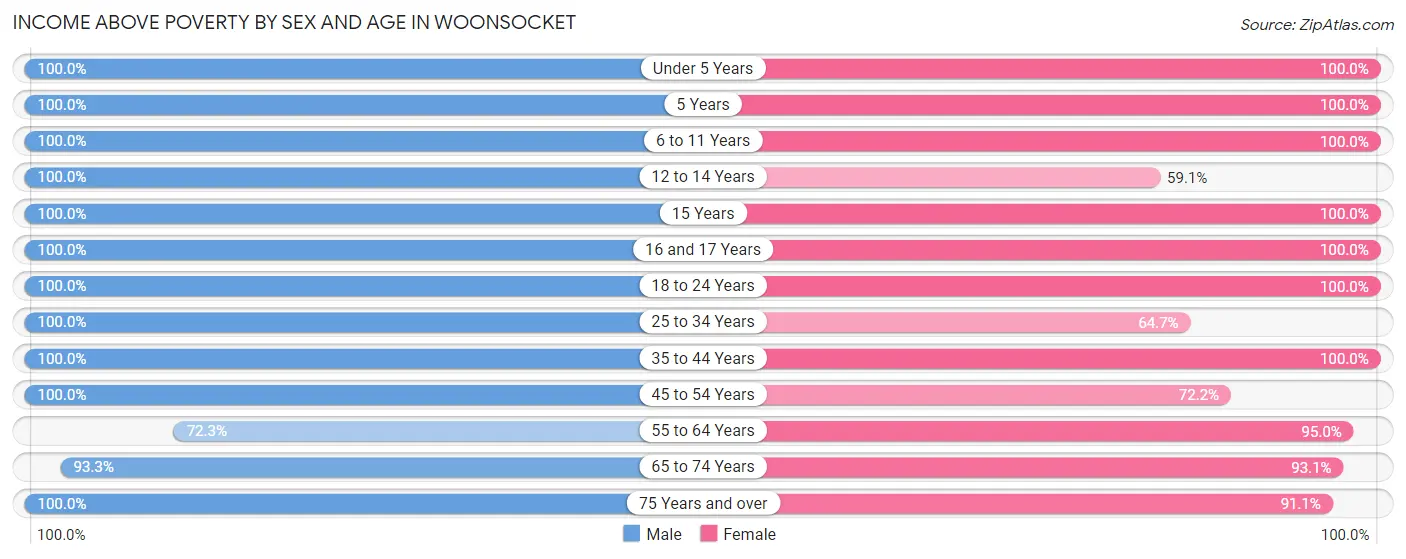
| Age Bracket | Male | Female |
| Under 5 Years | 32 (100.0%) | 43 (100.0%) |
| 5 Years | 10 (100.0%) | 8 (100.0%) |
| 6 to 11 Years | 16 (100.0%) | 15 (100.0%) |
| 12 to 14 Years | 10 (100.0%) | 13 (59.1%) |
| 15 Years | 3 (100.0%) | 15 (100.0%) |
| 16 and 17 Years | 3 (100.0%) | 6 (100.0%) |
| 18 to 24 Years | 19 (100.0%) | 29 (100.0%) |
| 25 to 34 Years | 38 (100.0%) | 22 (64.7%) |
| 35 to 44 Years | 29 (100.0%) | 42 (100.0%) |
| 45 to 54 Years | 14 (100.0%) | 13 (72.2%) |
| 55 to 64 Years | 47 (72.3%) | 57 (95.0%) |
| 65 to 74 Years | 28 (93.3%) | 27 (93.1%) |
| 75 Years and over | 15 (100.0%) | 41 (91.1%) |
| Total | 264 (93.0%) | 331 (90.4%) |
Income Below Poverty Among Married-Couple Families in Woonsocket
The poverty statistics for married-couple families in Woonsocket show that 1.6% or 2 of the total 122 families live below the poverty line. Families with no children have the highest poverty rate of 2.6%, comprising of 2 families. On the other hand, families with 1 or 2 children have the lowest poverty rate of 0.0%, which includes 0 families.
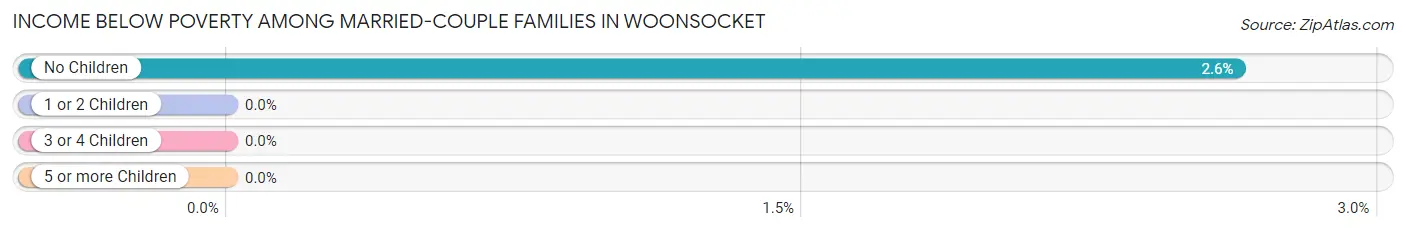
| Children | Above Poverty | Below Poverty |
| No Children | 74 (97.4%) | 2 (2.6%) |
| 1 or 2 Children | 34 (100.0%) | 0 (0.0%) |
| 3 or 4 Children | 12 (100.0%) | 0 (0.0%) |
| 5 or more Children | 0 (0.0%) | 0 (0.0%) |
| Total | 120 (98.4%) | 2 (1.6%) |
Income Below Poverty Among Single-Parent Households in Woonsocket
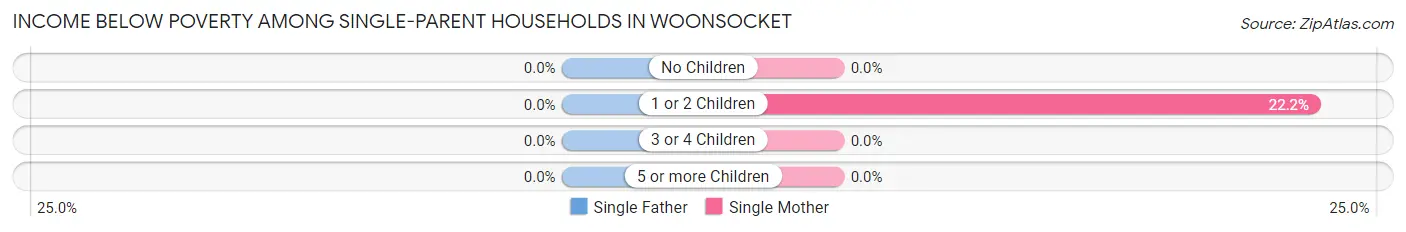
| Children | Single Father | Single Mother |
| No Children | 0 (0.0%) | 0 (0.0%) |
| 1 or 2 Children | 0 (0.0%) | 6 (22.2%) |
| 3 or 4 Children | 0 (0.0%) | 0 (0.0%) |
| 5 or more Children | 0 (0.0%) | 0 (0.0%) |
| Total | 0 (0.0%) | 6 (20.7%) |
Income Below Poverty Among Married-Couple vs Single-Parent Households in Woonsocket
The poverty data for Woonsocket shows that 2 of the married-couple family households (1.6%) and 6 of the single-parent households (16.2%) are living below the poverty level. Within the married-couple family households, those with no children have the highest poverty rate, with 2 households (2.6%) falling below the poverty line. Among the single-parent households, those with 1 or 2 children have the highest poverty rate, with 6 household (18.2%) living below poverty.
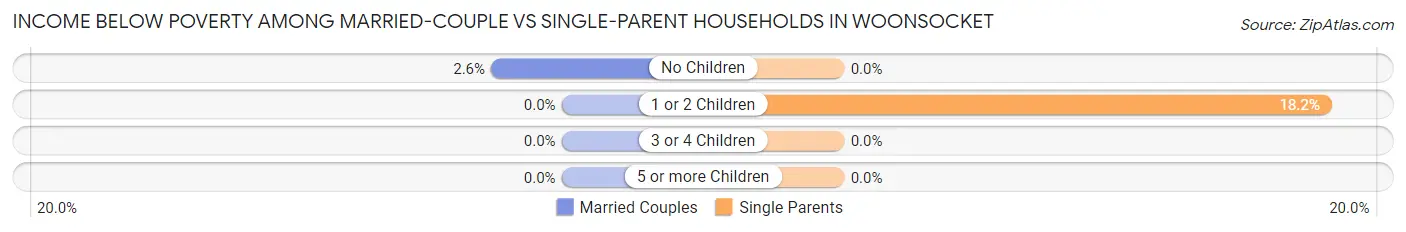
| Children | Married-Couple Families | Single-Parent Households |
| No Children | 2 (2.6%) | 0 (0.0%) |
| 1 or 2 Children | 0 (0.0%) | 6 (18.2%) |
| 3 or 4 Children | 0 (0.0%) | 0 (0.0%) |
| 5 or more Children | 0 (0.0%) | 0 (0.0%) |
| Total | 2 (1.6%) | 6 (16.2%) |
Employment Characteristics in Woonsocket
Employment by Class of Employer in Woonsocket
Among the 312 employed individuals in Woonsocket, private company employees (201 | 64.4%), local government employees (56 | 17.9%), and not-for-profit organizations (25 | 8.0%) make up the most common classes of employment.
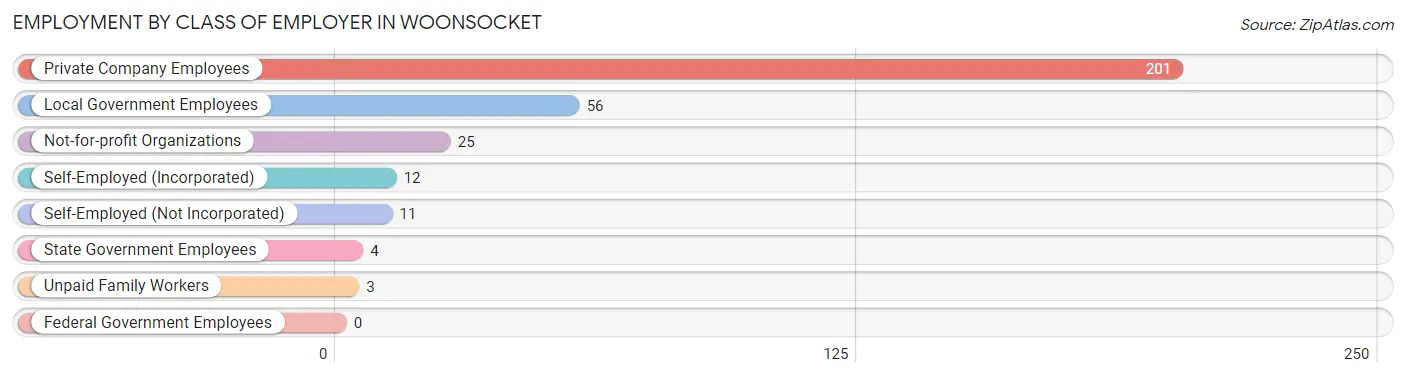
| Employer Class | # Employees | % Employees |
| Private Company Employees | 201 | 64.4% |
| Self-Employed (Incorporated) | 12 | 3.8% |
| Self-Employed (Not Incorporated) | 11 | 3.5% |
| Not-for-profit Organizations | 25 | 8.0% |
| Local Government Employees | 56 | 17.9% |
| State Government Employees | 4 | 1.3% |
| Federal Government Employees | 0 | 0.0% |
| Unpaid Family Workers | 3 | 1.0% |
| Total | 312 | 100.0% |
Employment Status by Age in Woonsocket
According to the labor force statistics for Woonsocket, out of the total population over 16 years of age (533), 64.4% or 343 individuals are in the labor force, with 1.8% or 6 of them unemployed. The age group with the highest labor force participation rate is 16 to 19 years, with 100.0% or 34 individuals in the labor force. Within the labor force, the 30 to 34 years age range has the highest percentage of unemployed individuals, with 14.3% or 6 of them being unemployed.
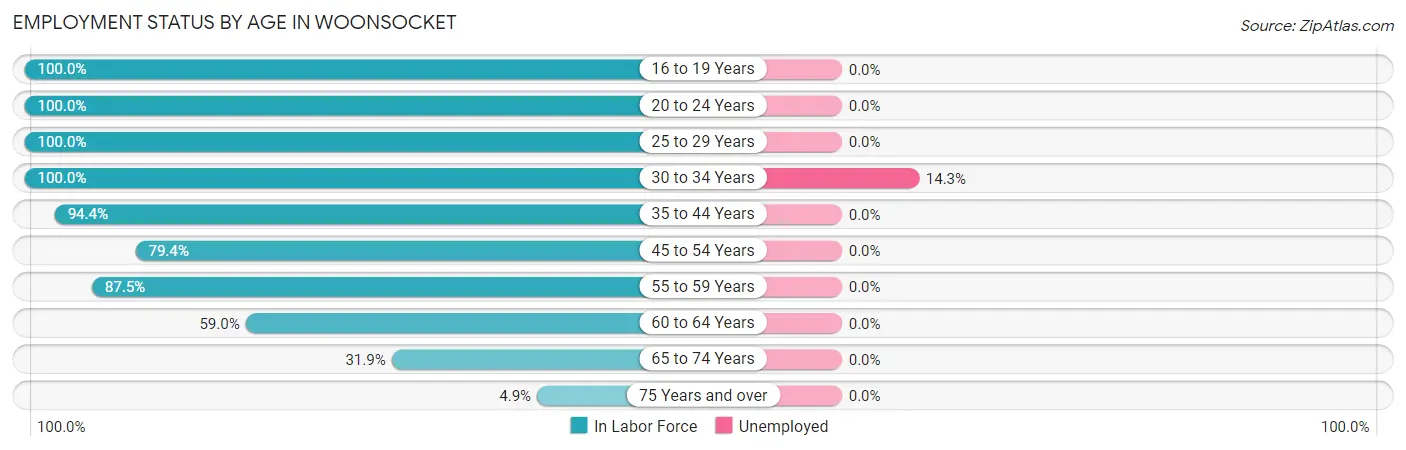
| Age Bracket | In Labor Force | Unemployed |
| 16 to 19 Years | 34 (100.0%) | 0 (0.0%) |
| 20 to 24 Years | 23 (100.0%) | 0 (0.0%) |
| 25 to 29 Years | 30 (100.0%) | 0 (0.0%) |
| 30 to 34 Years | 42 (100.0%) | 6 (14.3%) |
| 35 to 44 Years | 67 (94.4%) | 0 (0.0%) |
| 45 to 54 Years | 27 (79.4%) | 0 (0.0%) |
| 55 to 59 Years | 56 (87.5%) | 0 (0.0%) |
| 60 to 64 Years | 36 (59.0%) | 0 (0.0%) |
| 65 to 74 Years | 23 (31.9%) | 0 (0.0%) |
| 75 Years and over | 5 (4.9%) | 0 (0.0%) |
| Total | 343 (64.4%) | 6 (1.8%) |
Employment Status by Educational Attainment in Woonsocket
According to labor force statistics for Woonsocket, 85.4% of individuals (258) out of the total population between 25 and 64 years of age (302) are in the labor force, with 2.4% or 6 of them being unemployed. The group with the highest labor force participation rate are those with the educational attainment of bachelor's degree or higher, with 92.5% or 74 individuals in the labor force. Within the labor force, individuals with college / associate degree education have the highest percentage of unemployment, with 11.5% or 6 of them being unemployed.
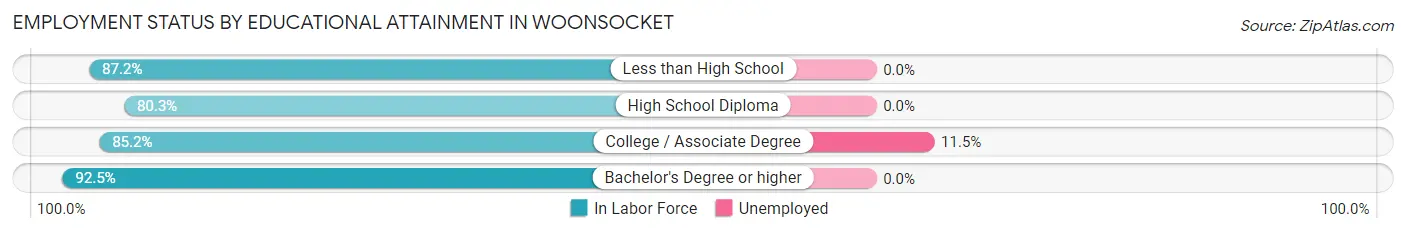
| Educational Attainment | In Labor Force | Unemployed |
| Less than High School | 34 (87.2%) | 0 (0.0%) |
| High School Diploma | 98 (80.3%) | 0 (0.0%) |
| College / Associate Degree | 52 (85.2%) | 7 (11.5%) |
| Bachelor's Degree or higher | 74 (92.5%) | 0 (0.0%) |
| Total | 258 (85.4%) | 7 (2.4%) |
Employment Occupations by Sex in Woonsocket
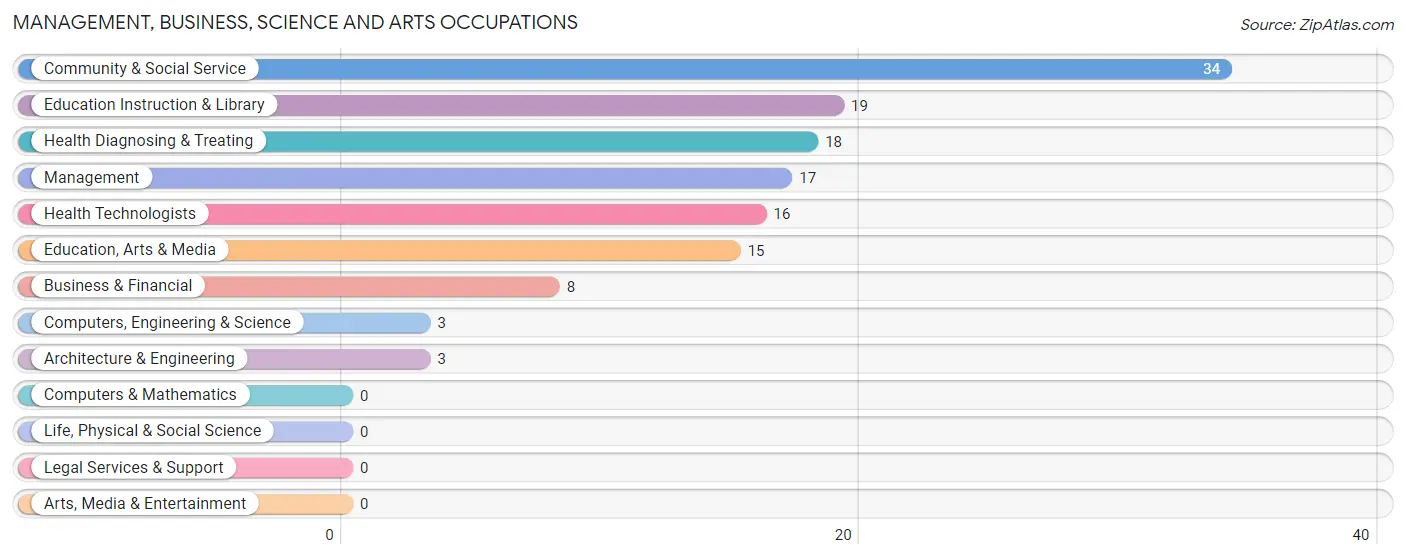
Management, Business, Science and Arts Occupations
The most common Management, Business, Science and Arts occupations in Woonsocket are Community & Social Service (34 | 10.3%), Education Instruction & Library (19 | 5.7%), Health Diagnosing & Treating (18 | 5.4%), Management (17 | 5.1%), and Health Technologists (16 | 4.8%).
Management, Business, Science and Arts Occupations by Sex
Within the Management, Business, Science and Arts occupations in Woonsocket, the most male-oriented occupations are Computers, Engineering & Science (66.7%), Architecture & Engineering (66.7%), and Management (58.8%), while the most female-oriented occupations are Business & Financial (100.0%), Health Diagnosing & Treating (100.0%), and Health Technologists (100.0%).
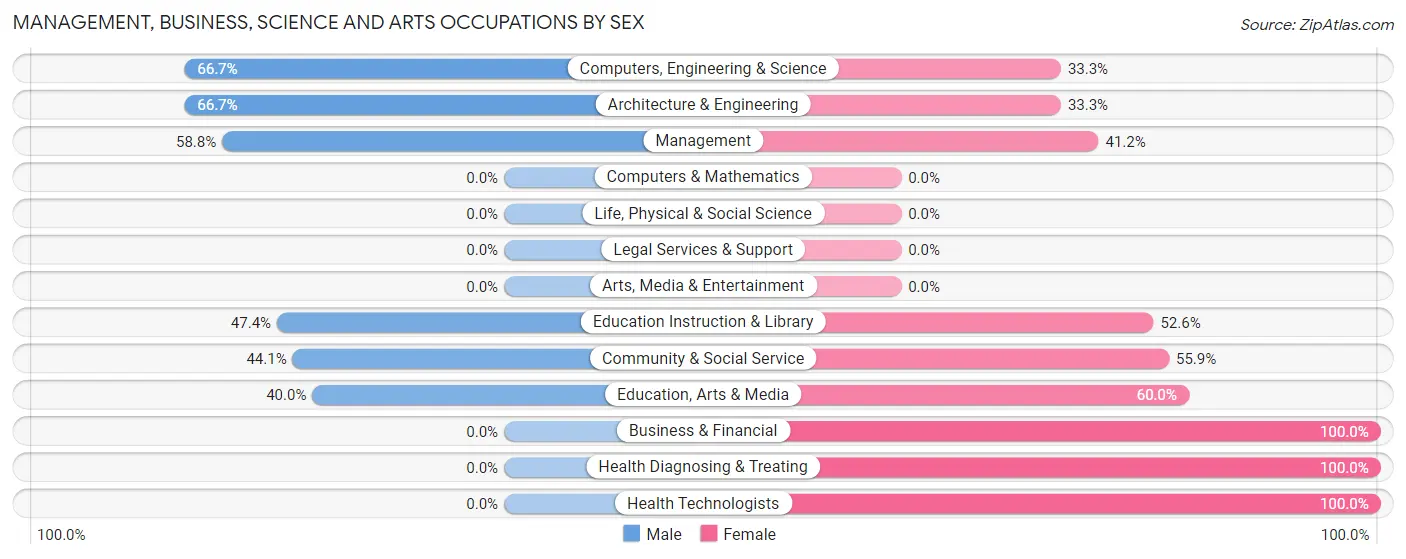
| Occupation | Male | Female |
| Management | 10 (58.8%) | 7 (41.2%) |
| Business & Financial | 0 (0.0%) | 8 (100.0%) |
| Computers, Engineering & Science | 2 (66.7%) | 1 (33.3%) |
| Computers & Mathematics | 0 (0.0%) | 0 (0.0%) |
| Architecture & Engineering | 2 (66.7%) | 1 (33.3%) |
| Life, Physical & Social Science | 0 (0.0%) | 0 (0.0%) |
| Community & Social Service | 15 (44.1%) | 19 (55.9%) |
| Education, Arts & Media | 6 (40.0%) | 9 (60.0%) |
| Legal Services & Support | 0 (0.0%) | 0 (0.0%) |
| Education Instruction & Library | 9 (47.4%) | 10 (52.6%) |
| Arts, Media & Entertainment | 0 (0.0%) | 0 (0.0%) |
| Health Diagnosing & Treating | 0 (0.0%) | 18 (100.0%) |
| Health Technologists | 0 (0.0%) | 16 (100.0%) |
| Total (Category) | 27 (33.8%) | 53 (66.2%) |
| Total (Overall) | 157 (47.4%) | 174 (52.6%) |
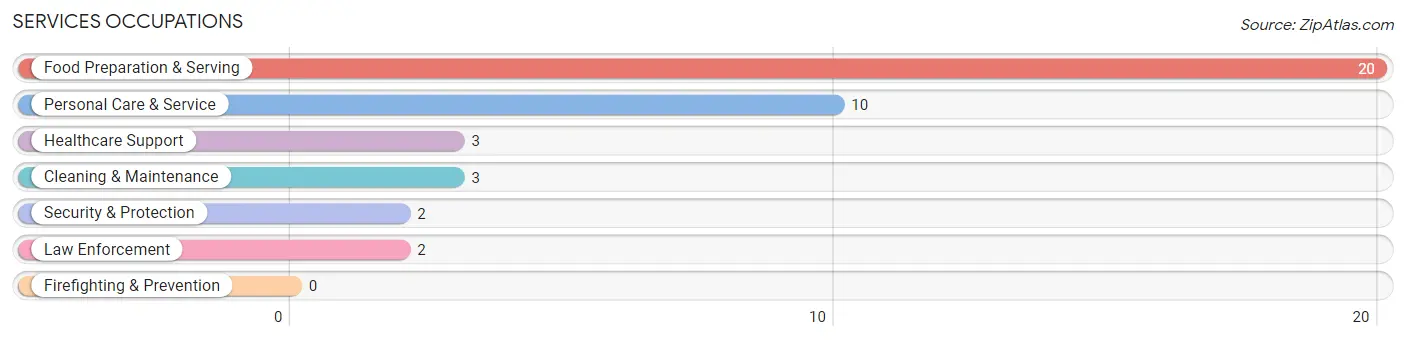
Services Occupations
The most common Services occupations in Woonsocket are Food Preparation & Serving (20 | 6.0%), Personal Care & Service (10 | 3.0%), Healthcare Support (3 | 0.9%), Cleaning & Maintenance (3 | 0.9%), and Security & Protection (2 | 0.6%).
Services Occupations by Sex
Within the Services occupations in Woonsocket, the most male-oriented occupations are Security & Protection (100.0%), Law Enforcement (100.0%), and Cleaning & Maintenance (100.0%), while the most female-oriented occupations are Healthcare Support (100.0%), Personal Care & Service (70.0%), and Food Preparation & Serving (30.0%).
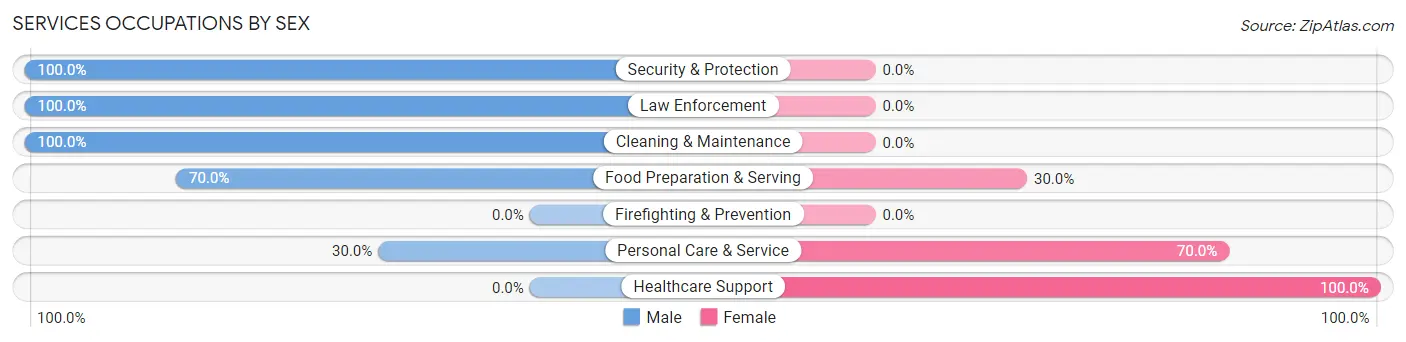
| Occupation | Male | Female |
| Healthcare Support | 0 (0.0%) | 3 (100.0%) |
| Security & Protection | 2 (100.0%) | 0 (0.0%) |
| Firefighting & Prevention | 0 (0.0%) | 0 (0.0%) |
| Law Enforcement | 2 (100.0%) | 0 (0.0%) |
| Food Preparation & Serving | 14 (70.0%) | 6 (30.0%) |
| Cleaning & Maintenance | 3 (100.0%) | 0 (0.0%) |
| Personal Care & Service | 3 (30.0%) | 7 (70.0%) |
| Total (Category) | 22 (57.9%) | 16 (42.1%) |
| Total (Overall) | 157 (47.4%) | 174 (52.6%) |
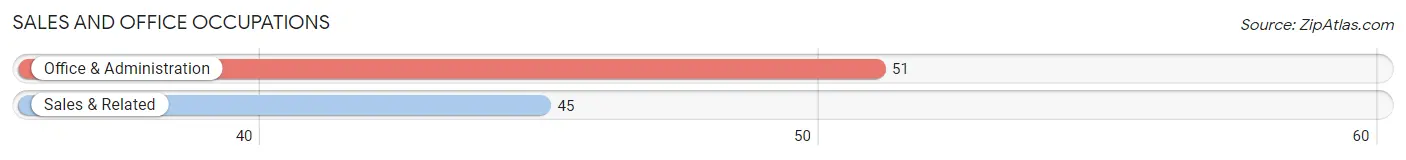
Sales and Office Occupations
The most common Sales and Office occupations in Woonsocket are Office & Administration (51 | 15.4%), and Sales & Related (45 | 13.6%).
Sales and Office Occupations by Sex
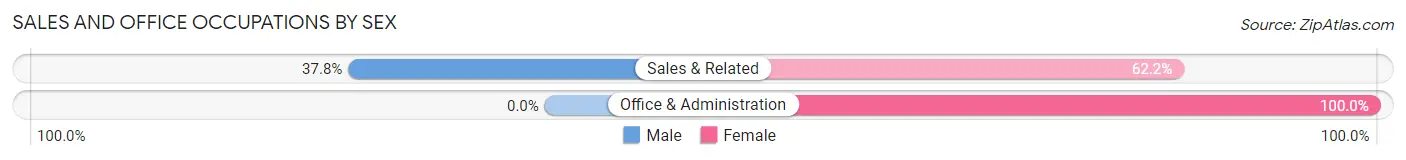
| Occupation | Male | Female |
| Sales & Related | 17 (37.8%) | 28 (62.2%) |
| Office & Administration | 0 (0.0%) | 51 (100.0%) |
| Total (Category) | 17 (17.7%) | 79 (82.3%) |
| Total (Overall) | 157 (47.4%) | 174 (52.6%) |
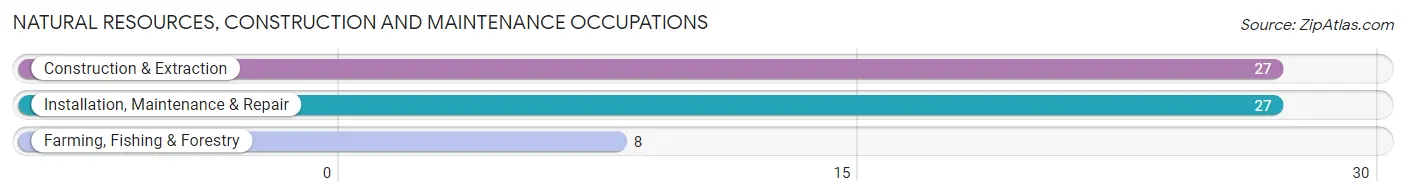
Natural Resources, Construction and Maintenance Occupations
The most common Natural Resources, Construction and Maintenance occupations in Woonsocket are Construction & Extraction (27 | 8.2%), Installation, Maintenance & Repair (27 | 8.2%), and Farming, Fishing & Forestry (8 | 2.4%).
Natural Resources, Construction and Maintenance Occupations by Sex
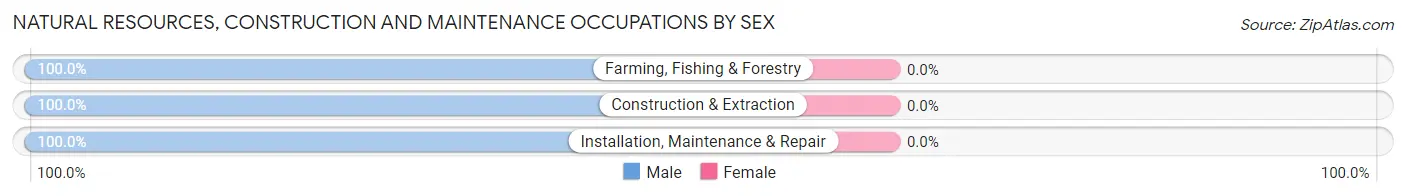
| Occupation | Male | Female |
| Farming, Fishing & Forestry | 8 (100.0%) | 0 (0.0%) |
| Construction & Extraction | 27 (100.0%) | 0 (0.0%) |
| Installation, Maintenance & Repair | 27 (100.0%) | 0 (0.0%) |
| Total (Category) | 62 (100.0%) | 0 (0.0%) |
| Total (Overall) | 157 (47.4%) | 174 (52.6%) |
Production, Transportation and Moving Occupations
The most common Production, Transportation and Moving occupations in Woonsocket are Production (29 | 8.8%), Material Moving (15 | 4.5%), and Transportation (11 | 3.3%).
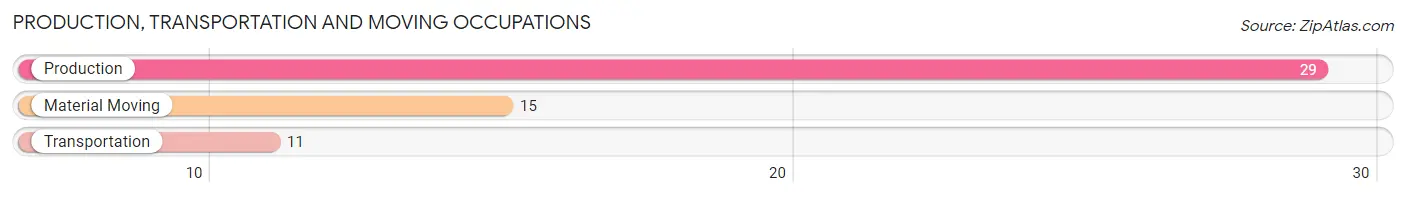
Production, Transportation and Moving Occupations by Sex
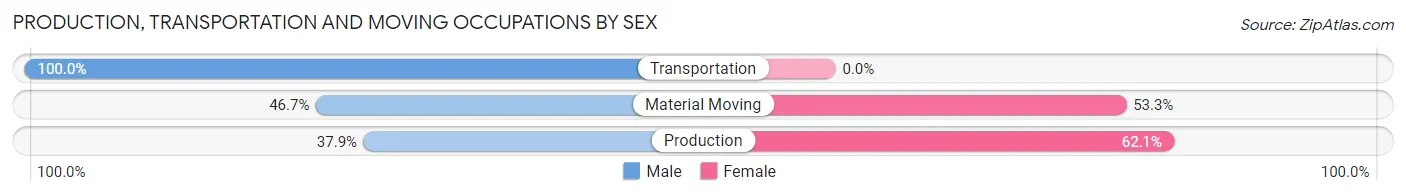
| Occupation | Male | Female |
| Production | 11 (37.9%) | 18 (62.1%) |
| Transportation | 11 (100.0%) | 0 (0.0%) |
| Material Moving | 7 (46.7%) | 8 (53.3%) |
| Total (Category) | 29 (52.7%) | 26 (47.3%) |
| Total (Overall) | 157 (47.4%) | 174 (52.6%) |
Employment Industries by Sex in Woonsocket
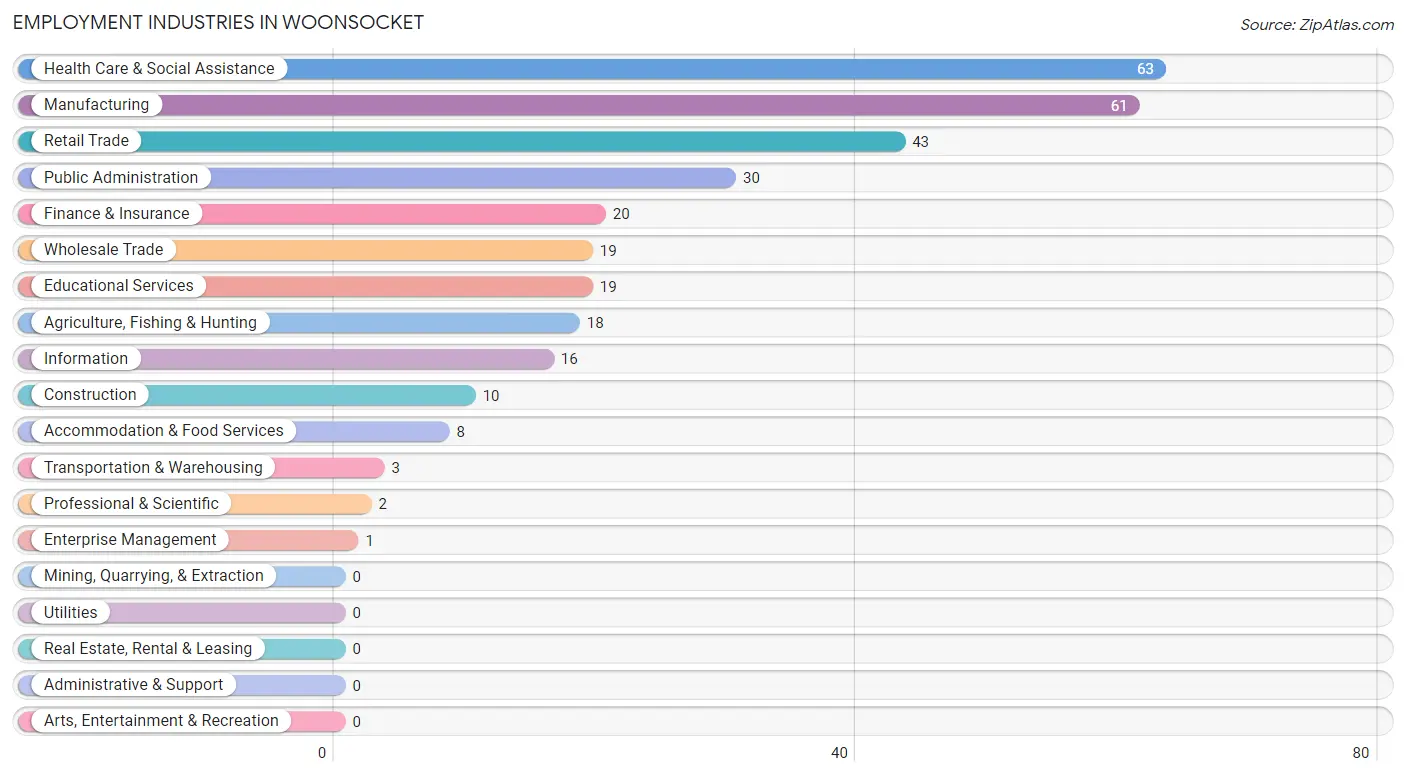
Employment Industries in Woonsocket
The major employment industries in Woonsocket include Health Care & Social Assistance (63 | 19.0%), Manufacturing (61 | 18.4%), Retail Trade (43 | 13.0%), Public Administration (30 | 9.1%), and Finance & Insurance (20 | 6.0%).
Employment Industries by Sex in Woonsocket
The Woonsocket industries that see more men than women are Agriculture, Fishing & Hunting (100.0%), Wholesale Trade (100.0%), and Transportation & Warehousing (100.0%), whereas the industries that tend to have a higher number of women are Finance & Insurance (100.0%), Professional & Scientific (100.0%), and Enterprise Management (100.0%).
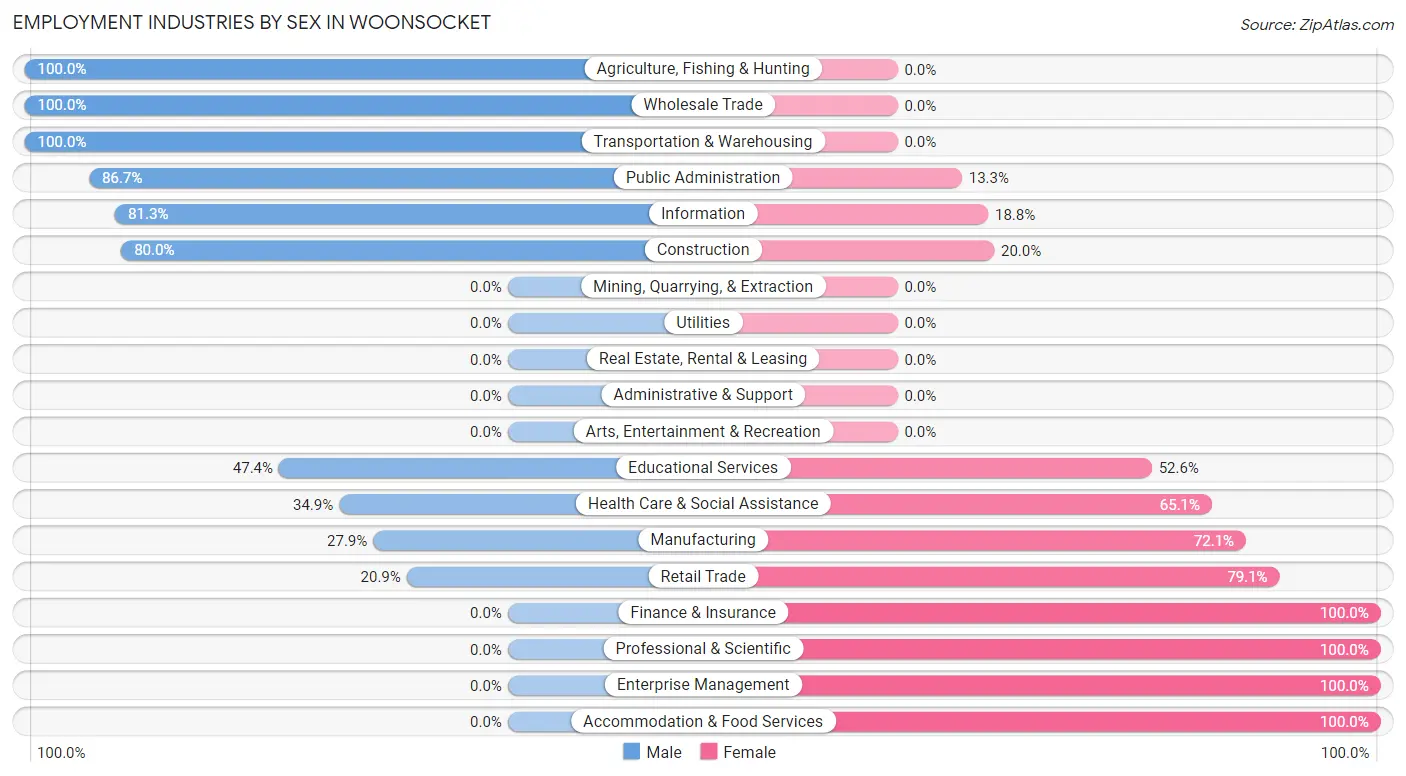
| Industry | Male | Female |
| Agriculture, Fishing & Hunting | 18 (100.0%) | 0 (0.0%) |
| Mining, Quarrying, & Extraction | 0 (0.0%) | 0 (0.0%) |
| Construction | 8 (80.0%) | 2 (20.0%) |
| Manufacturing | 17 (27.9%) | 44 (72.1%) |
| Wholesale Trade | 19 (100.0%) | 0 (0.0%) |
| Retail Trade | 9 (20.9%) | 34 (79.1%) |
| Transportation & Warehousing | 3 (100.0%) | 0 (0.0%) |
| Utilities | 0 (0.0%) | 0 (0.0%) |
| Information | 13 (81.2%) | 3 (18.8%) |
| Finance & Insurance | 0 (0.0%) | 20 (100.0%) |
| Real Estate, Rental & Leasing | 0 (0.0%) | 0 (0.0%) |
| Professional & Scientific | 0 (0.0%) | 2 (100.0%) |
| Enterprise Management | 0 (0.0%) | 1 (100.0%) |
| Administrative & Support | 0 (0.0%) | 0 (0.0%) |
| Educational Services | 9 (47.4%) | 10 (52.6%) |
| Health Care & Social Assistance | 22 (34.9%) | 41 (65.1%) |
| Arts, Entertainment & Recreation | 0 (0.0%) | 0 (0.0%) |
| Accommodation & Food Services | 0 (0.0%) | 8 (100.0%) |
| Public Administration | 26 (86.7%) | 4 (13.3%) |
| Total | 157 (47.4%) | 174 (52.6%) |
Education in Woonsocket
School Enrollment in Woonsocket
The most common levels of schooling among the 146 students in Woonsocket are high school (49 | 33.6%), middle school (37 | 25.3%), and nursery / preschool (19 | 13.0%).
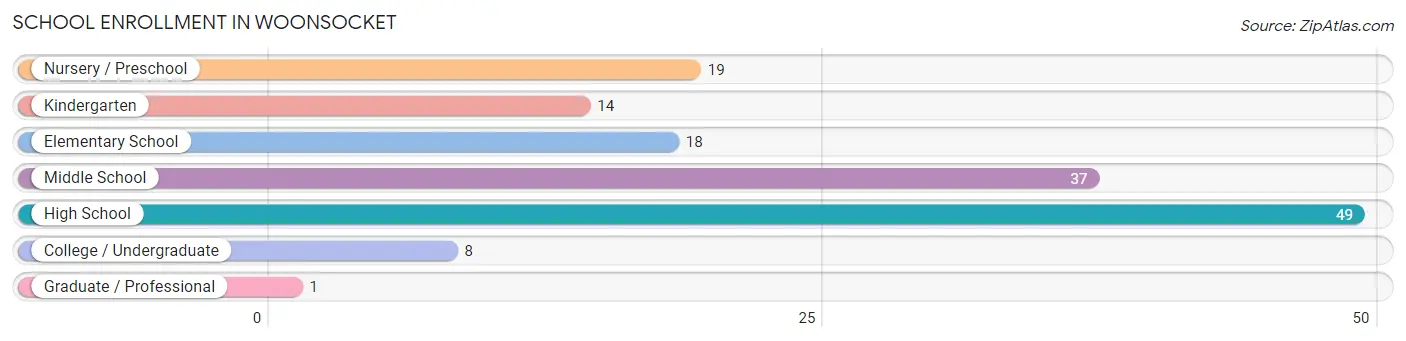
| School Level | # Students | % Students |
| Nursery / Preschool | 19 | 13.0% |
| Kindergarten | 14 | 9.6% |
| Elementary School | 18 | 12.3% |
| Middle School | 37 | 25.3% |
| High School | 49 | 33.6% |
| College / Undergraduate | 8 | 5.5% |
| Graduate / Professional | 1 | 0.7% |
| Total | 146 | 100.0% |
School Enrollment by Age by Funding Source in Woonsocket
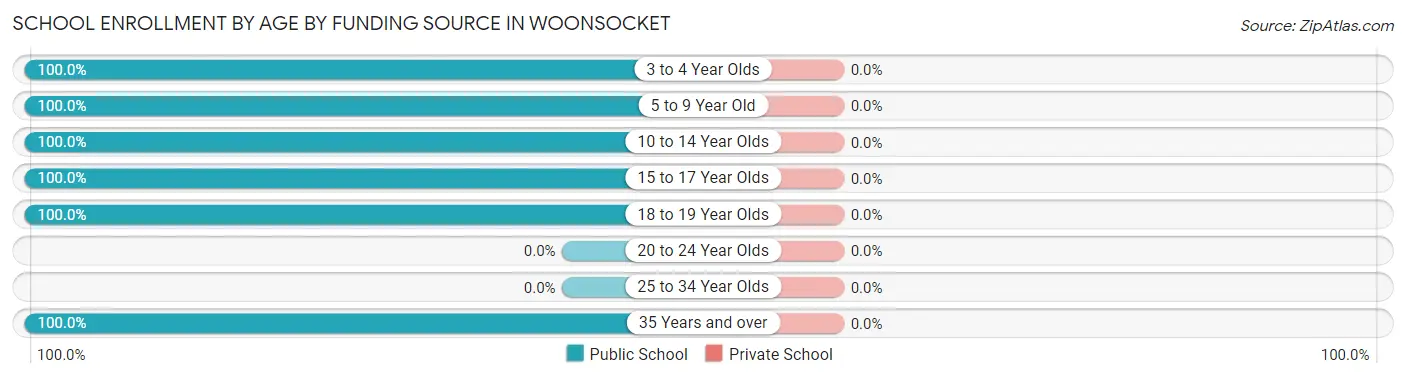
| Age Bracket | Public School | Private School |
| 3 to 4 Year Olds | 9 (100.0%) | 0 (0.0%) |
| 5 to 9 Year Old | 42 (100.0%) | 0 (0.0%) |
| 10 to 14 Year Olds | 42 (100.0%) | 0 (0.0%) |
| 15 to 17 Year Olds | 27 (100.0%) | 0 (0.0%) |
| 18 to 19 Year Olds | 25 (100.0%) | 0 (0.0%) |
| 20 to 24 Year Olds | 0 (0.0%) | 0 (0.0%) |
| 25 to 34 Year Olds | 0 (0.0%) | 0 (0.0%) |
| 35 Years and over | 1 (100.0%) | 0 (0.0%) |
| Total | 146 (100.0%) | 0 (0.0%) |
Educational Attainment by Field of Study in Woonsocket
Education (42 | 40.0%), arts & humanities (19 | 18.1%), science & technology (14 | 13.3%), computers & mathematics (10 | 9.5%), and bio, nature & agricultural (5 | 4.8%) are the most common fields of study among 105 individuals in Woonsocket who have obtained a bachelor's degree or higher.
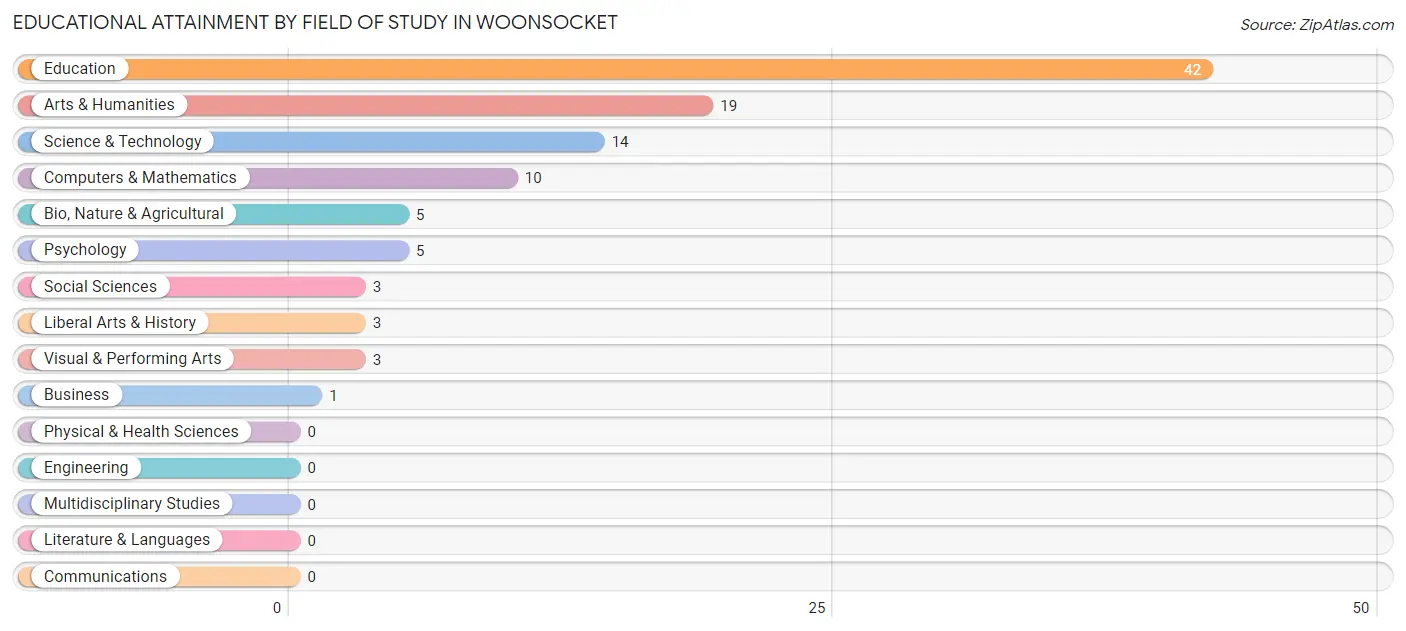
| Field of Study | # Graduates | % Graduates |
| Computers & Mathematics | 10 | 9.5% |
| Bio, Nature & Agricultural | 5 | 4.8% |
| Physical & Health Sciences | 0 | 0.0% |
| Psychology | 5 | 4.8% |
| Social Sciences | 3 | 2.9% |
| Engineering | 0 | 0.0% |
| Multidisciplinary Studies | 0 | 0.0% |
| Science & Technology | 14 | 13.3% |
| Business | 1 | 0.9% |
| Education | 42 | 40.0% |
| Literature & Languages | 0 | 0.0% |
| Liberal Arts & History | 3 | 2.9% |
| Visual & Performing Arts | 3 | 2.9% |
| Communications | 0 | 0.0% |
| Arts & Humanities | 19 | 18.1% |
| Total | 105 | 100.0% |
Transportation & Commute in Woonsocket
Vehicle Availability by Sex in Woonsocket
The most prevalent vehicle ownership categories in Woonsocket are males with 2 vehicles (72, accounting for 46.5%) and females with 2 vehicles (68, making up 45.9%).
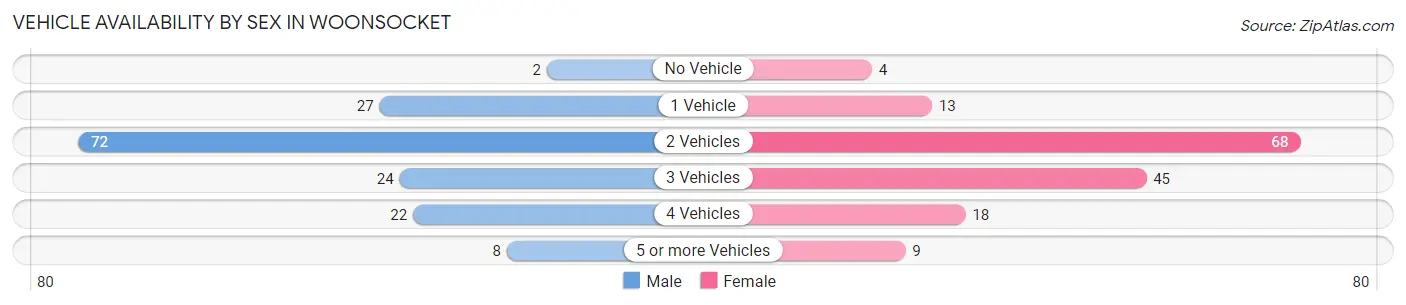
| Vehicles Available | Male | Female |
| No Vehicle | 2 (1.3%) | 4 (2.5%) |
| 1 Vehicle | 27 (17.4%) | 13 (8.3%) |
| 2 Vehicles | 72 (46.5%) | 68 (43.3%) |
| 3 Vehicles | 24 (15.5%) | 45 (28.7%) |
| 4 Vehicles | 22 (14.2%) | 18 (11.5%) |
| 5 or more Vehicles | 8 (5.2%) | 9 (5.7%) |
| Total | 155 (100.0%) | 157 (100.0%) |
Commute Time in Woonsocket
The most frequently occuring commute durations in Woonsocket are 5 to 9 minutes (150 commuters, 50.3%), less than 5 minutes (46 commuters, 15.4%), and 35 to 39 minutes (22 commuters, 7.4%).
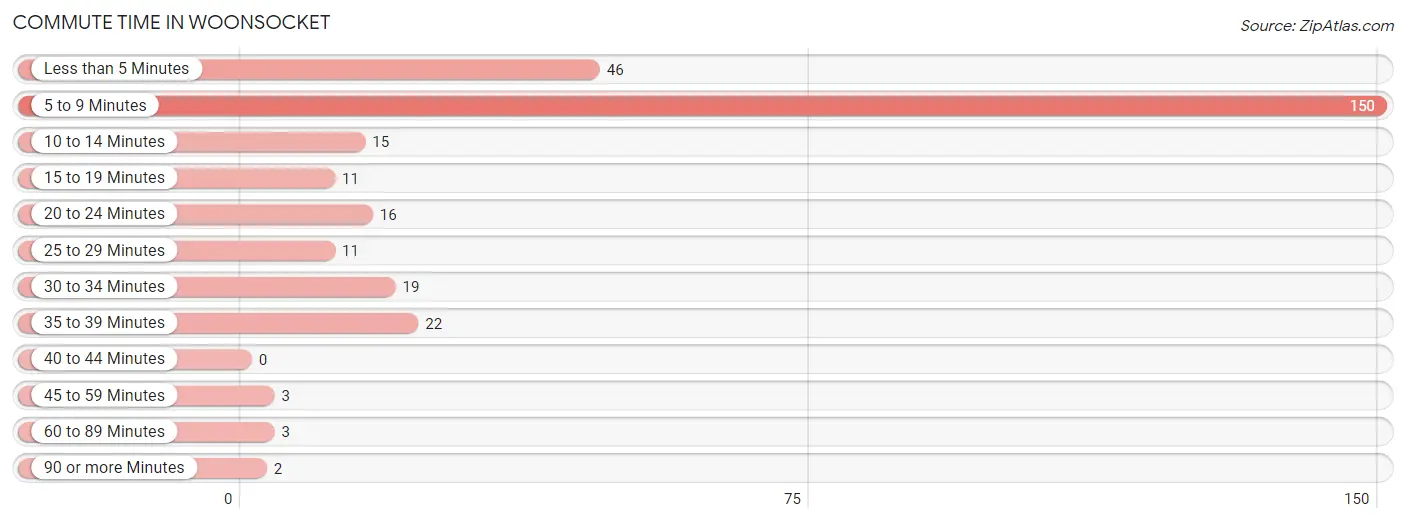
| Commute Time | # Commuters | % Commuters |
| Less than 5 Minutes | 46 | 15.4% |
| 5 to 9 Minutes | 150 | 50.3% |
| 10 to 14 Minutes | 15 | 5.0% |
| 15 to 19 Minutes | 11 | 3.7% |
| 20 to 24 Minutes | 16 | 5.4% |
| 25 to 29 Minutes | 11 | 3.7% |
| 30 to 34 Minutes | 19 | 6.4% |
| 35 to 39 Minutes | 22 | 7.4% |
| 40 to 44 Minutes | 0 | 0.0% |
| 45 to 59 Minutes | 3 | 1.0% |
| 60 to 89 Minutes | 3 | 1.0% |
| 90 or more Minutes | 2 | 0.7% |
Commute Time by Sex in Woonsocket
The most common commute times in Woonsocket are 5 to 9 minutes (68 commuters, 43.9%) for males and 5 to 9 minutes (82 commuters, 57.3%) for females.
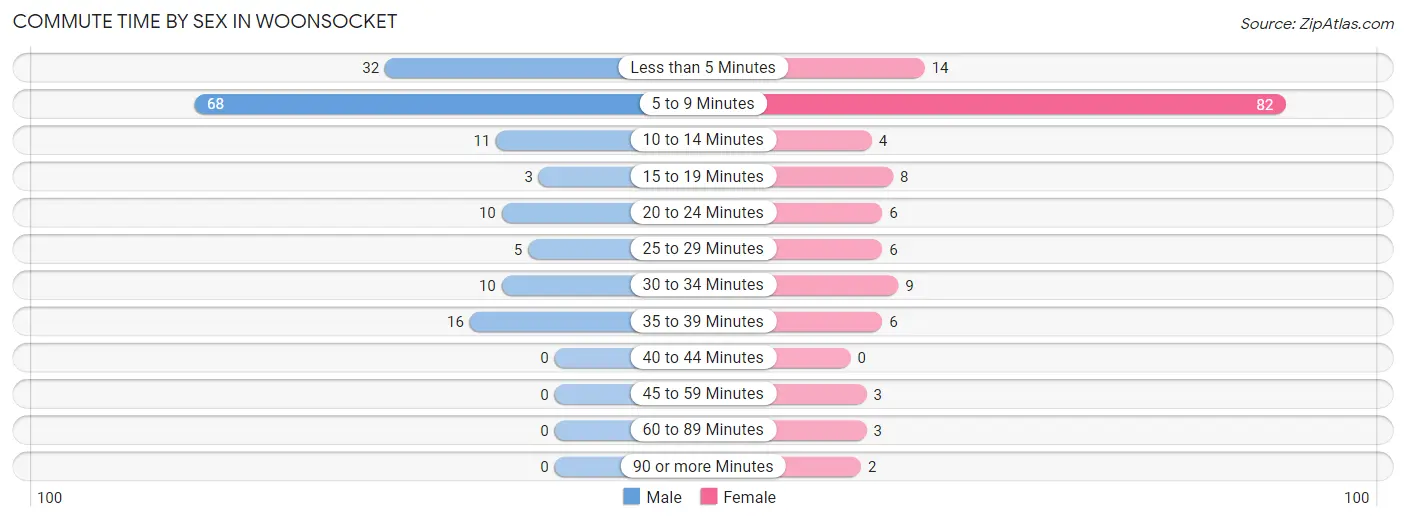
| Commute Time | Male | Female |
| Less than 5 Minutes | 32 (20.6%) | 14 (9.8%) |
| 5 to 9 Minutes | 68 (43.9%) | 82 (57.3%) |
| 10 to 14 Minutes | 11 (7.1%) | 4 (2.8%) |
| 15 to 19 Minutes | 3 (1.9%) | 8 (5.6%) |
| 20 to 24 Minutes | 10 (6.5%) | 6 (4.2%) |
| 25 to 29 Minutes | 5 (3.2%) | 6 (4.2%) |
| 30 to 34 Minutes | 10 (6.5%) | 9 (6.3%) |
| 35 to 39 Minutes | 16 (10.3%) | 6 (4.2%) |
| 40 to 44 Minutes | 0 (0.0%) | 0 (0.0%) |
| 45 to 59 Minutes | 0 (0.0%) | 3 (2.1%) |
| 60 to 89 Minutes | 0 (0.0%) | 3 (2.1%) |
| 90 or more Minutes | 0 (0.0%) | 2 (1.4%) |
Time of Departure to Work by Sex in Woonsocket
The most frequent times of departure to work in Woonsocket are 7:30 AM to 7:59 AM (50, 32.3%) for males and 7:30 AM to 7:59 AM (44, 30.8%) for females.
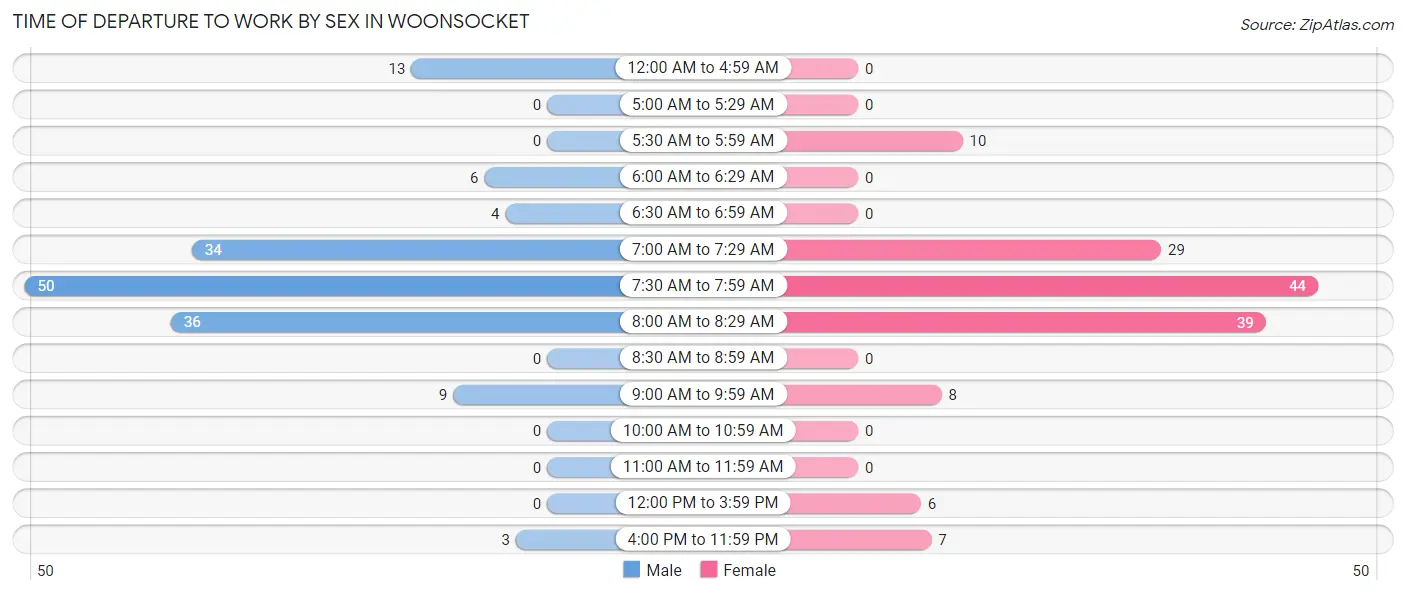
| Time of Departure | Male | Female |
| 12:00 AM to 4:59 AM | 13 (8.4%) | 0 (0.0%) |
| 5:00 AM to 5:29 AM | 0 (0.0%) | 0 (0.0%) |
| 5:30 AM to 5:59 AM | 0 (0.0%) | 10 (7.0%) |
| 6:00 AM to 6:29 AM | 6 (3.9%) | 0 (0.0%) |
| 6:30 AM to 6:59 AM | 4 (2.6%) | 0 (0.0%) |
| 7:00 AM to 7:29 AM | 34 (21.9%) | 29 (20.3%) |
| 7:30 AM to 7:59 AM | 50 (32.3%) | 44 (30.8%) |
| 8:00 AM to 8:29 AM | 36 (23.2%) | 39 (27.3%) |
| 8:30 AM to 8:59 AM | 0 (0.0%) | 0 (0.0%) |
| 9:00 AM to 9:59 AM | 9 (5.8%) | 8 (5.6%) |
| 10:00 AM to 10:59 AM | 0 (0.0%) | 0 (0.0%) |
| 11:00 AM to 11:59 AM | 0 (0.0%) | 0 (0.0%) |
| 12:00 PM to 3:59 PM | 0 (0.0%) | 6 (4.2%) |
| 4:00 PM to 11:59 PM | 3 (1.9%) | 7 (4.9%) |
| Total | 155 (100.0%) | 143 (100.0%) |
Housing Occupancy in Woonsocket
Occupancy by Ownership in Woonsocket
Of the total 299 dwellings in Woonsocket, owner-occupied units account for 197 (65.9%), while renter-occupied units make up 102 (34.1%).
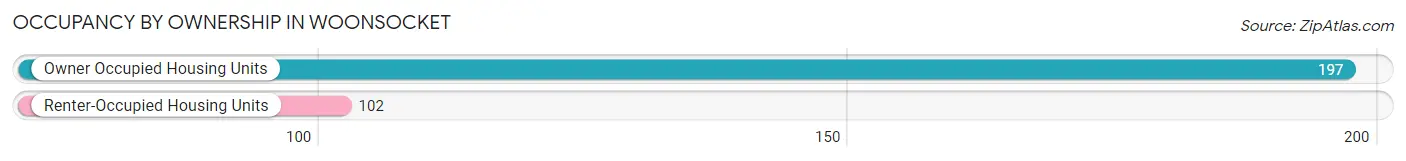
| Occupancy | # Housing Units | % Housing Units |
| Owner Occupied Housing Units | 197 | 65.9% |
| Renter-Occupied Housing Units | 102 | 34.1% |
| Total Occupied Housing Units | 299 | 100.0% |
Occupancy by Household Size in Woonsocket
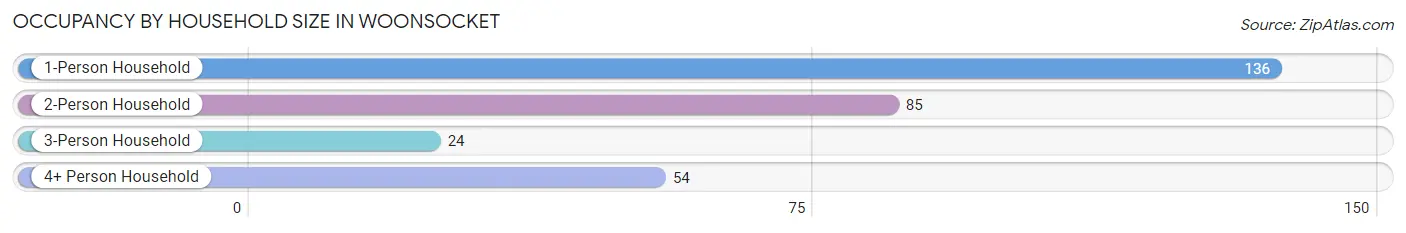
| Household Size | # Housing Units | % Housing Units |
| 1-Person Household | 136 | 45.5% |
| 2-Person Household | 85 | 28.4% |
| 3-Person Household | 24 | 8.0% |
| 4+ Person Household | 54 | 18.1% |
| Total Housing Units | 299 | 100.0% |
Occupancy by Ownership by Household Size in Woonsocket
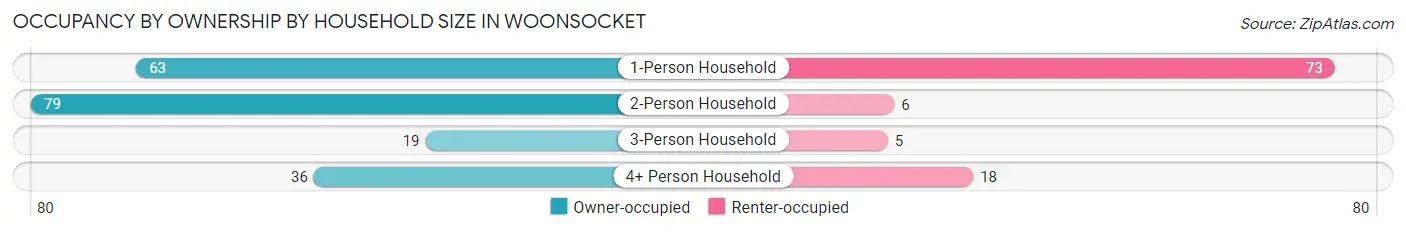
| Household Size | Owner-occupied | Renter-occupied |
| 1-Person Household | 63 (46.3%) | 73 (53.7%) |
| 2-Person Household | 79 (92.9%) | 6 (7.1%) |
| 3-Person Household | 19 (79.2%) | 5 (20.8%) |
| 4+ Person Household | 36 (66.7%) | 18 (33.3%) |
| Total Housing Units | 197 (65.9%) | 102 (34.1%) |
Occupancy by Educational Attainment in Woonsocket
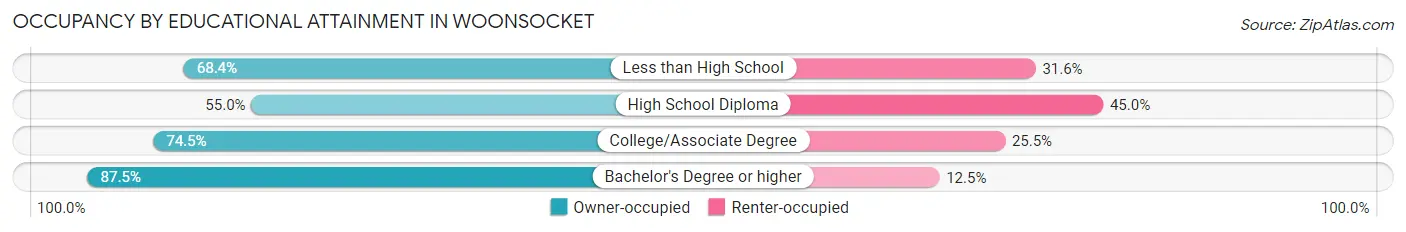
| Household Size | Owner-occupied | Renter-occupied |
| Less than High School | 13 (68.4%) | 6 (31.6%) |
| High School Diploma | 93 (55.0%) | 76 (45.0%) |
| College/Associate Degree | 35 (74.5%) | 12 (25.5%) |
| Bachelor's Degree or higher | 56 (87.5%) | 8 (12.5%) |
Occupancy by Age of Householder in Woonsocket
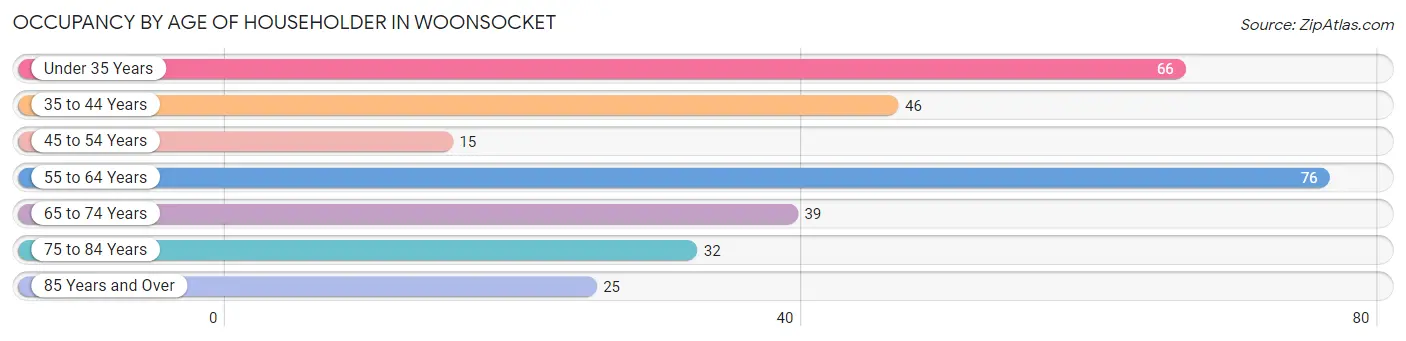
| Age Bracket | # Households | % Households |
| Under 35 Years | 66 | 22.1% |
| 35 to 44 Years | 46 | 15.4% |
| 45 to 54 Years | 15 | 5.0% |
| 55 to 64 Years | 76 | 25.4% |
| 65 to 74 Years | 39 | 13.0% |
| 75 to 84 Years | 32 | 10.7% |
| 85 Years and Over | 25 | 8.4% |
| Total | 299 | 100.0% |
Housing Finances in Woonsocket
Median Income by Occupancy in Woonsocket
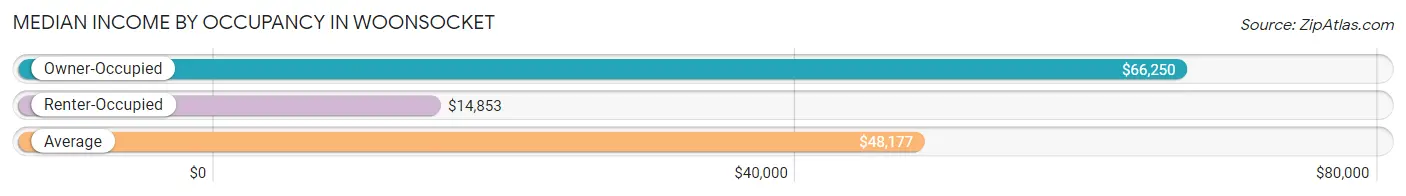
| Occupancy Type | # Households | Median Income |
| Owner-Occupied | 197 (65.9%) | $66,250 |
| Renter-Occupied | 102 (34.1%) | $14,853 |
| Average | 299 (100.0%) | $48,177 |
Occupancy by Householder Income Bracket in Woonsocket
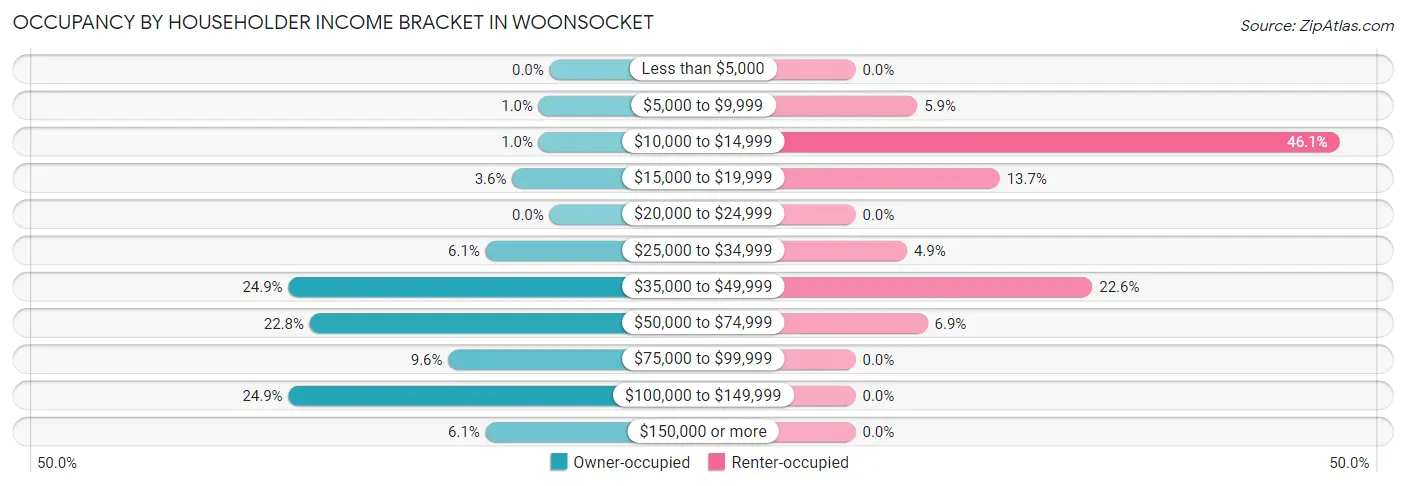
| Income Bracket | Owner-occupied | Renter-occupied |
| Less than $5,000 | 0 (0.0%) | 0 (0.0%) |
| $5,000 to $9,999 | 2 (1.0%) | 6 (5.9%) |
| $10,000 to $14,999 | 2 (1.0%) | 47 (46.1%) |
| $15,000 to $19,999 | 7 (3.5%) | 14 (13.7%) |
| $20,000 to $24,999 | 0 (0.0%) | 0 (0.0%) |
| $25,000 to $34,999 | 12 (6.1%) | 5 (4.9%) |
| $35,000 to $49,999 | 49 (24.9%) | 23 (22.6%) |
| $50,000 to $74,999 | 45 (22.8%) | 7 (6.9%) |
| $75,000 to $99,999 | 19 (9.6%) | 0 (0.0%) |
| $100,000 to $149,999 | 49 (24.9%) | 0 (0.0%) |
| $150,000 or more | 12 (6.1%) | 0 (0.0%) |
| Total | 197 (100.0%) | 102 (100.0%) |
Monthly Housing Cost Tiers in Woonsocket
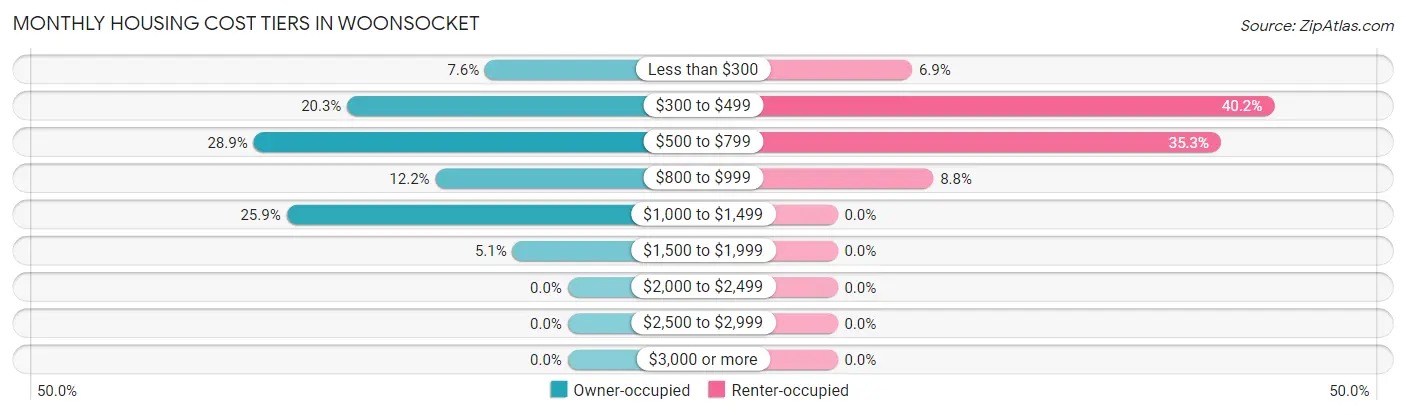
| Monthly Cost | Owner-occupied | Renter-occupied |
| Less than $300 | 15 (7.6%) | 7 (6.9%) |
| $300 to $499 | 40 (20.3%) | 41 (40.2%) |
| $500 to $799 | 57 (28.9%) | 36 (35.3%) |
| $800 to $999 | 24 (12.2%) | 9 (8.8%) |
| $1,000 to $1,499 | 51 (25.9%) | 0 (0.0%) |
| $1,500 to $1,999 | 10 (5.1%) | 0 (0.0%) |
| $2,000 to $2,499 | 0 (0.0%) | 0 (0.0%) |
| $2,500 to $2,999 | 0 (0.0%) | 0 (0.0%) |
| $3,000 or more | 0 (0.0%) | 0 (0.0%) |
| Total | 197 (100.0%) | 102 (100.0%) |
Physical Housing Characteristics in Woonsocket
Housing Structures in Woonsocket
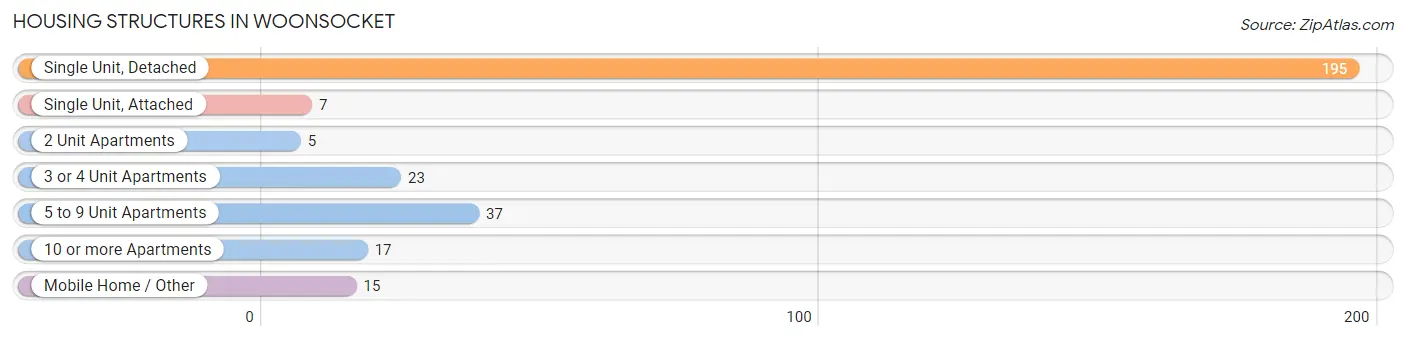
| Structure Type | # Housing Units | % Housing Units |
| Single Unit, Detached | 195 | 65.2% |
| Single Unit, Attached | 7 | 2.3% |
| 2 Unit Apartments | 5 | 1.7% |
| 3 or 4 Unit Apartments | 23 | 7.7% |
| 5 to 9 Unit Apartments | 37 | 12.4% |
| 10 or more Apartments | 17 | 5.7% |
| Mobile Home / Other | 15 | 5.0% |
| Total | 299 | 100.0% |
Housing Structures by Occupancy in Woonsocket
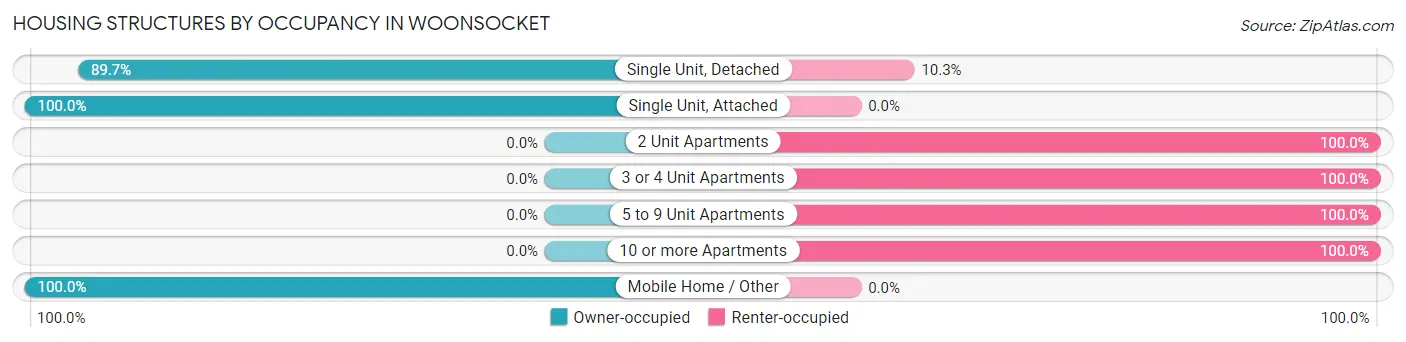
| Structure Type | Owner-occupied | Renter-occupied |
| Single Unit, Detached | 175 (89.7%) | 20 (10.3%) |
| Single Unit, Attached | 7 (100.0%) | 0 (0.0%) |
| 2 Unit Apartments | 0 (0.0%) | 5 (100.0%) |
| 3 or 4 Unit Apartments | 0 (0.0%) | 23 (100.0%) |
| 5 to 9 Unit Apartments | 0 (0.0%) | 37 (100.0%) |
| 10 or more Apartments | 0 (0.0%) | 17 (100.0%) |
| Mobile Home / Other | 15 (100.0%) | 0 (0.0%) |
| Total | 197 (65.9%) | 102 (34.1%) |
Housing Structures by Number of Rooms in Woonsocket
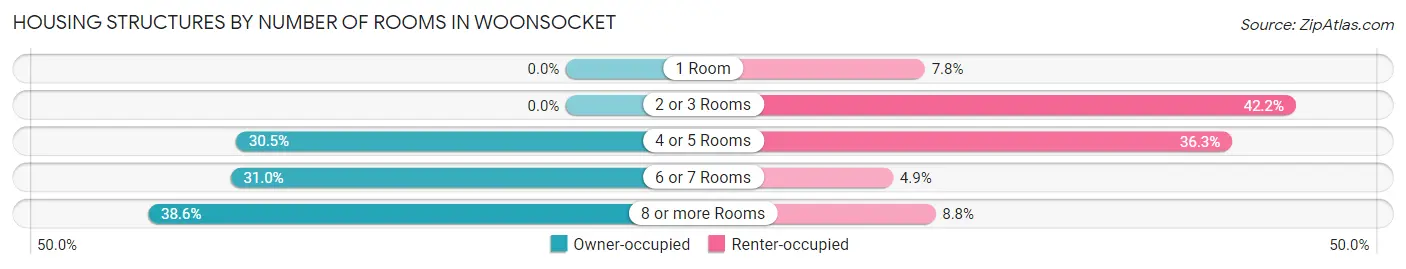
| Number of Rooms | Owner-occupied | Renter-occupied |
| 1 Room | 0 (0.0%) | 8 (7.8%) |
| 2 or 3 Rooms | 0 (0.0%) | 43 (42.2%) |
| 4 or 5 Rooms | 60 (30.5%) | 37 (36.3%) |
| 6 or 7 Rooms | 61 (31.0%) | 5 (4.9%) |
| 8 or more Rooms | 76 (38.6%) | 9 (8.8%) |
| Total | 197 (100.0%) | 102 (100.0%) |
Housing Structure by Heating Type in Woonsocket
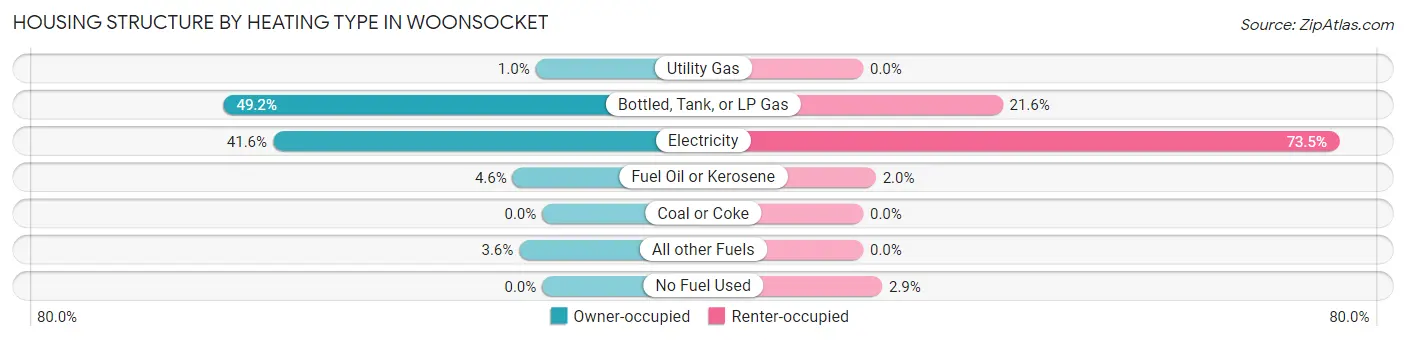
| Heating Type | Owner-occupied | Renter-occupied |
| Utility Gas | 2 (1.0%) | 0 (0.0%) |
| Bottled, Tank, or LP Gas | 97 (49.2%) | 22 (21.6%) |
| Electricity | 82 (41.6%) | 75 (73.5%) |
| Fuel Oil or Kerosene | 9 (4.6%) | 2 (2.0%) |
| Coal or Coke | 0 (0.0%) | 0 (0.0%) |
| All other Fuels | 7 (3.5%) | 0 (0.0%) |
| No Fuel Used | 0 (0.0%) | 3 (2.9%) |
| Total | 197 (100.0%) | 102 (100.0%) |
Household Vehicle Usage in Woonsocket
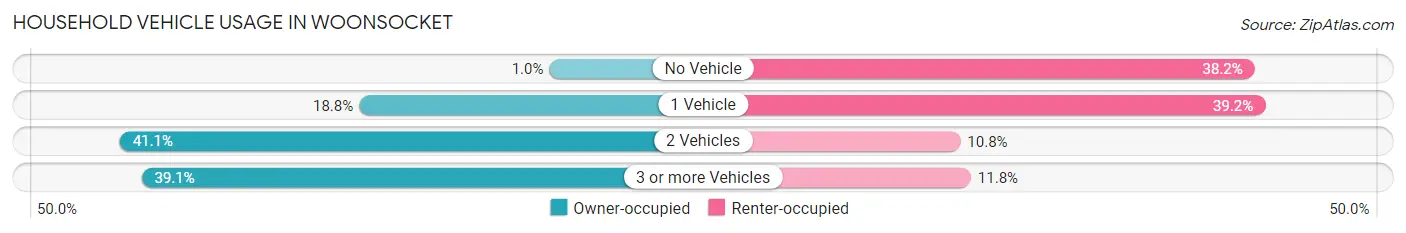
| Vehicles per Household | Owner-occupied | Renter-occupied |
| No Vehicle | 2 (1.0%) | 39 (38.2%) |
| 1 Vehicle | 37 (18.8%) | 40 (39.2%) |
| 2 Vehicles | 81 (41.1%) | 11 (10.8%) |
| 3 or more Vehicles | 77 (39.1%) | 12 (11.8%) |
| Total | 197 (100.0%) | 102 (100.0%) |
Real Estate & Mortgages in Woonsocket
Real Estate and Mortgage Overview in Woonsocket
| Characteristic | Without Mortgage | With Mortgage |
| Housing Units | 110 | 87 |
| Median Property Value | $78,000 | $85,300 |
| Median Household Income | $65,833 | $2 |
| Monthly Housing Costs | $500 | $0 |
| Real Estate Taxes | $1,477 | $8 |
Property Value by Mortgage Status in Woonsocket
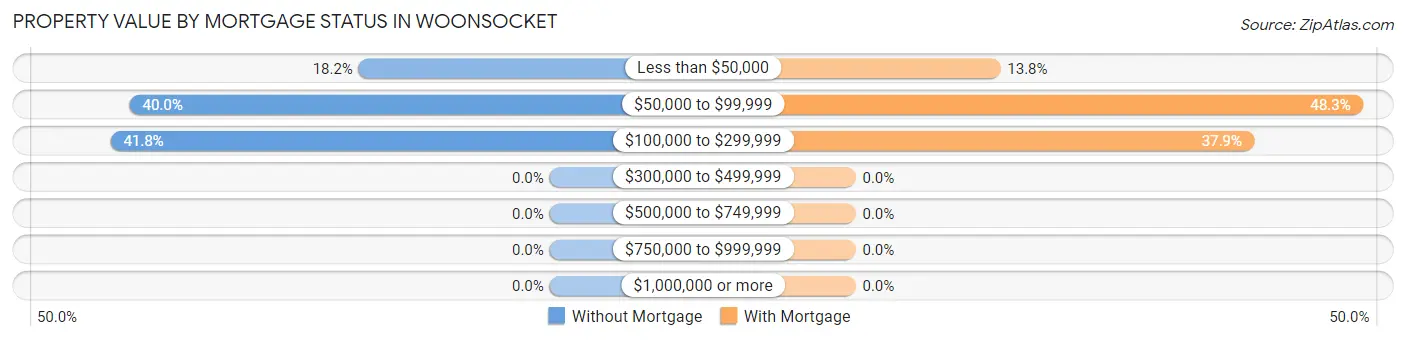
| Property Value | Without Mortgage | With Mortgage |
| Less than $50,000 | 20 (18.2%) | 12 (13.8%) |
| $50,000 to $99,999 | 44 (40.0%) | 42 (48.3%) |
| $100,000 to $299,999 | 46 (41.8%) | 33 (37.9%) |
| $300,000 to $499,999 | 0 (0.0%) | 0 (0.0%) |
| $500,000 to $749,999 | 0 (0.0%) | 0 (0.0%) |
| $750,000 to $999,999 | 0 (0.0%) | 0 (0.0%) |
| $1,000,000 or more | 0 (0.0%) | 0 (0.0%) |
| Total | 110 (100.0%) | 87 (100.0%) |
Household Income by Mortgage Status in Woonsocket
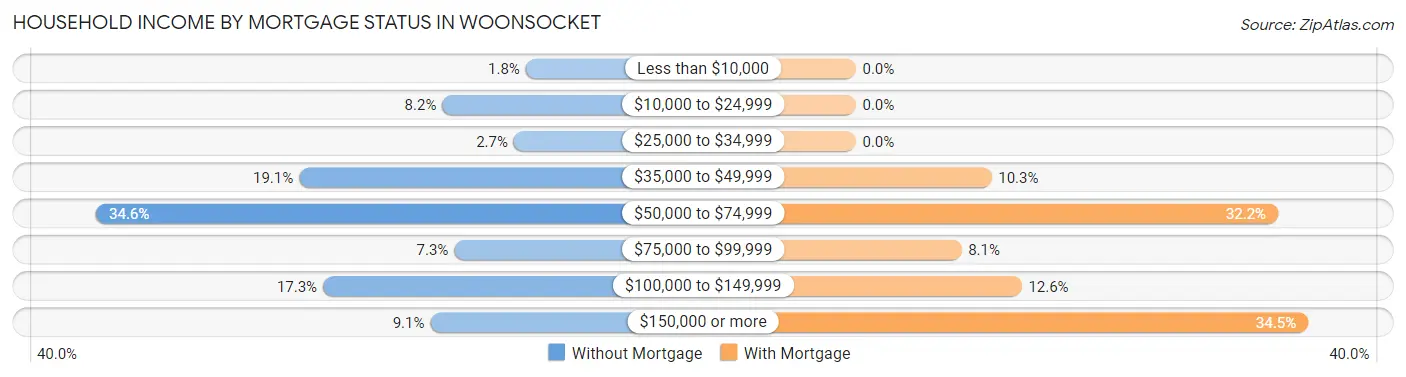
| Household Income | Without Mortgage | With Mortgage |
| Less than $10,000 | 2 (1.8%) | 0 (0.0%) |
| $10,000 to $24,999 | 9 (8.2%) | 0 (0.0%) |
| $25,000 to $34,999 | 3 (2.7%) | 0 (0.0%) |
| $35,000 to $49,999 | 21 (19.1%) | 9 (10.3%) |
| $50,000 to $74,999 | 38 (34.5%) | 28 (32.2%) |
| $75,000 to $99,999 | 8 (7.3%) | 7 (8.1%) |
| $100,000 to $149,999 | 19 (17.3%) | 11 (12.6%) |
| $150,000 or more | 10 (9.1%) | 30 (34.5%) |
| Total | 110 (100.0%) | 87 (100.0%) |
Property Value to Household Income Ratio in Woonsocket
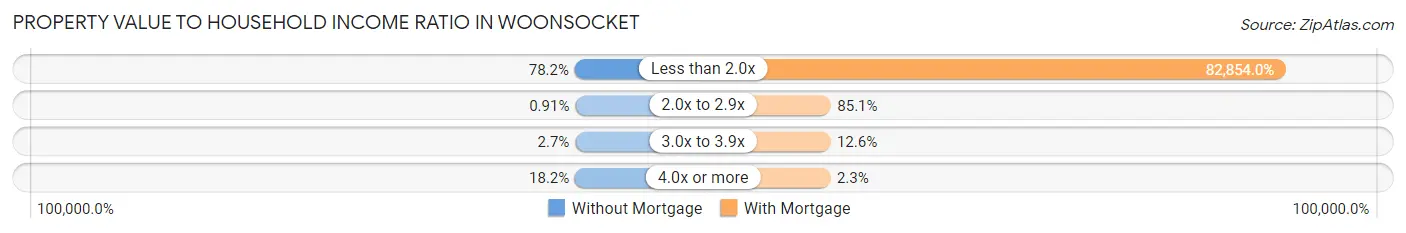
| Value-to-Income Ratio | Without Mortgage | With Mortgage |
| Less than 2.0x | 86 (78.2%) | 72,083 (82,854.0%) |
| 2.0x to 2.9x | 1 (0.9%) | 74 (85.1%) |
| 3.0x to 3.9x | 3 (2.7%) | 11 (12.6%) |
| 4.0x or more | 20 (18.2%) | 2 (2.3%) |
| Total | 110 (100.0%) | 87 (100.0%) |
Real Estate Taxes by Mortgage Status in Woonsocket
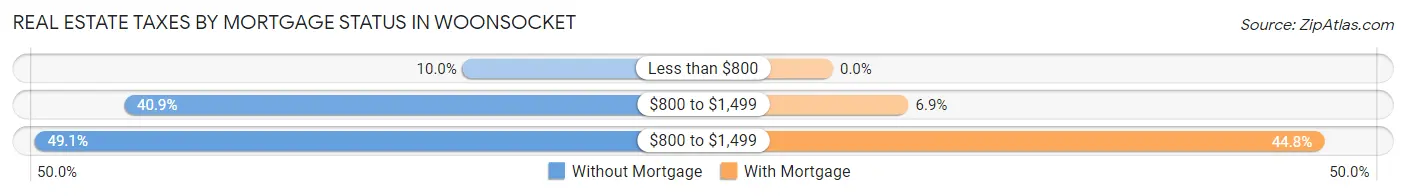
| Property Taxes | Without Mortgage | With Mortgage |
| Less than $800 | 11 (10.0%) | 0 (0.0%) |
| $800 to $1,499 | 45 (40.9%) | 6 (6.9%) |
| $800 to $1,499 | 54 (49.1%) | 39 (44.8%) |
| Total | 110 (100.0%) | 87 (100.0%) |
Health & Disability in Woonsocket
Health Insurance Coverage by Age in Woonsocket
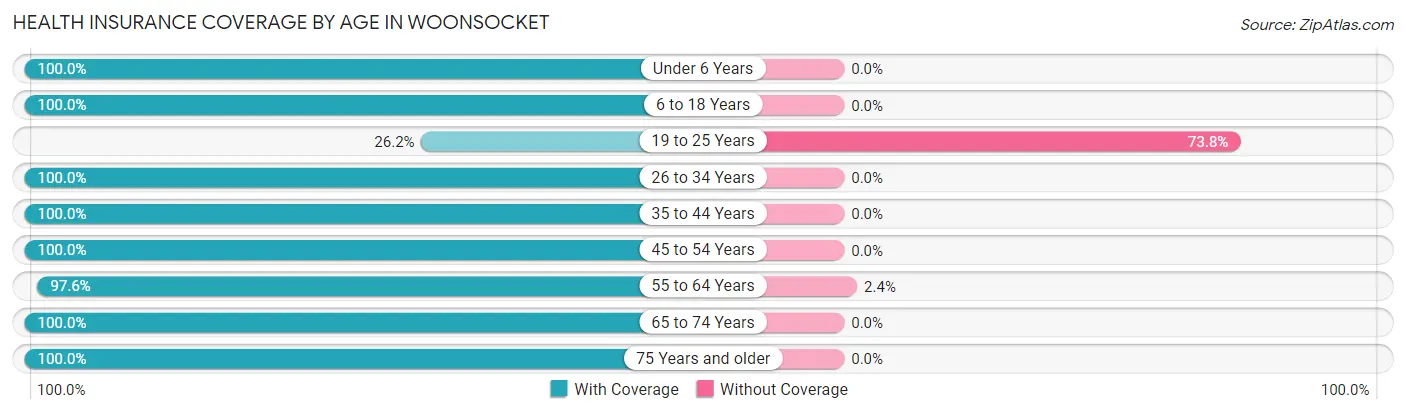
| Age Bracket | With Coverage | Without Coverage |
| Under 6 Years | 93 (100.0%) | 0 (0.0%) |
| 6 to 18 Years | 101 (100.0%) | 0 (0.0%) |
| 19 to 25 Years | 11 (26.2%) | 31 (73.8%) |
| 26 to 34 Years | 64 (100.0%) | 0 (0.0%) |
| 35 to 44 Years | 71 (100.0%) | 0 (0.0%) |
| 45 to 54 Years | 32 (100.0%) | 0 (0.0%) |
| 55 to 64 Years | 122 (97.6%) | 3 (2.4%) |
| 65 to 74 Years | 59 (100.0%) | 0 (0.0%) |
| 75 Years and older | 60 (100.0%) | 0 (0.0%) |
| Total | 613 (94.7%) | 34 (5.3%) |
Health Insurance Coverage by Citizenship Status in Woonsocket
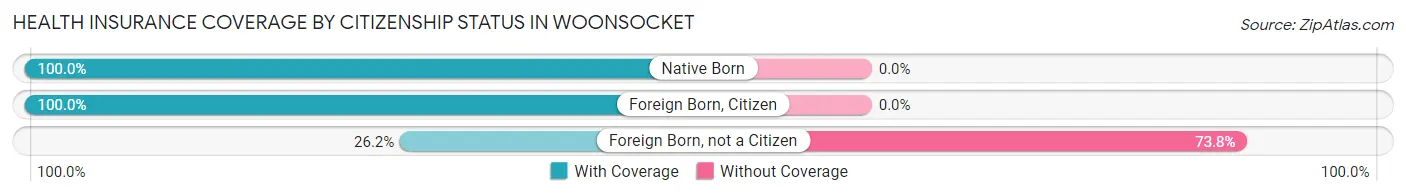
| Citizenship Status | With Coverage | Without Coverage |
| Native Born | 93 (100.0%) | 0 (0.0%) |
| Foreign Born, Citizen | 101 (100.0%) | 0 (0.0%) |
| Foreign Born, not a Citizen | 11 (26.2%) | 31 (73.8%) |
Health Insurance Coverage by Household Income in Woonsocket
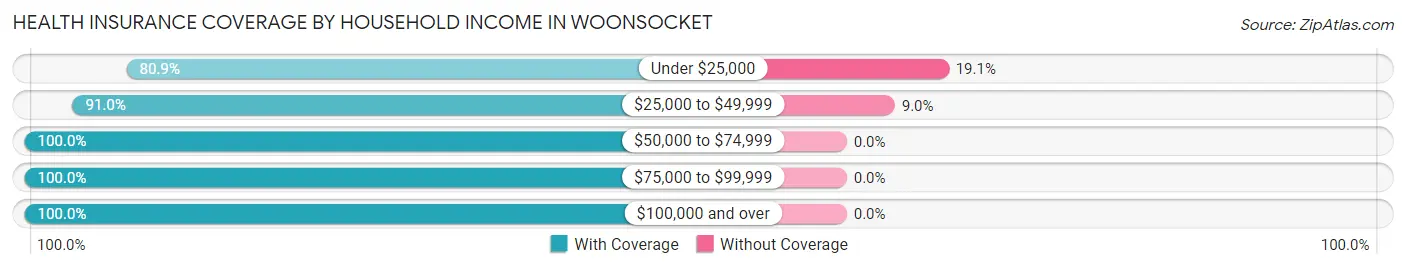
| Household Income | With Coverage | Without Coverage |
| Under $25,000 | 72 (80.9%) | 17 (19.1%) |
| $25,000 to $49,999 | 172 (91.0%) | 17 (9.0%) |
| $50,000 to $74,999 | 92 (100.0%) | 0 (0.0%) |
| $75,000 to $99,999 | 60 (100.0%) | 0 (0.0%) |
| $100,000 and over | 217 (100.0%) | 0 (0.0%) |
Public vs Private Health Insurance Coverage by Age in Woonsocket
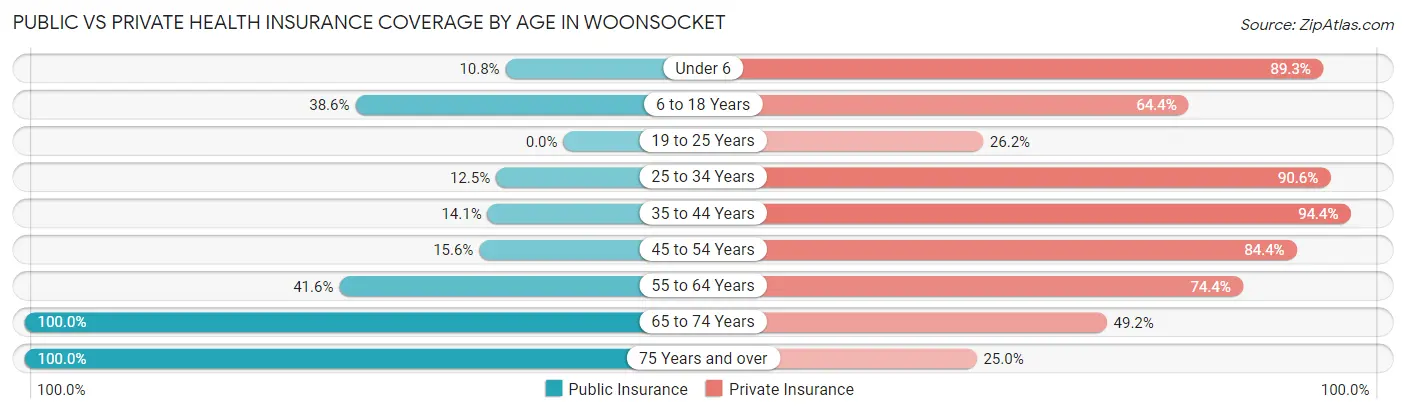
| Age Bracket | Public Insurance | Private Insurance |
| Under 6 | 10 (10.7%) | 83 (89.2%) |
| 6 to 18 Years | 39 (38.6%) | 65 (64.4%) |
| 19 to 25 Years | 0 (0.0%) | 11 (26.2%) |
| 25 to 34 Years | 8 (12.5%) | 58 (90.6%) |
| 35 to 44 Years | 10 (14.1%) | 67 (94.4%) |
| 45 to 54 Years | 5 (15.6%) | 27 (84.4%) |
| 55 to 64 Years | 52 (41.6%) | 93 (74.4%) |
| 65 to 74 Years | 59 (100.0%) | 29 (49.1%) |
| 75 Years and over | 60 (100.0%) | 15 (25.0%) |
| Total | 243 (37.6%) | 448 (69.2%) |
Disability Status by Sex by Age in Woonsocket
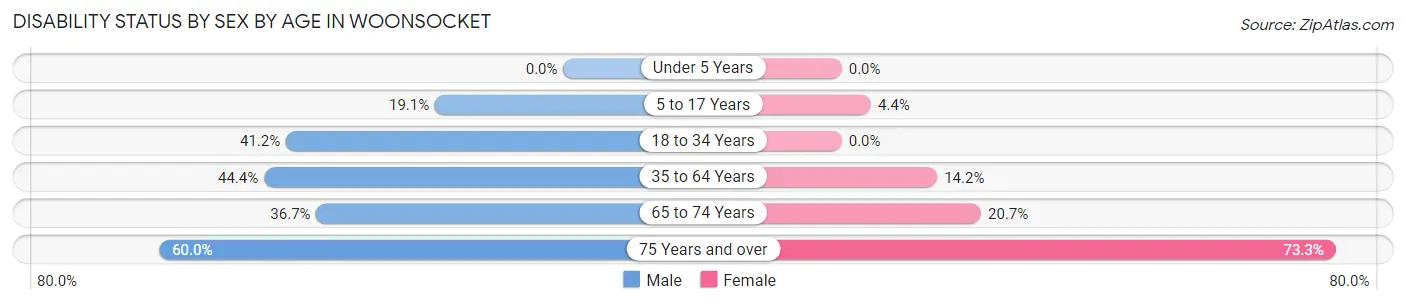
| Age Bracket | Male | Female |
| Under 5 Years | 0 (0.0%) | 0 (0.0%) |
| 5 to 17 Years | 8 (19.1%) | 3 (4.3%) |
| 18 to 34 Years | 21 (41.2%) | 0 (0.0%) |
| 35 to 64 Years | 48 (44.4%) | 17 (14.2%) |
| 65 to 74 Years | 11 (36.7%) | 6 (20.7%) |
| 75 Years and over | 9 (60.0%) | 33 (73.3%) |
Disability Class by Sex by Age in Woonsocket
Disability Class: Hearing Difficulty
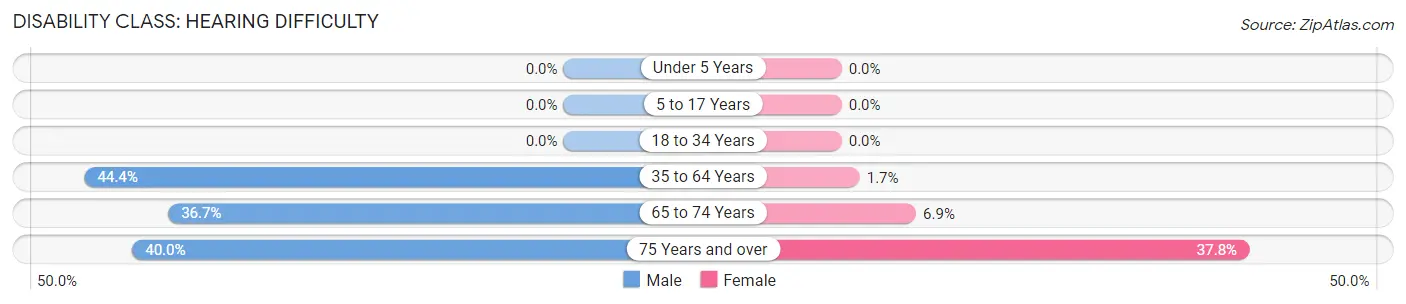
| Age Bracket | Male | Female |
| Under 5 Years | 0 (0.0%) | 0 (0.0%) |
| 5 to 17 Years | 0 (0.0%) | 0 (0.0%) |
| 18 to 34 Years | 0 (0.0%) | 0 (0.0%) |
| 35 to 64 Years | 48 (44.4%) | 2 (1.7%) |
| 65 to 74 Years | 11 (36.7%) | 2 (6.9%) |
| 75 Years and over | 6 (40.0%) | 17 (37.8%) |
Disability Class: Vision Difficulty
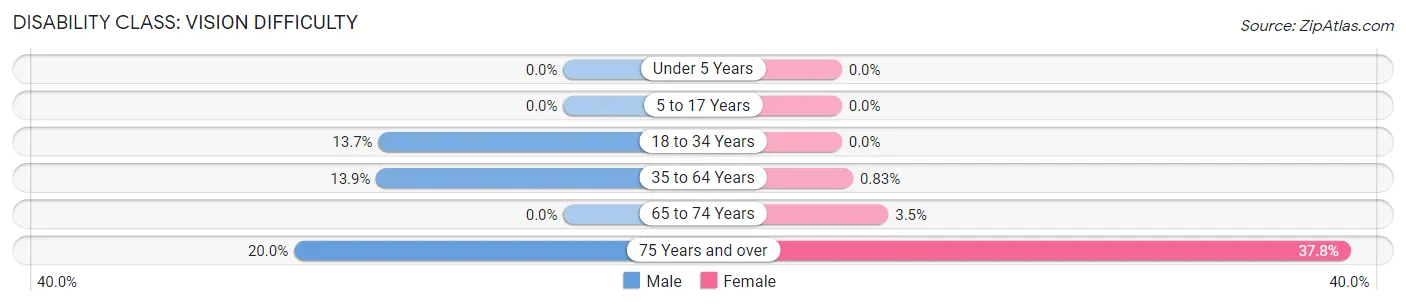
| Age Bracket | Male | Female |
| Under 5 Years | 0 (0.0%) | 0 (0.0%) |
| 5 to 17 Years | 0 (0.0%) | 0 (0.0%) |
| 18 to 34 Years | 7 (13.7%) | 0 (0.0%) |
| 35 to 64 Years | 15 (13.9%) | 1 (0.8%) |
| 65 to 74 Years | 0 (0.0%) | 1 (3.5%) |
| 75 Years and over | 3 (20.0%) | 17 (37.8%) |
Disability Class: Cognitive Difficulty
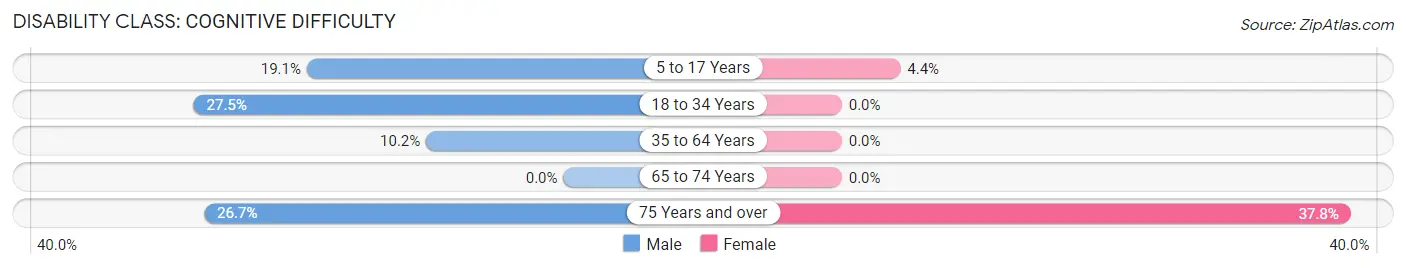
| Age Bracket | Male | Female |
| 5 to 17 Years | 8 (19.1%) | 3 (4.3%) |
| 18 to 34 Years | 14 (27.5%) | 0 (0.0%) |
| 35 to 64 Years | 11 (10.2%) | 0 (0.0%) |
| 65 to 74 Years | 0 (0.0%) | 0 (0.0%) |
| 75 Years and over | 4 (26.7%) | 17 (37.8%) |
Disability Class: Ambulatory Difficulty
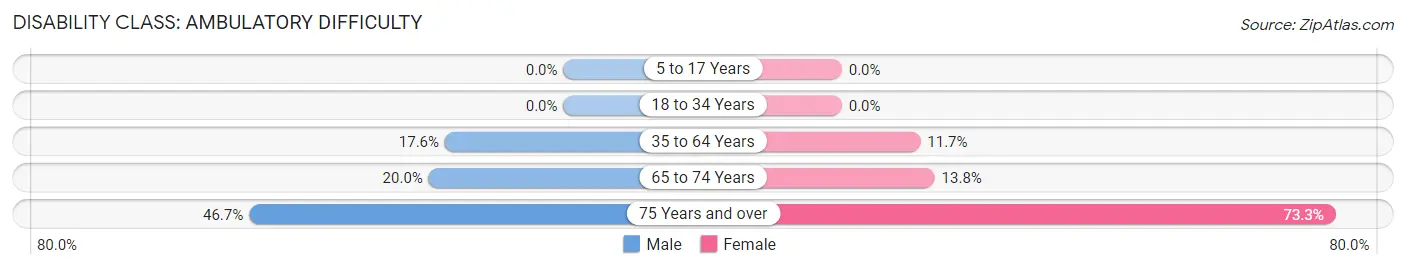
| Age Bracket | Male | Female |
| 5 to 17 Years | 0 (0.0%) | 0 (0.0%) |
| 18 to 34 Years | 0 (0.0%) | 0 (0.0%) |
| 35 to 64 Years | 19 (17.6%) | 14 (11.7%) |
| 65 to 74 Years | 6 (20.0%) | 4 (13.8%) |
| 75 Years and over | 7 (46.7%) | 33 (73.3%) |
Disability Class: Self-Care Difficulty
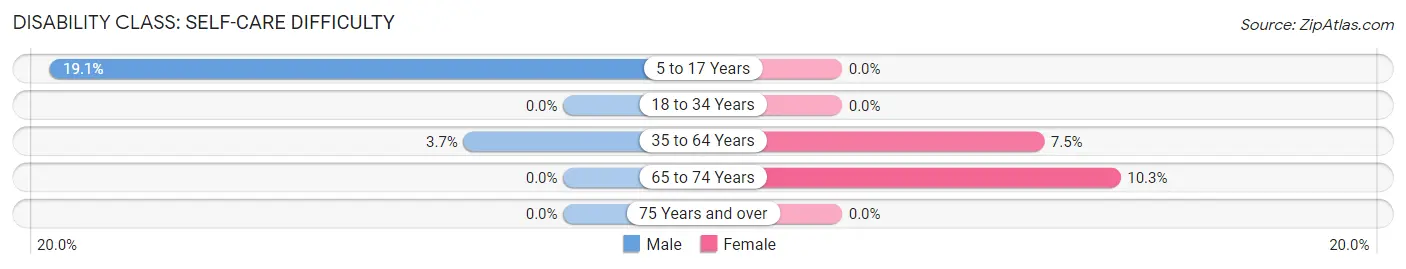
| Age Bracket | Male | Female |
| 5 to 17 Years | 8 (19.1%) | 0 (0.0%) |
| 18 to 34 Years | 0 (0.0%) | 0 (0.0%) |
| 35 to 64 Years | 4 (3.7%) | 9 (7.5%) |
| 65 to 74 Years | 0 (0.0%) | 3 (10.3%) |
| 75 Years and over | 0 (0.0%) | 0 (0.0%) |
Technology Access in Woonsocket
Computing Device Access in Woonsocket
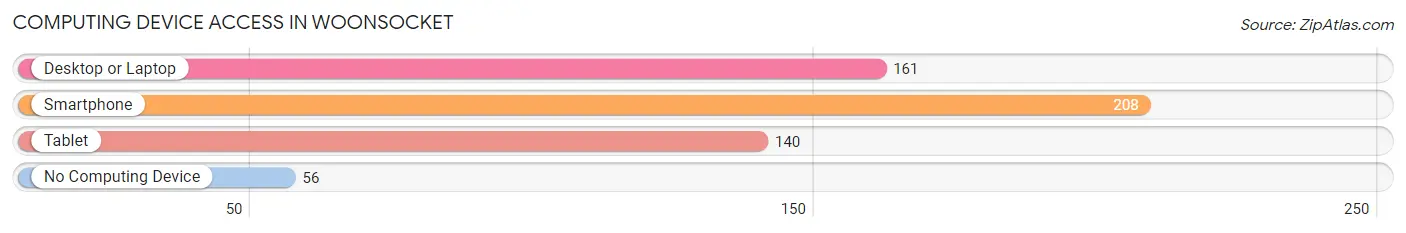
| Device Type | # Households | % Households |
| Desktop or Laptop | 161 | 53.8% |
| Smartphone | 208 | 69.6% |
| Tablet | 140 | 46.8% |
| No Computing Device | 56 | 18.7% |
| Total | 299 | 100.0% |
Internet Access in Woonsocket
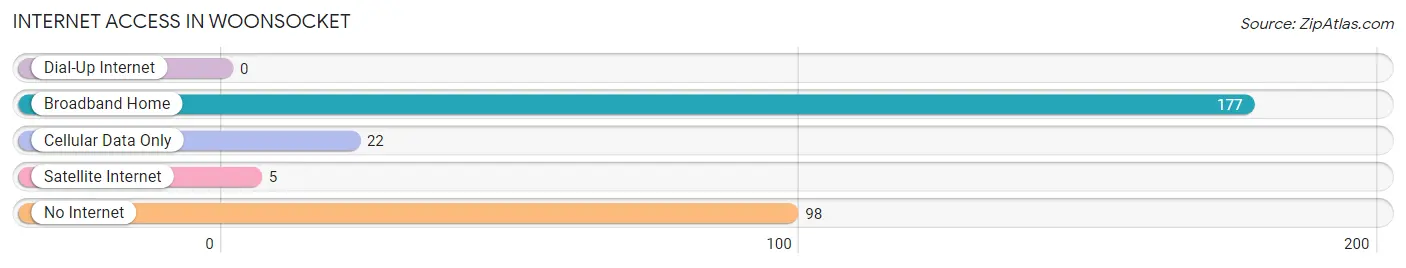
| Internet Type | # Households | % Households |
| Dial-Up Internet | 0 | 0.0% |
| Broadband Home | 177 | 59.2% |
| Cellular Data Only | 22 | 7.4% |
| Satellite Internet | 5 | 1.7% |
| No Internet | 98 | 32.8% |
| Total | 299 | 100.0% |
Woonsocket Summary
Woonsocket, South Dakota is a small town located in Sanborn County in the northeastern part of the state. It is situated on the banks of the Big Sioux River, and is the county seat of Sanborn County. The town was founded in 1881 and was named after the Woonsocket Indians, who were the original inhabitants of the area.
History
The area that is now Woonsocket was originally inhabited by the Woonsocket Indians, a tribe of the Sioux Nation. The Woonsocket Indians were a peaceful tribe, and they lived in the area for centuries before the arrival of European settlers. The first European settlers arrived in the area in the late 1800s, and the town of Woonsocket was officially founded in 1881.
The town was named after the Woonsocket Indians, and it quickly became a thriving agricultural and commercial center. The town was home to several businesses, including a flour mill, a creamery, a lumber yard, and a blacksmith shop. The town also had a post office, a bank, and a hotel.
In the early 1900s, Woonsocket experienced a period of growth and prosperity. The town was home to several churches, a school, and a library. The town also had a movie theater, a bowling alley, and a variety of other businesses.
Geography
Woonsocket is located in the northeastern part of South Dakota, in Sanborn County. It is situated on the banks of the Big Sioux River, and is surrounded by rolling hills and prairies. The town is located about 25 miles from the Minnesota border, and about 50 miles from the Iowa border.
The climate in Woonsocket is generally mild, with hot summers and cold winters. The average temperature in the summer is around 75 degrees Fahrenheit, and the average temperature in the winter is around 25 degrees Fahrenheit.
Economy
The economy of Woonsocket is largely based on agriculture. The town is home to several farms, and the surrounding area is used for growing corn, soybeans, and other crops. The town also has several businesses, including a grocery store, a hardware store, and a variety of other shops.
The town is also home to several manufacturing companies, including a furniture factory and a plastics factory. The town also has a variety of service-based businesses, including a bank, a post office, and a variety of other businesses.
Demographics
As of the 2010 census, the population of Woonsocket was 1,093. The town is predominantly white, with about 95% of the population being white. The town also has a small Hispanic population, with about 4% of the population being Hispanic. The median household income in Woonsocket is $41,250, and the median home value is $90,000.
Woonsocket is a small town with a rich history and a vibrant economy. The town is home to a variety of businesses, and the surrounding area is used for growing crops. The town is also home to a variety of churches, a school, and a library. The town has a population of about 1,093, and the median household income is $41,250.
Common Questions
What is the Total Population of Woonsocket?
Total Population of Woonsocket is 710.
What is the Total Male Population of Woonsocket?
Total Male Population of Woonsocket is 297.
What is the Total Female Population of Woonsocket?
Total Female Population of Woonsocket is 413.
What is the Ratio of Males per 100 Females in Woonsocket?
There are 71.91 Males per 100 Females in Woonsocket.
What is the Ratio of Females per 100 Males in Woonsocket?
There are 139.06 Females per 100 Males in Woonsocket.
What is the Median Population Age in Woonsocket?
Median Population Age in Woonsocket is 42.2 Years.
What is the Average Family Size in Woonsocket
Average Family Size in Woonsocket is 3.1 People.
What is the Average Household Size in Woonsocket
Average Household Size in Woonsocket is 2.2 People.
What is Per Capita Income in Woonsocket?
Per Capita income in Woonsocket is $29,590.
What is the Median Family Income in Woonsocket?
Median Family Income in Woonsocket is $65,938.
What is the Median Household income in Woonsocket?
Median Household Income in Woonsocket is $48,177.
What is Income or Wage Gap in Woonsocket?
Income or Wage Gap in Woonsocket is 23.2%.
Women in Woonsocket earn 76.8 cents for every dollar earned by a man.
What is Inequality or Gini Index in Woonsocket?
Inequality or Gini Index in Woonsocket is 0.44.
How Large is the Labor Force in Woonsocket?
There are 343 People in the Labor Forcein in Woonsocket.
What is the Percentage of People in the Labor Force in Woonsocket?
64.4% of People are in the Labor Force in Woonsocket.
What is the Unemployment Rate in Woonsocket?
Unemployment Rate in Woonsocket is 1.8%.