Freeman, SD
Freeman Map
Freeman Overview
1,580
TOTAL POPULATION
706
MALE POPULATION
874
FEMALE POPULATION
80.78
MALES / 100 FEMALES
123.80
FEMALES / 100 MALES
40.9
MEDIAN AGE
3.3
AVG FAMILY SIZE
2.7
AVG HOUSEHOLD SIZE
$29,829
PER CAPITA INCOME
$93,333
AVG FAMILY INCOME
$61,719
AVG HOUSEHOLD INCOME
37.9%
WAGE / INCOME GAP [ % ]
62.1¢/ $1
WAGE / INCOME GAP [ $ ]
0.40
INEQUALITY / GINI INDEX
694
LABOR FORCE [ PEOPLE ]
64.1%
PERCENT IN LABOR FORCE
2.6%
UNEMPLOYMENT RATE
Freeman Zip Codes
Freeman Area Codes
Race in Freeman
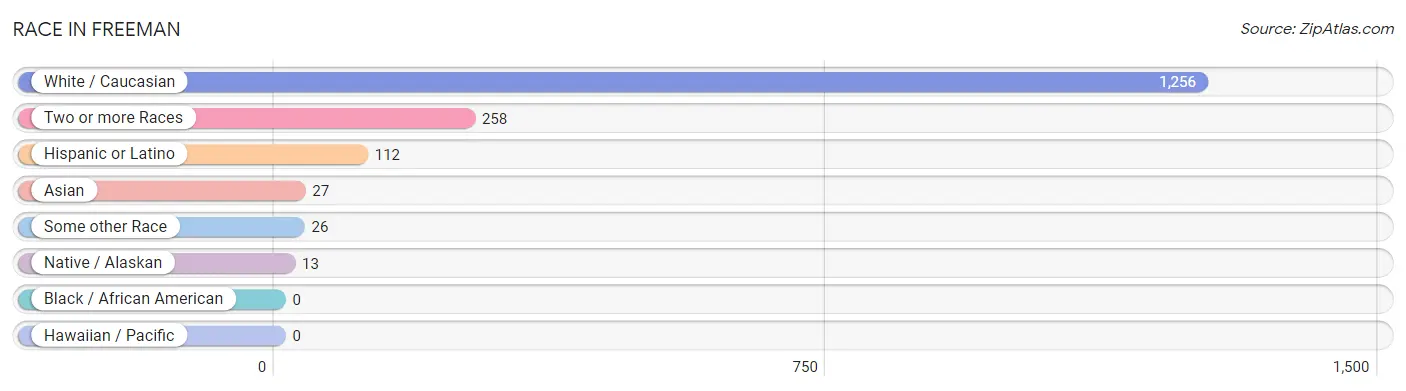
The most populous races in Freeman are White / Caucasian (1,256 | 79.5%), Two or more Races (258 | 16.3%), and Hispanic or Latino (112 | 7.1%).
| Race | # Population | % Population |
| Asian | 27 | 1.7% |
| Black / African American | 0 | 0.0% |
| Hawaiian / Pacific | 0 | 0.0% |
| Hispanic or Latino | 112 | 7.1% |
| Native / Alaskan | 13 | 0.8% |
| White / Caucasian | 1,256 | 79.5% |
| Two or more Races | 258 | 16.3% |
| Some other Race | 26 | 1.7% |
| Total | 1,580 | 100.0% |
Ancestry in Freeman
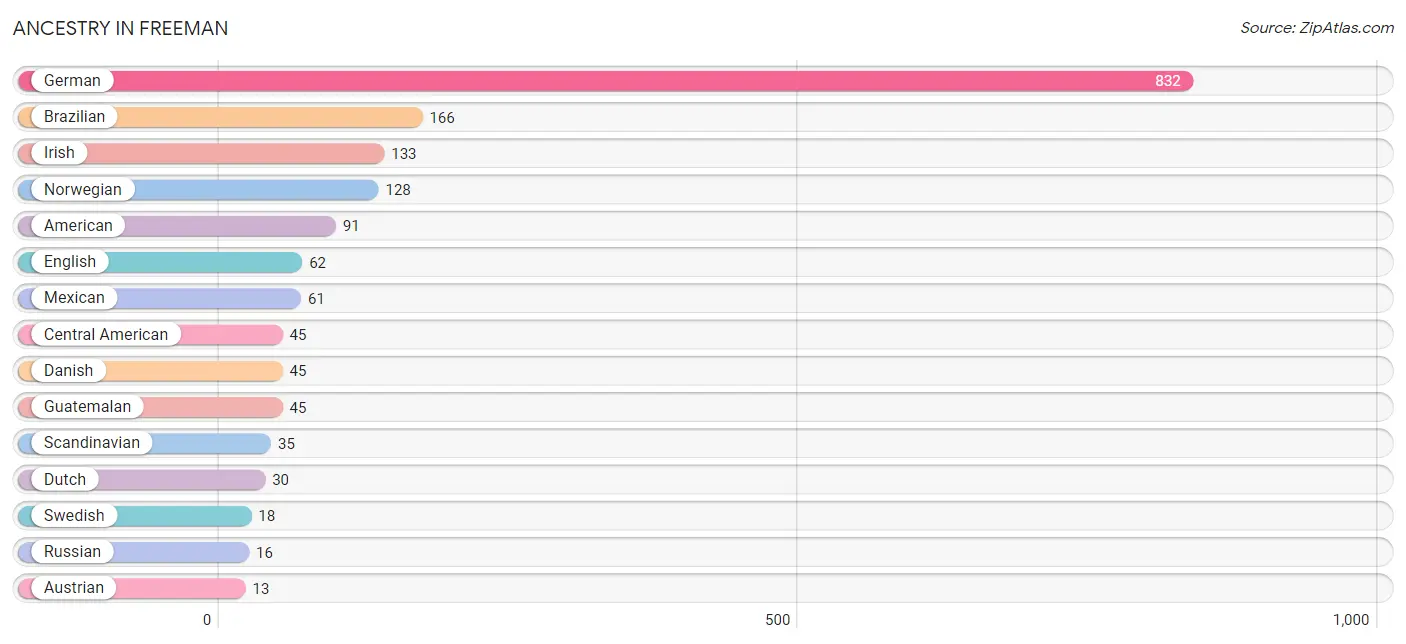
The most populous ancestries reported in Freeman are German (832 | 52.7%), Brazilian (166 | 10.5%), Irish (133 | 8.4%), Norwegian (128 | 8.1%), and American (91 | 5.8%), together accounting for 85.4% of all Freeman residents.
| Ancestry | # Population | % Population |
| American | 91 | 5.8% |
| Austrian | 13 | 0.8% |
| Brazilian | 166 | 10.5% |
| Cajun | 4 | 0.3% |
| Central American | 45 | 2.9% |
| Cuban | 6 | 0.4% |
| Czech | 13 | 0.8% |
| Danish | 45 | 2.9% |
| Dutch | 30 | 1.9% |
| English | 62 | 3.9% |
| German | 832 | 52.7% |
| German Russian | 5 | 0.3% |
| Guatemalan | 45 | 2.9% |
| Hungarian | 1 | 0.1% |
| Icelander | 13 | 0.8% |
| Irish | 133 | 8.4% |
| Korean | 11 | 0.7% |
| Mexican | 61 | 3.9% |
| Norwegian | 128 | 8.1% |
| Polish | 2 | 0.1% |
| Russian | 16 | 1.0% |
| Scandinavian | 35 | 2.2% |
| Sioux | 13 | 0.8% |
| Swedish | 18 | 1.1% |
| Swiss | 8 | 0.5% |
| Thai | 8 | 0.5% |
| Vietnamese | 8 | 0.5% | View All 27 Rows |
Immigrants in Freeman
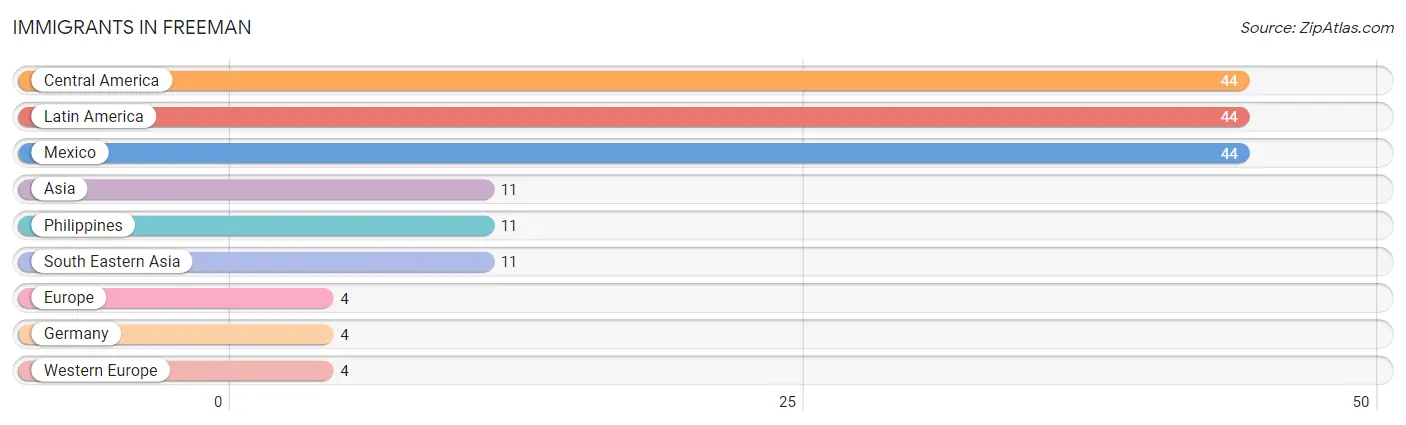
The most numerous immigrant groups reported in Freeman came from Central America (44 | 2.8%), Latin America (44 | 2.8%), Mexico (44 | 2.8%), Asia (11 | 0.7%), and Philippines (11 | 0.7%), together accounting for 9.7% of all Freeman residents.
| Immigration Origin | # Population | % Population |
| Asia | 11 | 0.7% |
| Central America | 44 | 2.8% |
| Europe | 4 | 0.3% |
| Germany | 4 | 0.3% |
| Latin America | 44 | 2.8% |
| Mexico | 44 | 2.8% |
| Philippines | 11 | 0.7% |
| South Eastern Asia | 11 | 0.7% |
| Western Europe | 4 | 0.3% | View All 9 Rows |
Sex and Age in Freeman
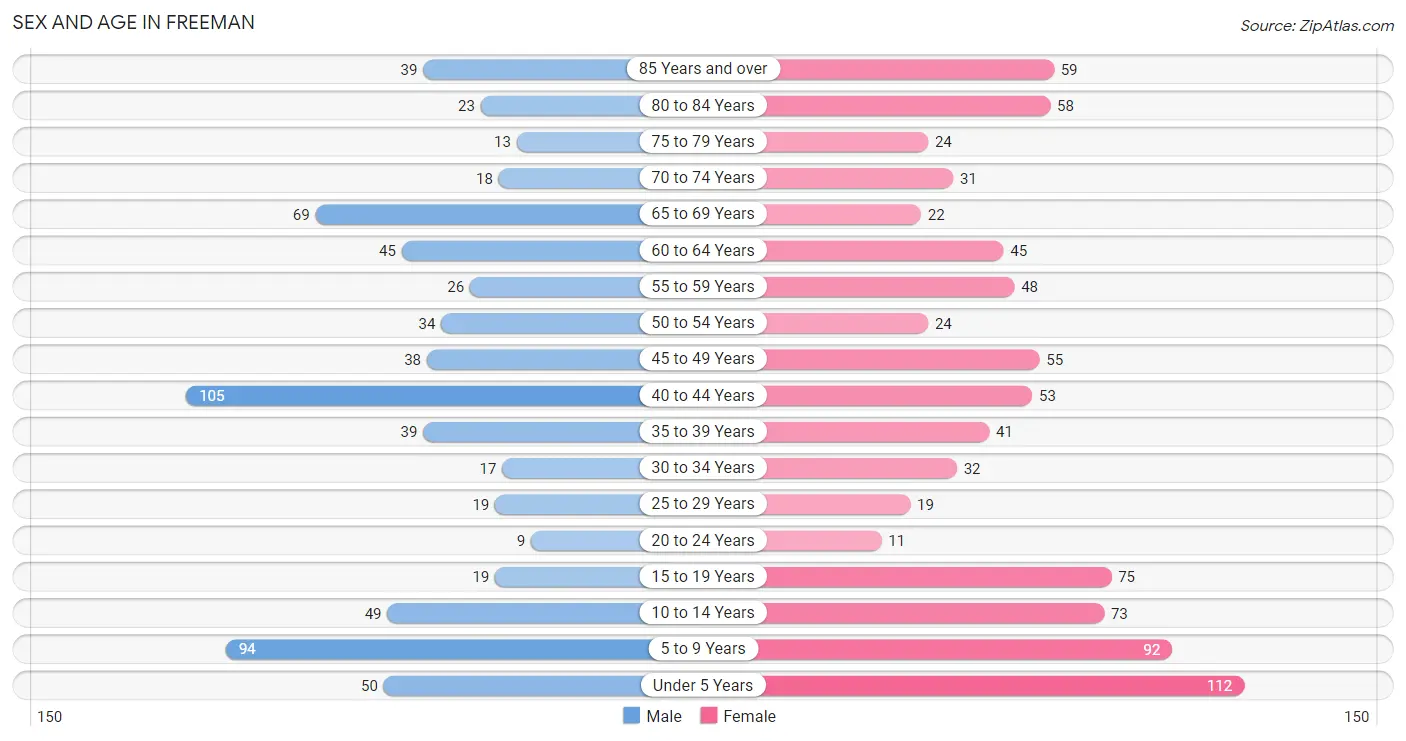
Sex and Age in Freeman
The most populous age groups in Freeman are 40 to 44 Years (105 | 14.9%) for men and Under 5 Years (112 | 12.8%) for women.
| Age Bracket | Male | Female |
| Under 5 Years | 50 (7.1%) | 112 (12.8%) |
| 5 to 9 Years | 94 (13.3%) | 92 (10.5%) |
| 10 to 14 Years | 49 (6.9%) | 73 (8.4%) |
| 15 to 19 Years | 19 (2.7%) | 75 (8.6%) |
| 20 to 24 Years | 9 (1.3%) | 11 (1.3%) |
| 25 to 29 Years | 19 (2.7%) | 19 (2.2%) |
| 30 to 34 Years | 17 (2.4%) | 32 (3.7%) |
| 35 to 39 Years | 39 (5.5%) | 41 (4.7%) |
| 40 to 44 Years | 105 (14.9%) | 53 (6.1%) |
| 45 to 49 Years | 38 (5.4%) | 55 (6.3%) |
| 50 to 54 Years | 34 (4.8%) | 24 (2.8%) |
| 55 to 59 Years | 26 (3.7%) | 48 (5.5%) |
| 60 to 64 Years | 45 (6.4%) | 45 (5.1%) |
| 65 to 69 Years | 69 (9.8%) | 22 (2.5%) |
| 70 to 74 Years | 18 (2.5%) | 31 (3.5%) |
| 75 to 79 Years | 13 (1.8%) | 24 (2.8%) |
| 80 to 84 Years | 23 (3.3%) | 58 (6.6%) |
| 85 Years and over | 39 (5.5%) | 59 (6.8%) |
| Total | 706 (100.0%) | 874 (100.0%) |
Families and Households in Freeman
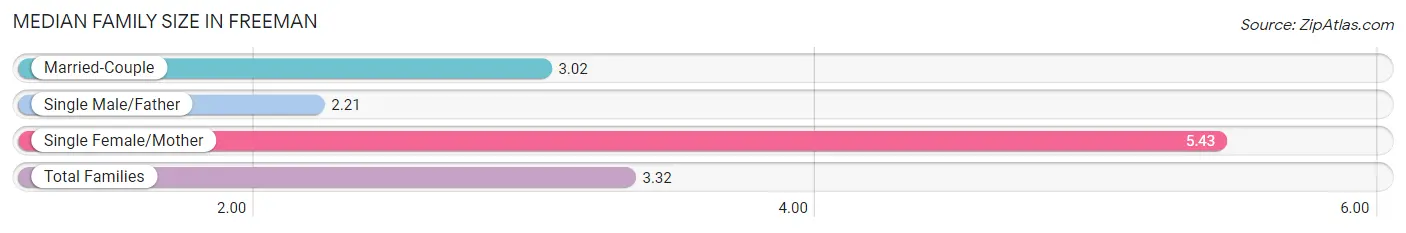
Median Family Size in Freeman
The median family size in Freeman is 3.32 persons per family, with single female/mother families (53 | 14.0%) accounting for the largest median family size of 5.43 persons per family. On the other hand, single male/father families (19 | 5.0%) represent the smallest median family size with 2.21 persons per family.
| Family Type | # Families | Family Size |
| Married-Couple | 308 (81.0%) | 3.02 |
| Single Male/Father | 19 (5.0%) | 2.21 |
| Single Female/Mother | 53 (14.0%) | 5.43 |
| Total Families | 380 (100.0%) | 3.32 |
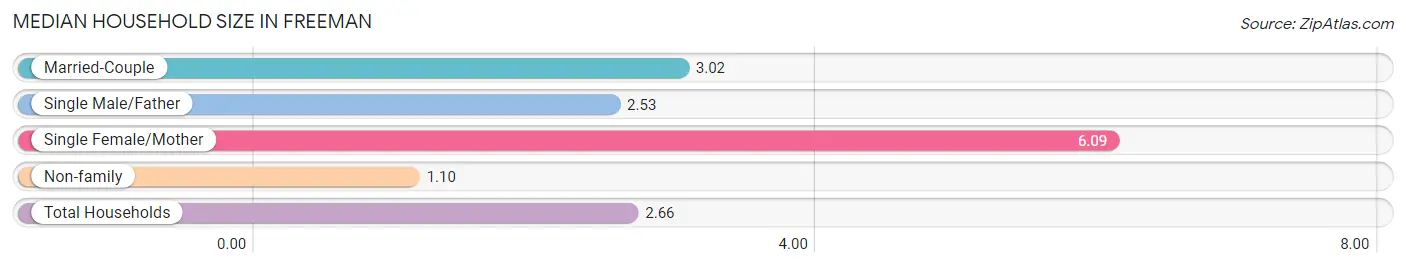
Median Household Size in Freeman
The median household size in Freeman is 2.66 persons per household, with single female/mother households (53 | 9.3%) accounting for the largest median household size of 6.09 persons per household. non-family households (187 | 33.0%) represent the smallest median household size with 1.10 persons per household.
| Household Type | # Households | Household Size |
| Married-Couple | 308 (54.3%) | 3.02 |
| Single Male/Father | 19 (3.4%) | 2.53 |
| Single Female/Mother | 53 (9.3%) | 6.09 |
| Non-family | 187 (33.0%) | 1.10 |
| Total Households | 567 (100.0%) | 2.66 |
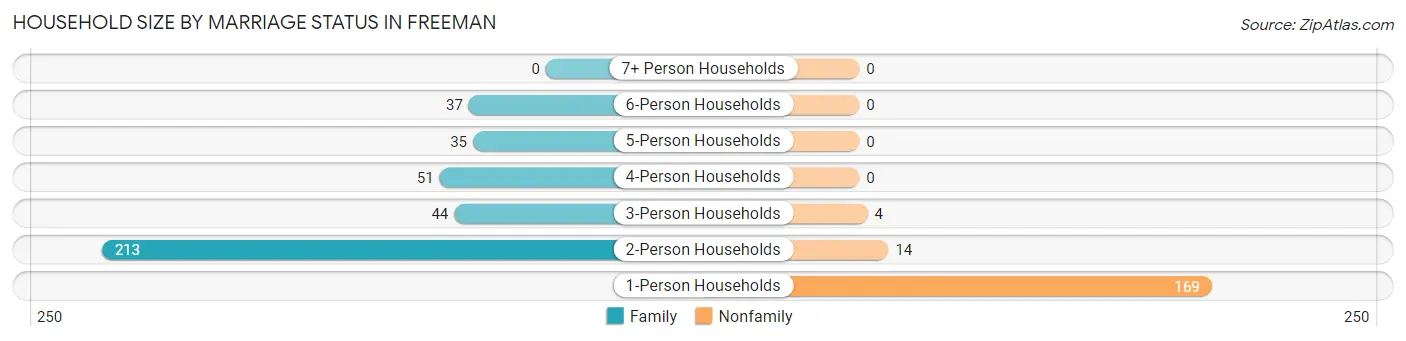
Household Size by Marriage Status in Freeman
Out of a total of 567 households in Freeman, 380 (67.0%) are family households, while 187 (33.0%) are nonfamily households. The most numerous type of family households are 2-person households, comprising 213, and the most common type of nonfamily households are 1-person households, comprising 169.
| Household Size | Family Households | Nonfamily Households |
| 1-Person Households | - | 169 (29.8%) |
| 2-Person Households | 213 (37.6%) | 14 (2.5%) |
| 3-Person Households | 44 (7.8%) | 4 (0.7%) |
| 4-Person Households | 51 (9.0%) | 0 (0.0%) |
| 5-Person Households | 35 (6.2%) | 0 (0.0%) |
| 6-Person Households | 37 (6.5%) | 0 (0.0%) |
| 7+ Person Households | 0 (0.0%) | 0 (0.0%) |
| Total | 380 (67.0%) | 187 (33.0%) |
Female Fertility in Freeman
Fertility by Age in Freeman
Average fertility rate in Freeman is 122.0 births per 1,000 women. Women in the age bracket of 20 to 34 years have the highest fertility rate with 565.0 births per 1,000 women. Women in the age bracket of 20 to 34 years acount for 100.0% of all women with births.
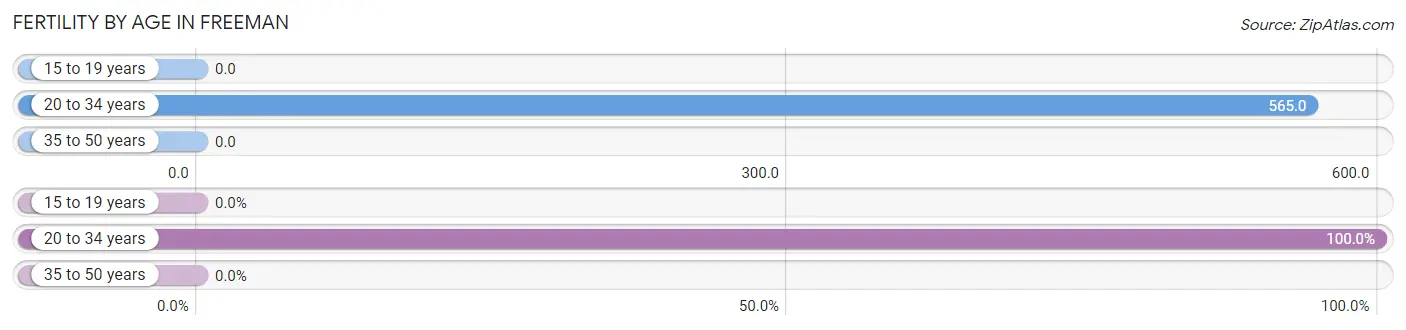
| Age Bracket | Women with Births | Births / 1,000 Women |
| 15 to 19 years | 0 (0.0%) | 0.0 |
| 20 to 34 years | 35 (100.0%) | 565.0 |
| 35 to 50 years | 0 (0.0%) | 0.0 |
| Total | 35 (100.0%) | 122.0 |
Fertility by Age by Marriage Status in Freeman
82.9% of women with births (35) in Freeman are married. The highest percentage of unmarried women with births falls into 20 to 34 years age bracket with 17.1% of them unmarried at the time of birth, while the lowest percentage of unmarried women with births belong to 20 to 34 years age bracket with 17.1% of them unmarried.
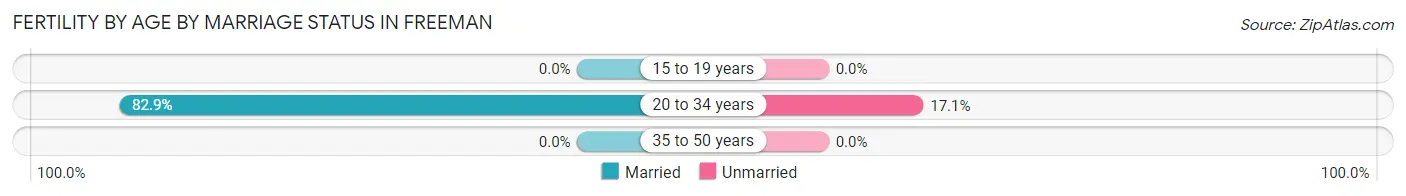
| Age Bracket | Married | Unmarried |
| 15 to 19 years | 0 (0.0%) | 0 (0.0%) |
| 20 to 34 years | 29 (82.9%) | 6 (17.1%) |
| 35 to 50 years | 0 (0.0%) | 0 (0.0%) |
| Total | 29 (82.9%) | 6 (17.1%) |
Fertility by Education in Freeman
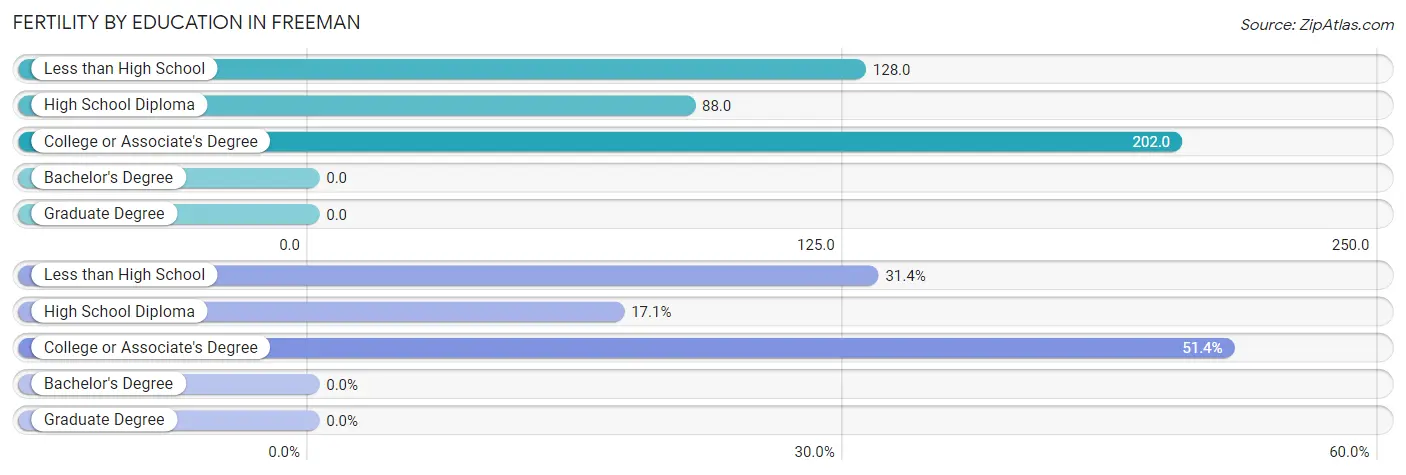
| Educational Attainment | Women with Births | Births / 1,000 Women |
| Less than High School | 11 (31.4%) | 128.0 |
| High School Diploma | 6 (17.1%) | 88.0 |
| College or Associate's Degree | 18 (51.4%) | 202.0 |
| Bachelor's Degree | 0 (0.0%) | 0.0 |
| Graduate Degree | 0 (0.0%) | 0.0 |
| Total | 35 (100.0%) | 122.0 |
Fertility by Education by Marriage Status in Freeman
17.1% of women with births in Freeman are unmarried. Women with the educational attainment of less than high school are most likely to be married with 100.0% of them married at childbirth, while women with the educational attainment of high school diploma are least likely to be married with 100.0% of them unmarried at childbirth.
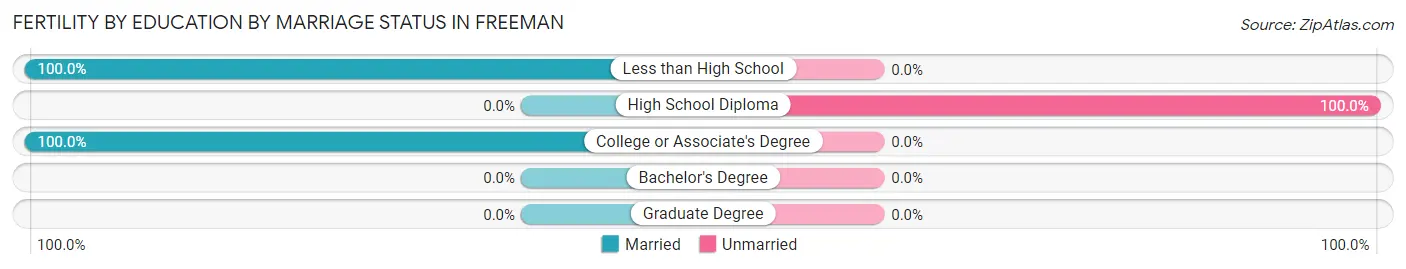
| Educational Attainment | Married | Unmarried |
| Less than High School | 11 (100.0%) | 0 (0.0%) |
| High School Diploma | 0 (0.0%) | 6 (100.0%) |
| College or Associate's Degree | 18 (100.0%) | 0 (0.0%) |
| Bachelor's Degree | 0 (0.0%) | 0 (0.0%) |
| Graduate Degree | 0 (0.0%) | 0 (0.0%) |
| Total | 29 (82.9%) | 6 (17.1%) |
Income in Freeman
Income Overview in Freeman
Per Capita Income in Freeman is $29,829, while median incomes of families and households are $93,333 and $61,719 respectively.
| Characteristic | Number | Measure |
| Per Capita Income | 1,580 | $29,829 |
| Median Family Income | 380 | $93,333 |
| Mean Family Income | 380 | $97,002 |
| Median Household Income | 567 | $61,719 |
| Mean Household Income | 567 | $80,446 |
| Income Deficit | 380 | $0 |
| Wage / Income Gap (%) | 1,580 | 37.92% |
| Wage / Income Gap ($) | 1,580 | 62.08¢ per $1 |
| Gini / Inequality Index | 1,580 | 0.40 |
Earnings by Sex in Freeman
Average Earnings in Freeman are $46,406, $53,721 for men and $33,350 for women, a difference of 37.9%.
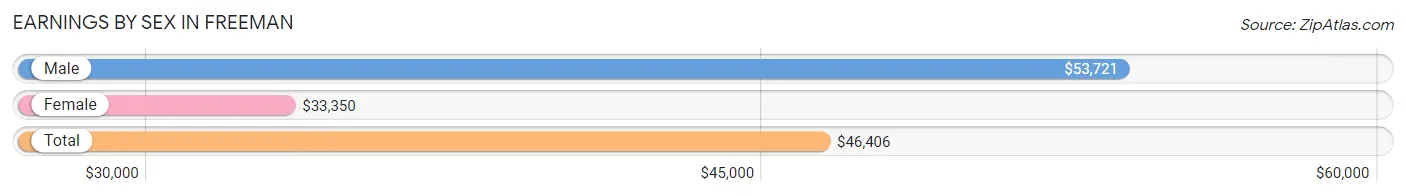
| Sex | Number | Average Earnings |
| Male | 394 (54.2%) | $53,721 |
| Female | 333 (45.8%) | $33,350 |
| Total | 727 (100.0%) | $46,406 |
Earnings by Sex by Income Bracket in Freeman
The most common earnings brackets in Freeman are $55,000 to $64,999 for men (72 | 18.3%) and $45,000 to $49,999 for women (46 | 13.8%).
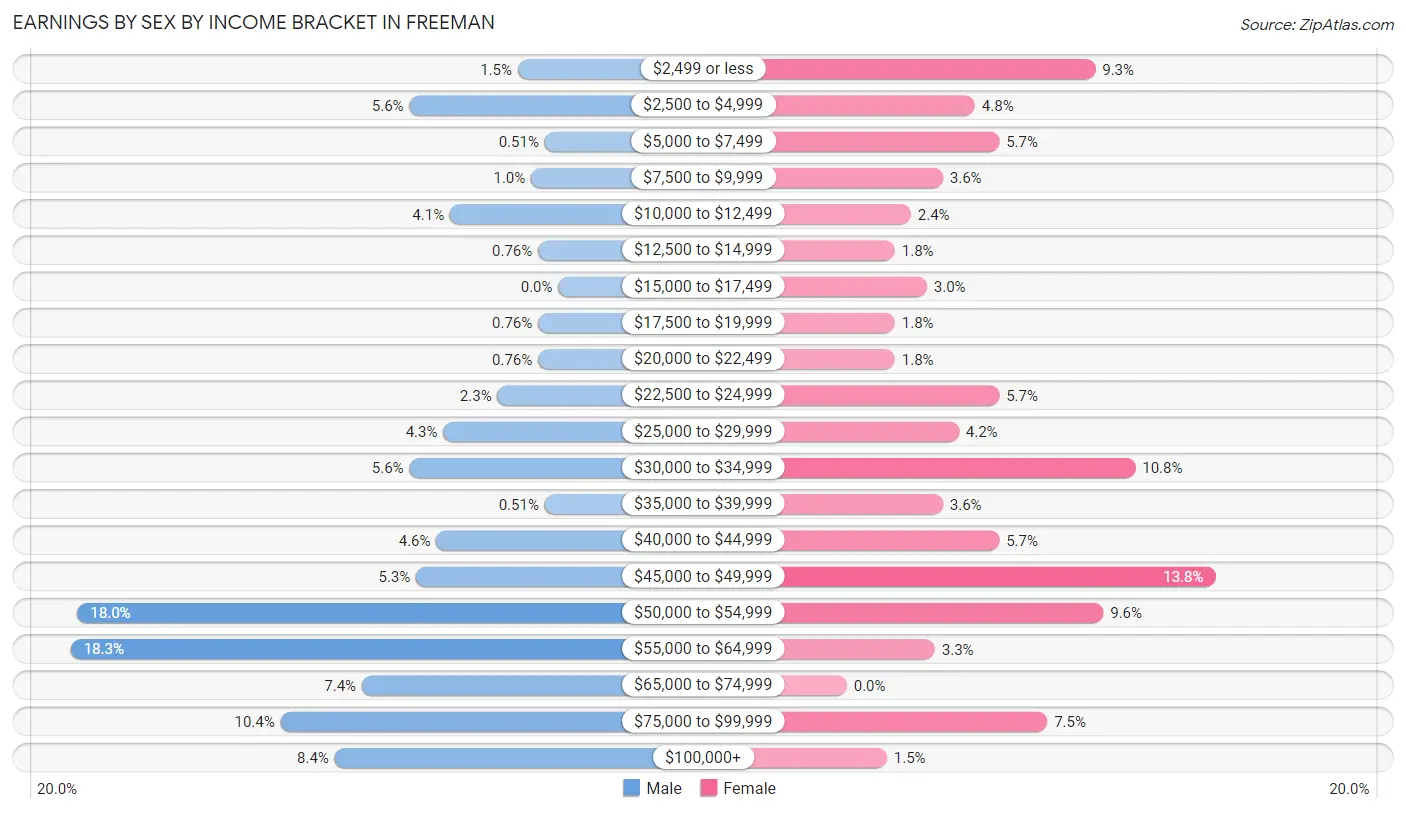
| Income | Male | Female |
| $2,499 or less | 6 (1.5%) | 31 (9.3%) |
| $2,500 to $4,999 | 22 (5.6%) | 16 (4.8%) |
| $5,000 to $7,499 | 2 (0.5%) | 19 (5.7%) |
| $7,500 to $9,999 | 4 (1.0%) | 12 (3.6%) |
| $10,000 to $12,499 | 16 (4.1%) | 8 (2.4%) |
| $12,500 to $14,999 | 3 (0.8%) | 6 (1.8%) |
| $15,000 to $17,499 | 0 (0.0%) | 10 (3.0%) |
| $17,500 to $19,999 | 3 (0.8%) | 6 (1.8%) |
| $20,000 to $22,499 | 3 (0.8%) | 6 (1.8%) |
| $22,500 to $24,999 | 9 (2.3%) | 19 (5.7%) |
| $25,000 to $29,999 | 17 (4.3%) | 14 (4.2%) |
| $30,000 to $34,999 | 22 (5.6%) | 36 (10.8%) |
| $35,000 to $39,999 | 2 (0.5%) | 12 (3.6%) |
| $40,000 to $44,999 | 18 (4.6%) | 19 (5.7%) |
| $45,000 to $49,999 | 21 (5.3%) | 46 (13.8%) |
| $50,000 to $54,999 | 71 (18.0%) | 32 (9.6%) |
| $55,000 to $64,999 | 72 (18.3%) | 11 (3.3%) |
| $65,000 to $74,999 | 29 (7.4%) | 0 (0.0%) |
| $75,000 to $99,999 | 41 (10.4%) | 25 (7.5%) |
| $100,000+ | 33 (8.4%) | 5 (1.5%) |
| Total | 394 (100.0%) | 333 (100.0%) |
Earnings by Sex by Educational Attainment in Freeman
Average earnings in Freeman are $54,302 for men and $34,450 for women, a difference of 36.6%. Men with an educational attainment of bachelor's degree enjoy the highest average annual earnings of $63,409, while those with high school diploma education earn the least with $46,500. Women with an educational attainment of bachelor's degree earn the most with the average annual earnings of $48,333, while those with high school diploma education have the smallest earnings of $30,278.
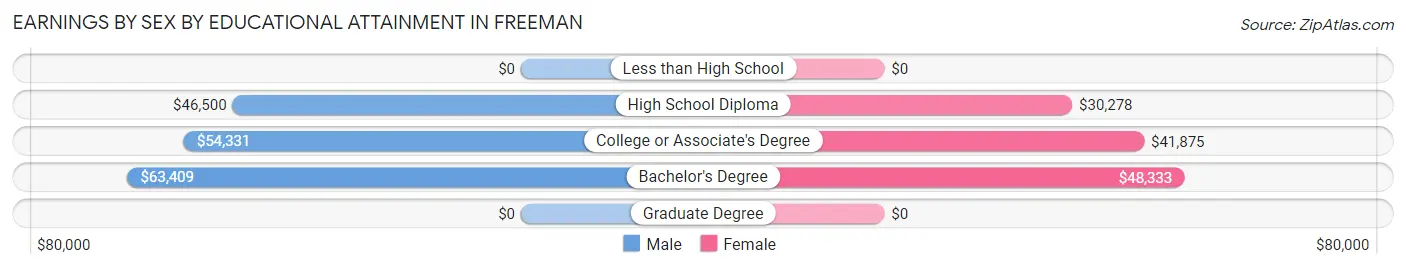
| Educational Attainment | Male Income | Female Income |
| Less than High School | - | - |
| High School Diploma | $46,500 | $30,278 |
| College or Associate's Degree | $54,331 | $41,875 |
| Bachelor's Degree | $63,409 | $48,333 |
| Graduate Degree | - | - |
| Total | $54,302 | $34,450 |
Family Income in Freeman
Family Income Brackets in Freeman
According to the Freeman family income data, there are 120 families falling into the $100,000 to $149,999 income range, which is the most common income bracket and makes up 31.6% of all families. Conversely, the $10,000 to $14,999 income bracket is the least frequent group with only 6 families (1.6%) belonging to this category.
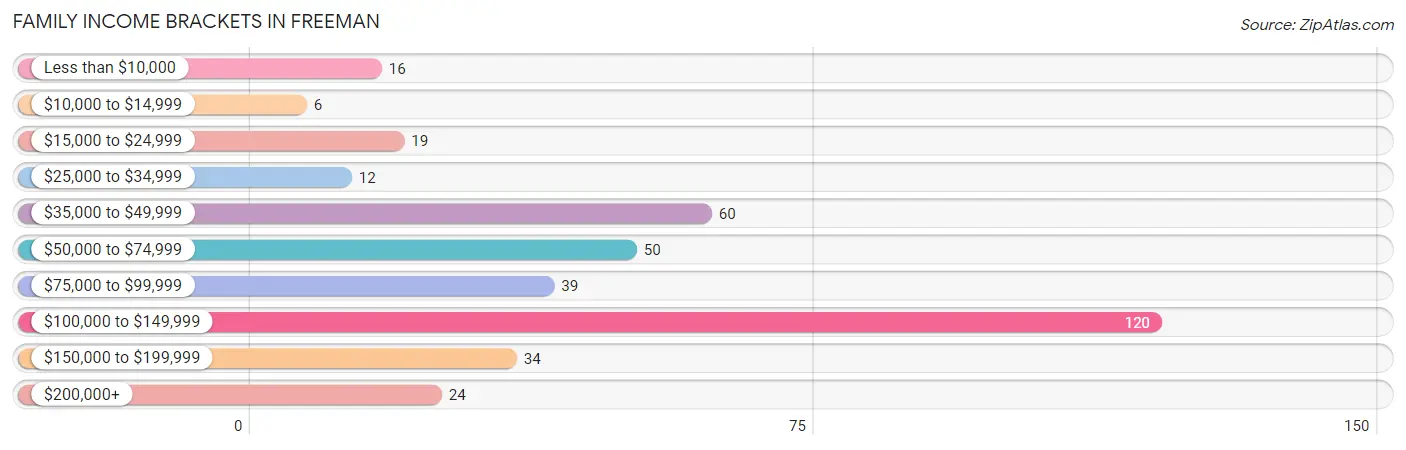
| Income Bracket | # Families | % Families |
| Less than $10,000 | 16 | 4.2% |
| $10,000 to $14,999 | 6 | 1.6% |
| $15,000 to $24,999 | 19 | 5.0% |
| $25,000 to $34,999 | 12 | 3.2% |
| $35,000 to $49,999 | 60 | 15.8% |
| $50,000 to $74,999 | 50 | 13.2% |
| $75,000 to $99,999 | 39 | 10.3% |
| $100,000 to $149,999 | 120 | 31.6% |
| $150,000 to $199,999 | 34 | 8.9% |
| $200,000+ | 24 | 6.3% |
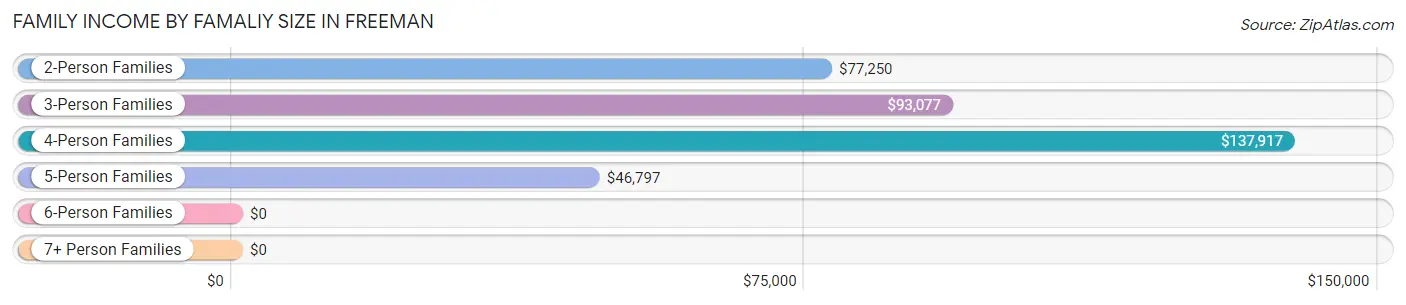
Family Income by Famaliy Size in Freeman
4-person families (51 | 13.4%) account for the highest median family income in Freeman with $137,917 per family, while 2-person families (221 | 58.2%) have the highest median income of $38,625 per family member.
| Income Bracket | # Families | Median Income |
| 2-Person Families | 221 (58.2%) | $77,250 |
| 3-Person Families | 36 (9.5%) | $93,077 |
| 4-Person Families | 51 (13.4%) | $137,917 |
| 5-Person Families | 47 (12.4%) | $46,797 |
| 6-Person Families | 25 (6.6%) | $0 |
| 7+ Person Families | 0 (0.0%) | $0 |
| Total | 380 (100.0%) | $93,333 |
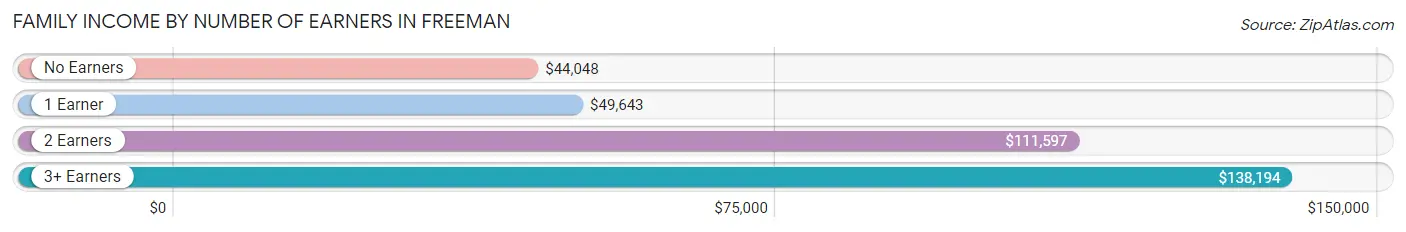
Family Income by Number of Earners in Freeman
The median family income in Freeman is $93,333, with families comprising 3+ earners (13) having the highest median family income of $138,194, while families with no earners (48) have the lowest median family income of $44,048, accounting for 3.4% and 12.6% of families, respectively.
| Number of Earners | # Families | Median Income |
| No Earners | 48 (12.6%) | $44,048 |
| 1 Earner | 136 (35.8%) | $49,643 |
| 2 Earners | 183 (48.2%) | $111,597 |
| 3+ Earners | 13 (3.4%) | $138,194 |
| Total | 380 (100.0%) | $93,333 |
Household Income in Freeman
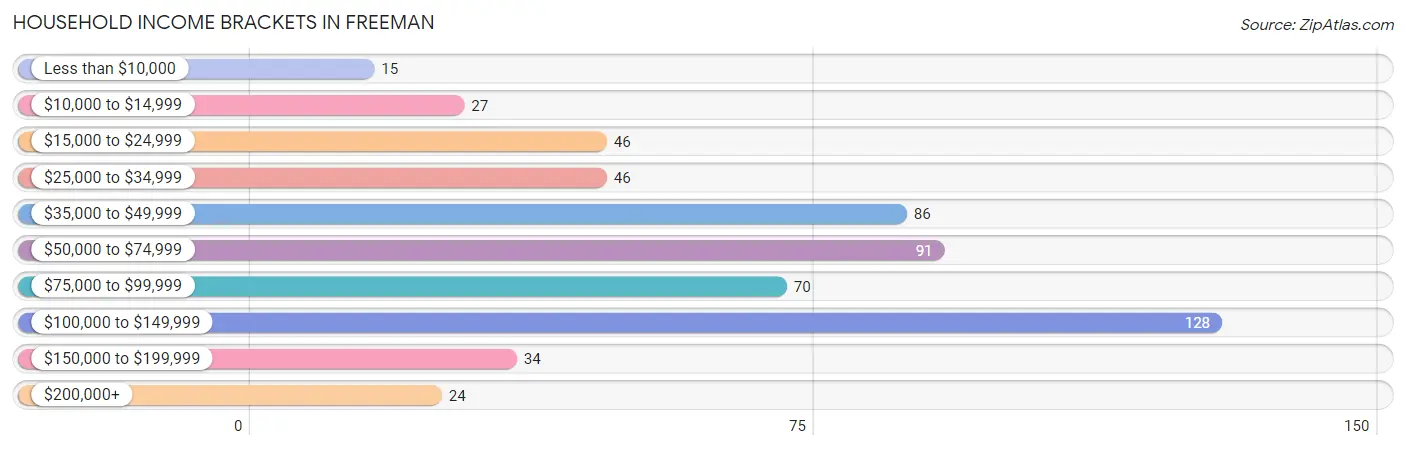
Household Income Brackets in Freeman
With 128 households falling in the category, the $100,000 to $149,999 income range is the most frequent in Freeman, accounting for 22.6% of all households. In contrast, only 15 households (2.6%) fall into the less than $10,000 income bracket, making it the least populous group.
| Income Bracket | # Households | % Households |
| Less than $10,000 | 15 | 2.6% |
| $10,000 to $14,999 | 27 | 4.8% |
| $15,000 to $24,999 | 46 | 8.1% |
| $25,000 to $34,999 | 46 | 8.1% |
| $35,000 to $49,999 | 86 | 15.2% |
| $50,000 to $74,999 | 91 | 16.0% |
| $75,000 to $99,999 | 70 | 12.3% |
| $100,000 to $149,999 | 128 | 22.6% |
| $150,000 to $199,999 | 34 | 6.0% |
| $200,000+ | 24 | 4.2% |
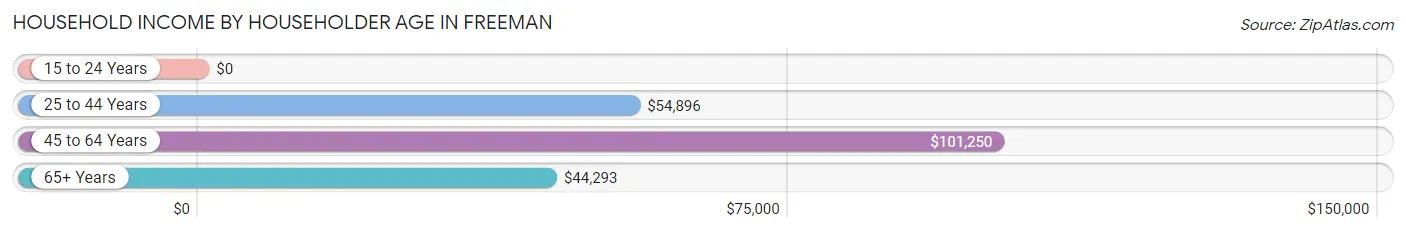
Household Income by Householder Age in Freeman
The median household income in Freeman is $61,719, with the highest median household income of $101,250 found in the 45 to 64 years age bracket for the primary householder. A total of 194 households (34.2%) fall into this category. Meanwhile, the 15 to 24 years age bracket for the primary householder has the lowest median household income of $0, with 9 households (1.6%) in this group.
| Income Bracket | # Households | Median Income |
| 15 to 24 Years | 9 (1.6%) | $0 |
| 25 to 44 Years | 161 (28.4%) | $54,896 |
| 45 to 64 Years | 194 (34.2%) | $101,250 |
| 65+ Years | 203 (35.8%) | $44,293 |
| Total | 567 (100.0%) | $61,719 |
Poverty in Freeman
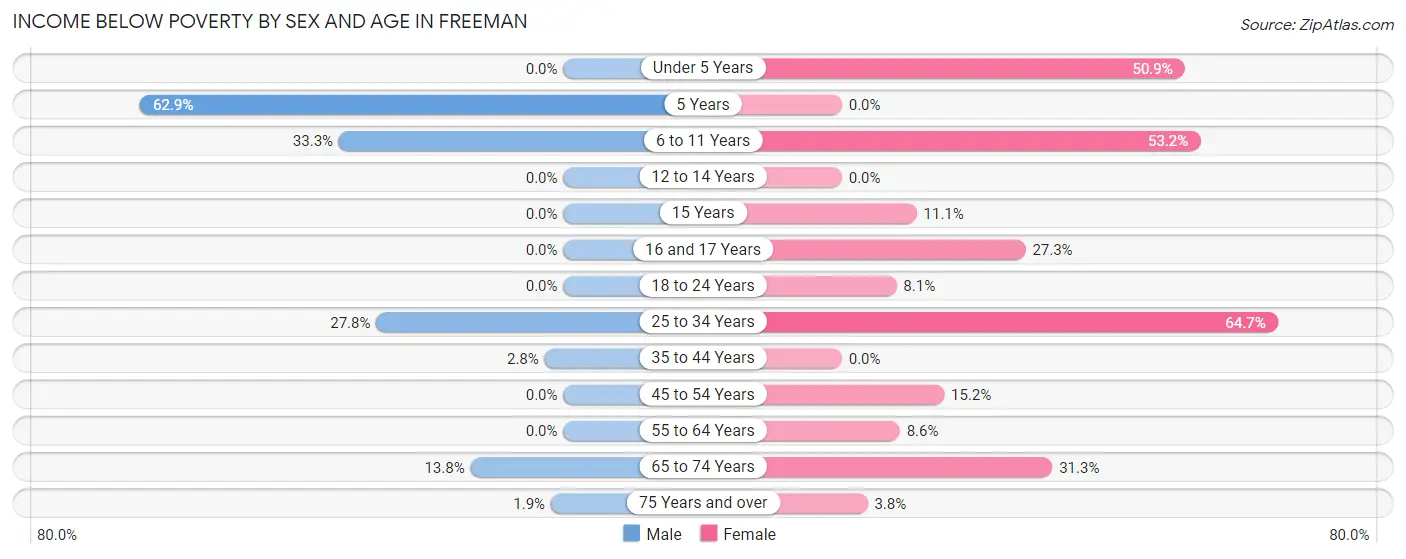
Income Below Poverty by Sex and Age in Freeman
With 10.8% poverty level for males and 22.9% for females among the residents of Freeman, 5 year old males and 25 to 34 year old females are the most vulnerable to poverty, with 22 males (62.9%) and 33 females (64.7%) in their respective age groups living below the poverty level.
| Age Bracket | Male | Female |
| Under 5 Years | 0 (0.0%) | 57 (50.9%) |
| 5 Years | 22 (62.9%) | 0 (0.0%) |
| 6 to 11 Years | 25 (33.3%) | 50 (53.2%) |
| 12 to 14 Years | 0 (0.0%) | 0 (0.0%) |
| 15 Years | 0 (0.0%) | 3 (11.1%) |
| 16 and 17 Years | 0 (0.0%) | 6 (27.3%) |
| 18 to 24 Years | 0 (0.0%) | 3 (8.1%) |
| 25 to 34 Years | 10 (27.8%) | 33 (64.7%) |
| 35 to 44 Years | 4 (2.8%) | 0 (0.0%) |
| 45 to 54 Years | 0 (0.0%) | 12 (15.2%) |
| 55 to 64 Years | 0 (0.0%) | 8 (8.6%) |
| 65 to 74 Years | 12 (13.8%) | 15 (31.2%) |
| 75 Years and over | 1 (1.8%) | 4 (3.8%) |
| Total | 74 (10.8%) | 191 (22.9%) |
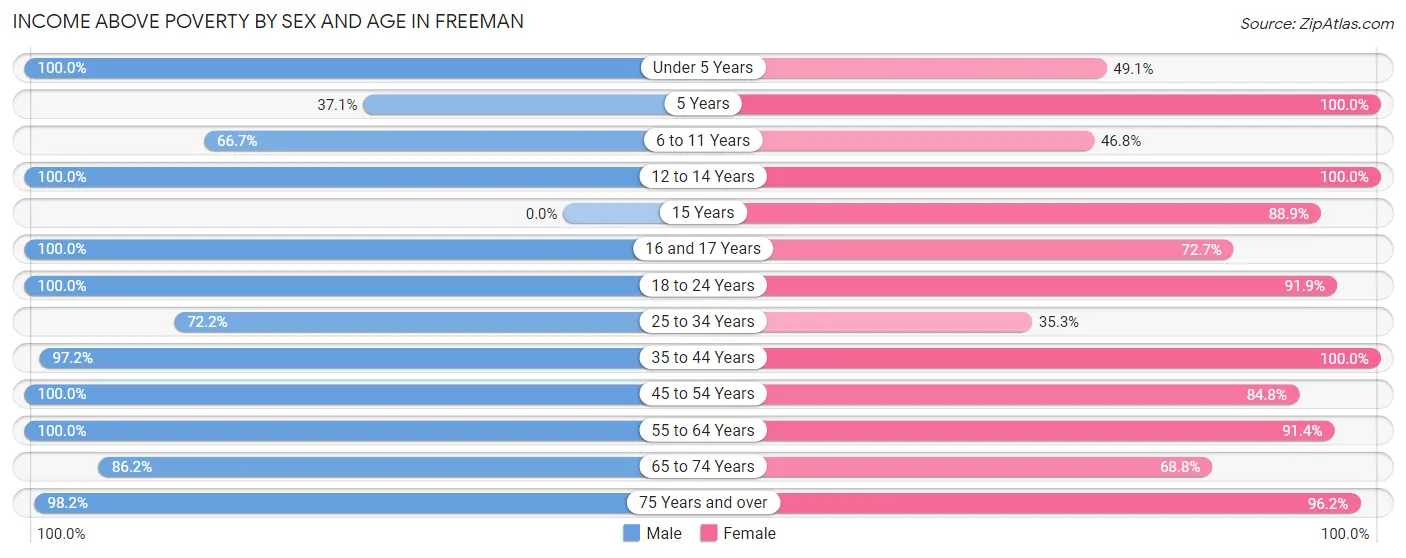
Income Above Poverty by Sex and Age in Freeman
According to the poverty statistics in Freeman, males aged under 5 years and females aged 5 years are the age groups that are most secure financially, with 100.0% of males and 100.0% of females in these age groups living above the poverty line.
| Age Bracket | Male | Female |
| Under 5 Years | 50 (100.0%) | 55 (49.1%) |
| 5 Years | 13 (37.1%) | 13 (100.0%) |
| 6 to 11 Years | 50 (66.7%) | 44 (46.8%) |
| 12 to 14 Years | 33 (100.0%) | 58 (100.0%) |
| 15 Years | 0 (0.0%) | 24 (88.9%) |
| 16 and 17 Years | 19 (100.0%) | 16 (72.7%) |
| 18 to 24 Years | 9 (100.0%) | 34 (91.9%) |
| 25 to 34 Years | 26 (72.2%) | 18 (35.3%) |
| 35 to 44 Years | 140 (97.2%) | 94 (100.0%) |
| 45 to 54 Years | 72 (100.0%) | 67 (84.8%) |
| 55 to 64 Years | 71 (100.0%) | 85 (91.4%) |
| 65 to 74 Years | 75 (86.2%) | 33 (68.8%) |
| 75 Years and over | 53 (98.2%) | 101 (96.2%) |
| Total | 611 (89.2%) | 642 (77.1%) |
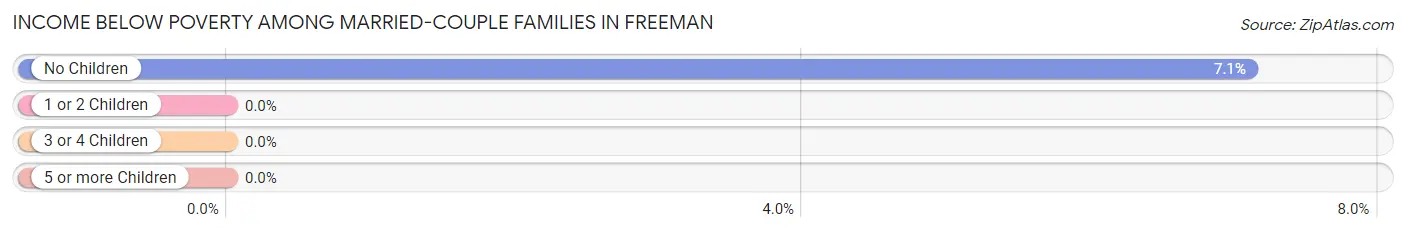
Income Below Poverty Among Married-Couple Families in Freeman
The poverty statistics for married-couple families in Freeman show that 4.2% or 13 of the total 308 families live below the poverty line. Families with no children have the highest poverty rate of 7.1%, comprising of 13 families. On the other hand, families with 1 or 2 children have the lowest poverty rate of 0.0%, which includes 0 families.
| Children | Above Poverty | Below Poverty |
| No Children | 170 (92.9%) | 13 (7.1%) |
| 1 or 2 Children | 81 (100.0%) | 0 (0.0%) |
| 3 or 4 Children | 44 (100.0%) | 0 (0.0%) |
| 5 or more Children | 0 (0.0%) | 0 (0.0%) |
| Total | 295 (95.8%) | 13 (4.2%) |
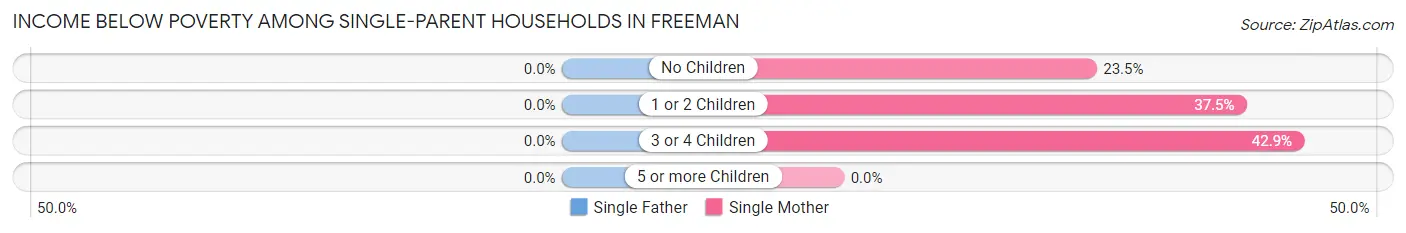
Income Below Poverty Among Single-Parent Households in Freeman
| Children | Single Father | Single Mother |
| No Children | 0 (0.0%) | 4 (23.5%) |
| 1 or 2 Children | 0 (0.0%) | 3 (37.5%) |
| 3 or 4 Children | 0 (0.0%) | 12 (42.9%) |
| 5 or more Children | 0 (0.0%) | 0 (0.0%) |
| Total | 0 (0.0%) | 19 (35.8%) |
Income Below Poverty Among Married-Couple vs Single-Parent Households in Freeman
The poverty data for Freeman shows that 13 of the married-couple family households (4.2%) and 19 of the single-parent households (26.4%) are living below the poverty level. Within the married-couple family households, those with no children have the highest poverty rate, with 13 households (7.1%) falling below the poverty line. Among the single-parent households, those with 3 or 4 children have the highest poverty rate, with 12 household (42.9%) living below poverty.
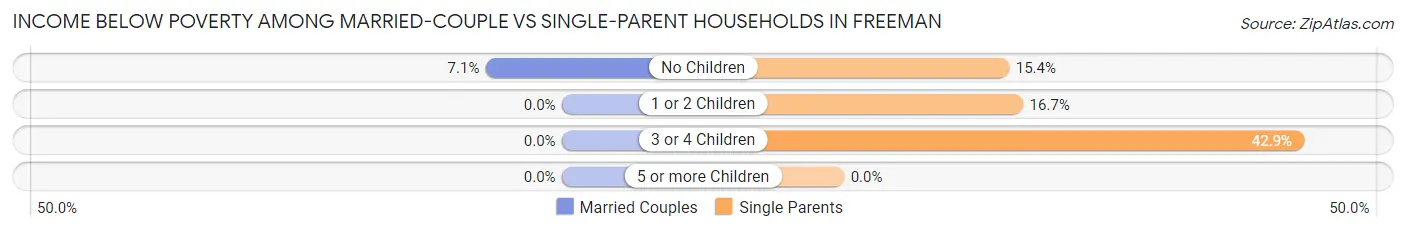
| Children | Married-Couple Families | Single-Parent Households |
| No Children | 13 (7.1%) | 4 (15.4%) |
| 1 or 2 Children | 0 (0.0%) | 3 (16.7%) |
| 3 or 4 Children | 0 (0.0%) | 12 (42.9%) |
| 5 or more Children | 0 (0.0%) | 0 (0.0%) |
| Total | 13 (4.2%) | 19 (26.4%) |
Employment Characteristics in Freeman
Employment by Class of Employer in Freeman
Among the 673 employed individuals in Freeman, private company employees (461 | 68.5%), not-for-profit organizations (63 | 9.4%), and local government employees (43 | 6.4%) make up the most common classes of employment.
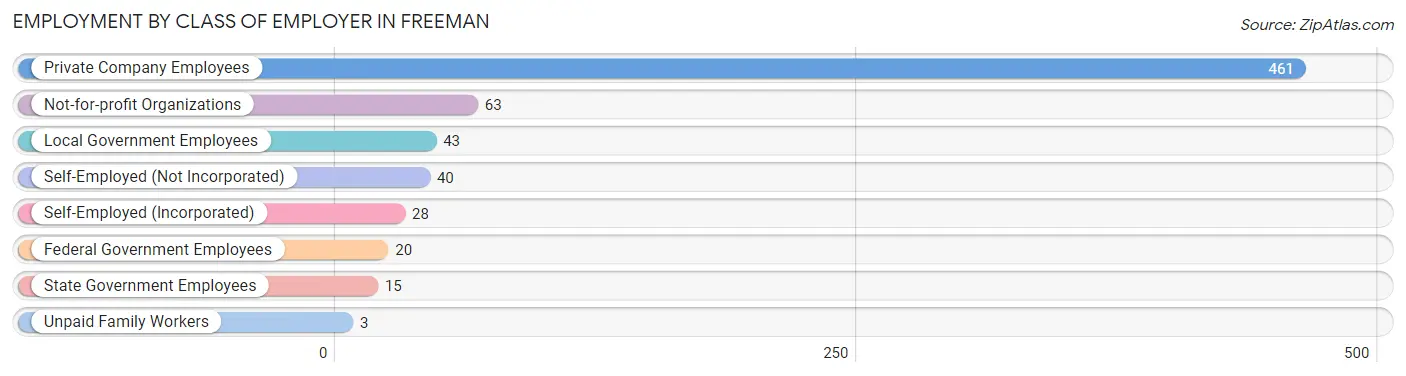
| Employer Class | # Employees | % Employees |
| Private Company Employees | 461 | 68.5% |
| Self-Employed (Incorporated) | 28 | 4.2% |
| Self-Employed (Not Incorporated) | 40 | 5.9% |
| Not-for-profit Organizations | 63 | 9.4% |
| Local Government Employees | 43 | 6.4% |
| State Government Employees | 15 | 2.2% |
| Federal Government Employees | 20 | 3.0% |
| Unpaid Family Workers | 3 | 0.4% |
| Total | 673 | 100.0% |
Employment Status by Age in Freeman
According to the labor force statistics for Freeman, out of the total population over 16 years of age (1,083), 64.1% or 694 individuals are in the labor force, with 2.6% or 18 of them unemployed. The age group with the highest labor force participation rate is 20 to 24 years, with 100.0% or 20 individuals in the labor force. Within the labor force, the 30 to 34 years age range has the highest percentage of unemployed individuals, with 22.2% or 10 of them being unemployed.
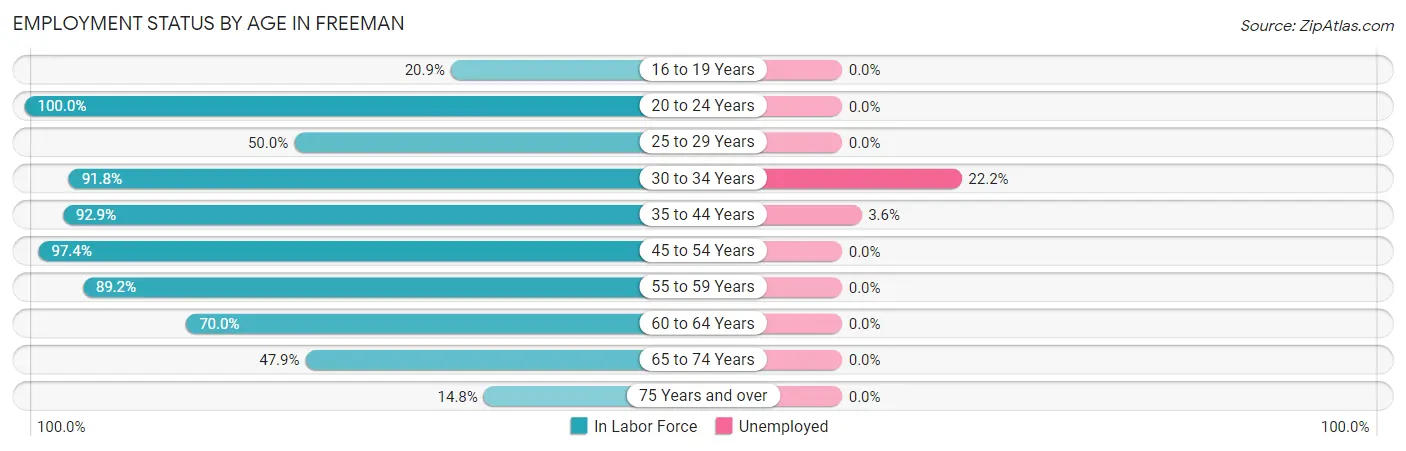
| Age Bracket | In Labor Force | Unemployed |
| 16 to 19 Years | 14 (20.9%) | 0 (0.0%) |
| 20 to 24 Years | 20 (100.0%) | 0 (0.0%) |
| 25 to 29 Years | 19 (50.0%) | 0 (0.0%) |
| 30 to 34 Years | 45 (91.8%) | 10 (22.2%) |
| 35 to 44 Years | 221 (92.9%) | 8 (3.6%) |
| 45 to 54 Years | 147 (97.4%) | 0 (0.0%) |
| 55 to 59 Years | 66 (89.2%) | 0 (0.0%) |
| 60 to 64 Years | 63 (70.0%) | 0 (0.0%) |
| 65 to 74 Years | 67 (47.9%) | 0 (0.0%) |
| 75 Years and over | 32 (14.8%) | 0 (0.0%) |
| Total | 694 (64.1%) | 18 (2.6%) |
Employment Status by Educational Attainment in Freeman
According to labor force statistics for Freeman, 87.7% of individuals (561) out of the total population between 25 and 64 years of age (640) are in the labor force, with 3.2% or 18 of them being unemployed. The group with the highest labor force participation rate are those with the educational attainment of less than high school, with 100.0% or 30 individuals in the labor force. Within the labor force, individuals with bachelor's degree or higher education have the highest percentage of unemployment, with 7.0% or 10 of them being unemployed.
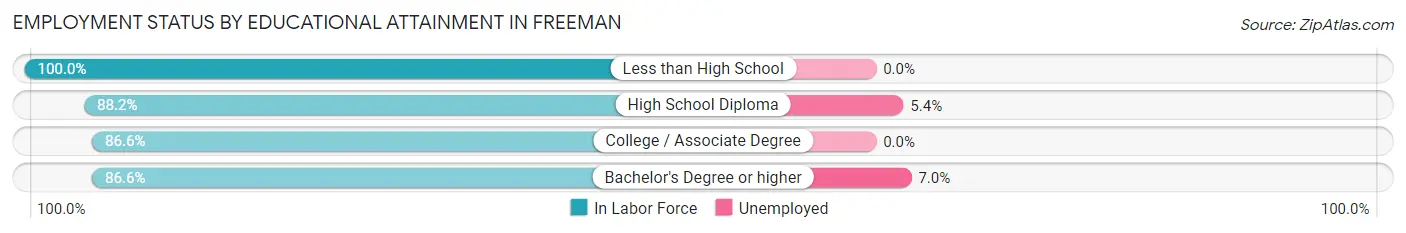
| Educational Attainment | In Labor Force | Unemployed |
| Less than High School | 30 (100.0%) | 0 (0.0%) |
| High School Diploma | 149 (88.2%) | 9 (5.4%) |
| College / Associate Degree | 240 (86.6%) | 0 (0.0%) |
| Bachelor's Degree or higher | 142 (86.6%) | 11 (7.0%) |
| Total | 561 (87.7%) | 20 (3.2%) |
Employment Occupations by Sex in Freeman
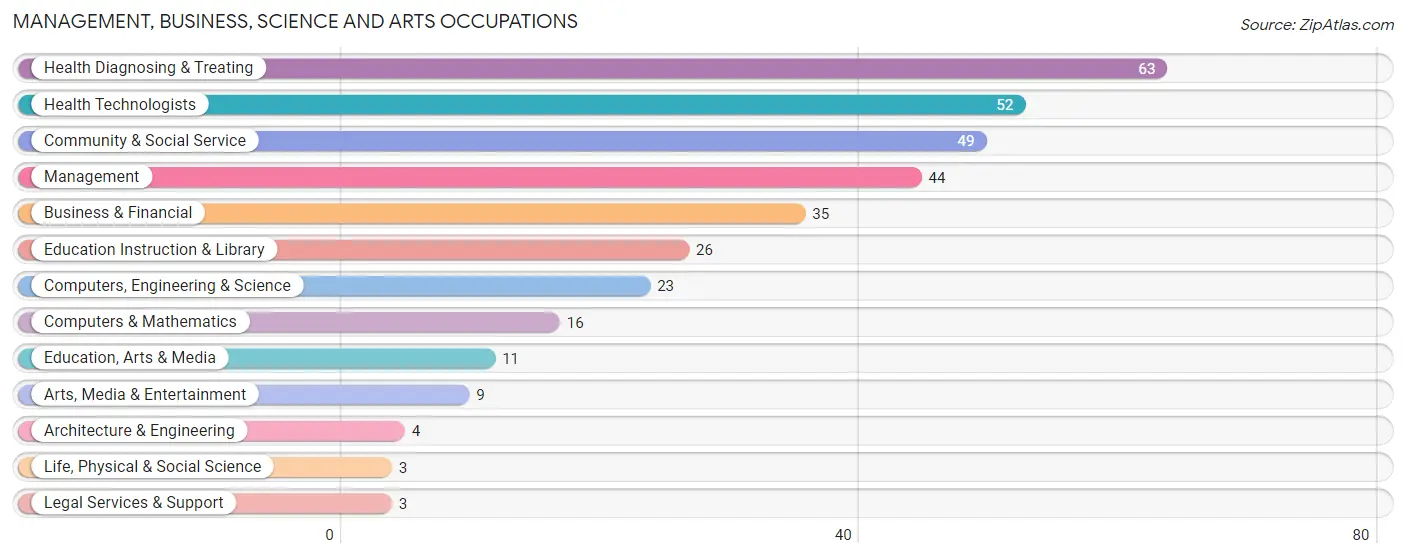
Management, Business, Science and Arts Occupations
The most common Management, Business, Science and Arts occupations in Freeman are Health Diagnosing & Treating (63 | 9.3%), Health Technologists (52 | 7.7%), Community & Social Service (49 | 7.2%), Management (44 | 6.5%), and Business & Financial (35 | 5.2%).
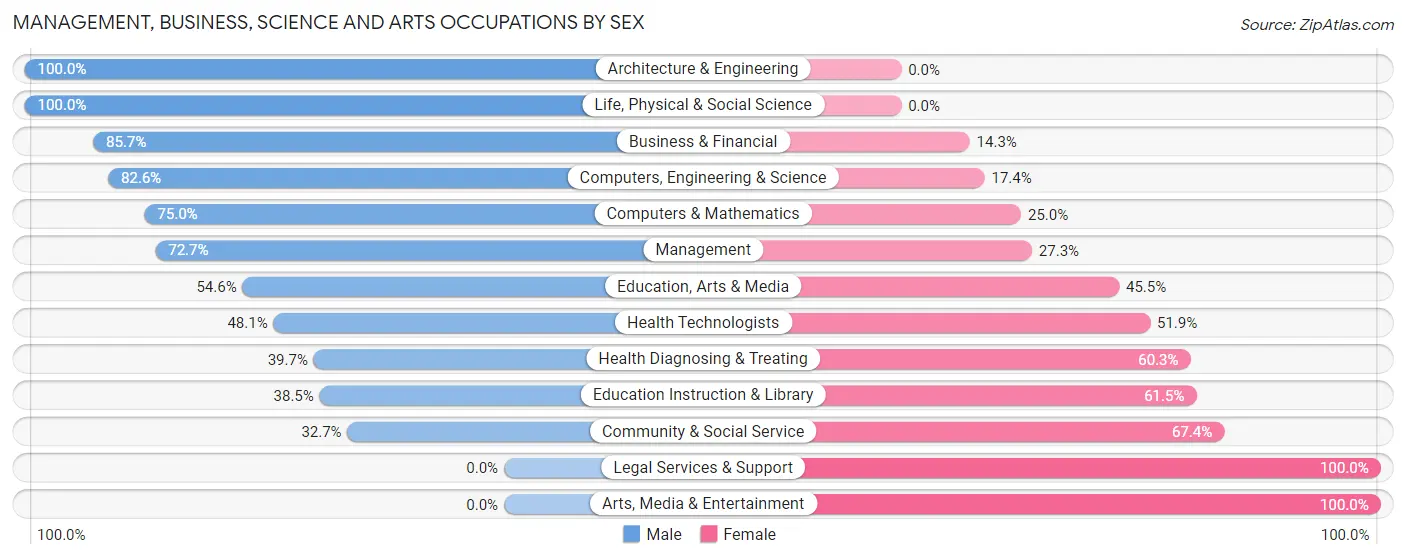
Management, Business, Science and Arts Occupations by Sex
Within the Management, Business, Science and Arts occupations in Freeman, the most male-oriented occupations are Architecture & Engineering (100.0%), Life, Physical & Social Science (100.0%), and Business & Financial (85.7%), while the most female-oriented occupations are Legal Services & Support (100.0%), Arts, Media & Entertainment (100.0%), and Community & Social Service (67.3%).
| Occupation | Male | Female |
| Management | 32 (72.7%) | 12 (27.3%) |
| Business & Financial | 30 (85.7%) | 5 (14.3%) |
| Computers, Engineering & Science | 19 (82.6%) | 4 (17.4%) |
| Computers & Mathematics | 12 (75.0%) | 4 (25.0%) |
| Architecture & Engineering | 4 (100.0%) | 0 (0.0%) |
| Life, Physical & Social Science | 3 (100.0%) | 0 (0.0%) |
| Community & Social Service | 16 (32.7%) | 33 (67.3%) |
| Education, Arts & Media | 6 (54.5%) | 5 (45.5%) |
| Legal Services & Support | 0 (0.0%) | 3 (100.0%) |
| Education Instruction & Library | 10 (38.5%) | 16 (61.5%) |
| Arts, Media & Entertainment | 0 (0.0%) | 9 (100.0%) |
| Health Diagnosing & Treating | 25 (39.7%) | 38 (60.3%) |
| Health Technologists | 25 (48.1%) | 27 (51.9%) |
| Total (Category) | 122 (57.0%) | 92 (43.0%) |
| Total (Overall) | 382 (56.5%) | 294 (43.5%) |
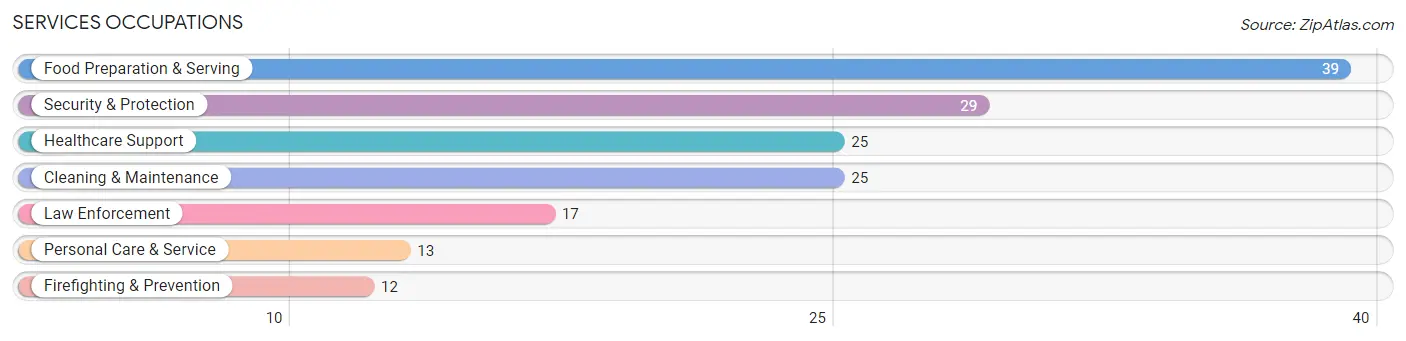
Services Occupations
The most common Services occupations in Freeman are Food Preparation & Serving (39 | 5.8%), Security & Protection (29 | 4.3%), Healthcare Support (25 | 3.7%), Cleaning & Maintenance (25 | 3.7%), and Law Enforcement (17 | 2.5%).
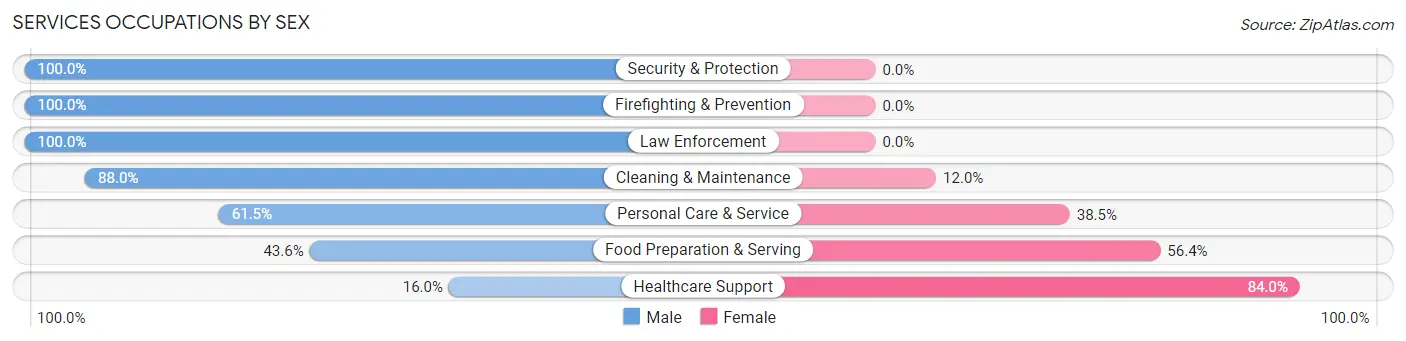
Services Occupations by Sex
Within the Services occupations in Freeman, the most male-oriented occupations are Security & Protection (100.0%), Firefighting & Prevention (100.0%), and Law Enforcement (100.0%), while the most female-oriented occupations are Healthcare Support (84.0%), Food Preparation & Serving (56.4%), and Personal Care & Service (38.5%).
| Occupation | Male | Female |
| Healthcare Support | 4 (16.0%) | 21 (84.0%) |
| Security & Protection | 29 (100.0%) | 0 (0.0%) |
| Firefighting & Prevention | 12 (100.0%) | 0 (0.0%) |
| Law Enforcement | 17 (100.0%) | 0 (0.0%) |
| Food Preparation & Serving | 17 (43.6%) | 22 (56.4%) |
| Cleaning & Maintenance | 22 (88.0%) | 3 (12.0%) |
| Personal Care & Service | 8 (61.5%) | 5 (38.5%) |
| Total (Category) | 80 (61.1%) | 51 (38.9%) |
| Total (Overall) | 382 (56.5%) | 294 (43.5%) |
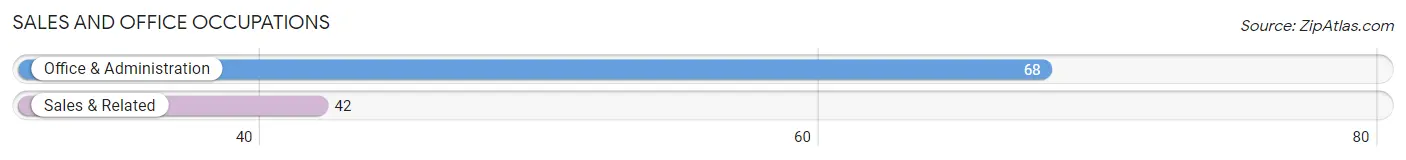
Sales and Office Occupations
The most common Sales and Office occupations in Freeman are Office & Administration (68 | 10.1%), and Sales & Related (42 | 6.2%).
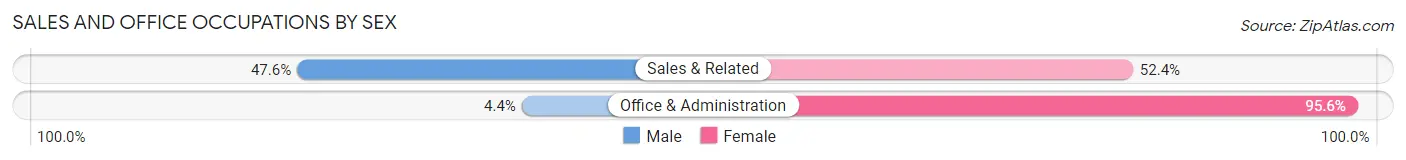
Sales and Office Occupations by Sex
| Occupation | Male | Female |
| Sales & Related | 20 (47.6%) | 22 (52.4%) |
| Office & Administration | 3 (4.4%) | 65 (95.6%) |
| Total (Category) | 23 (20.9%) | 87 (79.1%) |
| Total (Overall) | 382 (56.5%) | 294 (43.5%) |
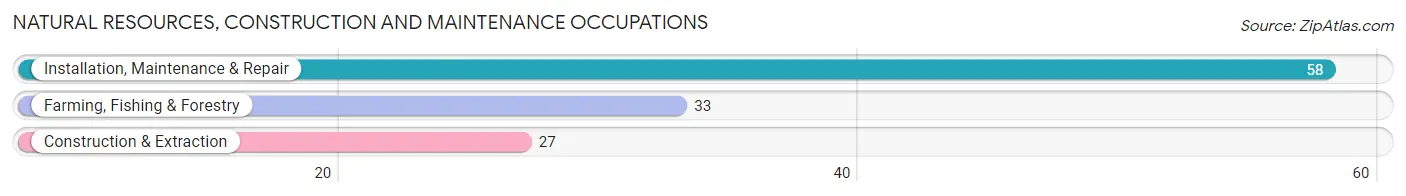
Natural Resources, Construction and Maintenance Occupations
The most common Natural Resources, Construction and Maintenance occupations in Freeman are Installation, Maintenance & Repair (58 | 8.6%), Farming, Fishing & Forestry (33 | 4.9%), and Construction & Extraction (27 | 4.0%).
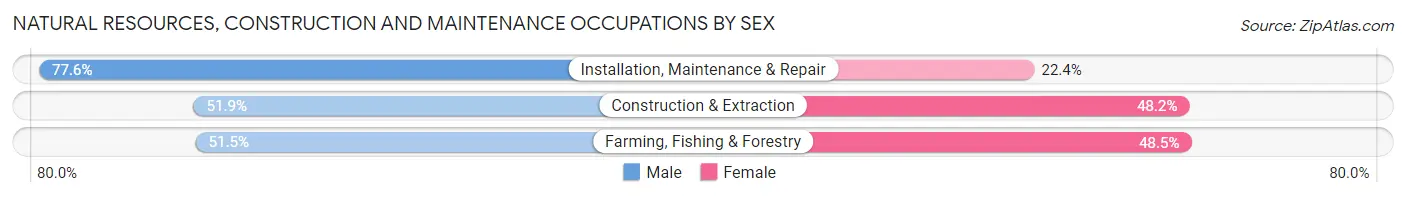
Natural Resources, Construction and Maintenance Occupations by Sex
| Occupation | Male | Female |
| Farming, Fishing & Forestry | 17 (51.5%) | 16 (48.5%) |
| Construction & Extraction | 14 (51.8%) | 13 (48.1%) |
| Installation, Maintenance & Repair | 45 (77.6%) | 13 (22.4%) |
| Total (Category) | 76 (64.4%) | 42 (35.6%) |
| Total (Overall) | 382 (56.5%) | 294 (43.5%) |
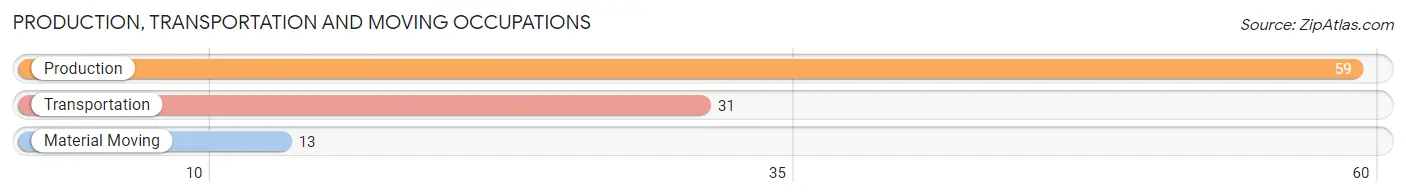
Production, Transportation and Moving Occupations
The most common Production, Transportation and Moving occupations in Freeman are Production (59 | 8.7%), Transportation (31 | 4.6%), and Material Moving (13 | 1.9%).
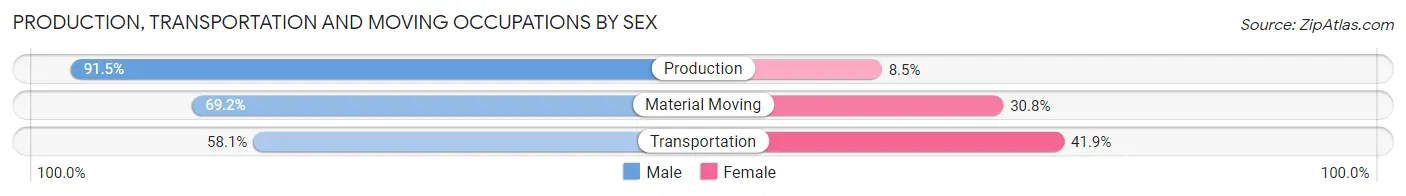
Production, Transportation and Moving Occupations by Sex
| Occupation | Male | Female |
| Production | 54 (91.5%) | 5 (8.5%) |
| Transportation | 18 (58.1%) | 13 (41.9%) |
| Material Moving | 9 (69.2%) | 4 (30.8%) |
| Total (Category) | 81 (78.6%) | 22 (21.4%) |
| Total (Overall) | 382 (56.5%) | 294 (43.5%) |
Employment Industries by Sex in Freeman
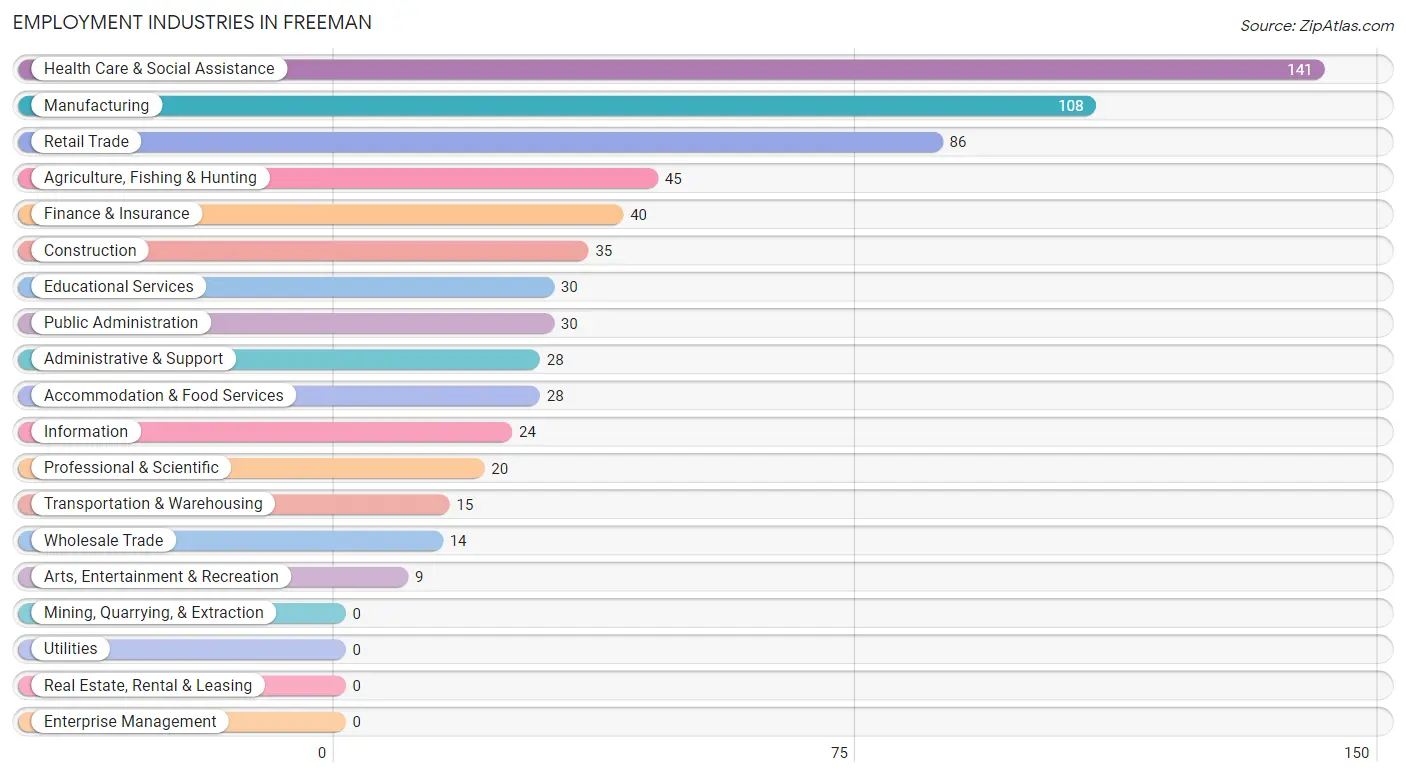
Employment Industries in Freeman
The major employment industries in Freeman include Health Care & Social Assistance (141 | 20.9%), Manufacturing (108 | 16.0%), Retail Trade (86 | 12.7%), Agriculture, Fishing & Hunting (45 | 6.7%), and Finance & Insurance (40 | 5.9%).
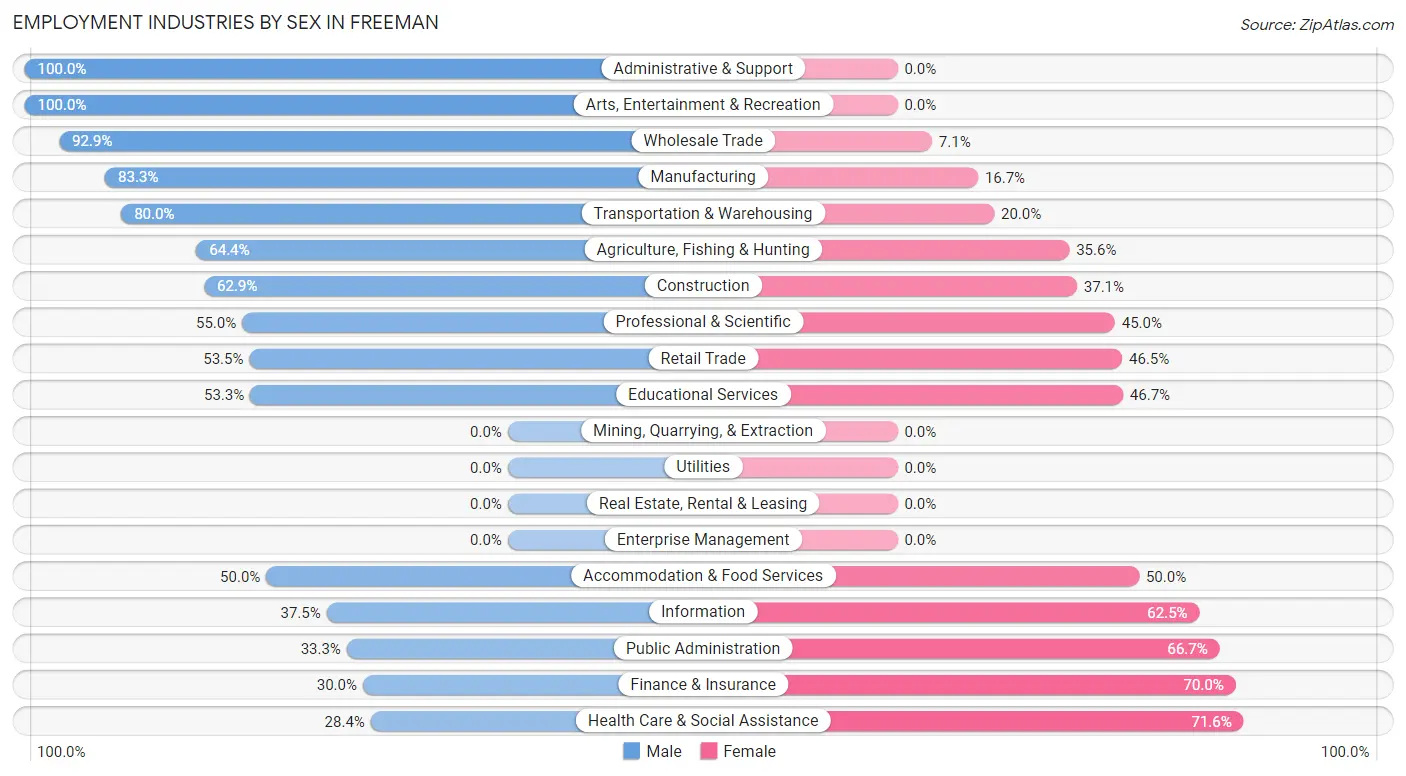
Employment Industries by Sex in Freeman
The Freeman industries that see more men than women are Administrative & Support (100.0%), Arts, Entertainment & Recreation (100.0%), and Wholesale Trade (92.9%), whereas the industries that tend to have a higher number of women are Health Care & Social Assistance (71.6%), Finance & Insurance (70.0%), and Public Administration (66.7%).
| Industry | Male | Female |
| Agriculture, Fishing & Hunting | 29 (64.4%) | 16 (35.6%) |
| Mining, Quarrying, & Extraction | 0 (0.0%) | 0 (0.0%) |
| Construction | 22 (62.9%) | 13 (37.1%) |
| Manufacturing | 90 (83.3%) | 18 (16.7%) |
| Wholesale Trade | 13 (92.9%) | 1 (7.1%) |
| Retail Trade | 46 (53.5%) | 40 (46.5%) |
| Transportation & Warehousing | 12 (80.0%) | 3 (20.0%) |
| Utilities | 0 (0.0%) | 0 (0.0%) |
| Information | 9 (37.5%) | 15 (62.5%) |
| Finance & Insurance | 12 (30.0%) | 28 (70.0%) |
| Real Estate, Rental & Leasing | 0 (0.0%) | 0 (0.0%) |
| Professional & Scientific | 11 (55.0%) | 9 (45.0%) |
| Enterprise Management | 0 (0.0%) | 0 (0.0%) |
| Administrative & Support | 28 (100.0%) | 0 (0.0%) |
| Educational Services | 16 (53.3%) | 14 (46.7%) |
| Health Care & Social Assistance | 40 (28.4%) | 101 (71.6%) |
| Arts, Entertainment & Recreation | 9 (100.0%) | 0 (0.0%) |
| Accommodation & Food Services | 14 (50.0%) | 14 (50.0%) |
| Public Administration | 10 (33.3%) | 20 (66.7%) |
| Total | 382 (56.5%) | 294 (43.5%) |
Education in Freeman
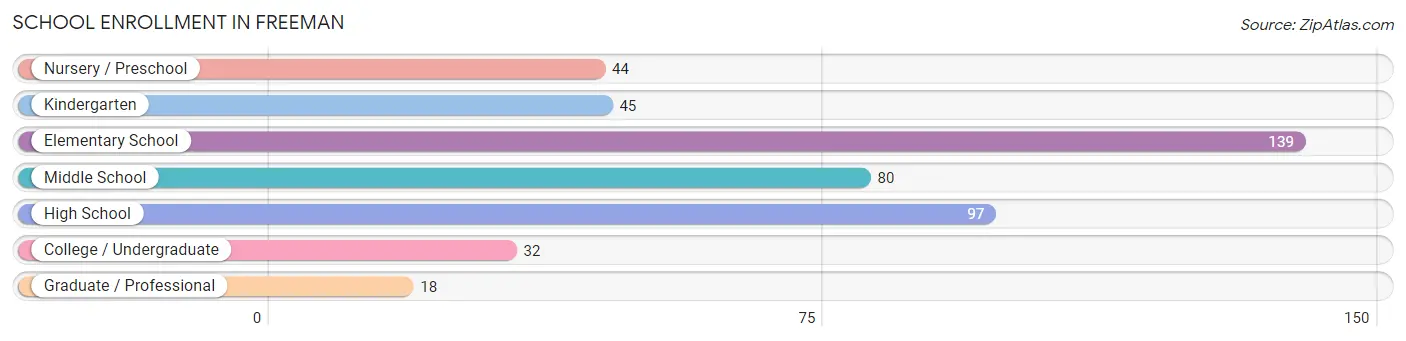
School Enrollment in Freeman
The most common levels of schooling among the 455 students in Freeman are elementary school (139 | 30.5%), high school (97 | 21.3%), and middle school (80 | 17.6%).
| School Level | # Students | % Students |
| Nursery / Preschool | 44 | 9.7% |
| Kindergarten | 45 | 9.9% |
| Elementary School | 139 | 30.5% |
| Middle School | 80 | 17.6% |
| High School | 97 | 21.3% |
| College / Undergraduate | 32 | 7.0% |
| Graduate / Professional | 18 | 4.0% |
| Total | 455 | 100.0% |
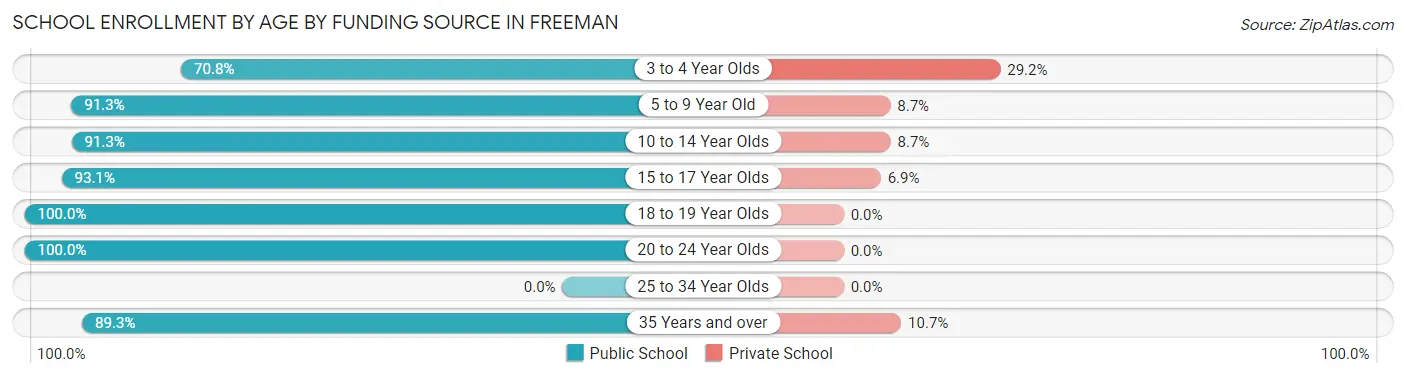
School Enrollment by Age by Funding Source in Freeman
Out of a total of 455 students who are enrolled in schools in Freeman, 42 (9.2%) attend a private institution, while the remaining 413 (90.8%) are enrolled in public schools. The age group of 3 to 4 year olds has the highest likelihood of being enrolled in private schools, with 7 (29.2% in the age bracket) enrolled. Conversely, the age group of 18 to 19 year olds has the lowest likelihood of being enrolled in a private school, with 26 (100.0% in the age bracket) attending a public institution.
| Age Bracket | Public School | Private School |
| 3 to 4 Year Olds | 17 (70.8%) | 7 (29.2%) |
| 5 to 9 Year Old | 168 (91.3%) | 16 (8.7%) |
| 10 to 14 Year Olds | 94 (91.3%) | 9 (8.7%) |
| 15 to 17 Year Olds | 54 (93.1%) | 4 (6.9%) |
| 18 to 19 Year Olds | 26 (100.0%) | 0 (0.0%) |
| 20 to 24 Year Olds | 4 (100.0%) | 0 (0.0%) |
| 25 to 34 Year Olds | 0 (0.0%) | 0 (0.0%) |
| 35 Years and over | 50 (89.3%) | 6 (10.7%) |
| Total | 413 (90.8%) | 42 (9.2%) |
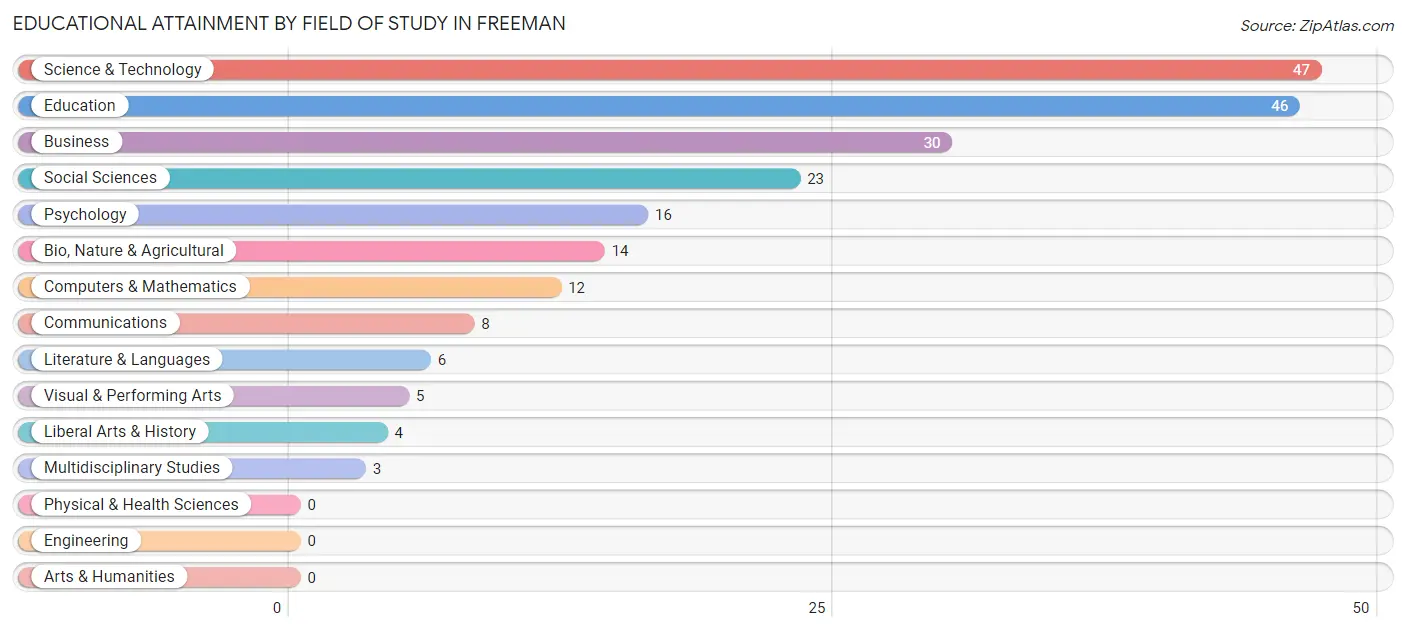
Educational Attainment by Field of Study in Freeman
Science & technology (47 | 22.0%), education (46 | 21.5%), business (30 | 14.0%), social sciences (23 | 10.7%), and psychology (16 | 7.5%) are the most common fields of study among 214 individuals in Freeman who have obtained a bachelor's degree or higher.
| Field of Study | # Graduates | % Graduates |
| Computers & Mathematics | 12 | 5.6% |
| Bio, Nature & Agricultural | 14 | 6.5% |
| Physical & Health Sciences | 0 | 0.0% |
| Psychology | 16 | 7.5% |
| Social Sciences | 23 | 10.7% |
| Engineering | 0 | 0.0% |
| Multidisciplinary Studies | 3 | 1.4% |
| Science & Technology | 47 | 22.0% |
| Business | 30 | 14.0% |
| Education | 46 | 21.5% |
| Literature & Languages | 6 | 2.8% |
| Liberal Arts & History | 4 | 1.9% |
| Visual & Performing Arts | 5 | 2.3% |
| Communications | 8 | 3.7% |
| Arts & Humanities | 0 | 0.0% |
| Total | 214 | 100.0% |
Transportation & Commute in Freeman
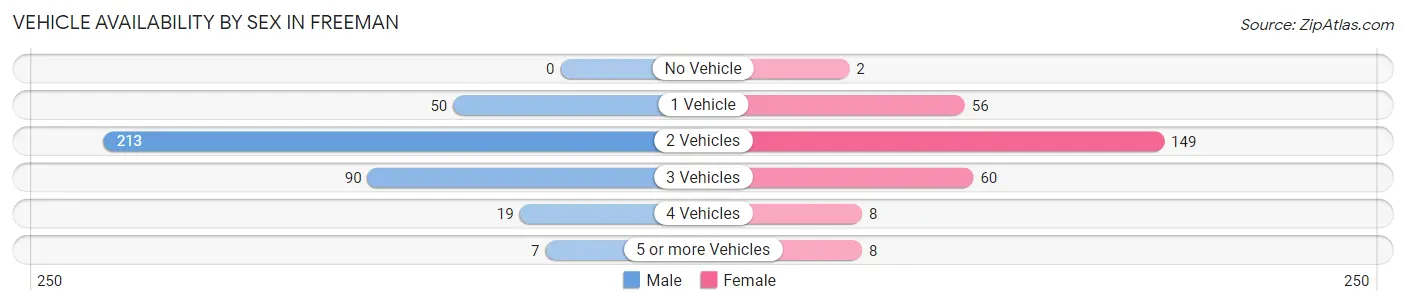
Vehicle Availability by Sex in Freeman
The most prevalent vehicle ownership categories in Freeman are males with 2 vehicles (213, accounting for 56.2%) and females with 2 vehicles (149, making up 75.3%).
| Vehicles Available | Male | Female |
| No Vehicle | 0 (0.0%) | 2 (0.7%) |
| 1 Vehicle | 50 (13.2%) | 56 (19.8%) |
| 2 Vehicles | 213 (56.2%) | 149 (52.6%) |
| 3 Vehicles | 90 (23.7%) | 60 (21.2%) |
| 4 Vehicles | 19 (5.0%) | 8 (2.8%) |
| 5 or more Vehicles | 7 (1.8%) | 8 (2.8%) |
| Total | 379 (100.0%) | 283 (100.0%) |
Commute Time in Freeman
The most frequently occuring commute durations in Freeman are 5 to 9 minutes (207 commuters, 31.8%), less than 5 minutes (178 commuters, 27.3%), and 15 to 19 minutes (62 commuters, 9.5%).
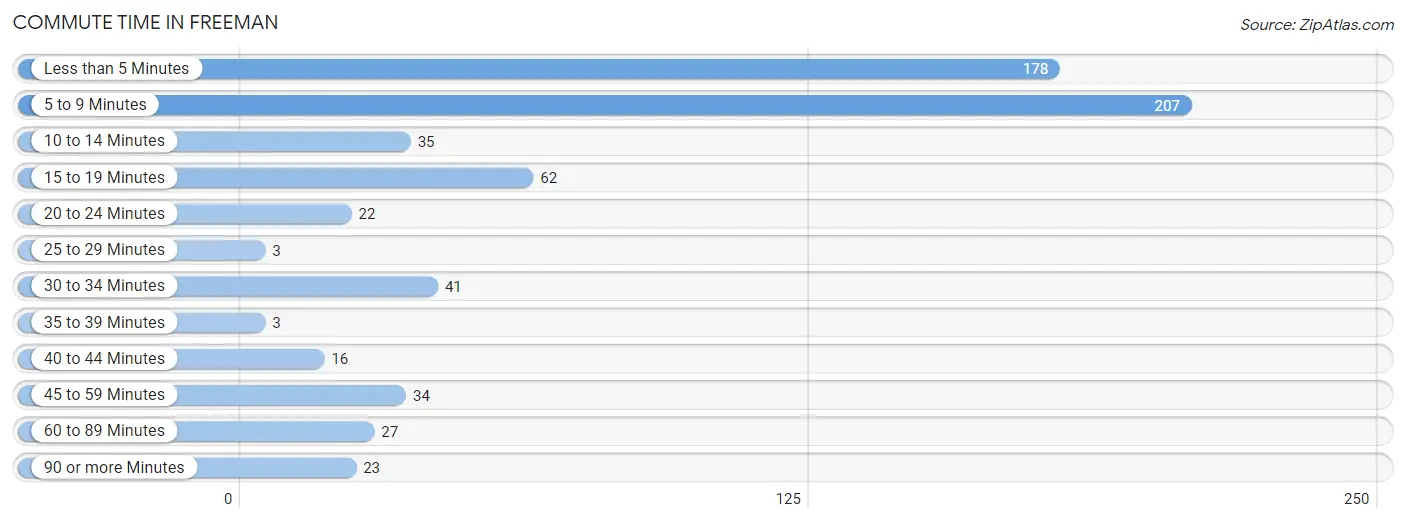
| Commute Time | # Commuters | % Commuters |
| Less than 5 Minutes | 178 | 27.3% |
| 5 to 9 Minutes | 207 | 31.8% |
| 10 to 14 Minutes | 35 | 5.4% |
| 15 to 19 Minutes | 62 | 9.5% |
| 20 to 24 Minutes | 22 | 3.4% |
| 25 to 29 Minutes | 3 | 0.5% |
| 30 to 34 Minutes | 41 | 6.3% |
| 35 to 39 Minutes | 3 | 0.5% |
| 40 to 44 Minutes | 16 | 2.5% |
| 45 to 59 Minutes | 34 | 5.2% |
| 60 to 89 Minutes | 27 | 4.2% |
| 90 or more Minutes | 23 | 3.5% |
Commute Time by Sex in Freeman
The most common commute times in Freeman are 5 to 9 minutes (123 commuters, 33.4%) for males and 5 to 9 minutes (84 commuters, 29.7%) for females.
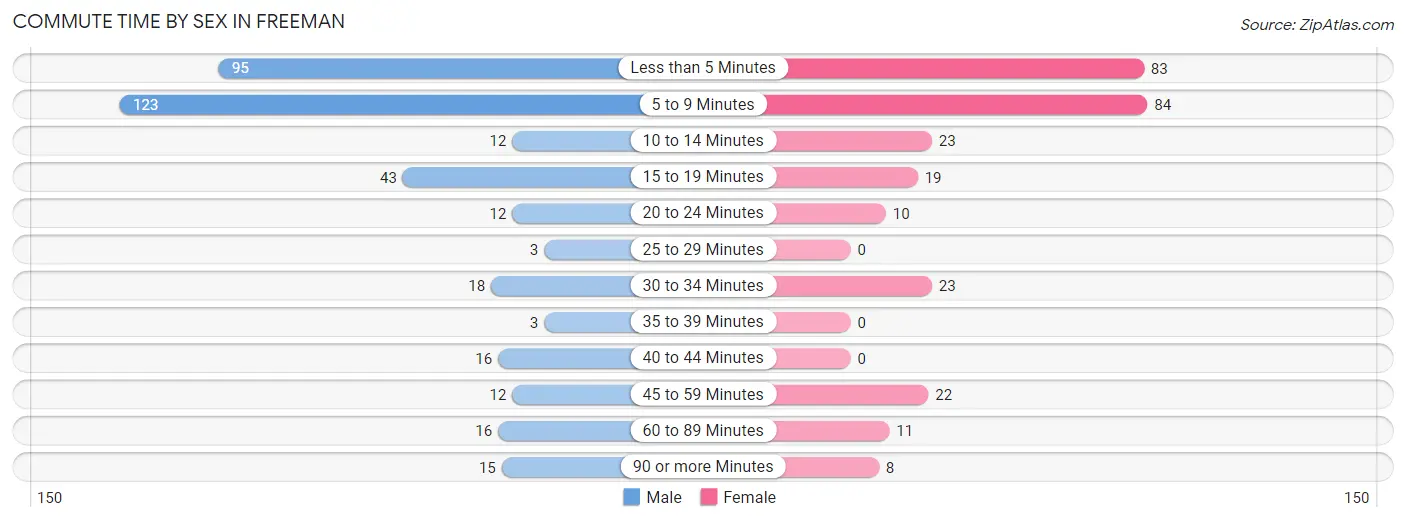
| Commute Time | Male | Female |
| Less than 5 Minutes | 95 (25.8%) | 83 (29.3%) |
| 5 to 9 Minutes | 123 (33.4%) | 84 (29.7%) |
| 10 to 14 Minutes | 12 (3.3%) | 23 (8.1%) |
| 15 to 19 Minutes | 43 (11.7%) | 19 (6.7%) |
| 20 to 24 Minutes | 12 (3.3%) | 10 (3.5%) |
| 25 to 29 Minutes | 3 (0.8%) | 0 (0.0%) |
| 30 to 34 Minutes | 18 (4.9%) | 23 (8.1%) |
| 35 to 39 Minutes | 3 (0.8%) | 0 (0.0%) |
| 40 to 44 Minutes | 16 (4.3%) | 0 (0.0%) |
| 45 to 59 Minutes | 12 (3.3%) | 22 (7.8%) |
| 60 to 89 Minutes | 16 (4.3%) | 11 (3.9%) |
| 90 or more Minutes | 15 (4.1%) | 8 (2.8%) |
Time of Departure to Work by Sex in Freeman
The most frequent times of departure to work in Freeman are 7:00 AM to 7:29 AM (92, 25.0%) for males and 7:00 AM to 7:29 AM (49, 17.3%) for females.
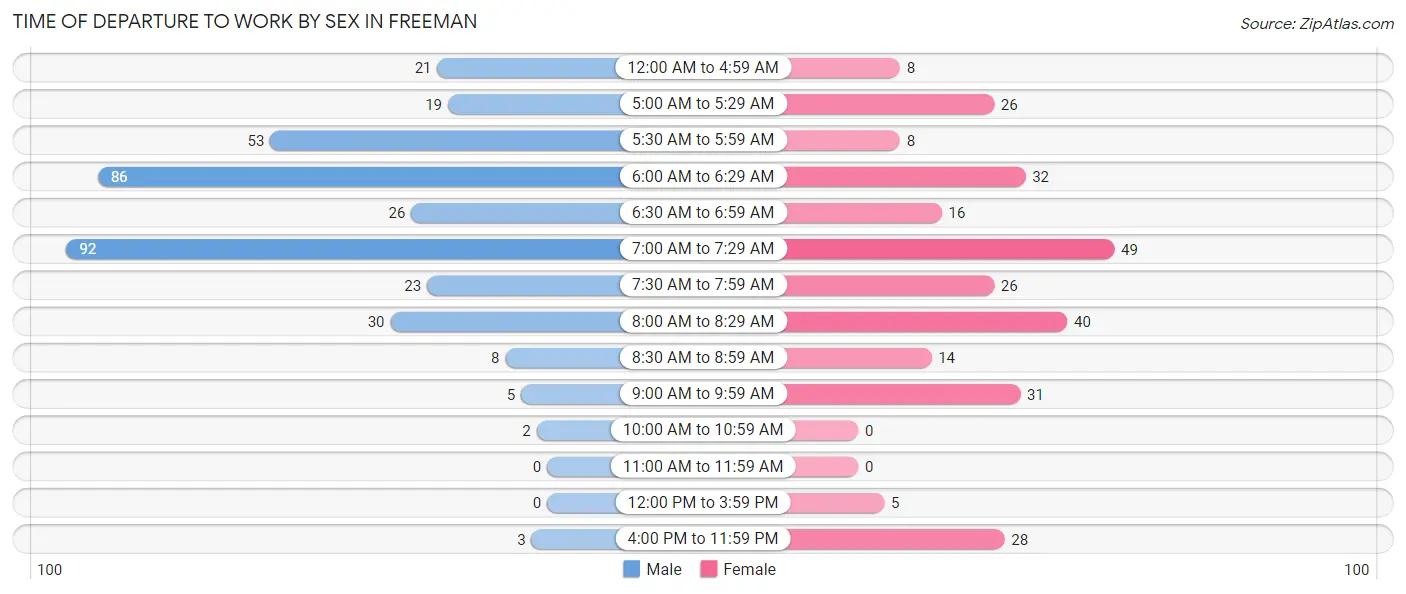
| Time of Departure | Male | Female |
| 12:00 AM to 4:59 AM | 21 (5.7%) | 8 (2.8%) |
| 5:00 AM to 5:29 AM | 19 (5.2%) | 26 (9.2%) |
| 5:30 AM to 5:59 AM | 53 (14.4%) | 8 (2.8%) |
| 6:00 AM to 6:29 AM | 86 (23.4%) | 32 (11.3%) |
| 6:30 AM to 6:59 AM | 26 (7.1%) | 16 (5.7%) |
| 7:00 AM to 7:29 AM | 92 (25.0%) | 49 (17.3%) |
| 7:30 AM to 7:59 AM | 23 (6.2%) | 26 (9.2%) |
| 8:00 AM to 8:29 AM | 30 (8.2%) | 40 (14.1%) |
| 8:30 AM to 8:59 AM | 8 (2.2%) | 14 (5.0%) |
| 9:00 AM to 9:59 AM | 5 (1.4%) | 31 (11.0%) |
| 10:00 AM to 10:59 AM | 2 (0.5%) | 0 (0.0%) |
| 11:00 AM to 11:59 AM | 0 (0.0%) | 0 (0.0%) |
| 12:00 PM to 3:59 PM | 0 (0.0%) | 5 (1.8%) |
| 4:00 PM to 11:59 PM | 3 (0.8%) | 28 (9.9%) |
| Total | 368 (100.0%) | 283 (100.0%) |
Housing Occupancy in Freeman
Occupancy by Ownership in Freeman
Of the total 567 dwellings in Freeman, owner-occupied units account for 407 (71.8%), while renter-occupied units make up 160 (28.2%).
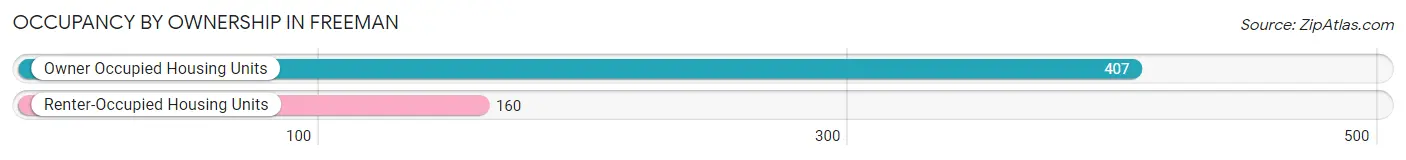
| Occupancy | # Housing Units | % Housing Units |
| Owner Occupied Housing Units | 407 | 71.8% |
| Renter-Occupied Housing Units | 160 | 28.2% |
| Total Occupied Housing Units | 567 | 100.0% |
Occupancy by Household Size in Freeman
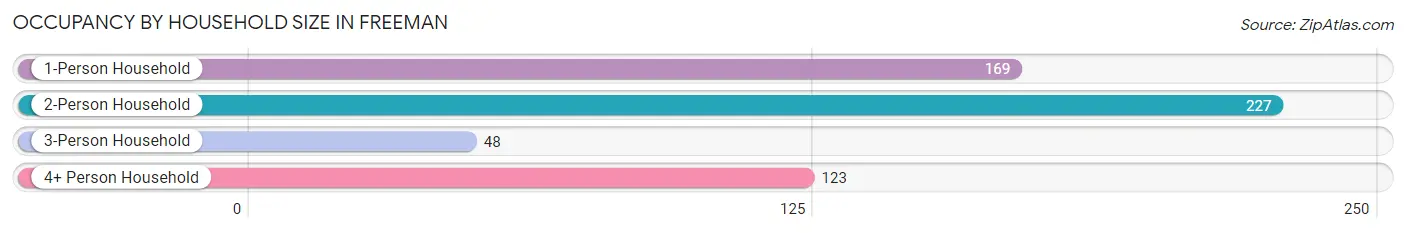
| Household Size | # Housing Units | % Housing Units |
| 1-Person Household | 169 | 29.8% |
| 2-Person Household | 227 | 40.0% |
| 3-Person Household | 48 | 8.5% |
| 4+ Person Household | 123 | 21.7% |
| Total Housing Units | 567 | 100.0% |
Occupancy by Ownership by Household Size in Freeman
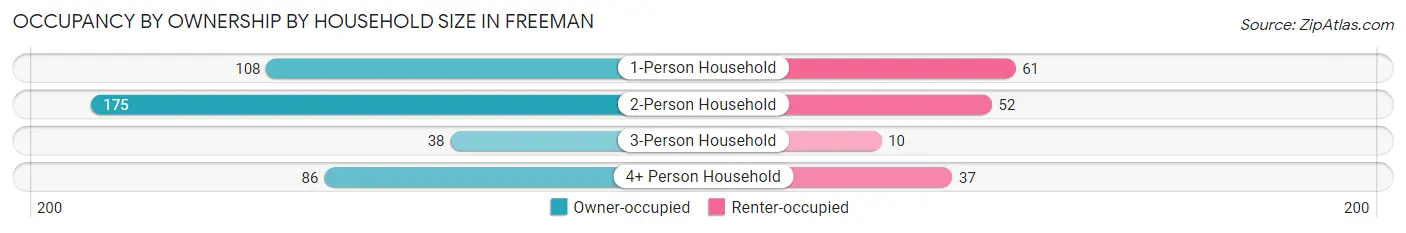
| Household Size | Owner-occupied | Renter-occupied |
| 1-Person Household | 108 (63.9%) | 61 (36.1%) |
| 2-Person Household | 175 (77.1%) | 52 (22.9%) |
| 3-Person Household | 38 (79.2%) | 10 (20.8%) |
| 4+ Person Household | 86 (69.9%) | 37 (30.1%) |
| Total Housing Units | 407 (71.8%) | 160 (28.2%) |
Occupancy by Educational Attainment in Freeman
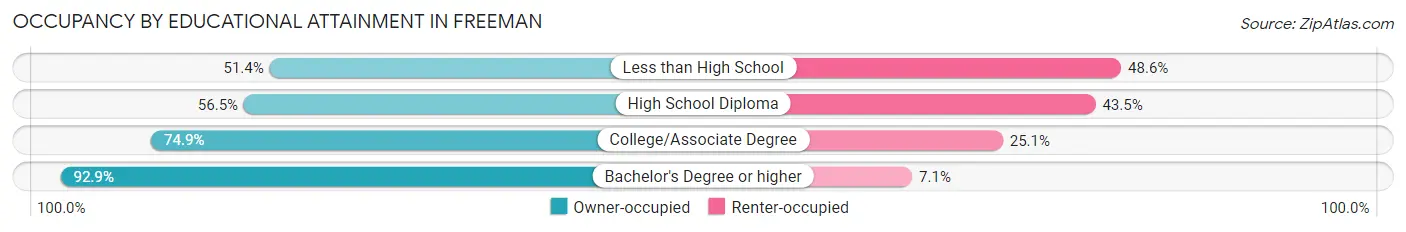
| Household Size | Owner-occupied | Renter-occupied |
| Less than High School | 18 (51.4%) | 17 (48.6%) |
| High School Diploma | 91 (56.5%) | 70 (43.5%) |
| College/Associate Degree | 194 (74.9%) | 65 (25.1%) |
| Bachelor's Degree or higher | 104 (92.9%) | 8 (7.1%) |
Occupancy by Age of Householder in Freeman
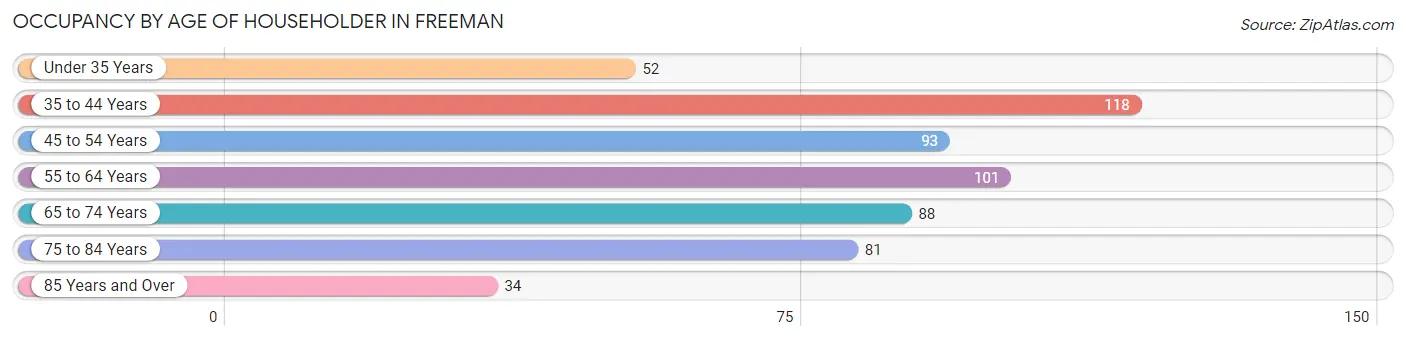
| Age Bracket | # Households | % Households |
| Under 35 Years | 52 | 9.2% |
| 35 to 44 Years | 118 | 20.8% |
| 45 to 54 Years | 93 | 16.4% |
| 55 to 64 Years | 101 | 17.8% |
| 65 to 74 Years | 88 | 15.5% |
| 75 to 84 Years | 81 | 14.3% |
| 85 Years and Over | 34 | 6.0% |
| Total | 567 | 100.0% |
Housing Finances in Freeman
Median Income by Occupancy in Freeman
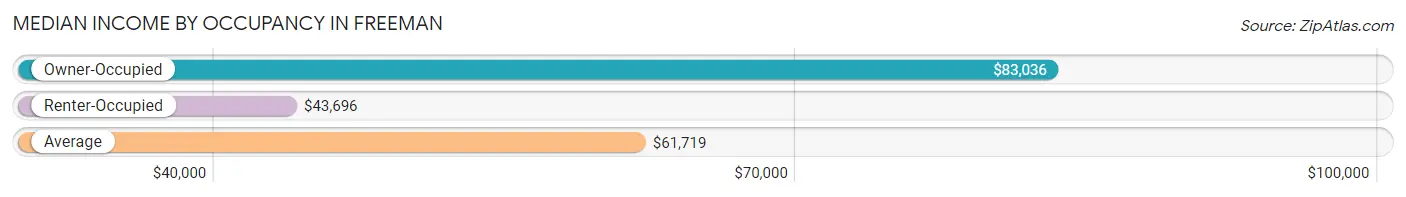
| Occupancy Type | # Households | Median Income |
| Owner-Occupied | 407 (71.8%) | $83,036 |
| Renter-Occupied | 160 (28.2%) | $43,696 |
| Average | 567 (100.0%) | $61,719 |
Occupancy by Householder Income Bracket in Freeman
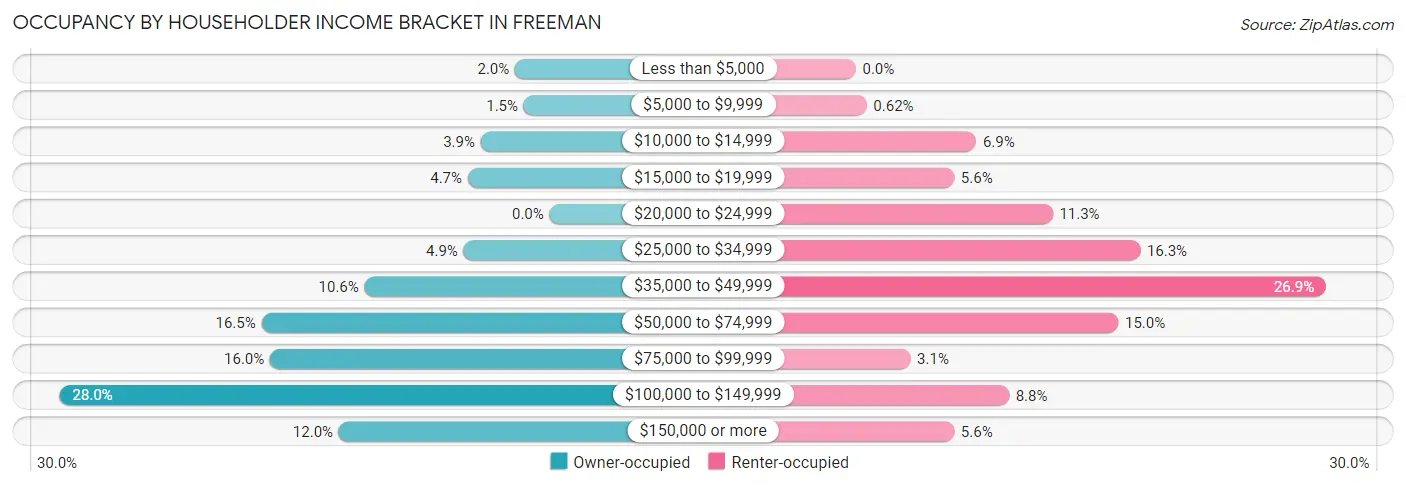
| Income Bracket | Owner-occupied | Renter-occupied |
| Less than $5,000 | 8 (2.0%) | 0 (0.0%) |
| $5,000 to $9,999 | 6 (1.5%) | 1 (0.6%) |
| $10,000 to $14,999 | 16 (3.9%) | 11 (6.9%) |
| $15,000 to $19,999 | 19 (4.7%) | 9 (5.6%) |
| $20,000 to $24,999 | 0 (0.0%) | 18 (11.3%) |
| $25,000 to $34,999 | 20 (4.9%) | 26 (16.3%) |
| $35,000 to $49,999 | 43 (10.6%) | 43 (26.9%) |
| $50,000 to $74,999 | 67 (16.5%) | 24 (15.0%) |
| $75,000 to $99,999 | 65 (16.0%) | 5 (3.1%) |
| $100,000 to $149,999 | 114 (28.0%) | 14 (8.7%) |
| $150,000 or more | 49 (12.0%) | 9 (5.6%) |
| Total | 407 (100.0%) | 160 (100.0%) |
Monthly Housing Cost Tiers in Freeman
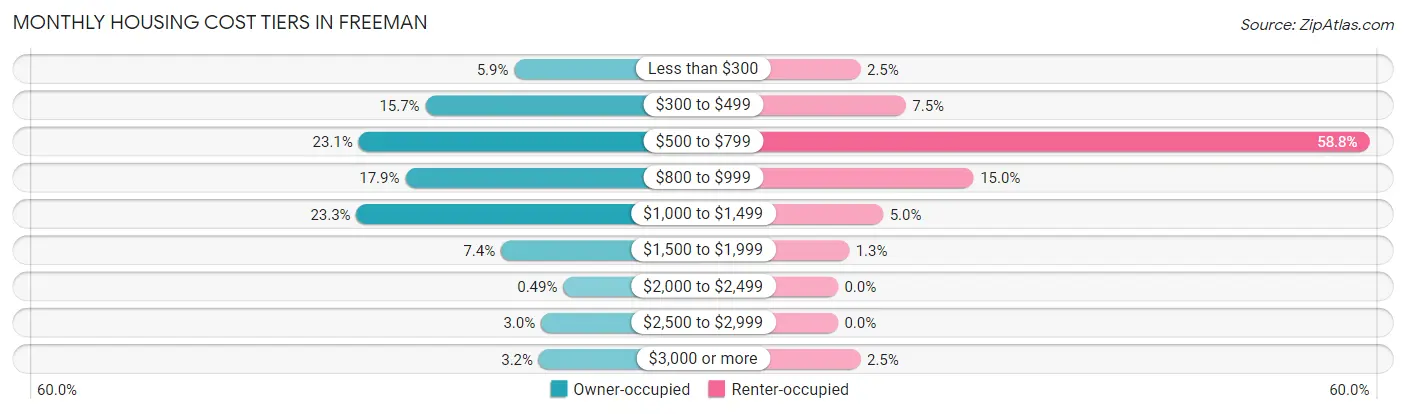
| Monthly Cost | Owner-occupied | Renter-occupied |
| Less than $300 | 24 (5.9%) | 4 (2.5%) |
| $300 to $499 | 64 (15.7%) | 12 (7.5%) |
| $500 to $799 | 94 (23.1%) | 94 (58.8%) |
| $800 to $999 | 73 (17.9%) | 24 (15.0%) |
| $1,000 to $1,499 | 95 (23.3%) | 8 (5.0%) |
| $1,500 to $1,999 | 30 (7.4%) | 2 (1.3%) |
| $2,000 to $2,499 | 2 (0.5%) | 0 (0.0%) |
| $2,500 to $2,999 | 12 (2.9%) | 0 (0.0%) |
| $3,000 or more | 13 (3.2%) | 4 (2.5%) |
| Total | 407 (100.0%) | 160 (100.0%) |
Physical Housing Characteristics in Freeman
Housing Structures in Freeman
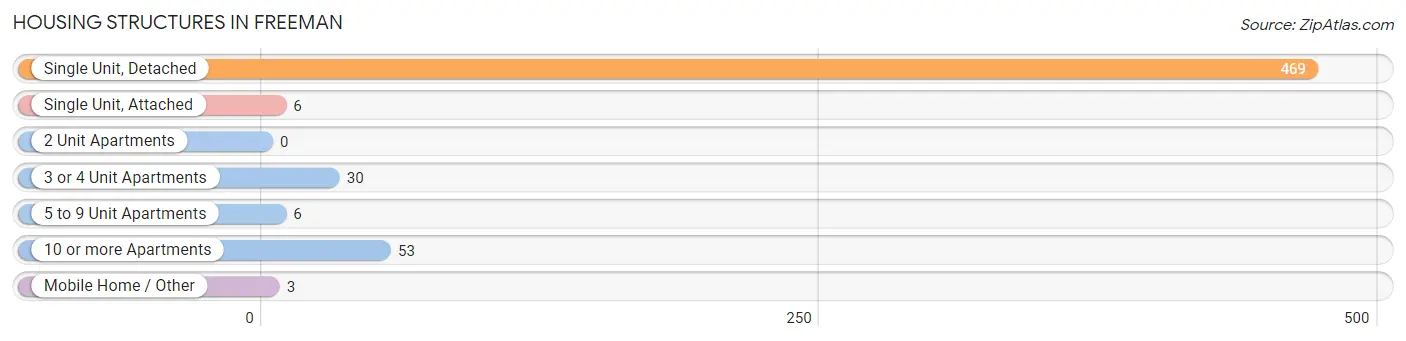
| Structure Type | # Housing Units | % Housing Units |
| Single Unit, Detached | 469 | 82.7% |
| Single Unit, Attached | 6 | 1.1% |
| 2 Unit Apartments | 0 | 0.0% |
| 3 or 4 Unit Apartments | 30 | 5.3% |
| 5 to 9 Unit Apartments | 6 | 1.1% |
| 10 or more Apartments | 53 | 9.3% |
| Mobile Home / Other | 3 | 0.5% |
| Total | 567 | 100.0% |
Housing Structures by Occupancy in Freeman
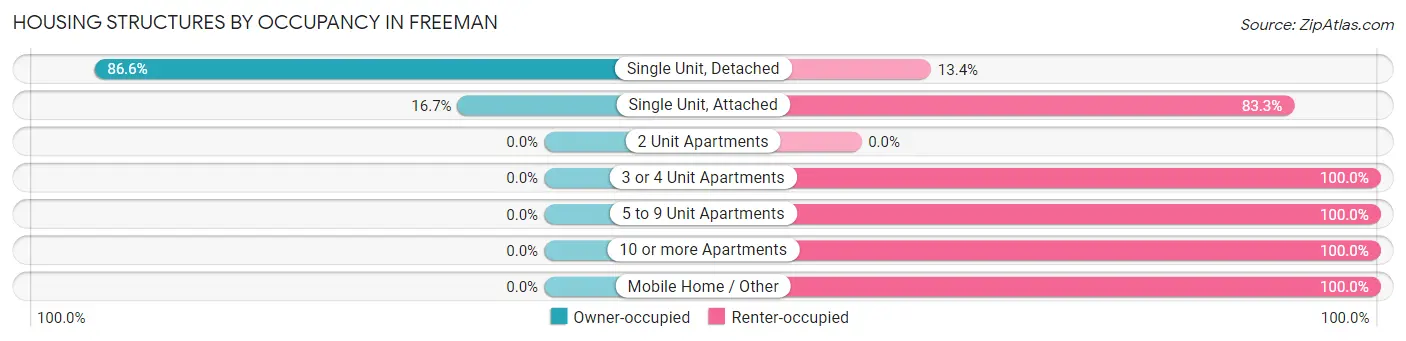
| Structure Type | Owner-occupied | Renter-occupied |
| Single Unit, Detached | 406 (86.6%) | 63 (13.4%) |
| Single Unit, Attached | 1 (16.7%) | 5 (83.3%) |
| 2 Unit Apartments | 0 (0.0%) | 0 (0.0%) |
| 3 or 4 Unit Apartments | 0 (0.0%) | 30 (100.0%) |
| 5 to 9 Unit Apartments | 0 (0.0%) | 6 (100.0%) |
| 10 or more Apartments | 0 (0.0%) | 53 (100.0%) |
| Mobile Home / Other | 0 (0.0%) | 3 (100.0%) |
| Total | 407 (71.8%) | 160 (28.2%) |
Housing Structures by Number of Rooms in Freeman
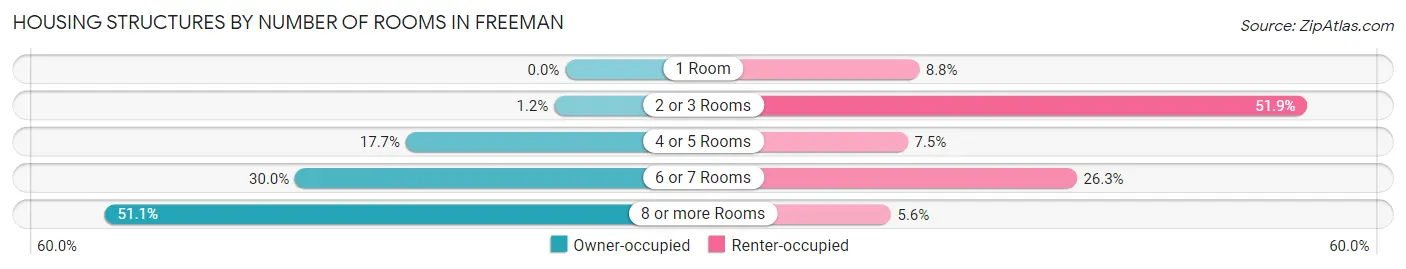
| Number of Rooms | Owner-occupied | Renter-occupied |
| 1 Room | 0 (0.0%) | 14 (8.7%) |
| 2 or 3 Rooms | 5 (1.2%) | 83 (51.9%) |
| 4 or 5 Rooms | 72 (17.7%) | 12 (7.5%) |
| 6 or 7 Rooms | 122 (30.0%) | 42 (26.3%) |
| 8 or more Rooms | 208 (51.1%) | 9 (5.6%) |
| Total | 407 (100.0%) | 160 (100.0%) |
Housing Structure by Heating Type in Freeman
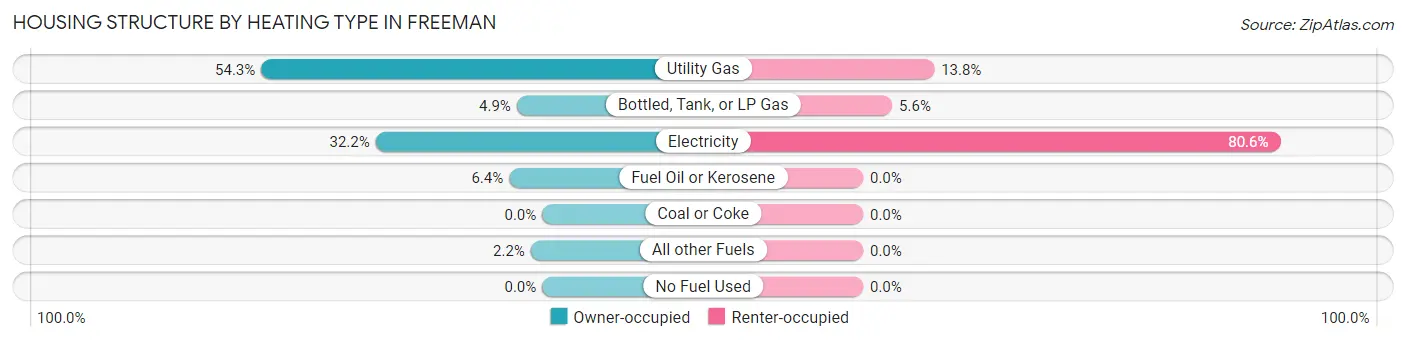
| Heating Type | Owner-occupied | Renter-occupied |
| Utility Gas | 221 (54.3%) | 22 (13.8%) |
| Bottled, Tank, or LP Gas | 20 (4.9%) | 9 (5.6%) |
| Electricity | 131 (32.2%) | 129 (80.6%) |
| Fuel Oil or Kerosene | 26 (6.4%) | 0 (0.0%) |
| Coal or Coke | 0 (0.0%) | 0 (0.0%) |
| All other Fuels | 9 (2.2%) | 0 (0.0%) |
| No Fuel Used | 0 (0.0%) | 0 (0.0%) |
| Total | 407 (100.0%) | 160 (100.0%) |
Household Vehicle Usage in Freeman
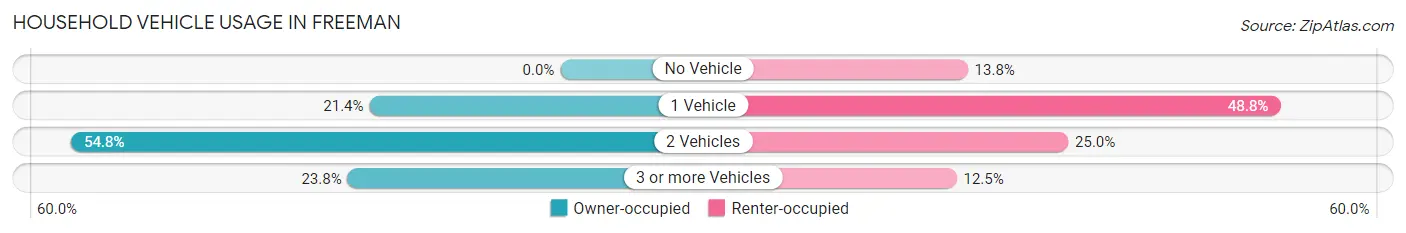
| Vehicles per Household | Owner-occupied | Renter-occupied |
| No Vehicle | 0 (0.0%) | 22 (13.8%) |
| 1 Vehicle | 87 (21.4%) | 78 (48.7%) |
| 2 Vehicles | 223 (54.8%) | 40 (25.0%) |
| 3 or more Vehicles | 97 (23.8%) | 20 (12.5%) |
| Total | 407 (100.0%) | 160 (100.0%) |
Real Estate & Mortgages in Freeman
Real Estate and Mortgage Overview in Freeman
| Characteristic | Without Mortgage | With Mortgage |
| Housing Units | 202 | 205 |
| Median Property Value | $158,100 | $160,100 |
| Median Household Income | $62,813 | $13 |
| Monthly Housing Costs | $546 | $13 |
| Real Estate Taxes | $1,861 | $0 |
Property Value by Mortgage Status in Freeman
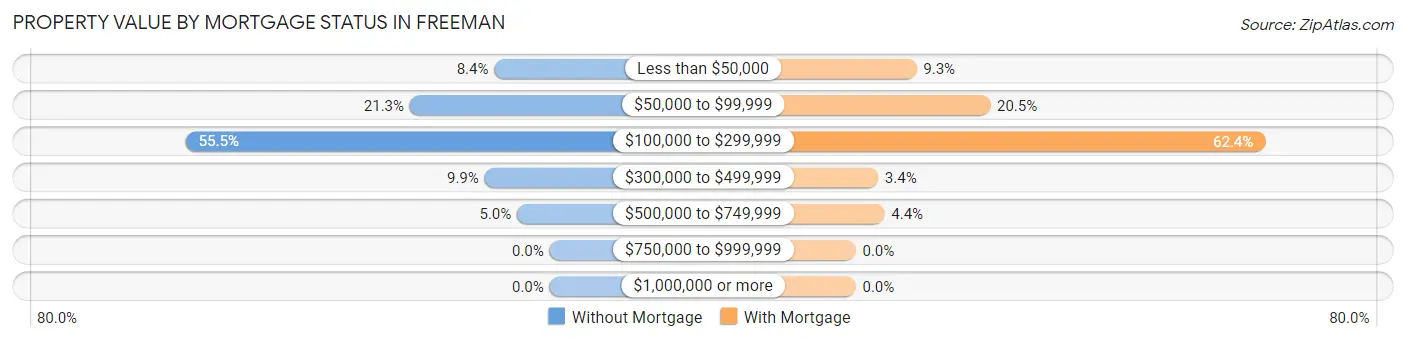
| Property Value | Without Mortgage | With Mortgage |
| Less than $50,000 | 17 (8.4%) | 19 (9.3%) |
| $50,000 to $99,999 | 43 (21.3%) | 42 (20.5%) |
| $100,000 to $299,999 | 112 (55.4%) | 128 (62.4%) |
| $300,000 to $499,999 | 20 (9.9%) | 7 (3.4%) |
| $500,000 to $749,999 | 10 (5.0%) | 9 (4.4%) |
| $750,000 to $999,999 | 0 (0.0%) | 0 (0.0%) |
| $1,000,000 or more | 0 (0.0%) | 0 (0.0%) |
| Total | 202 (100.0%) | 205 (100.0%) |
Household Income by Mortgage Status in Freeman
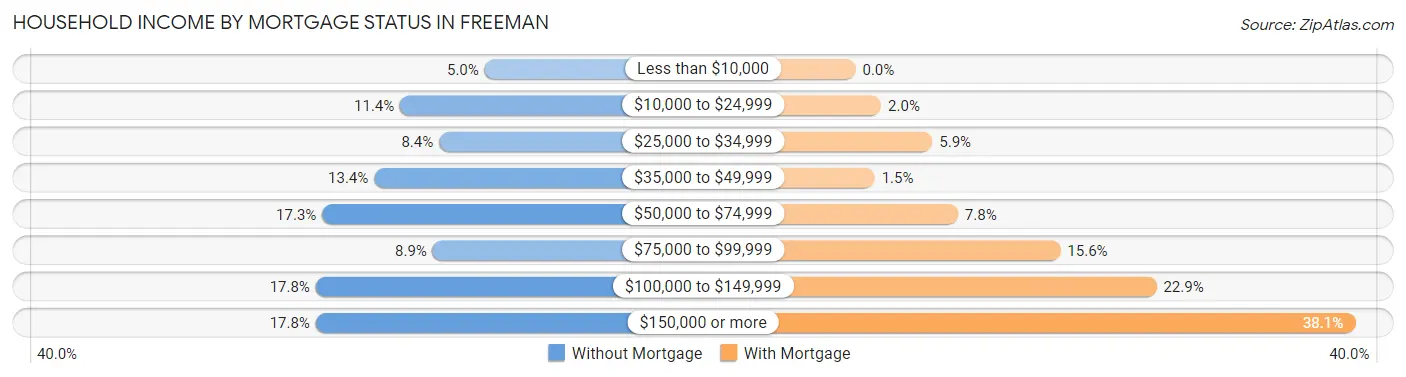
| Household Income | Without Mortgage | With Mortgage |
| Less than $10,000 | 10 (5.0%) | 0 (0.0%) |
| $10,000 to $24,999 | 23 (11.4%) | 4 (1.9%) |
| $25,000 to $34,999 | 17 (8.4%) | 12 (5.9%) |
| $35,000 to $49,999 | 27 (13.4%) | 3 (1.5%) |
| $50,000 to $74,999 | 35 (17.3%) | 16 (7.8%) |
| $75,000 to $99,999 | 18 (8.9%) | 32 (15.6%) |
| $100,000 to $149,999 | 36 (17.8%) | 47 (22.9%) |
| $150,000 or more | 36 (17.8%) | 78 (38.1%) |
| Total | 202 (100.0%) | 205 (100.0%) |
Property Value to Household Income Ratio in Freeman
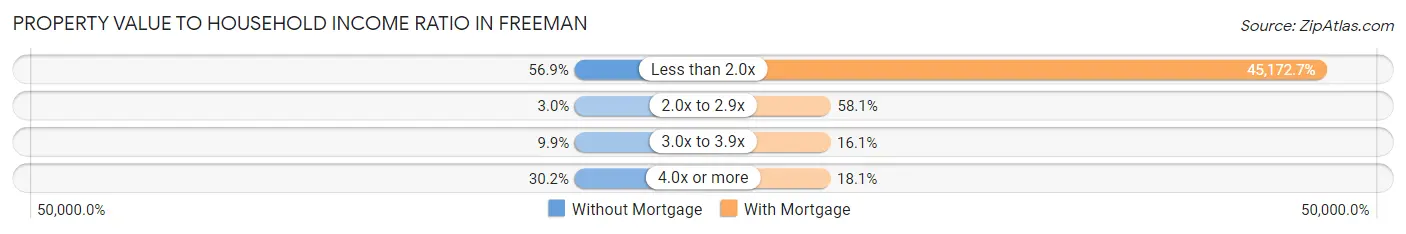
| Value-to-Income Ratio | Without Mortgage | With Mortgage |
| Less than 2.0x | 115 (56.9%) | 92,604 (45,172.7%) |
| 2.0x to 2.9x | 6 (3.0%) | 119 (58.1%) |
| 3.0x to 3.9x | 20 (9.9%) | 33 (16.1%) |
| 4.0x or more | 61 (30.2%) | 37 (18.0%) |
| Total | 202 (100.0%) | 205 (100.0%) |
Real Estate Taxes by Mortgage Status in Freeman
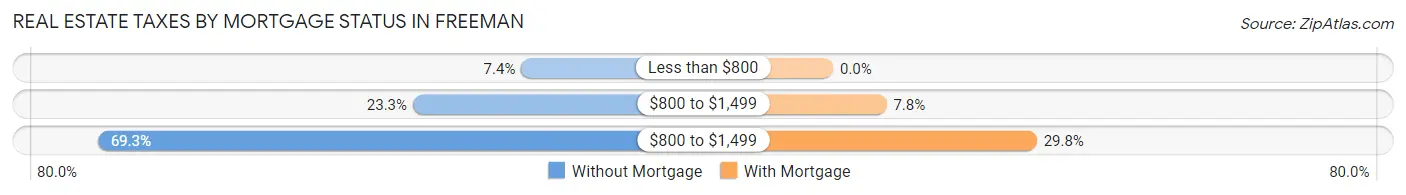
| Property Taxes | Without Mortgage | With Mortgage |
| Less than $800 | 15 (7.4%) | 0 (0.0%) |
| $800 to $1,499 | 47 (23.3%) | 16 (7.8%) |
| $800 to $1,499 | 140 (69.3%) | 61 (29.8%) |
| Total | 202 (100.0%) | 205 (100.0%) |
Health & Disability in Freeman
Health Insurance Coverage by Age in Freeman
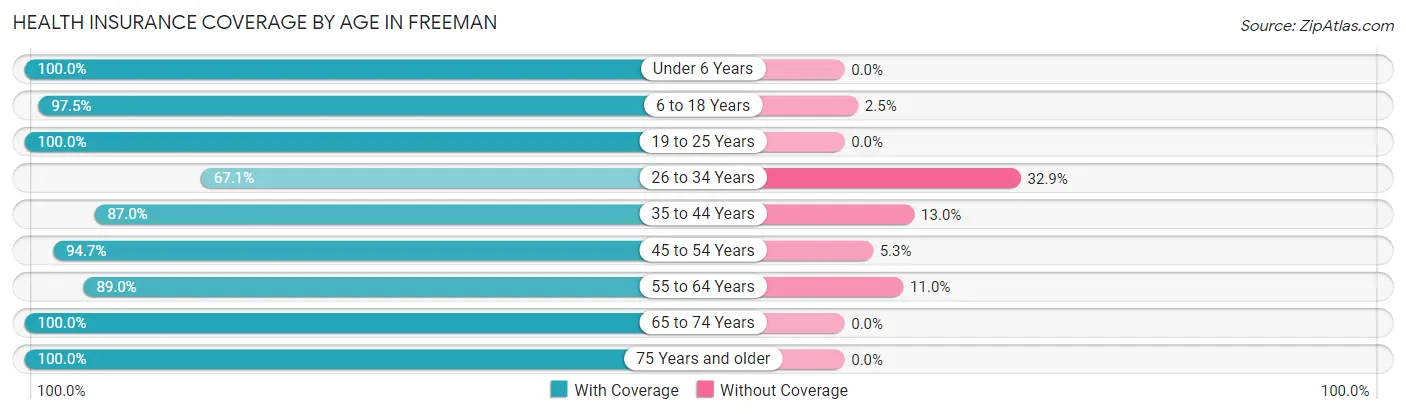
| Age Bracket | With Coverage | Without Coverage |
| Under 6 Years | 210 (100.0%) | 0 (0.0%) |
| 6 to 18 Years | 345 (97.5%) | 9 (2.5%) |
| 19 to 25 Years | 34 (100.0%) | 0 (0.0%) |
| 26 to 34 Years | 49 (67.1%) | 24 (32.9%) |
| 35 to 44 Years | 207 (87.0%) | 31 (13.0%) |
| 45 to 54 Years | 143 (94.7%) | 8 (5.3%) |
| 55 to 64 Years | 146 (89.0%) | 18 (11.0%) |
| 65 to 74 Years | 135 (100.0%) | 0 (0.0%) |
| 75 Years and older | 159 (100.0%) | 0 (0.0%) |
| Total | 1,428 (94.1%) | 90 (5.9%) |
Health Insurance Coverage by Citizenship Status in Freeman
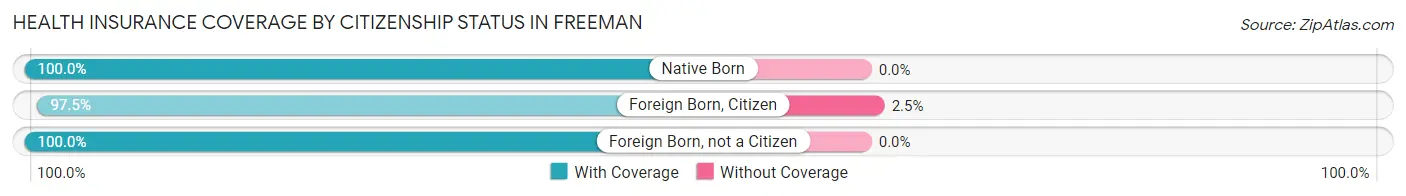
| Citizenship Status | With Coverage | Without Coverage |
| Native Born | 210 (100.0%) | 0 (0.0%) |
| Foreign Born, Citizen | 345 (97.5%) | 9 (2.5%) |
| Foreign Born, not a Citizen | 34 (100.0%) | 0 (0.0%) |
Health Insurance Coverage by Household Income in Freeman
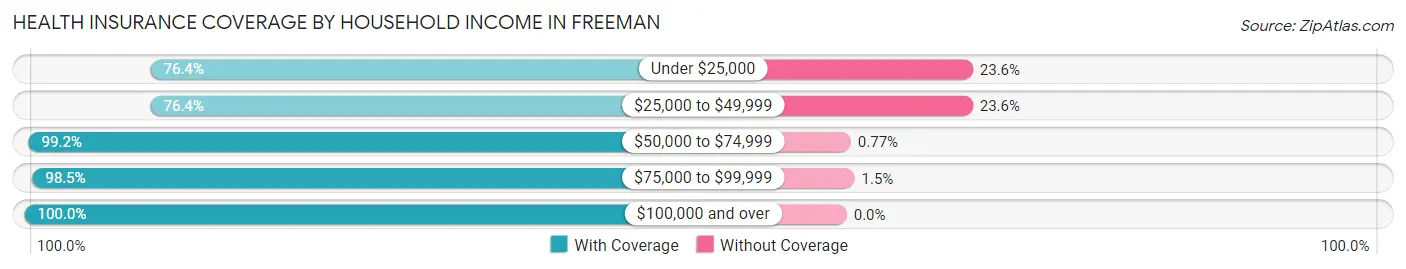
| Household Income | With Coverage | Without Coverage |
| Under $25,000 | 97 (76.4%) | 30 (23.6%) |
| $25,000 to $49,999 | 178 (76.4%) | 55 (23.6%) |
| $50,000 to $74,999 | 389 (99.2%) | 3 (0.8%) |
| $75,000 to $99,999 | 135 (98.5%) | 2 (1.5%) |
| $100,000 and over | 618 (100.0%) | 0 (0.0%) |
Public vs Private Health Insurance Coverage by Age in Freeman
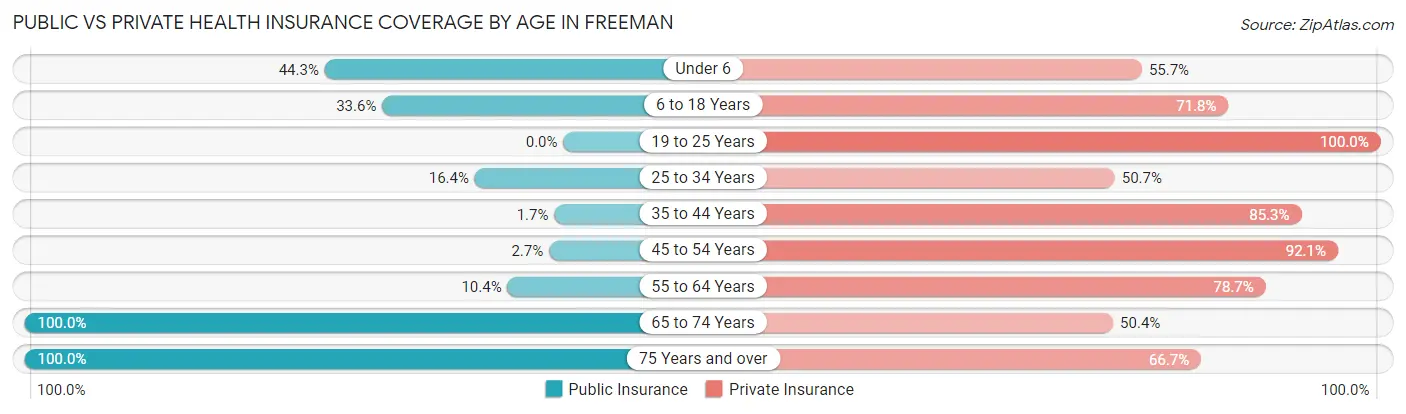
| Age Bracket | Public Insurance | Private Insurance |
| Under 6 | 93 (44.3%) | 117 (55.7%) |
| 6 to 18 Years | 119 (33.6%) | 254 (71.8%) |
| 19 to 25 Years | 0 (0.0%) | 34 (100.0%) |
| 25 to 34 Years | 12 (16.4%) | 37 (50.7%) |
| 35 to 44 Years | 4 (1.7%) | 203 (85.3%) |
| 45 to 54 Years | 4 (2.6%) | 139 (92.0%) |
| 55 to 64 Years | 17 (10.4%) | 129 (78.7%) |
| 65 to 74 Years | 135 (100.0%) | 68 (50.4%) |
| 75 Years and over | 159 (100.0%) | 106 (66.7%) |
| Total | 543 (35.8%) | 1,087 (71.6%) |
Disability Status by Sex by Age in Freeman
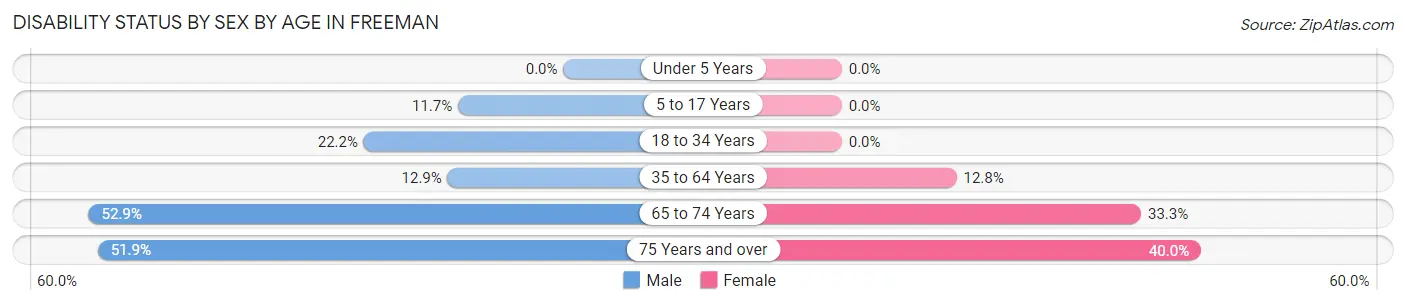
| Age Bracket | Male | Female |
| Under 5 Years | 0 (0.0%) | 0 (0.0%) |
| 5 to 17 Years | 19 (11.7%) | 0 (0.0%) |
| 18 to 34 Years | 10 (22.2%) | 0 (0.0%) |
| 35 to 64 Years | 37 (12.9%) | 34 (12.8%) |
| 65 to 74 Years | 46 (52.9%) | 16 (33.3%) |
| 75 Years and over | 28 (51.8%) | 42 (40.0%) |
Disability Class by Sex by Age in Freeman
Disability Class: Hearing Difficulty
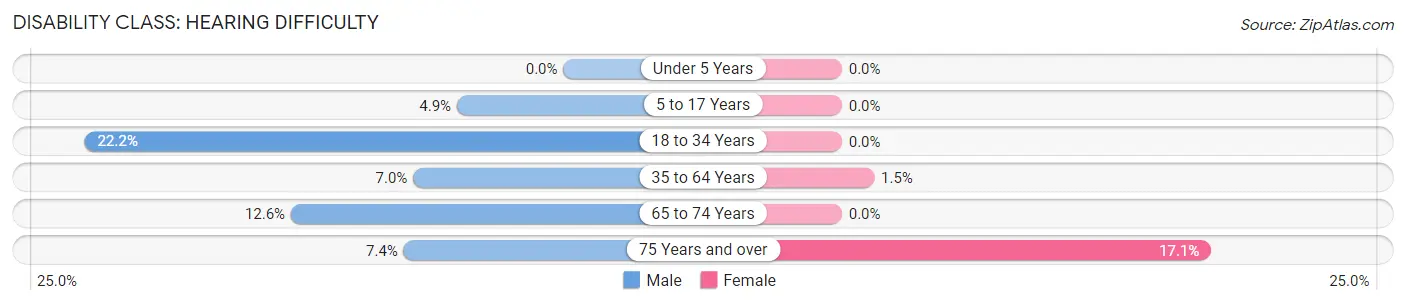
| Age Bracket | Male | Female |
| Under 5 Years | 0 (0.0%) | 0 (0.0%) |
| 5 to 17 Years | 8 (4.9%) | 0 (0.0%) |
| 18 to 34 Years | 10 (22.2%) | 0 (0.0%) |
| 35 to 64 Years | 20 (7.0%) | 4 (1.5%) |
| 65 to 74 Years | 11 (12.6%) | 0 (0.0%) |
| 75 Years and over | 4 (7.4%) | 18 (17.1%) |
Disability Class: Vision Difficulty
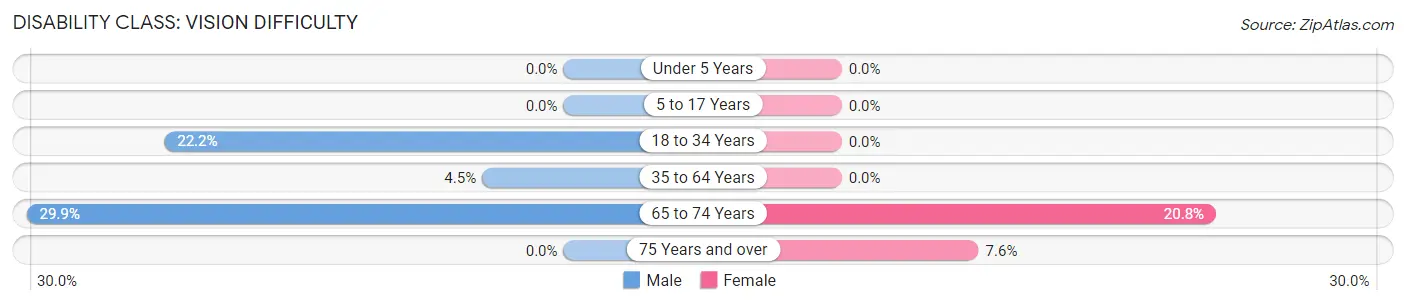
| Age Bracket | Male | Female |
| Under 5 Years | 0 (0.0%) | 0 (0.0%) |
| 5 to 17 Years | 0 (0.0%) | 0 (0.0%) |
| 18 to 34 Years | 10 (22.2%) | 0 (0.0%) |
| 35 to 64 Years | 13 (4.5%) | 0 (0.0%) |
| 65 to 74 Years | 26 (29.9%) | 10 (20.8%) |
| 75 Years and over | 0 (0.0%) | 8 (7.6%) |
Disability Class: Cognitive Difficulty
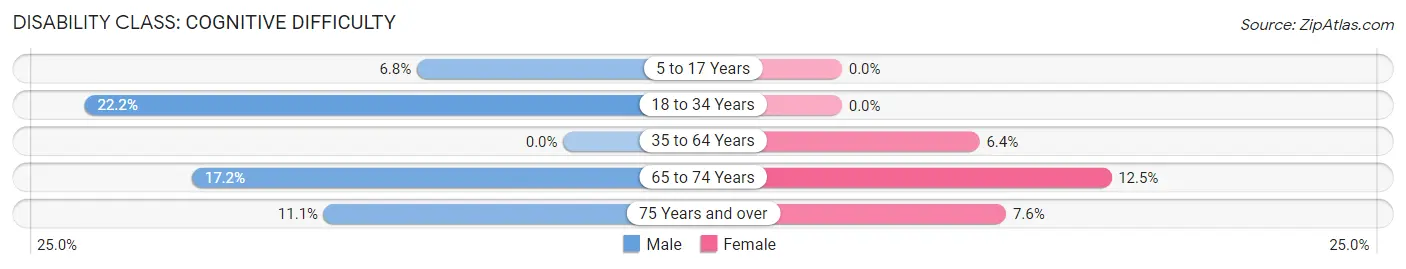
| Age Bracket | Male | Female |
| 5 to 17 Years | 11 (6.8%) | 0 (0.0%) |
| 18 to 34 Years | 10 (22.2%) | 0 (0.0%) |
| 35 to 64 Years | 0 (0.0%) | 17 (6.4%) |
| 65 to 74 Years | 15 (17.2%) | 6 (12.5%) |
| 75 Years and over | 6 (11.1%) | 8 (7.6%) |
Disability Class: Ambulatory Difficulty
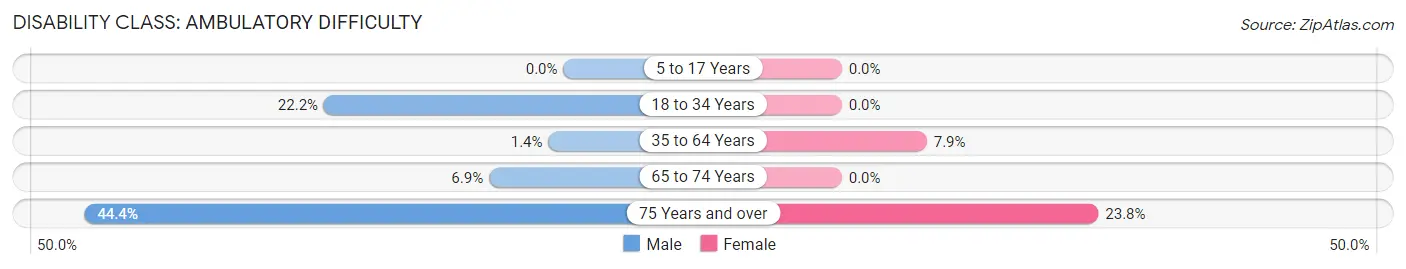
| Age Bracket | Male | Female |
| 5 to 17 Years | 0 (0.0%) | 0 (0.0%) |
| 18 to 34 Years | 10 (22.2%) | 0 (0.0%) |
| 35 to 64 Years | 4 (1.4%) | 21 (7.9%) |
| 65 to 74 Years | 6 (6.9%) | 0 (0.0%) |
| 75 Years and over | 24 (44.4%) | 25 (23.8%) |
Disability Class: Self-Care Difficulty
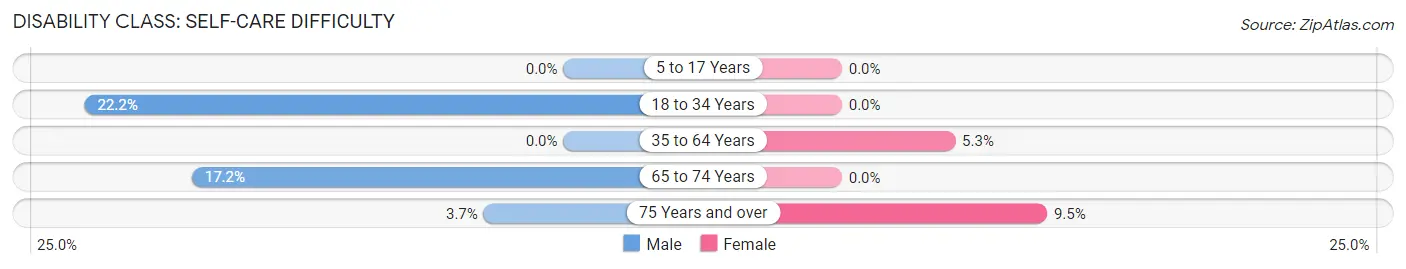
| Age Bracket | Male | Female |
| 5 to 17 Years | 0 (0.0%) | 0 (0.0%) |
| 18 to 34 Years | 10 (22.2%) | 0 (0.0%) |
| 35 to 64 Years | 0 (0.0%) | 14 (5.3%) |
| 65 to 74 Years | 15 (17.2%) | 0 (0.0%) |
| 75 Years and over | 2 (3.7%) | 10 (9.5%) |
Technology Access in Freeman
Computing Device Access in Freeman
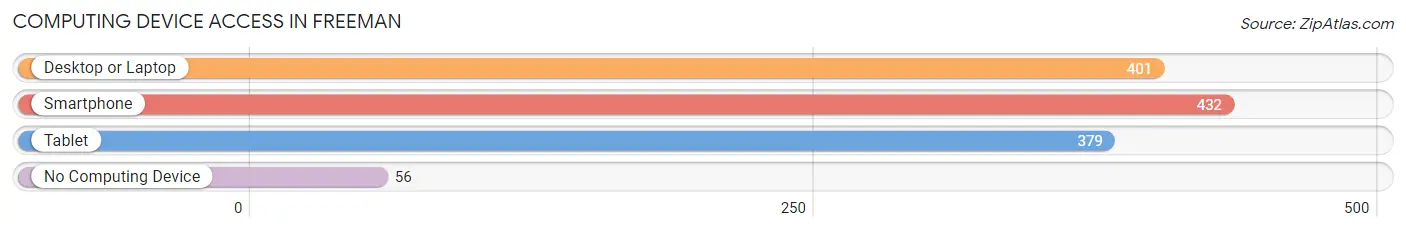
| Device Type | # Households | % Households |
| Desktop or Laptop | 401 | 70.7% |
| Smartphone | 432 | 76.2% |
| Tablet | 379 | 66.8% |
| No Computing Device | 56 | 9.9% |
| Total | 567 | 100.0% |
Internet Access in Freeman
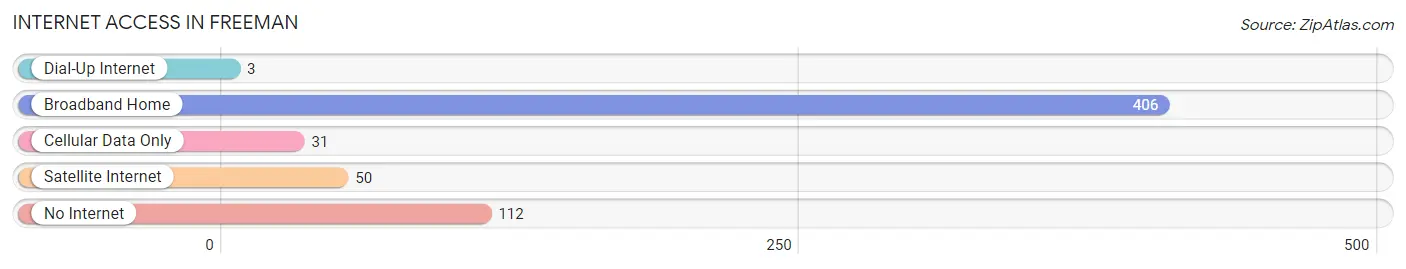
| Internet Type | # Households | % Households |
| Dial-Up Internet | 3 | 0.5% |
| Broadband Home | 406 | 71.6% |
| Cellular Data Only | 31 | 5.5% |
| Satellite Internet | 50 | 8.8% |
| No Internet | 112 | 19.8% |
| Total | 567 | 100.0% |
Freeman Summary
History
Freeman, South Dakota is a small town located in Hutchinson County, South Dakota. It was founded in 1883 by a group of German-Russian immigrants who had come to the area to homestead. The town was named after a local farmer, John Freeman, who had donated the land for the town.
The town grew slowly but steadily over the years, and by the early 1900s, it had become a thriving agricultural community. The town was home to a variety of businesses, including a bank, a hotel, a general store, a blacksmith shop, and a lumberyard.
In the 1920s, the town experienced a period of growth and prosperity. The population increased from around 500 to over 1,000, and the town was home to a variety of businesses, including a movie theater, a bowling alley, and a variety of stores.
The Great Depression hit the town hard, and many of the businesses closed. The population declined to around 500, and the town struggled to survive.
In the 1950s, the town began to experience a period of growth and prosperity once again. The population increased to over 1,000, and the town was home to a variety of businesses, including a grocery store, a hardware store, and a variety of other stores.
The town continued to grow and prosper throughout the 1960s and 1970s. The population increased to over 1,500, and the town was home to a variety of businesses, including a bank, a hospital, and a variety of other stores.
The town experienced a period of decline in the 1980s and 1990s, as many of the businesses closed and the population decreased to around 1,000. However, the town has experienced a resurgence in recent years, and the population has increased to over 1,500.
Geography
Freeman is located in Hutchinson County, South Dakota, approximately 30 miles south of Sioux Falls. The town is situated on the banks of the Big Sioux River, and is surrounded by rolling hills and farmland.
The town has a total area of 1.2 square miles, all of which is land. The town is located at an elevation of 1,637 feet above sea level.
Economy
The economy of Freeman is largely based on agriculture. The town is home to a variety of farms, including dairy farms, beef farms, and grain farms. The town is also home to a variety of businesses, including a bank, a grocery store, a hardware store, and a variety of other stores.
The town is also home to a variety of manufacturing businesses, including a furniture factory, a metal fabrication plant, and a plastics factory.
Demographics
As of the 2010 census, the population of Freeman was 1,541. The racial makeup of the town was 97.3% White, 0.3% African American, 0.2% Native American, 0.2% Asian, 0.1% Pacific Islander, 0.7% from other races, and 1.2% from two or more races. Hispanic or Latino of any race were 1.7% of the population.
The median household income in Freeman was $45,000, and the median family income was $50,000. The per capita income in Freeman was $20,000. About 8.3% of families and 10.2% of the population were below the poverty line, including 11.3% of those under age 18 and 8.2% of those age 65 or over.
Common Questions
What is the Total Population of Freeman?
Total Population of Freeman is 1,580.
What is the Total Male Population of Freeman?
Total Male Population of Freeman is 706.
What is the Total Female Population of Freeman?
Total Female Population of Freeman is 874.
What is the Ratio of Males per 100 Females in Freeman?
There are 80.78 Males per 100 Females in Freeman.
What is the Ratio of Females per 100 Males in Freeman?
There are 123.80 Females per 100 Males in Freeman.
What is the Median Population Age in Freeman?
Median Population Age in Freeman is 40.9 Years.
What is the Average Family Size in Freeman
Average Family Size in Freeman is 3.3 People.
What is the Average Household Size in Freeman
Average Household Size in Freeman is 2.7 People.
What is Per Capita Income in Freeman?
Per Capita income in Freeman is $29,829.
What is the Median Family Income in Freeman?
Median Family Income in Freeman is $93,333.
What is the Median Household income in Freeman?
Median Household Income in Freeman is $61,719.
What is Income or Wage Gap in Freeman?
Income or Wage Gap in Freeman is 37.9%.
Women in Freeman earn 62.1 cents for every dollar earned by a man.
What is Inequality or Gini Index in Freeman?
Inequality or Gini Index in Freeman is 0.40.
How Large is the Labor Force in Freeman?
There are 694 People in the Labor Forcein in Freeman.
What is the Percentage of People in the Labor Force in Freeman?
64.1% of People are in the Labor Force in Freeman.
What is the Unemployment Rate in Freeman?
Unemployment Rate in Freeman is 2.6%.