Yankton County, SD
Yankton County Map
Yankton County Overview
23,311
TOTAL POPULATION
12,132
MALE POPULATION
11,179
FEMALE POPULATION
108.52
MALES / 100 FEMALES
92.14
FEMALES / 100 MALES
41.7
MEDIAN AGE
2.8
AVG FAMILY SIZE
2.2
AVG HOUSEHOLD SIZE
$37,202
PER CAPITA INCOME
$90,804
AVG FAMILY INCOME
$68,847
AVG HOUSEHOLD INCOME
21.6%
WAGE / INCOME GAP [ % ]
78.4¢/ $1
WAGE / INCOME GAP [ $ ]
$14,054
FAMILY INCOME DEFICIT
0.43
INEQUALITY / GINI INDEX
12,093
LABOR FORCE [ PEOPLE ]
63.8%
PERCENT IN LABOR FORCE
1.6%
UNEMPLOYMENT RATE
Yankton County Area Codes
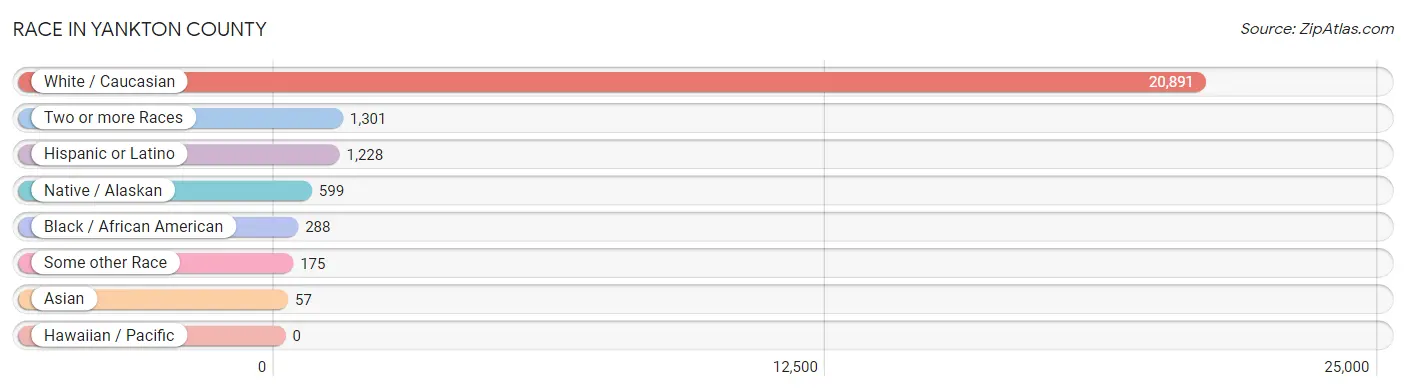
Race in Yankton County
The most populous races in Yankton County are White / Caucasian (20,891 | 89.6%), Two or more Races (1,301 | 5.6%), and Hispanic or Latino (1,228 | 5.3%).
| Race | # Population | % Population |
| Asian | 57 | 0.2% |
| Black / African American | 288 | 1.2% |
| Hawaiian / Pacific | 0 | 0.0% |
| Hispanic or Latino | 1,228 | 5.3% |
| Native / Alaskan | 599 | 2.6% |
| White / Caucasian | 20,891 | 89.6% |
| Two or more Races | 1,301 | 5.6% |
| Some other Race | 175 | 0.7% |
| Total | 23,311 | 100.0% |
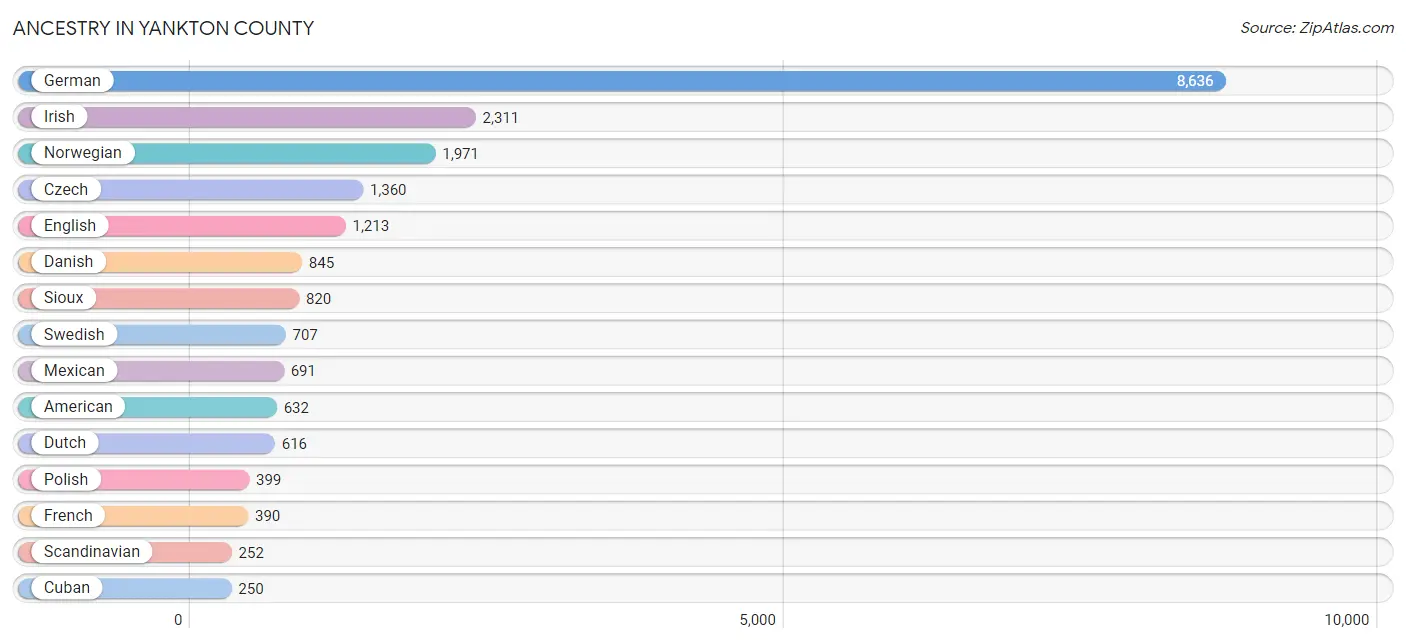
Ancestry in Yankton County
The most populous ancestries reported in Yankton County are German (8,636 | 37.0%), Irish (2,311 | 9.9%), Norwegian (1,971 | 8.5%), Czech (1,360 | 5.8%), and English (1,213 | 5.2%), together accounting for 66.5% of all Yankton County residents.
| Ancestry | # Population | % Population |
| American | 632 | 2.7% |
| Arab | 13 | 0.1% |
| Austrian | 22 | 0.1% |
| Belgian | 10 | 0.0% |
| Bhutanese | 32 | 0.1% |
| Blackfeet | 1 | 0.0% |
| British | 52 | 0.2% |
| Burmese | 9 | 0.0% |
| Canadian | 10 | 0.0% |
| Central American | 16 | 0.1% |
| Cheyenne | 53 | 0.2% |
| Chilean | 62 | 0.3% |
| Chippewa | 7 | 0.0% |
| Choctaw | 16 | 0.1% |
| Cuban | 250 | 1.1% |
| Czech | 1,360 | 5.8% |
| Czechoslovakian | 77 | 0.3% |
| Danish | 845 | 3.6% |
| Dutch | 616 | 2.6% |
| Eastern European | 2 | 0.0% |
| English | 1,213 | 5.2% |
| European | 124 | 0.5% |
| Finnish | 50 | 0.2% |
| French | 390 | 1.7% |
| French Canadian | 39 | 0.2% |
| German | 8,636 | 37.0% |
| Greek | 16 | 0.1% |
| Haitian | 98 | 0.4% |
| Honduran | 14 | 0.1% |
| Hungarian | 19 | 0.1% |
| Indian (Asian) | 60 | 0.3% |
| Irish | 2,311 | 9.9% |
| Italian | 154 | 0.7% |
| Jamaican | 2 | 0.0% |
| Korean | 12 | 0.1% |
| Luxembourger | 8 | 0.0% |
| Malaysian | 7 | 0.0% |
| Mexican | 691 | 3.0% |
| Northern European | 6 | 0.0% |
| Norwegian | 1,971 | 8.5% |
| Pennsylvania German | 3 | 0.0% |
| Polish | 399 | 1.7% |
| Puerto Rican | 91 | 0.4% |
| Russian | 111 | 0.5% |
| Salvadoran | 2 | 0.0% |
| Scandinavian | 252 | 1.1% |
| Scotch-Irish | 70 | 0.3% |
| Scottish | 138 | 0.6% |
| Sioux | 820 | 3.5% |
| Slovak | 37 | 0.2% |
| South American | 62 | 0.3% |
| Spanish | 50 | 0.2% |
| Sri Lankan | 4 | 0.0% |
| Swedish | 707 | 3.0% |
| Swiss | 129 | 0.5% |
| Syrian | 13 | 0.1% |
| U.S. Virgin Islander | 2 | 0.0% |
| Ukrainian | 52 | 0.2% |
| Welsh | 67 | 0.3% | View All 59 Rows |
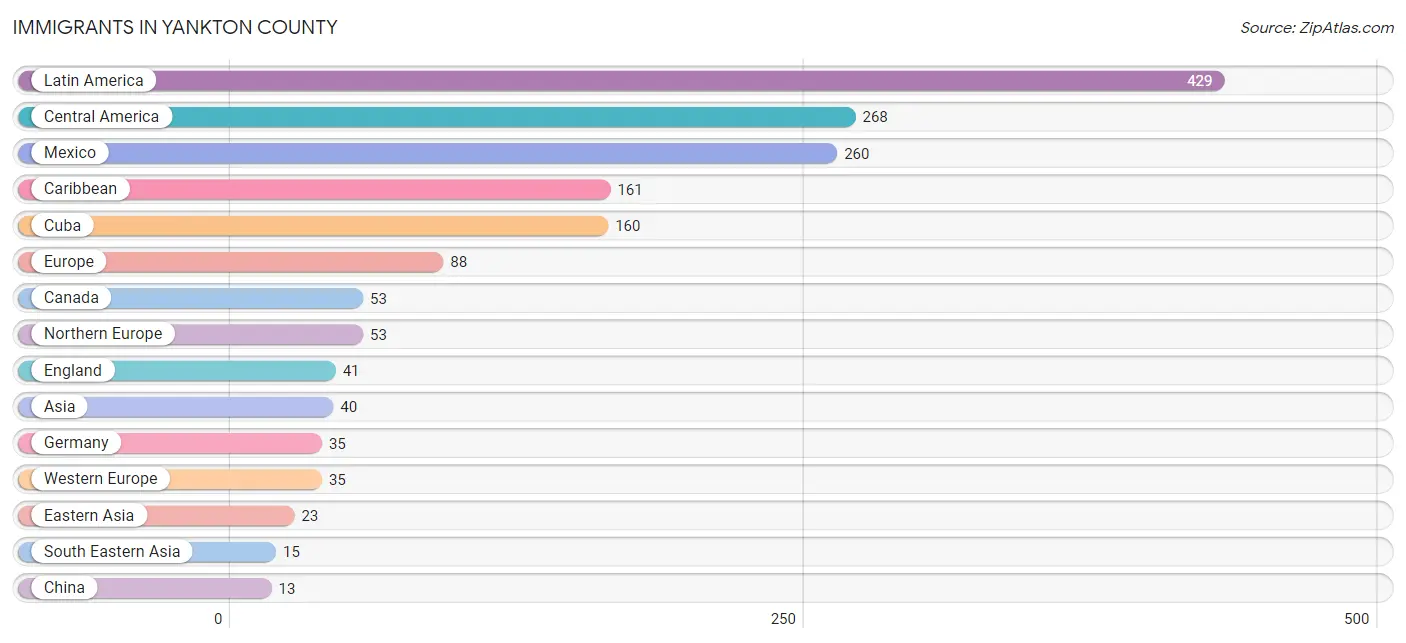
Immigrants in Yankton County
The most numerous immigrant groups reported in Yankton County came from Latin America (429 | 1.8%), Central America (268 | 1.1%), Mexico (260 | 1.1%), Caribbean (161 | 0.7%), and Cuba (160 | 0.7%), together accounting for 5.5% of all Yankton County residents.
| Immigration Origin | # Population | % Population |
| Asia | 40 | 0.2% |
| Canada | 53 | 0.2% |
| Caribbean | 161 | 0.7% |
| Central America | 268 | 1.1% |
| China | 13 | 0.1% |
| Cuba | 160 | 0.7% |
| Denmark | 6 | 0.0% |
| Eastern Asia | 23 | 0.1% |
| England | 41 | 0.2% |
| Europe | 88 | 0.4% |
| Germany | 35 | 0.2% |
| Honduras | 6 | 0.0% |
| Jamaica | 1 | 0.0% |
| Korea | 10 | 0.0% |
| Laos | 7 | 0.0% |
| Latin America | 429 | 1.8% |
| Mexico | 260 | 1.1% |
| Nicaragua | 1 | 0.0% |
| Northern Europe | 53 | 0.2% |
| Panama | 1 | 0.0% |
| Philippines | 2 | 0.0% |
| South Eastern Asia | 15 | 0.1% |
| Sweden | 6 | 0.0% |
| Vietnam | 6 | 0.0% |
| Western Asia | 2 | 0.0% |
| Western Europe | 35 | 0.2% | View All 26 Rows |
Sex and Age in Yankton County
Sex and Age in Yankton County
The most populous age groups in Yankton County are 20 to 24 Years (922 | 7.6%) for men and 10 to 14 Years (901 | 8.1%) for women.
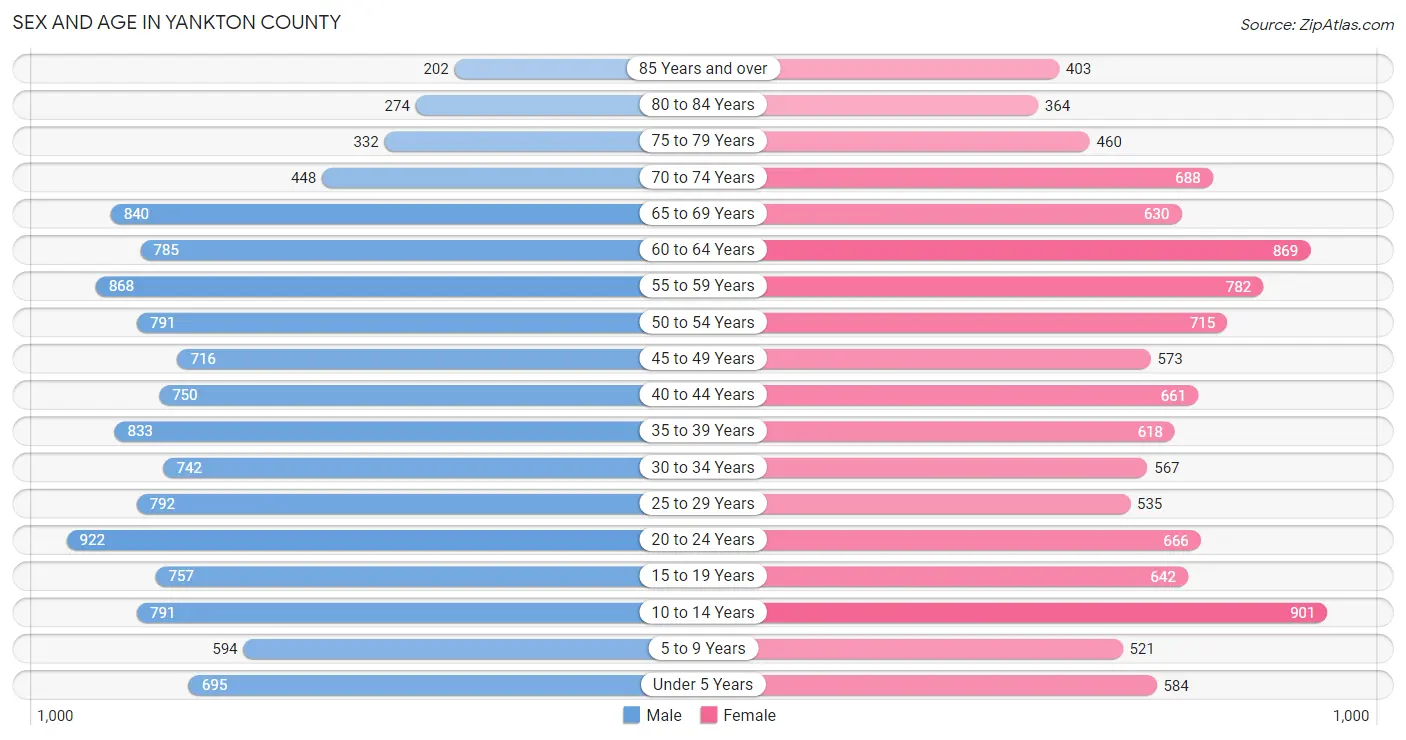
| Age Bracket | Male | Female |
| Under 5 Years | 695 (5.7%) | 584 (5.2%) |
| 5 to 9 Years | 594 (4.9%) | 521 (4.7%) |
| 10 to 14 Years | 791 (6.5%) | 901 (8.1%) |
| 15 to 19 Years | 757 (6.2%) | 642 (5.7%) |
| 20 to 24 Years | 922 (7.6%) | 666 (6.0%) |
| 25 to 29 Years | 792 (6.5%) | 535 (4.8%) |
| 30 to 34 Years | 742 (6.1%) | 567 (5.1%) |
| 35 to 39 Years | 833 (6.9%) | 618 (5.5%) |
| 40 to 44 Years | 750 (6.2%) | 661 (5.9%) |
| 45 to 49 Years | 716 (5.9%) | 573 (5.1%) |
| 50 to 54 Years | 791 (6.5%) | 715 (6.4%) |
| 55 to 59 Years | 868 (7.1%) | 782 (7.0%) |
| 60 to 64 Years | 785 (6.5%) | 869 (7.8%) |
| 65 to 69 Years | 840 (6.9%) | 630 (5.6%) |
| 70 to 74 Years | 448 (3.7%) | 688 (6.1%) |
| 75 to 79 Years | 332 (2.7%) | 460 (4.1%) |
| 80 to 84 Years | 274 (2.3%) | 364 (3.3%) |
| 85 Years and over | 202 (1.7%) | 403 (3.6%) |
| Total | 12,132 (100.0%) | 11,179 (100.0%) |
Families and Households in Yankton County
Median Family Size in Yankton County
The median family size in Yankton County is 2.80 persons per family, with single female/mother families (686 | 11.9%) accounting for the largest median family size of 2.85 persons per family. On the other hand, single male/father families (399 | 6.9%) represent the smallest median family size with 2.19 persons per family.
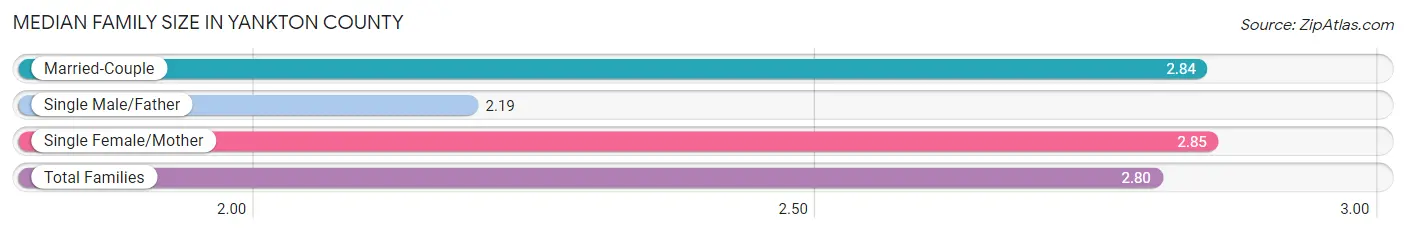
| Family Type | # Families | Family Size |
| Married-Couple | 4,664 (81.1%) | 2.84 |
| Single Male/Father | 399 (6.9%) | 2.19 |
| Single Female/Mother | 686 (11.9%) | 2.85 |
| Total Families | 5,749 (100.0%) | 2.80 |
Median Household Size in Yankton County
The median household size in Yankton County is 2.19 persons per household, with single female/mother households (686 | 7.0%) accounting for the largest median household size of 3.22 persons per household. non-family households (4,040 | 41.3%) represent the smallest median household size with 1.16 persons per household.
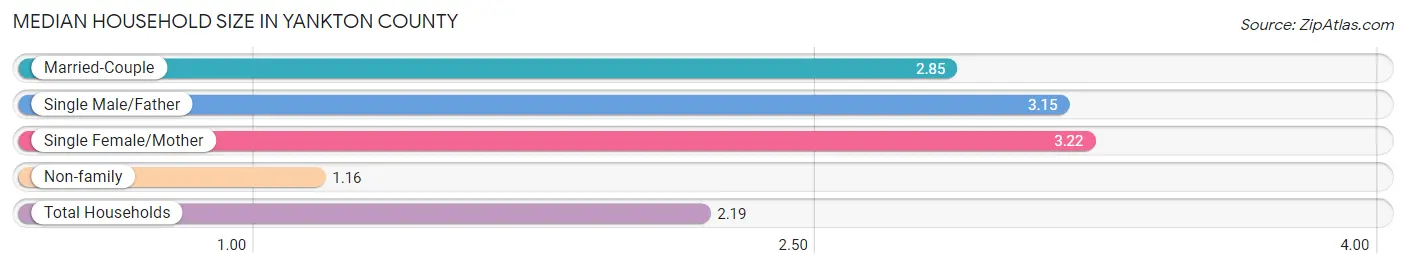
| Household Type | # Households | Household Size |
| Married-Couple | 4,664 (47.6%) | 2.85 |
| Single Male/Father | 399 (4.1%) | 3.15 |
| Single Female/Mother | 686 (7.0%) | 3.22 |
| Non-family | 4,040 (41.3%) | 1.16 |
| Total Households | 9,789 (100.0%) | 2.19 |
Household Size by Marriage Status in Yankton County
Out of a total of 9,789 households in Yankton County, 5,749 (58.7%) are family households, while 4,040 (41.3%) are nonfamily households. The most numerous type of family households are 2-person households, comprising 2,837, and the most common type of nonfamily households are 1-person households, comprising 3,354.
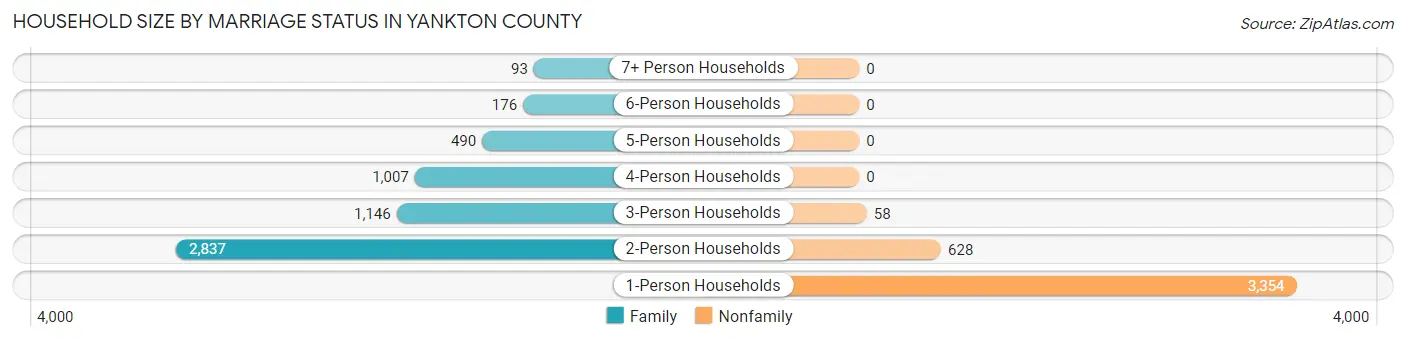
| Household Size | Family Households | Nonfamily Households |
| 1-Person Households | - | 3,354 (34.3%) |
| 2-Person Households | 2,837 (29.0%) | 628 (6.4%) |
| 3-Person Households | 1,146 (11.7%) | 58 (0.6%) |
| 4-Person Households | 1,007 (10.3%) | 0 (0.0%) |
| 5-Person Households | 490 (5.0%) | 0 (0.0%) |
| 6-Person Households | 176 (1.8%) | 0 (0.0%) |
| 7+ Person Households | 93 (0.9%) | 0 (0.0%) |
| Total | 5,749 (58.7%) | 4,040 (41.3%) |
Female Fertility in Yankton County
Fertility by Age in Yankton County
Average fertility rate in Yankton County is 105.0 births per 1,000 women. Women in the age bracket of 20 to 34 years have the highest fertility rate with 184.0 births per 1,000 women. Women in the age bracket of 20 to 34 years acount for 69.5% of all women with births.
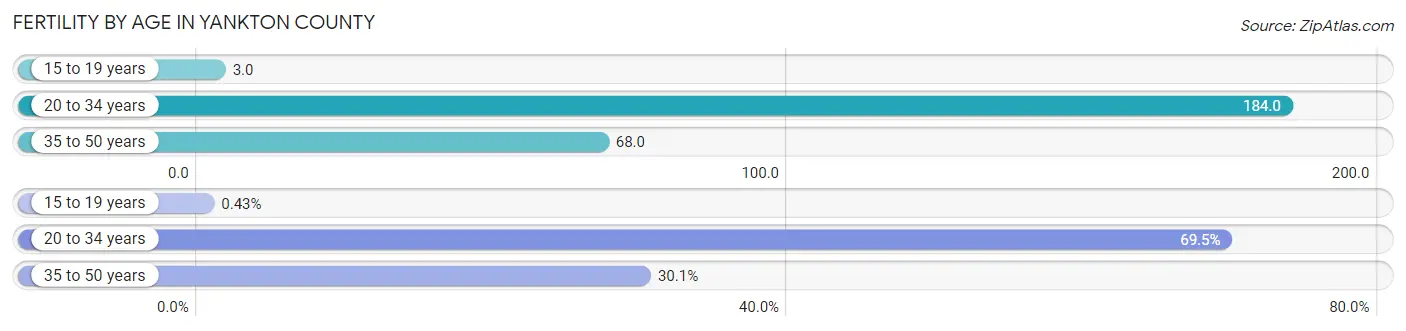
| Age Bracket | Women with Births | Births / 1,000 Women |
| 15 to 19 years | 2 (0.4%) | 3.0 |
| 20 to 34 years | 326 (69.5%) | 184.0 |
| 35 to 50 years | 141 (30.1%) | 68.0 |
| Total | 469 (100.0%) | 105.0 |
Fertility by Age by Marriage Status in Yankton County
72.7% of women with births (469) in Yankton County are married. The highest percentage of unmarried women with births falls into 20 to 34 years age bracket with 37.1% of them unmarried at the time of birth, while the lowest percentage of unmarried women with births belong to 15 to 19 years age bracket with 0.0% of them unmarried.
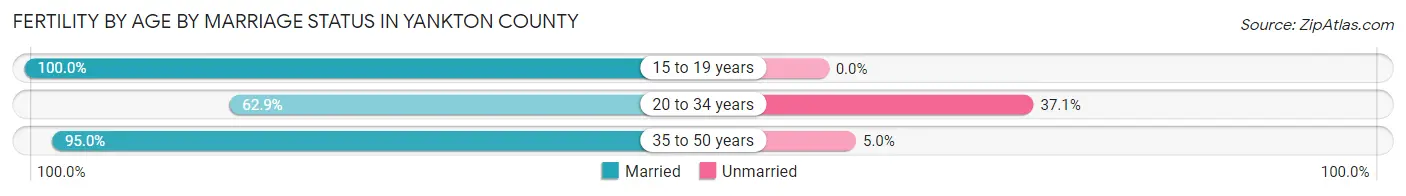
| Age Bracket | Married | Unmarried |
| 15 to 19 years | 2 (100.0%) | 0 (0.0%) |
| 20 to 34 years | 205 (62.9%) | 121 (37.1%) |
| 35 to 50 years | 134 (95.0%) | 7 (5.0%) |
| Total | 341 (72.7%) | 128 (27.3%) |
Fertility by Education in Yankton County
Average fertility rate in Yankton County is 105.0 births per 1,000 women. Women with the education attainment of graduate degree have the highest fertility rate of 281.0 births per 1,000 women, while women with the education attainment of college or associate's degree have the lowest fertility at 40.0 births per 1,000 women. Women with the education attainment of bachelor's degree represent 31.3% of all women with births.
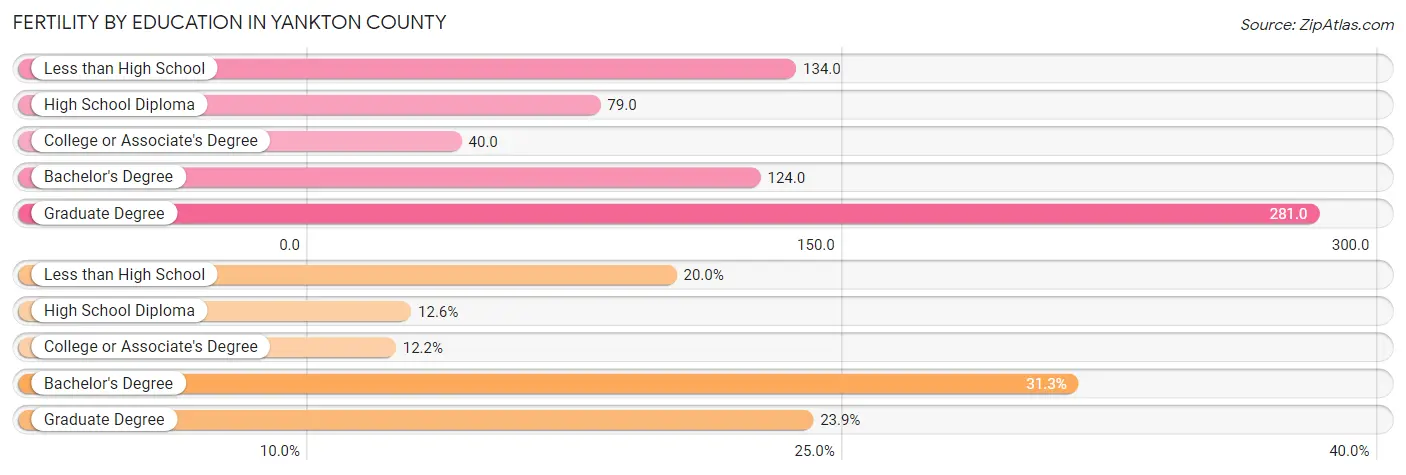
| Educational Attainment | Women with Births | Births / 1,000 Women |
| Less than High School | 94 (20.0%) | 134.0 |
| High School Diploma | 59 (12.6%) | 79.0 |
| College or Associate's Degree | 57 (12.1%) | 40.0 |
| Bachelor's Degree | 147 (31.3%) | 124.0 |
| Graduate Degree | 112 (23.9%) | 281.0 |
| Total | 469 (100.0%) | 105.0 |
Fertility by Education by Marriage Status in Yankton County
27.3% of women with births in Yankton County are unmarried. Women with the educational attainment of bachelor's degree are most likely to be married with 99.3% of them married at childbirth, while women with the educational attainment of college or associate's degree are least likely to be married with 100.0% of them unmarried at childbirth.
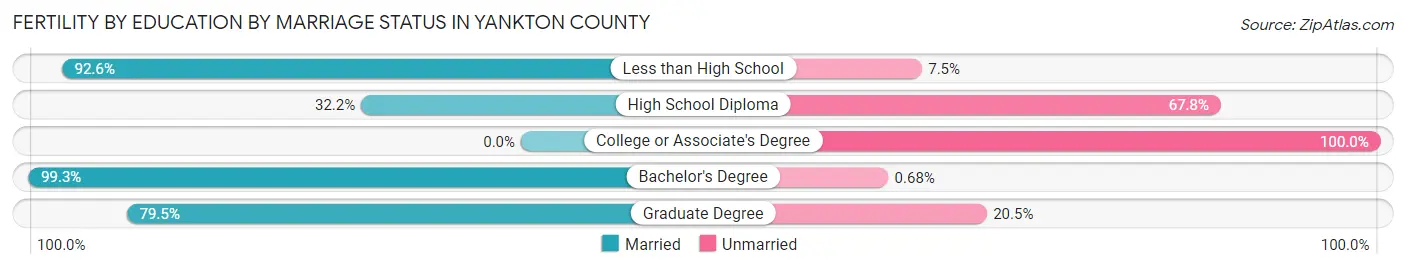
| Educational Attainment | Married | Unmarried |
| Less than High School | 87 (92.5%) | 7 (7.4%) |
| High School Diploma | 19 (32.2%) | 40 (67.8%) |
| College or Associate's Degree | 0 (0.0%) | 57 (100.0%) |
| Bachelor's Degree | 146 (99.3%) | 1 (0.7%) |
| Graduate Degree | 89 (79.5%) | 23 (20.5%) |
| Total | 341 (72.7%) | 128 (27.3%) |
Income in Yankton County
Income Overview in Yankton County
Per Capita Income in Yankton County is $37,202, while median incomes of families and households are $90,804 and $68,847 respectively.
| Characteristic | Number | Measure |
| Per Capita Income | 23,311 | $37,202 |
| Median Family Income | 5,749 | $90,804 |
| Mean Family Income | 5,749 | $112,620 |
| Median Household Income | 9,789 | $68,847 |
| Mean Household Income | 9,789 | $88,162 |
| Income Deficit | 5,749 | $14,054 |
| Wage / Income Gap (%) | 23,311 | 21.58% |
| Wage / Income Gap ($) | 23,311 | 78.42¢ per $1 |
| Gini / Inequality Index | 23,311 | 0.43 |
Earnings by Sex in Yankton County
Average Earnings in Yankton County are $41,085, $45,646 for men and $35,797 for women, a difference of 21.6%.
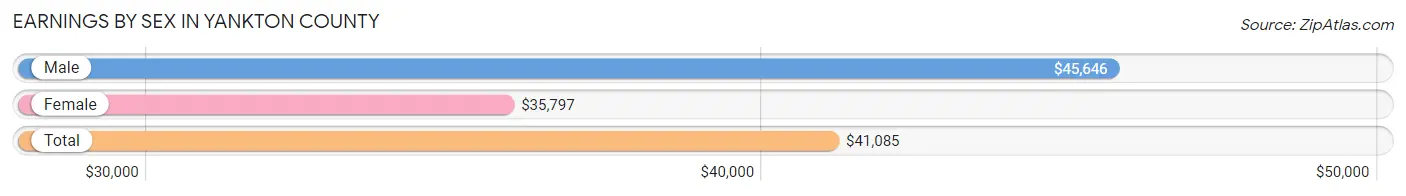
| Sex | Number | Average Earnings |
| Male | 7,602 (56.2%) | $45,646 |
| Female | 5,926 (43.8%) | $35,797 |
| Total | 13,528 (100.0%) | $41,085 |
Earnings by Sex by Income Bracket in Yankton County
The most common earnings brackets in Yankton County are $55,000 to $64,999 for men (931 | 12.2%) and $40,000 to $44,999 for women (618 | 10.4%).
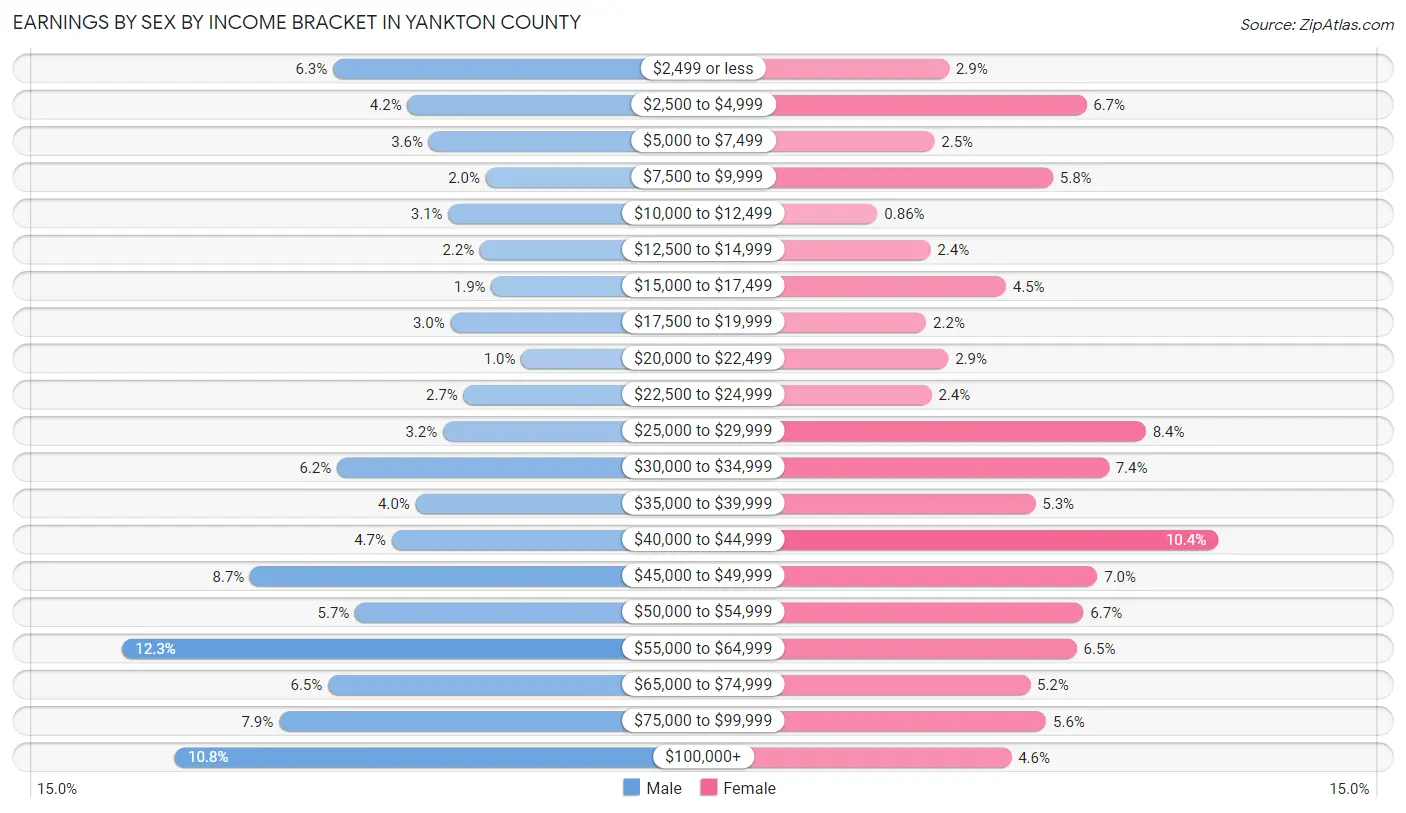
| Income | Male | Female |
| $2,499 or less | 481 (6.3%) | 170 (2.9%) |
| $2,500 to $4,999 | 322 (4.2%) | 399 (6.7%) |
| $5,000 to $7,499 | 277 (3.6%) | 146 (2.5%) |
| $7,500 to $9,999 | 155 (2.0%) | 343 (5.8%) |
| $10,000 to $12,499 | 235 (3.1%) | 51 (0.9%) |
| $12,500 to $14,999 | 167 (2.2%) | 139 (2.4%) |
| $15,000 to $17,499 | 143 (1.9%) | 265 (4.5%) |
| $17,500 to $19,999 | 230 (3.0%) | 132 (2.2%) |
| $20,000 to $22,499 | 79 (1.0%) | 169 (2.9%) |
| $22,500 to $24,999 | 202 (2.7%) | 141 (2.4%) |
| $25,000 to $29,999 | 246 (3.2%) | 498 (8.4%) |
| $30,000 to $34,999 | 473 (6.2%) | 436 (7.4%) |
| $35,000 to $39,999 | 305 (4.0%) | 314 (5.3%) |
| $40,000 to $44,999 | 356 (4.7%) | 618 (10.4%) |
| $45,000 to $49,999 | 658 (8.7%) | 417 (7.0%) |
| $50,000 to $54,999 | 434 (5.7%) | 394 (6.7%) |
| $55,000 to $64,999 | 931 (12.2%) | 383 (6.5%) |
| $65,000 to $74,999 | 492 (6.5%) | 305 (5.1%) |
| $75,000 to $99,999 | 597 (7.9%) | 332 (5.6%) |
| $100,000+ | 819 (10.8%) | 274 (4.6%) |
| Total | 7,602 (100.0%) | 5,926 (100.0%) |
Earnings by Sex by Educational Attainment in Yankton County
Average earnings in Yankton County are $48,937 for men and $40,926 for women, a difference of 16.4%. Men with an educational attainment of graduate degree enjoy the highest average annual earnings of $78,471, while those with high school diploma education earn the least with $38,427. Women with an educational attainment of graduate degree earn the most with the average annual earnings of $57,393, while those with less than high school education have the smallest earnings of $29,286.
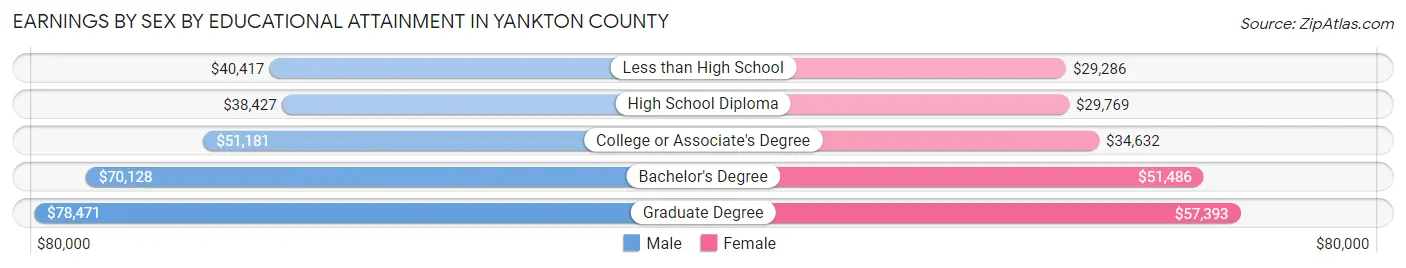
| Educational Attainment | Male Income | Female Income |
| Less than High School | $40,417 | $29,286 |
| High School Diploma | $38,427 | $29,769 |
| College or Associate's Degree | $51,181 | $34,632 |
| Bachelor's Degree | $70,128 | $51,486 |
| Graduate Degree | $78,471 | $57,393 |
| Total | $48,937 | $40,926 |
Family Income in Yankton County
Family Income Brackets in Yankton County
According to the Yankton County family income data, there are 1,305 families falling into the $75,000 to $99,999 income range, which is the most common income bracket and makes up 22.7% of all families. Conversely, the $10,000 to $14,999 income bracket is the least frequent group with only 11 families (0.2%) belonging to this category.
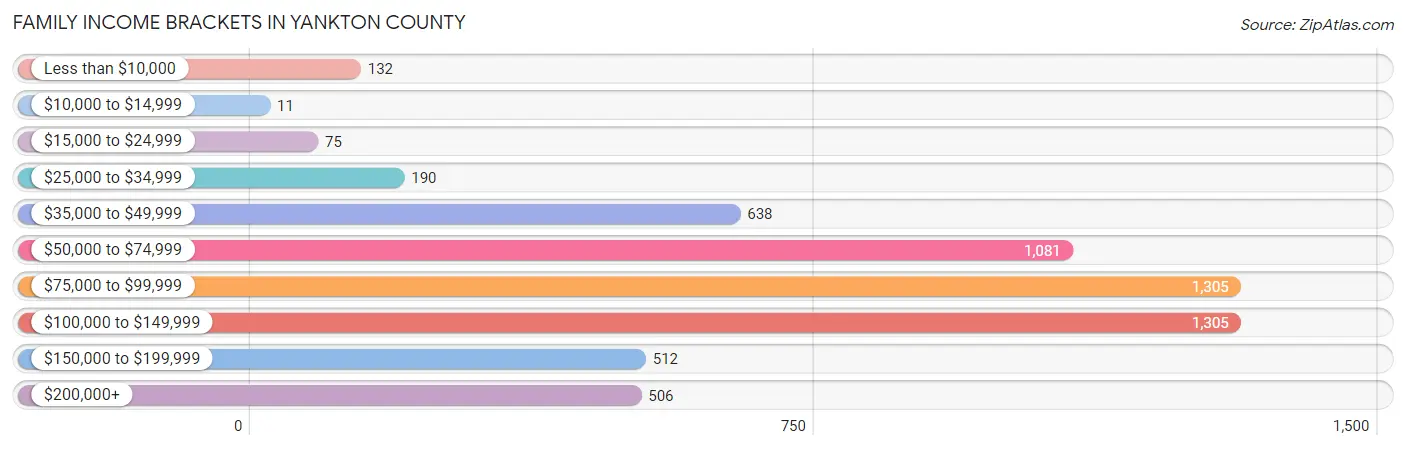
| Income Bracket | # Families | % Families |
| Less than $10,000 | 132 | 2.3% |
| $10,000 to $14,999 | 11 | 0.2% |
| $15,000 to $24,999 | 75 | 1.3% |
| $25,000 to $34,999 | 190 | 3.3% |
| $35,000 to $49,999 | 638 | 11.1% |
| $50,000 to $74,999 | 1,081 | 18.8% |
| $75,000 to $99,999 | 1,305 | 22.7% |
| $100,000 to $149,999 | 1,305 | 22.7% |
| $150,000 to $199,999 | 512 | 8.9% |
| $200,000+ | 506 | 8.8% |
Family Income by Famaliy Size in Yankton County
5-person families (273 | 4.8%) account for the highest median family income in Yankton County with $140,329 per family, while 2-person families (3,081 | 53.6%) have the highest median income of $42,376 per family member.
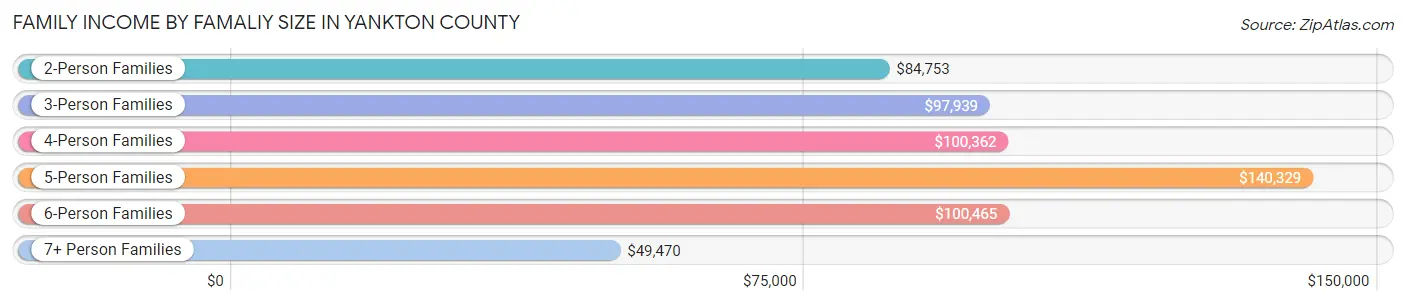
| Income Bracket | # Families | Median Income |
| 2-Person Families | 3,081 (53.6%) | $84,753 |
| 3-Person Families | 1,098 (19.1%) | $97,939 |
| 4-Person Families | 1,030 (17.9%) | $100,362 |
| 5-Person Families | 273 (4.8%) | $140,329 |
| 6-Person Families | 174 (3.0%) | $100,465 |
| 7+ Person Families | 93 (1.6%) | $49,470 |
| Total | 5,749 (100.0%) | $90,804 |
Family Income by Number of Earners in Yankton County
The median family income in Yankton County is $90,804, with families comprising 3+ earners (633) having the highest median family income of $179,375, while families with no earners (734) have the lowest median family income of $58,056, accounting for 11.0% and 12.8% of families, respectively.
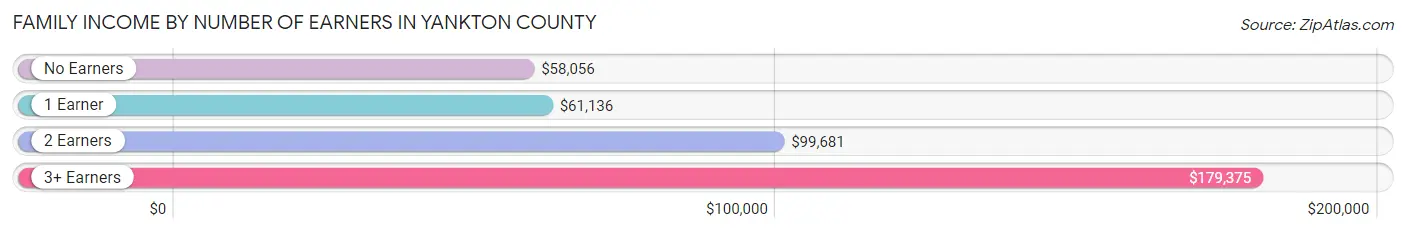
| Number of Earners | # Families | Median Income |
| No Earners | 734 (12.8%) | $58,056 |
| 1 Earner | 1,636 (28.5%) | $61,136 |
| 2 Earners | 2,746 (47.8%) | $99,681 |
| 3+ Earners | 633 (11.0%) | $179,375 |
| Total | 5,749 (100.0%) | $90,804 |
Household Income in Yankton County
Household Income Brackets in Yankton County
With 1,791 households falling in the category, the $75,000 to $99,999 income range is the most frequent in Yankton County, accounting for 18.3% of all households. In contrast, only 323 households (3.3%) fall into the $10,000 to $14,999 income bracket, making it the least populous group.
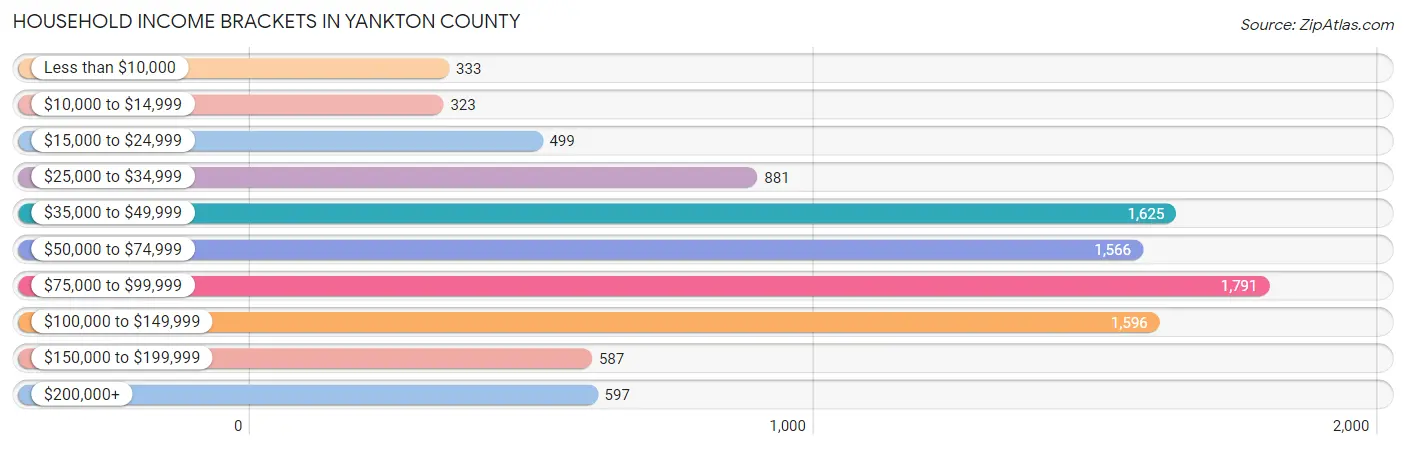
| Income Bracket | # Households | % Households |
| Less than $10,000 | 333 | 3.4% |
| $10,000 to $14,999 | 323 | 3.3% |
| $15,000 to $24,999 | 499 | 5.1% |
| $25,000 to $34,999 | 881 | 9.0% |
| $35,000 to $49,999 | 1,625 | 16.6% |
| $50,000 to $74,999 | 1,566 | 16.0% |
| $75,000 to $99,999 | 1,791 | 18.3% |
| $100,000 to $149,999 | 1,596 | 16.3% |
| $150,000 to $199,999 | 587 | 6.0% |
| $200,000+ | 597 | 6.1% |
Household Income by Householder Age in Yankton County
The median household income in Yankton County is $68,847, with the highest median household income of $91,610 found in the 45 to 64 years age bracket for the primary householder. A total of 3,364 households (34.4%) fall into this category. Meanwhile, the 15 to 24 years age bracket for the primary householder has the lowest median household income of $42,065, with 834 households (8.5%) in this group.
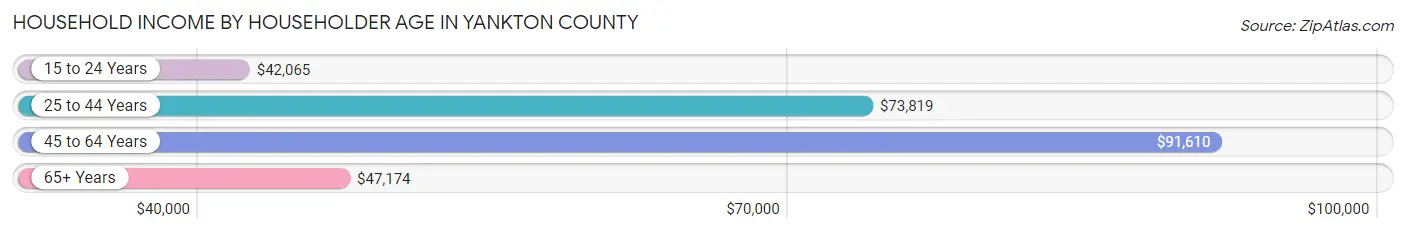
| Income Bracket | # Households | Median Income |
| 15 to 24 Years | 834 (8.5%) | $42,065 |
| 25 to 44 Years | 2,774 (28.3%) | $73,819 |
| 45 to 64 Years | 3,364 (34.4%) | $91,610 |
| 65+ Years | 2,817 (28.8%) | $47,174 |
| Total | 9,789 (100.0%) | $68,847 |
Poverty in Yankton County
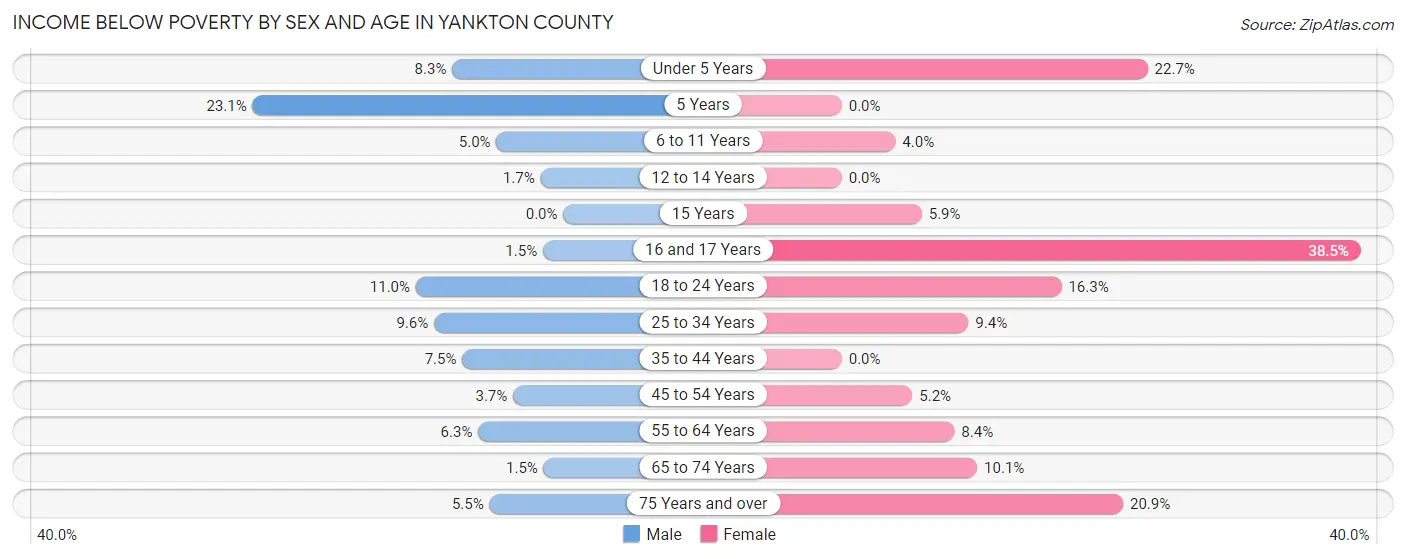
Income Below Poverty by Sex and Age in Yankton County
With 6.1% poverty level for males and 9.9% for females among the residents of Yankton County, 5 year old males and 16 and 17 year old females are the most vulnerable to poverty, with 15 males (23.1%) and 104 females (38.5%) in their respective age groups living below the poverty level.
| Age Bracket | Male | Female |
| Under 5 Years | 57 (8.3%) | 124 (22.7%) |
| 5 Years | 15 (23.1%) | 0 (0.0%) |
| 6 to 11 Years | 42 (5.0%) | 30 (4.0%) |
| 12 to 14 Years | 7 (1.7%) | 0 (0.0%) |
| 15 Years | 0 (0.0%) | 6 (5.9%) |
| 16 and 17 Years | 5 (1.5%) | 104 (38.5%) |
| 18 to 24 Years | 110 (11.0%) | 146 (16.3%) |
| 25 to 34 Years | 128 (9.6%) | 103 (9.4%) |
| 35 to 44 Years | 95 (7.5%) | 0 (0.0%) |
| 45 to 54 Years | 49 (3.7%) | 66 (5.2%) |
| 55 to 64 Years | 97 (6.3%) | 136 (8.4%) |
| 65 to 74 Years | 18 (1.5%) | 130 (10.1%) |
| 75 Years and over | 40 (5.5%) | 222 (20.9%) |
| Total | 663 (6.1%) | 1,067 (9.9%) |
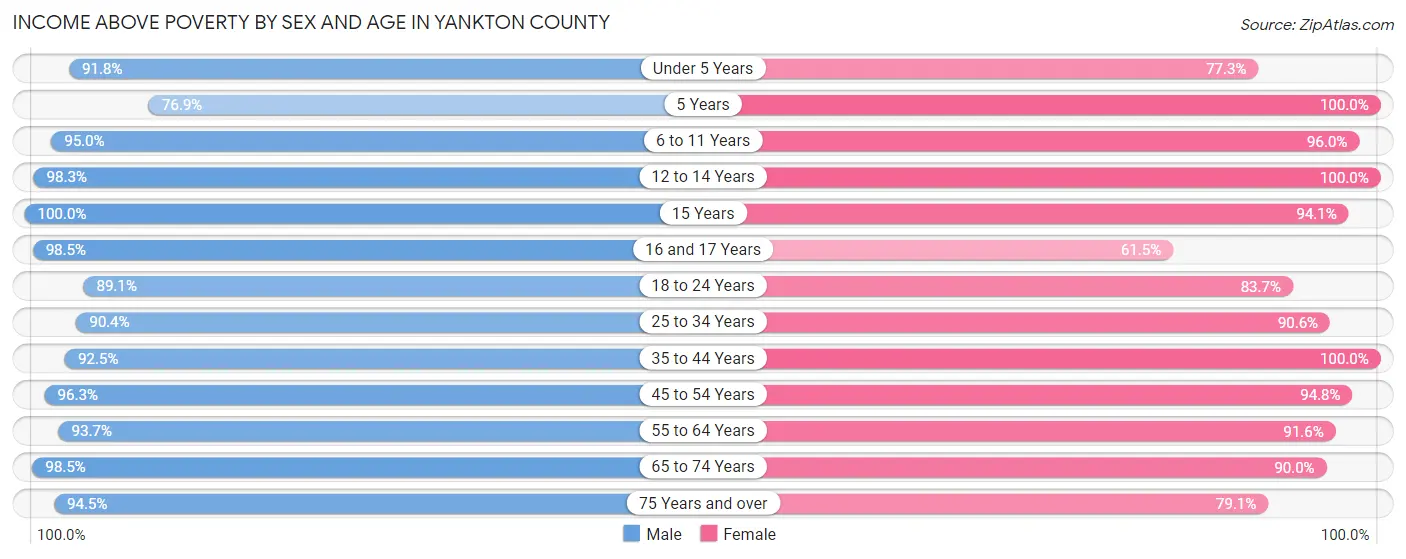
Income Above Poverty by Sex and Age in Yankton County
According to the poverty statistics in Yankton County, males aged 15 years and females aged 5 years are the age groups that are most secure financially, with 100.0% of males and 100.0% of females in these age groups living above the poverty line.
| Age Bracket | Male | Female |
| Under 5 Years | 634 (91.7%) | 422 (77.3%) |
| 5 Years | 50 (76.9%) | 129 (100.0%) |
| 6 to 11 Years | 803 (95.0%) | 723 (96.0%) |
| 12 to 14 Years | 407 (98.3%) | 454 (100.0%) |
| 15 Years | 163 (100.0%) | 95 (94.1%) |
| 16 and 17 Years | 327 (98.5%) | 166 (61.5%) |
| 18 to 24 Years | 895 (89.0%) | 749 (83.7%) |
| 25 to 34 Years | 1,206 (90.4%) | 993 (90.6%) |
| 35 to 44 Years | 1,172 (92.5%) | 1,251 (100.0%) |
| 45 to 54 Years | 1,263 (96.3%) | 1,194 (94.8%) |
| 55 to 64 Years | 1,438 (93.7%) | 1,491 (91.6%) |
| 65 to 74 Years | 1,218 (98.5%) | 1,164 (89.9%) |
| 75 Years and over | 690 (94.5%) | 841 (79.1%) |
| Total | 10,266 (93.9%) | 9,672 (90.1%) |
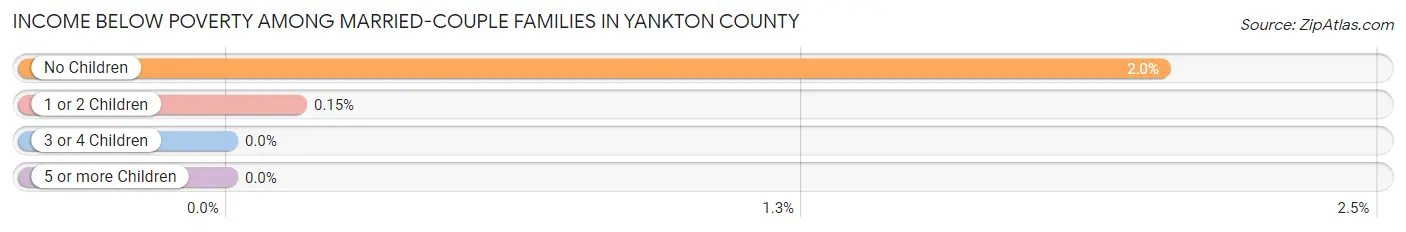
Income Below Poverty Among Married-Couple Families in Yankton County
The poverty statistics for married-couple families in Yankton County show that 1.3% or 61 of the total 4,664 families live below the poverty line. Families with no children have the highest poverty rate of 2.0%, comprising of 59 families. On the other hand, families with 3 or 4 children have the lowest poverty rate of 0.0%, which includes 0 families.
| Children | Above Poverty | Below Poverty |
| No Children | 2,842 (98.0%) | 59 (2.0%) |
| 1 or 2 Children | 1,302 (99.9%) | 2 (0.2%) |
| 3 or 4 Children | 429 (100.0%) | 0 (0.0%) |
| 5 or more Children | 30 (100.0%) | 0 (0.0%) |
| Total | 4,603 (98.7%) | 61 (1.3%) |
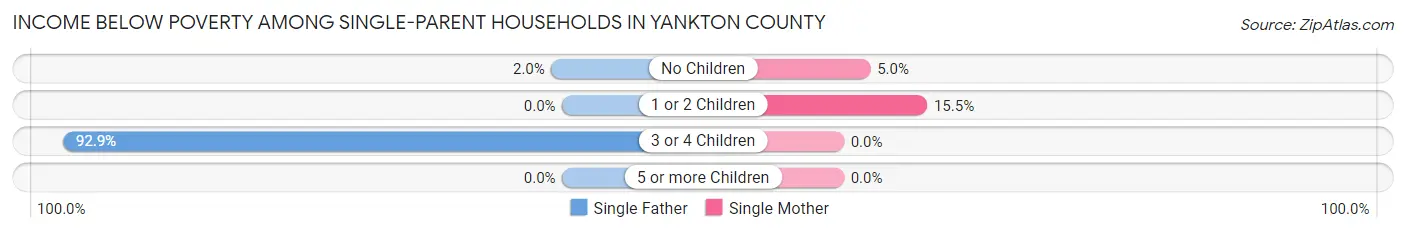
Income Below Poverty Among Single-Parent Households in Yankton County
According to the poverty data in Yankton County, 16.8% or 67 single-father households and 10.5% or 72 single-mother households are living below the poverty line. Among single-father households, those with 3 or 4 children have the highest poverty rate, with 65 households (92.9%) experiencing poverty. Likewise, among single-mother households, those with 1 or 2 children have the highest poverty rate, with 61 households (15.5%) falling below the poverty line.
| Children | Single Father | Single Mother |
| No Children | 2 (2.0%) | 11 (5.0%) |
| 1 or 2 Children | 0 (0.0%) | 61 (15.5%) |
| 3 or 4 Children | 65 (92.9%) | 0 (0.0%) |
| 5 or more Children | 0 (0.0%) | 0 (0.0%) |
| Total | 67 (16.8%) | 72 (10.5%) |
Income Below Poverty Among Married-Couple vs Single-Parent Households in Yankton County
The poverty data for Yankton County shows that 61 of the married-couple family households (1.3%) and 139 of the single-parent households (12.8%) are living below the poverty level. Within the married-couple family households, those with no children have the highest poverty rate, with 59 households (2.0%) falling below the poverty line. Among the single-parent households, those with 3 or 4 children have the highest poverty rate, with 65 household (46.1%) living below poverty.
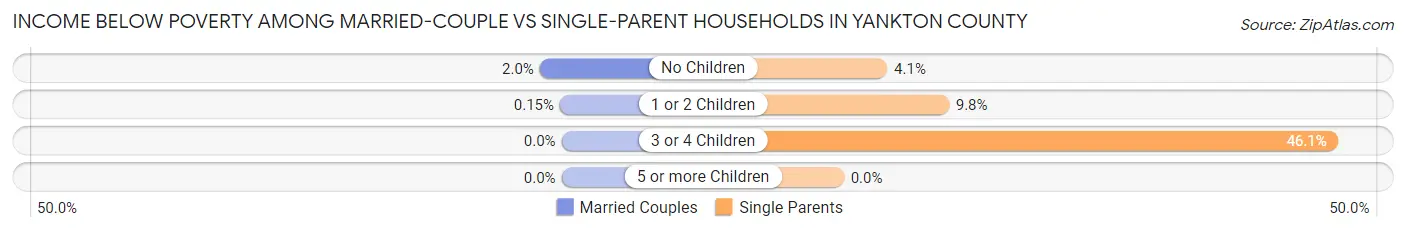
| Children | Married-Couple Families | Single-Parent Households |
| No Children | 59 (2.0%) | 13 (4.1%) |
| 1 or 2 Children | 2 (0.2%) | 61 (9.8%) |
| 3 or 4 Children | 0 (0.0%) | 65 (46.1%) |
| 5 or more Children | 0 (0.0%) | 0 (0.0%) |
| Total | 61 (1.3%) | 139 (12.8%) |
Employment Characteristics in Yankton County
Employment by Class of Employer in Yankton County
Among the 11,674 employed individuals in Yankton County, private company employees (7,109 | 60.9%), not-for-profit organizations (1,466 | 12.6%), and self-employed (not incorporated) (752 | 6.4%) make up the most common classes of employment.
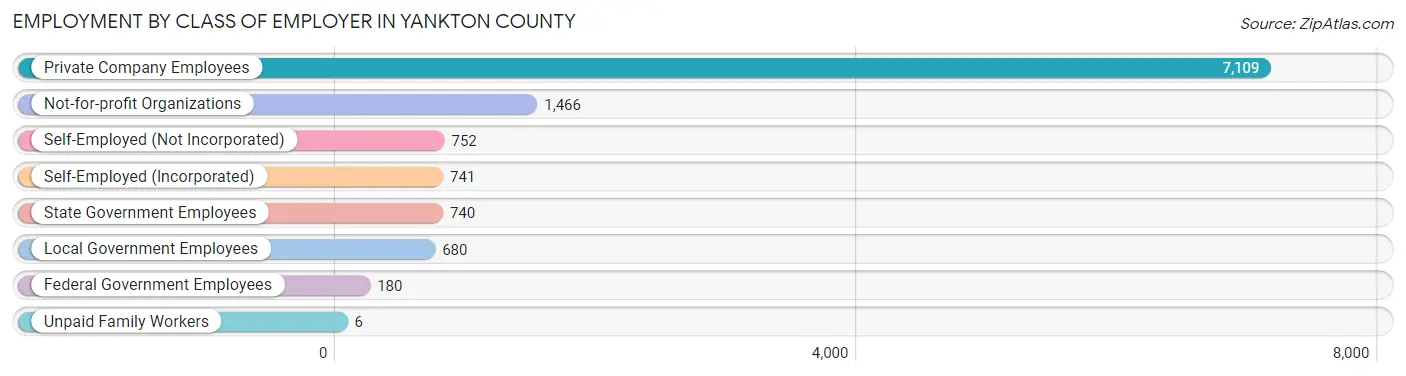
| Employer Class | # Employees | % Employees |
| Private Company Employees | 7,109 | 60.9% |
| Self-Employed (Incorporated) | 741 | 6.4% |
| Self-Employed (Not Incorporated) | 752 | 6.4% |
| Not-for-profit Organizations | 1,466 | 12.6% |
| Local Government Employees | 680 | 5.8% |
| State Government Employees | 740 | 6.3% |
| Federal Government Employees | 180 | 1.5% |
| Unpaid Family Workers | 6 | 0.1% |
| Total | 11,674 | 100.0% |
Employment Status by Age in Yankton County
According to the labor force statistics for Yankton County, out of the total population over 16 years of age (18,955), 63.8% or 12,093 individuals are in the labor force, with 1.6% or 193 of them unemployed. The age group with the highest labor force participation rate is 25 to 29 years, with 87.2% or 1,157 individuals in the labor force. Within the labor force, the 45 to 54 years age range has the highest percentage of unemployed individuals, with 3.0% or 72 of them being unemployed.
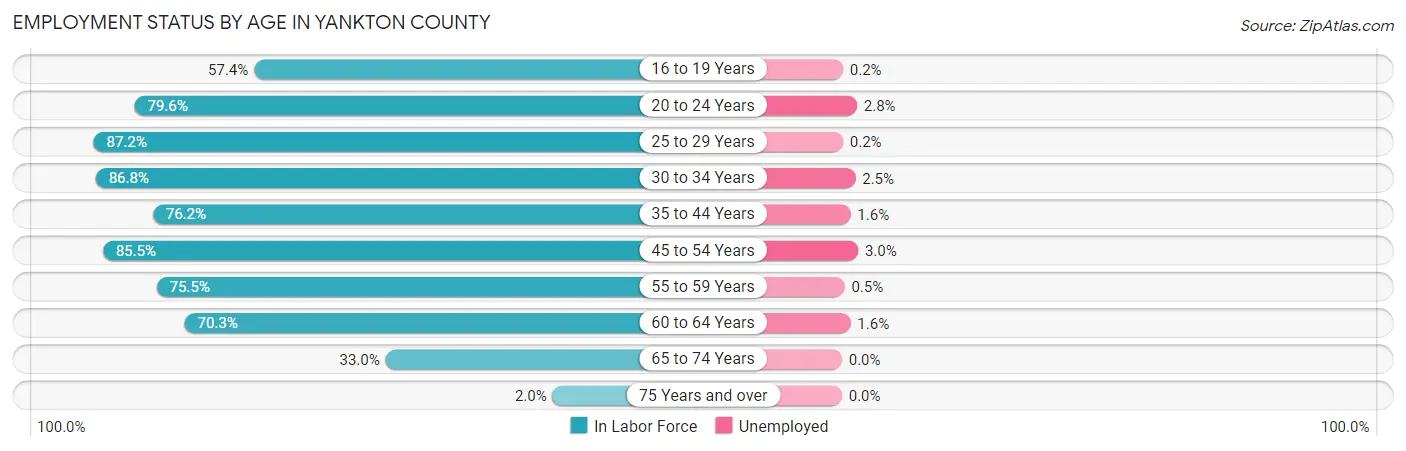
| Age Bracket | In Labor Force | Unemployed |
| 16 to 19 Years | 648 (57.4%) | 1 (0.2%) |
| 20 to 24 Years | 1,264 (79.6%) | 35 (2.8%) |
| 25 to 29 Years | 1,157 (87.2%) | 2 (0.2%) |
| 30 to 34 Years | 1,136 (86.8%) | 28 (2.5%) |
| 35 to 44 Years | 2,181 (76.2%) | 35 (1.6%) |
| 45 to 54 Years | 2,390 (85.5%) | 72 (3.0%) |
| 55 to 59 Years | 1,246 (75.5%) | 6 (0.5%) |
| 60 to 64 Years | 1,163 (70.3%) | 19 (1.6%) |
| 65 to 74 Years | 860 (33.0%) | 0 (0.0%) |
| 75 Years and over | 41 (2.0%) | 0 (0.0%) |
| Total | 12,093 (63.8%) | 193 (1.6%) |
Employment Status by Educational Attainment in Yankton County
According to labor force statistics for Yankton County, 80.0% of individuals (9,278) out of the total population between 25 and 64 years of age (11,597) are in the labor force, with 1.7% or 158 of them being unemployed. The group with the highest labor force participation rate are those with the educational attainment of bachelor's degree or higher, with 89.9% or 2,951 individuals in the labor force. Within the labor force, individuals with less than high school education have the highest percentage of unemployment, with 12.5% or 52 of them being unemployed.
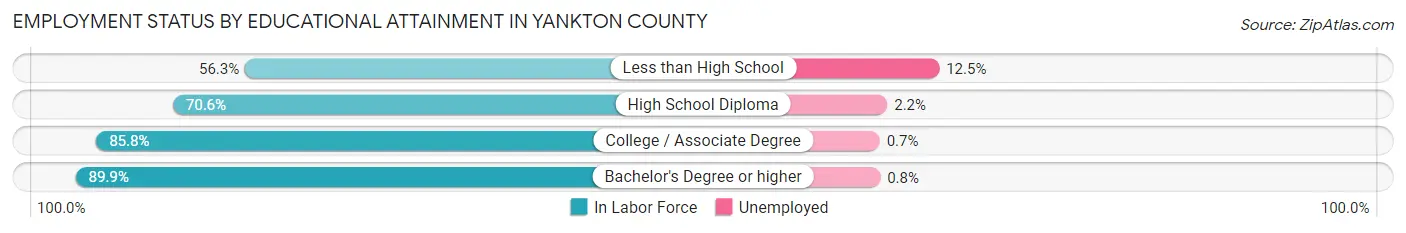
| Educational Attainment | In Labor Force | Unemployed |
| Less than High School | 415 (56.3%) | 92 (12.5%) |
| High School Diploma | 2,764 (70.6%) | 86 (2.2%) |
| College / Associate Degree | 3,142 (85.8%) | 26 (0.7%) |
| Bachelor's Degree or higher | 2,951 (89.9%) | 26 (0.8%) |
| Total | 9,278 (80.0%) | 197 (1.7%) |
Employment Occupations by Sex in Yankton County
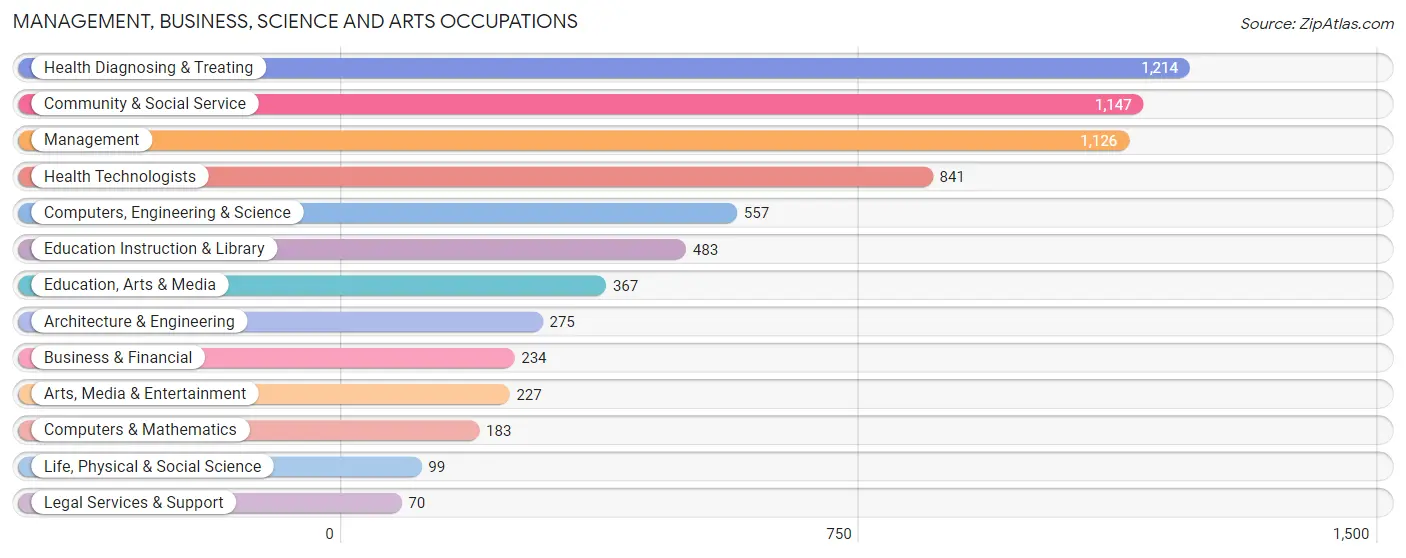
Management, Business, Science and Arts Occupations
The most common Management, Business, Science and Arts occupations in Yankton County are Health Diagnosing & Treating (1,214 | 10.2%), Community & Social Service (1,147 | 9.7%), Management (1,126 | 9.5%), Health Technologists (841 | 7.1%), and Computers, Engineering & Science (557 | 4.7%).
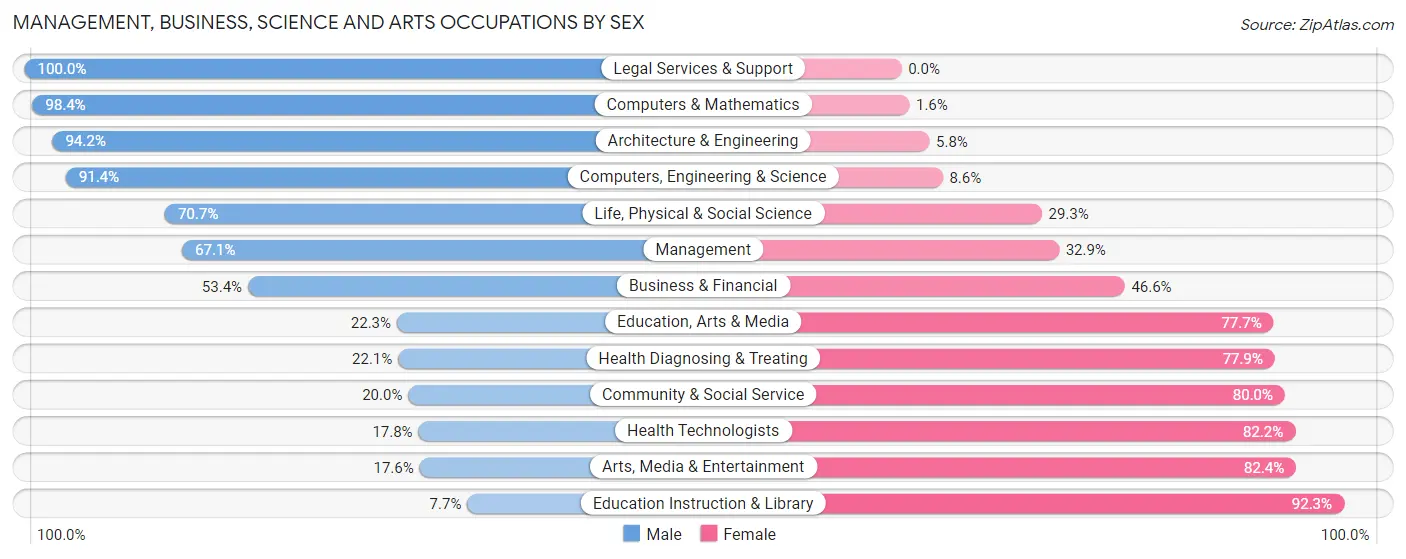
Management, Business, Science and Arts Occupations by Sex
Within the Management, Business, Science and Arts occupations in Yankton County, the most male-oriented occupations are Legal Services & Support (100.0%), Computers & Mathematics (98.4%), and Architecture & Engineering (94.2%), while the most female-oriented occupations are Education Instruction & Library (92.3%), Arts, Media & Entertainment (82.4%), and Health Technologists (82.2%).
| Occupation | Male | Female |
| Management | 756 (67.1%) | 370 (32.9%) |
| Business & Financial | 125 (53.4%) | 109 (46.6%) |
| Computers, Engineering & Science | 509 (91.4%) | 48 (8.6%) |
| Computers & Mathematics | 180 (98.4%) | 3 (1.6%) |
| Architecture & Engineering | 259 (94.2%) | 16 (5.8%) |
| Life, Physical & Social Science | 70 (70.7%) | 29 (29.3%) |
| Community & Social Service | 229 (20.0%) | 918 (80.0%) |
| Education, Arts & Media | 82 (22.3%) | 285 (77.7%) |
| Legal Services & Support | 70 (100.0%) | 0 (0.0%) |
| Education Instruction & Library | 37 (7.7%) | 446 (92.3%) |
| Arts, Media & Entertainment | 40 (17.6%) | 187 (82.4%) |
| Health Diagnosing & Treating | 268 (22.1%) | 946 (77.9%) |
| Health Technologists | 150 (17.8%) | 691 (82.2%) |
| Total (Category) | 1,887 (44.1%) | 2,391 (55.9%) |
| Total (Overall) | 6,323 (53.2%) | 5,553 (46.8%) |
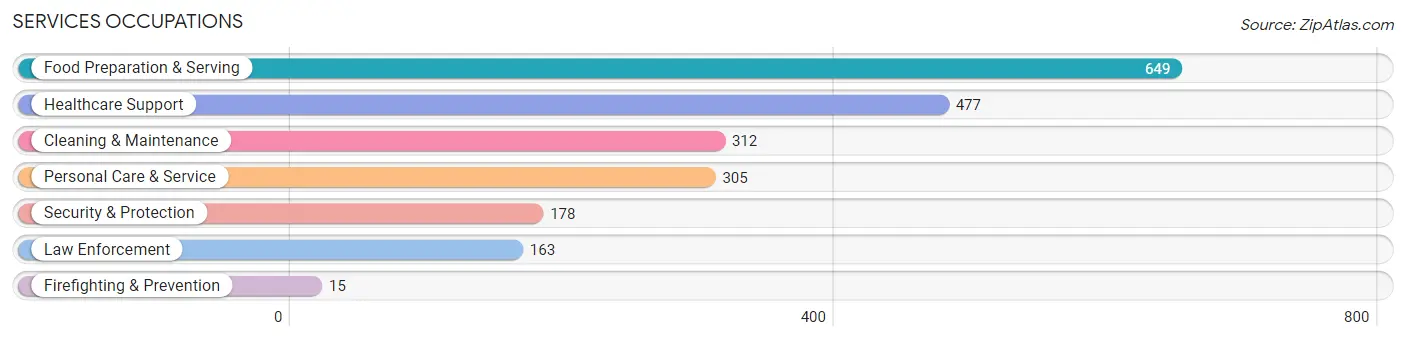
Services Occupations
The most common Services occupations in Yankton County are Food Preparation & Serving (649 | 5.5%), Healthcare Support (477 | 4.0%), Cleaning & Maintenance (312 | 2.6%), Personal Care & Service (305 | 2.6%), and Security & Protection (178 | 1.5%).
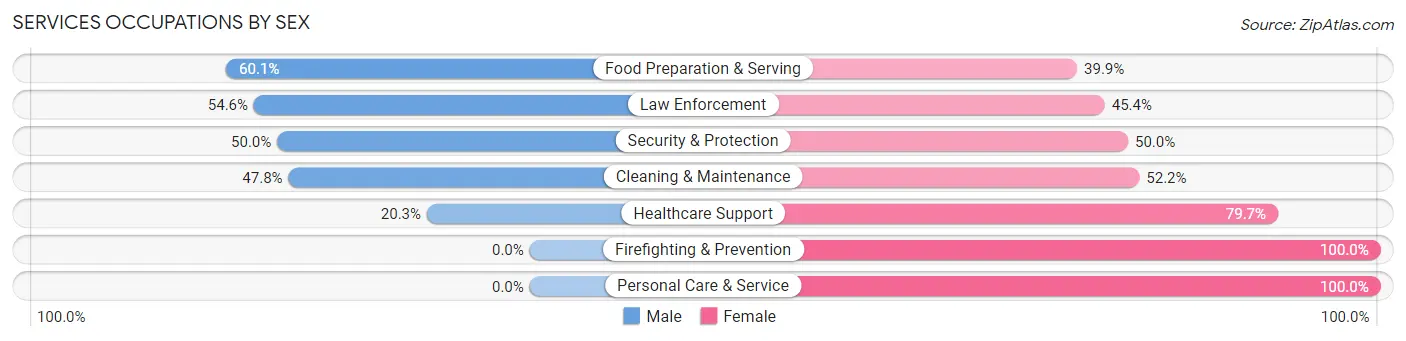
Services Occupations by Sex
Within the Services occupations in Yankton County, the most male-oriented occupations are Food Preparation & Serving (60.1%), Law Enforcement (54.6%), and Security & Protection (50.0%), while the most female-oriented occupations are Firefighting & Prevention (100.0%), Personal Care & Service (100.0%), and Healthcare Support (79.7%).
| Occupation | Male | Female |
| Healthcare Support | 97 (20.3%) | 380 (79.7%) |
| Security & Protection | 89 (50.0%) | 89 (50.0%) |
| Firefighting & Prevention | 0 (0.0%) | 15 (100.0%) |
| Law Enforcement | 89 (54.6%) | 74 (45.4%) |
| Food Preparation & Serving | 390 (60.1%) | 259 (39.9%) |
| Cleaning & Maintenance | 149 (47.8%) | 163 (52.2%) |
| Personal Care & Service | 0 (0.0%) | 305 (100.0%) |
| Total (Category) | 725 (37.7%) | 1,196 (62.3%) |
| Total (Overall) | 6,323 (53.2%) | 5,553 (46.8%) |
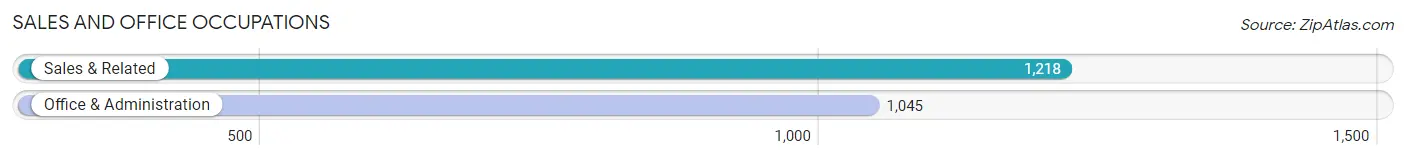
Sales and Office Occupations
The most common Sales and Office occupations in Yankton County are Sales & Related (1,218 | 10.3%), and Office & Administration (1,045 | 8.8%).
Sales and Office Occupations by Sex
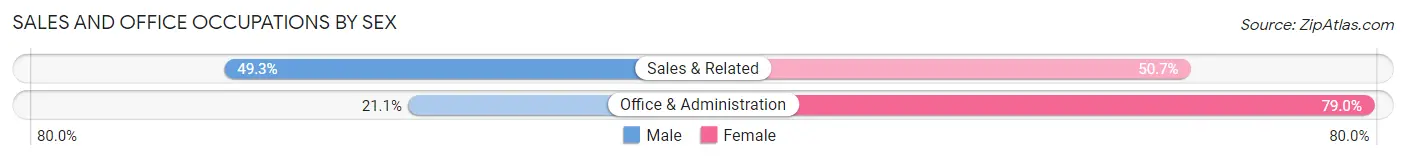
| Occupation | Male | Female |
| Sales & Related | 600 (49.3%) | 618 (50.7%) |
| Office & Administration | 220 (21.0%) | 825 (78.9%) |
| Total (Category) | 820 (36.2%) | 1,443 (63.8%) |
| Total (Overall) | 6,323 (53.2%) | 5,553 (46.8%) |
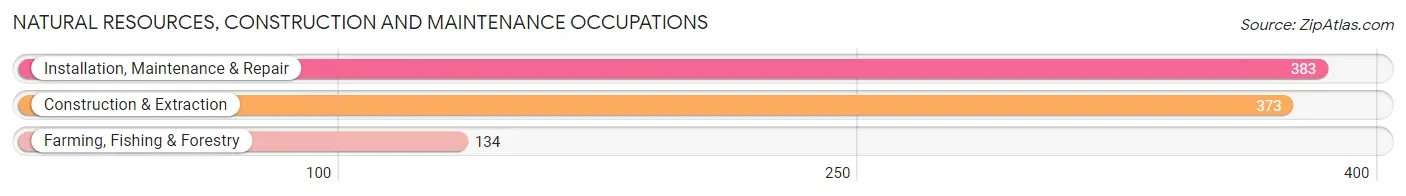
Natural Resources, Construction and Maintenance Occupations
The most common Natural Resources, Construction and Maintenance occupations in Yankton County are Installation, Maintenance & Repair (383 | 3.2%), Construction & Extraction (373 | 3.1%), and Farming, Fishing & Forestry (134 | 1.1%).
Natural Resources, Construction and Maintenance Occupations by Sex
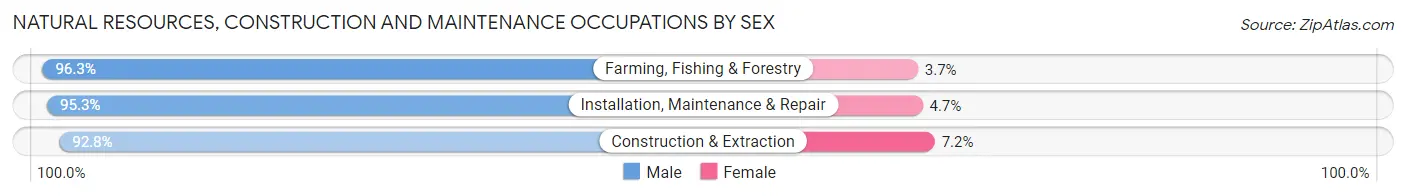
| Occupation | Male | Female |
| Farming, Fishing & Forestry | 129 (96.3%) | 5 (3.7%) |
| Construction & Extraction | 346 (92.8%) | 27 (7.2%) |
| Installation, Maintenance & Repair | 365 (95.3%) | 18 (4.7%) |
| Total (Category) | 840 (94.4%) | 50 (5.6%) |
| Total (Overall) | 6,323 (53.2%) | 5,553 (46.8%) |
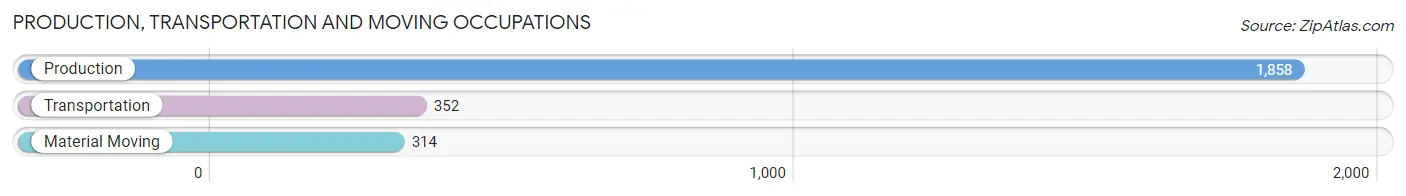
Production, Transportation and Moving Occupations
The most common Production, Transportation and Moving occupations in Yankton County are Production (1,858 | 15.6%), Transportation (352 | 3.0%), and Material Moving (314 | 2.6%).
Production, Transportation and Moving Occupations by Sex
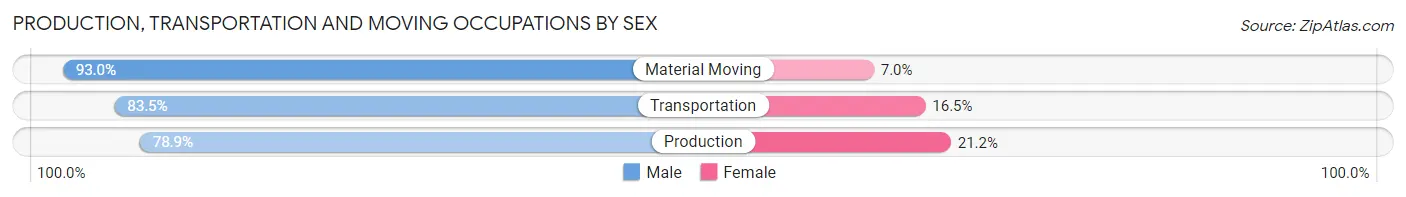
| Occupation | Male | Female |
| Production | 1,465 (78.8%) | 393 (21.1%) |
| Transportation | 294 (83.5%) | 58 (16.5%) |
| Material Moving | 292 (93.0%) | 22 (7.0%) |
| Total (Category) | 2,051 (81.3%) | 473 (18.7%) |
| Total (Overall) | 6,323 (53.2%) | 5,553 (46.8%) |
Employment Industries by Sex in Yankton County
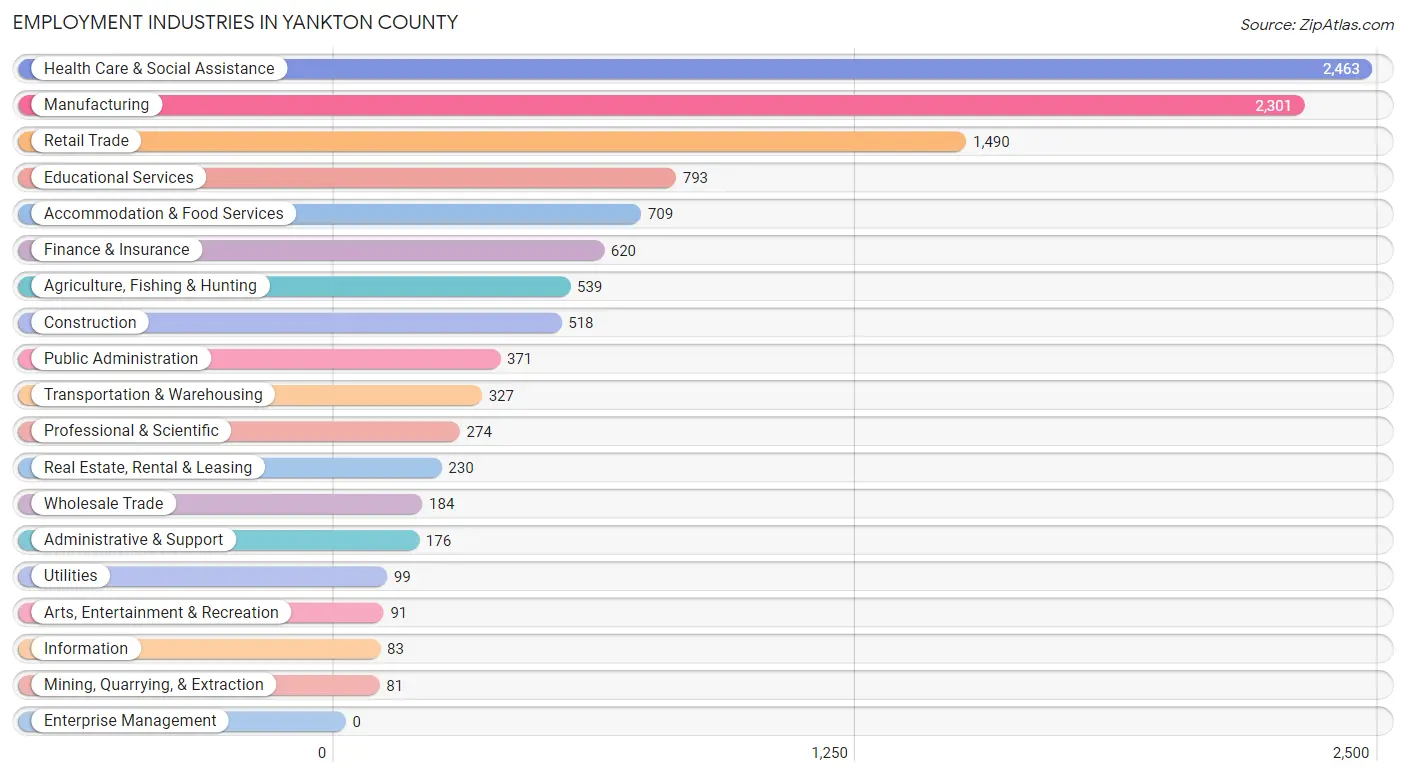
Employment Industries in Yankton County
The major employment industries in Yankton County include Health Care & Social Assistance (2,463 | 20.7%), Manufacturing (2,301 | 19.4%), Retail Trade (1,490 | 12.6%), Educational Services (793 | 6.7%), and Accommodation & Food Services (709 | 6.0%).
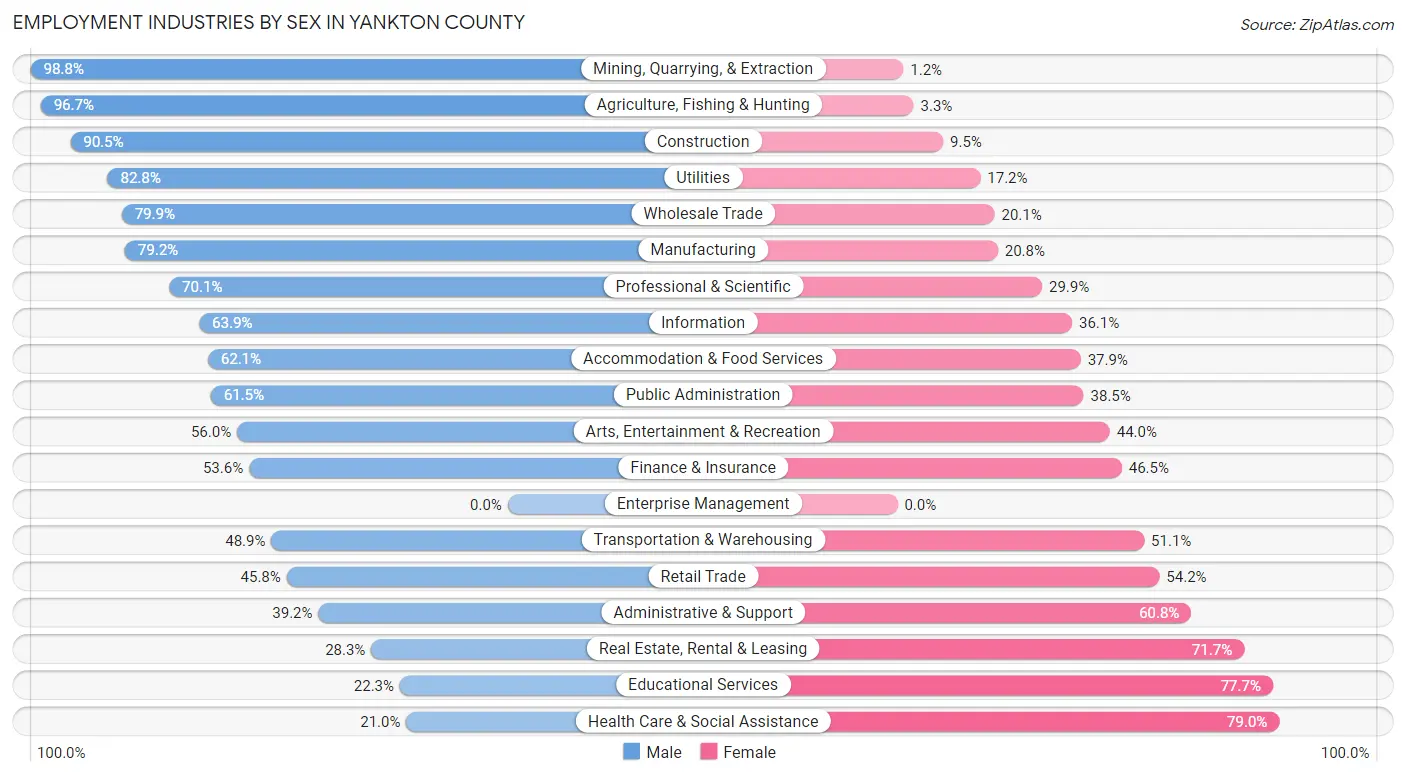
Employment Industries by Sex in Yankton County
The Yankton County industries that see more men than women are Mining, Quarrying, & Extraction (98.8%), Agriculture, Fishing & Hunting (96.7%), and Construction (90.5%), whereas the industries that tend to have a higher number of women are Health Care & Social Assistance (79.0%), Educational Services (77.7%), and Real Estate, Rental & Leasing (71.7%).
| Industry | Male | Female |
| Agriculture, Fishing & Hunting | 521 (96.7%) | 18 (3.3%) |
| Mining, Quarrying, & Extraction | 80 (98.8%) | 1 (1.2%) |
| Construction | 469 (90.5%) | 49 (9.5%) |
| Manufacturing | 1,823 (79.2%) | 478 (20.8%) |
| Wholesale Trade | 147 (79.9%) | 37 (20.1%) |
| Retail Trade | 682 (45.8%) | 808 (54.2%) |
| Transportation & Warehousing | 160 (48.9%) | 167 (51.1%) |
| Utilities | 82 (82.8%) | 17 (17.2%) |
| Information | 53 (63.9%) | 30 (36.1%) |
| Finance & Insurance | 332 (53.5%) | 288 (46.5%) |
| Real Estate, Rental & Leasing | 65 (28.3%) | 165 (71.7%) |
| Professional & Scientific | 192 (70.1%) | 82 (29.9%) |
| Enterprise Management | 0 (0.0%) | 0 (0.0%) |
| Administrative & Support | 69 (39.2%) | 107 (60.8%) |
| Educational Services | 177 (22.3%) | 616 (77.7%) |
| Health Care & Social Assistance | 517 (21.0%) | 1,946 (79.0%) |
| Arts, Entertainment & Recreation | 51 (56.0%) | 40 (44.0%) |
| Accommodation & Food Services | 440 (62.1%) | 269 (37.9%) |
| Public Administration | 228 (61.5%) | 143 (38.5%) |
| Total | 6,323 (53.2%) | 5,553 (46.8%) |
Education in Yankton County
School Enrollment in Yankton County
The most common levels of schooling among the 5,149 students in Yankton County are high school (1,377 | 26.7%), middle school (1,152 | 22.4%), and elementary school (1,018 | 19.8%).
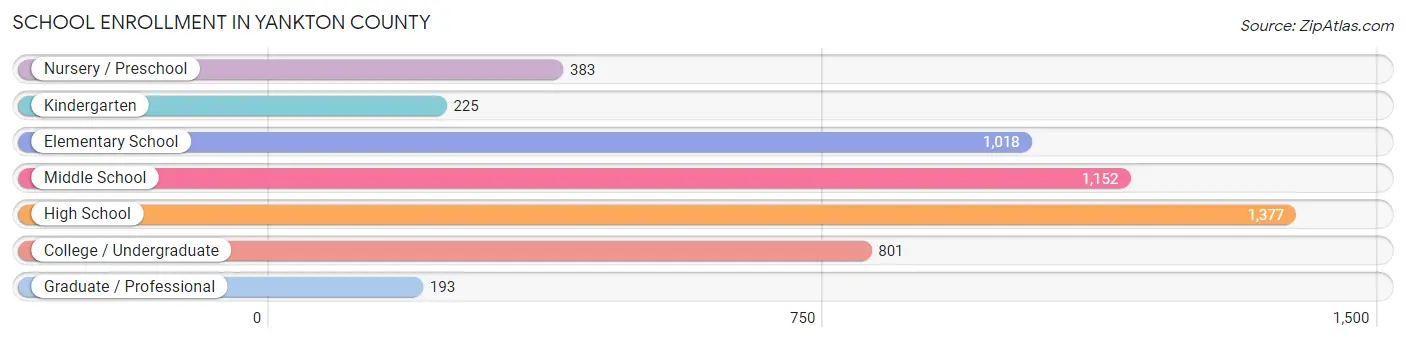
| School Level | # Students | % Students |
| Nursery / Preschool | 383 | 7.4% |
| Kindergarten | 225 | 4.4% |
| Elementary School | 1,018 | 19.8% |
| Middle School | 1,152 | 22.4% |
| High School | 1,377 | 26.7% |
| College / Undergraduate | 801 | 15.6% |
| Graduate / Professional | 193 | 3.7% |
| Total | 5,149 | 100.0% |
School Enrollment by Age by Funding Source in Yankton County
Out of a total of 5,149 students who are enrolled in schools in Yankton County, 839 (16.3%) attend a private institution, while the remaining 4,310 (83.7%) are enrolled in public schools. The age group of 20 to 24 year olds has the highest likelihood of being enrolled in private schools, with 233 (54.8% in the age bracket) enrolled. Conversely, the age group of 15 to 17 year olds has the lowest likelihood of being enrolled in a private school, with 861 (100.0% in the age bracket) attending a public institution.
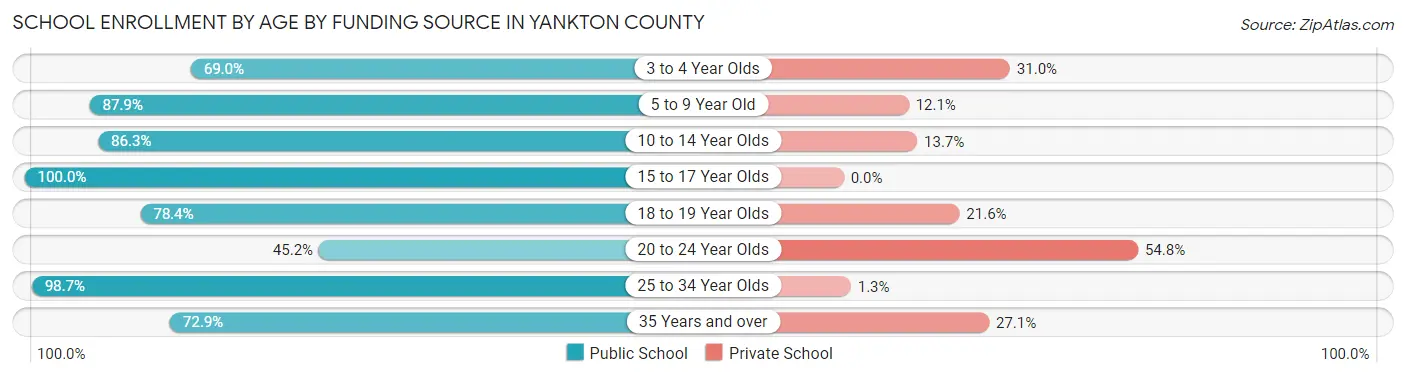
| Age Bracket | Public School | Private School |
| 3 to 4 Year Olds | 165 (69.0%) | 74 (31.0%) |
| 5 to 9 Year Old | 965 (87.9%) | 133 (12.1%) |
| 10 to 14 Year Olds | 1,445 (86.3%) | 229 (13.7%) |
| 15 to 17 Year Olds | 861 (100.0%) | 0 (0.0%) |
| 18 to 19 Year Olds | 342 (78.4%) | 94 (21.6%) |
| 20 to 24 Year Olds | 192 (45.2%) | 233 (54.8%) |
| 25 to 34 Year Olds | 148 (98.7%) | 2 (1.3%) |
| 35 Years and over | 194 (72.9%) | 72 (27.1%) |
| Total | 4,310 (83.7%) | 839 (16.3%) |
Educational Attainment by Field of Study in Yankton County
Education (1,107 | 23.3%), science & technology (881 | 18.5%), business (584 | 12.3%), bio, nature & agricultural (467 | 9.8%), and arts & humanities (344 | 7.2%) are the most common fields of study among 4,754 individuals in Yankton County who have obtained a bachelor's degree or higher.
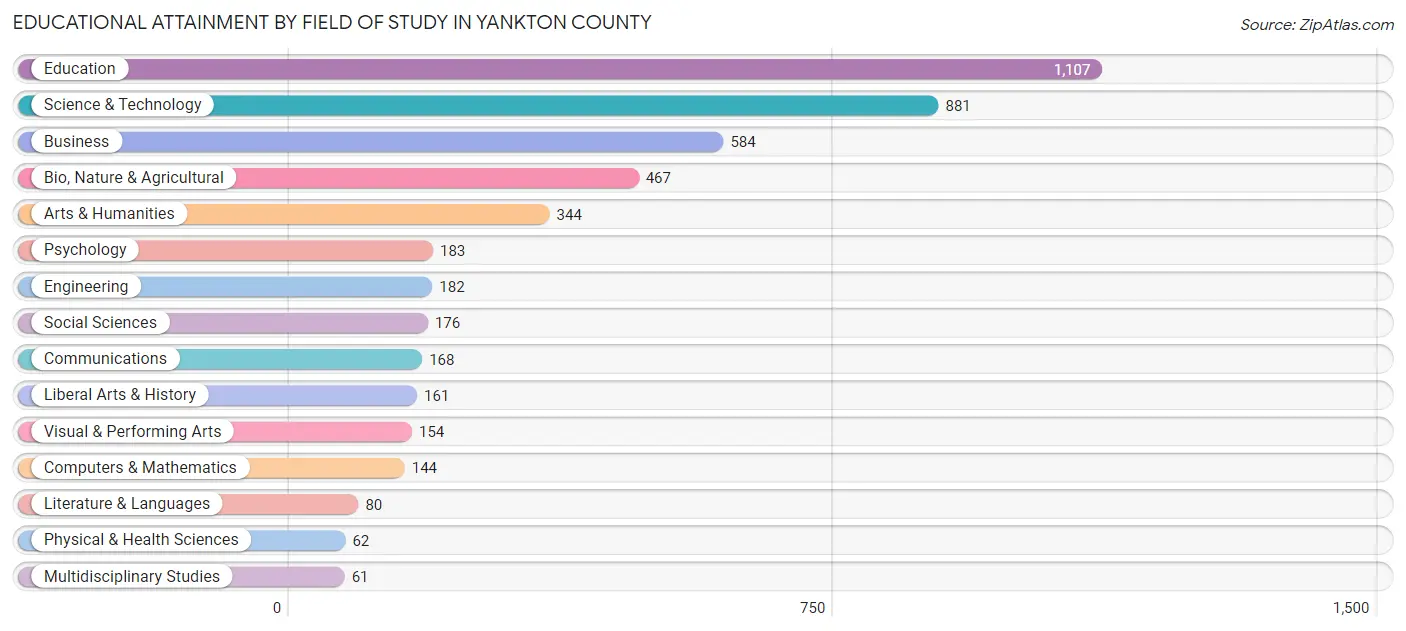
| Field of Study | # Graduates | % Graduates |
| Computers & Mathematics | 144 | 3.0% |
| Bio, Nature & Agricultural | 467 | 9.8% |
| Physical & Health Sciences | 62 | 1.3% |
| Psychology | 183 | 3.8% |
| Social Sciences | 176 | 3.7% |
| Engineering | 182 | 3.8% |
| Multidisciplinary Studies | 61 | 1.3% |
| Science & Technology | 881 | 18.5% |
| Business | 584 | 12.3% |
| Education | 1,107 | 23.3% |
| Literature & Languages | 80 | 1.7% |
| Liberal Arts & History | 161 | 3.4% |
| Visual & Performing Arts | 154 | 3.2% |
| Communications | 168 | 3.5% |
| Arts & Humanities | 344 | 7.2% |
| Total | 4,754 | 100.0% |
Transportation & Commute in Yankton County
Vehicle Availability by Sex in Yankton County
The most prevalent vehicle ownership categories in Yankton County are males with 2 vehicles (2,498, accounting for 40.5%) and females with 2 vehicles (2,096, making up 46.5%).
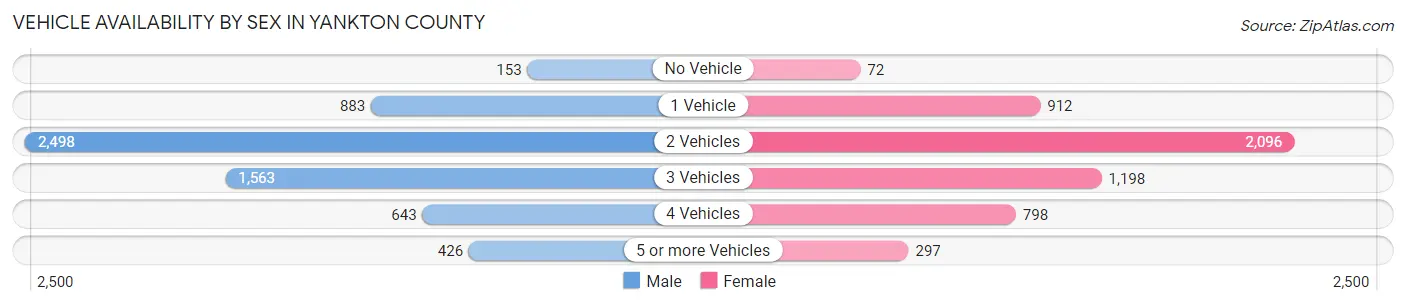
| Vehicles Available | Male | Female |
| No Vehicle | 153 (2.5%) | 72 (1.3%) |
| 1 Vehicle | 883 (14.3%) | 912 (17.0%) |
| 2 Vehicles | 2,498 (40.5%) | 2,096 (39.0%) |
| 3 Vehicles | 1,563 (25.4%) | 1,198 (22.3%) |
| 4 Vehicles | 643 (10.4%) | 798 (14.8%) |
| 5 or more Vehicles | 426 (6.9%) | 297 (5.5%) |
| Total | 6,166 (100.0%) | 5,373 (100.0%) |
Commute Time in Yankton County
The most frequently occuring commute durations in Yankton County are 5 to 9 minutes (3,464 commuters, 31.4%), 10 to 14 minutes (2,480 commuters, 22.5%), and 15 to 19 minutes (1,587 commuters, 14.4%).
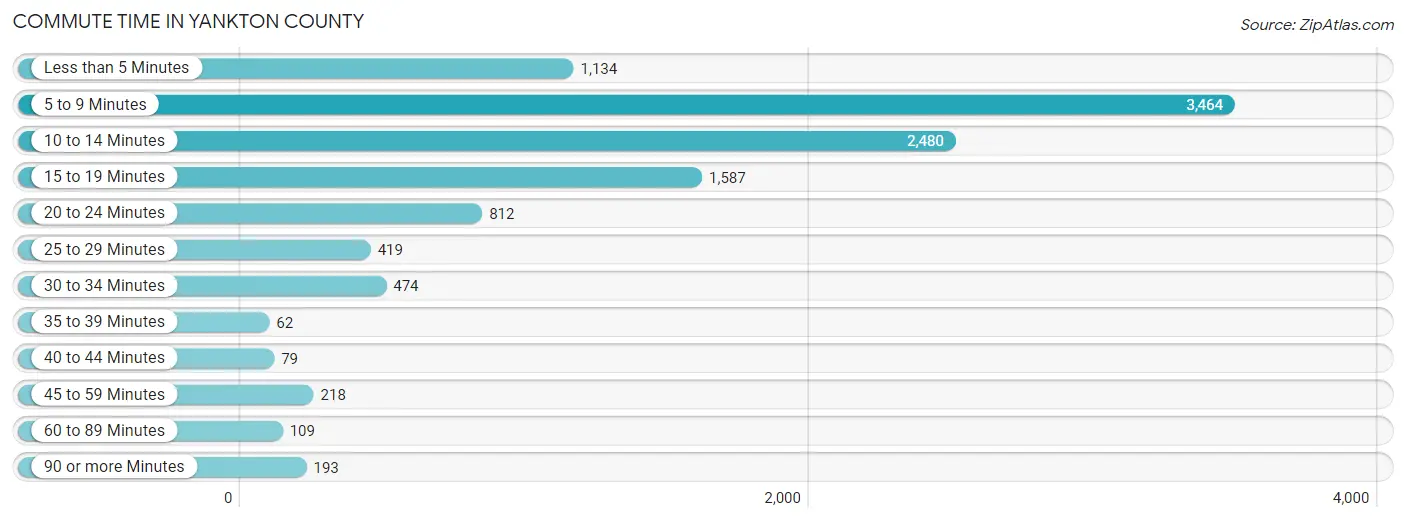
| Commute Time | # Commuters | % Commuters |
| Less than 5 Minutes | 1,134 | 10.3% |
| 5 to 9 Minutes | 3,464 | 31.4% |
| 10 to 14 Minutes | 2,480 | 22.5% |
| 15 to 19 Minutes | 1,587 | 14.4% |
| 20 to 24 Minutes | 812 | 7.4% |
| 25 to 29 Minutes | 419 | 3.8% |
| 30 to 34 Minutes | 474 | 4.3% |
| 35 to 39 Minutes | 62 | 0.6% |
| 40 to 44 Minutes | 79 | 0.7% |
| 45 to 59 Minutes | 218 | 2.0% |
| 60 to 89 Minutes | 109 | 1.0% |
| 90 or more Minutes | 193 | 1.8% |
Commute Time by Sex in Yankton County
The most common commute times in Yankton County are 5 to 9 minutes (1,921 commuters, 32.1%) for males and 5 to 9 minutes (1,543 commuters, 30.6%) for females.
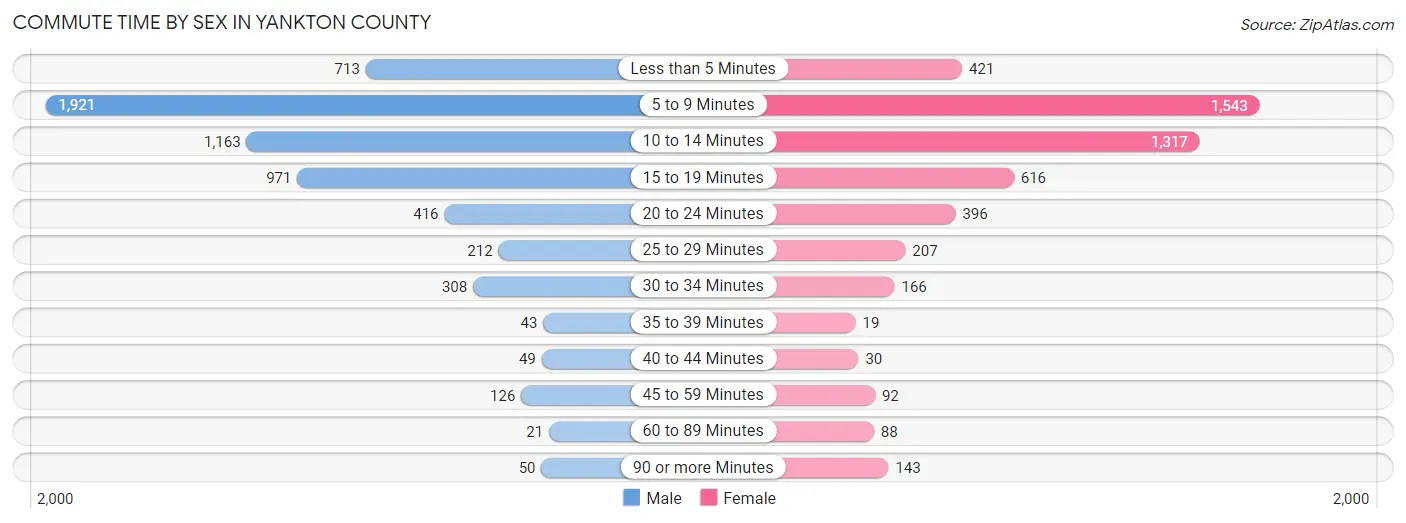
| Commute Time | Male | Female |
| Less than 5 Minutes | 713 (11.9%) | 421 (8.4%) |
| 5 to 9 Minutes | 1,921 (32.1%) | 1,543 (30.6%) |
| 10 to 14 Minutes | 1,163 (19.4%) | 1,317 (26.1%) |
| 15 to 19 Minutes | 971 (16.2%) | 616 (12.2%) |
| 20 to 24 Minutes | 416 (6.9%) | 396 (7.9%) |
| 25 to 29 Minutes | 212 (3.5%) | 207 (4.1%) |
| 30 to 34 Minutes | 308 (5.1%) | 166 (3.3%) |
| 35 to 39 Minutes | 43 (0.7%) | 19 (0.4%) |
| 40 to 44 Minutes | 49 (0.8%) | 30 (0.6%) |
| 45 to 59 Minutes | 126 (2.1%) | 92 (1.8%) |
| 60 to 89 Minutes | 21 (0.4%) | 88 (1.8%) |
| 90 or more Minutes | 50 (0.8%) | 143 (2.8%) |
Time of Departure to Work by Sex in Yankton County
The most frequent times of departure to work in Yankton County are 7:30 AM to 7:59 AM (920, 15.3%) for males and 7:30 AM to 7:59 AM (985, 19.6%) for females.
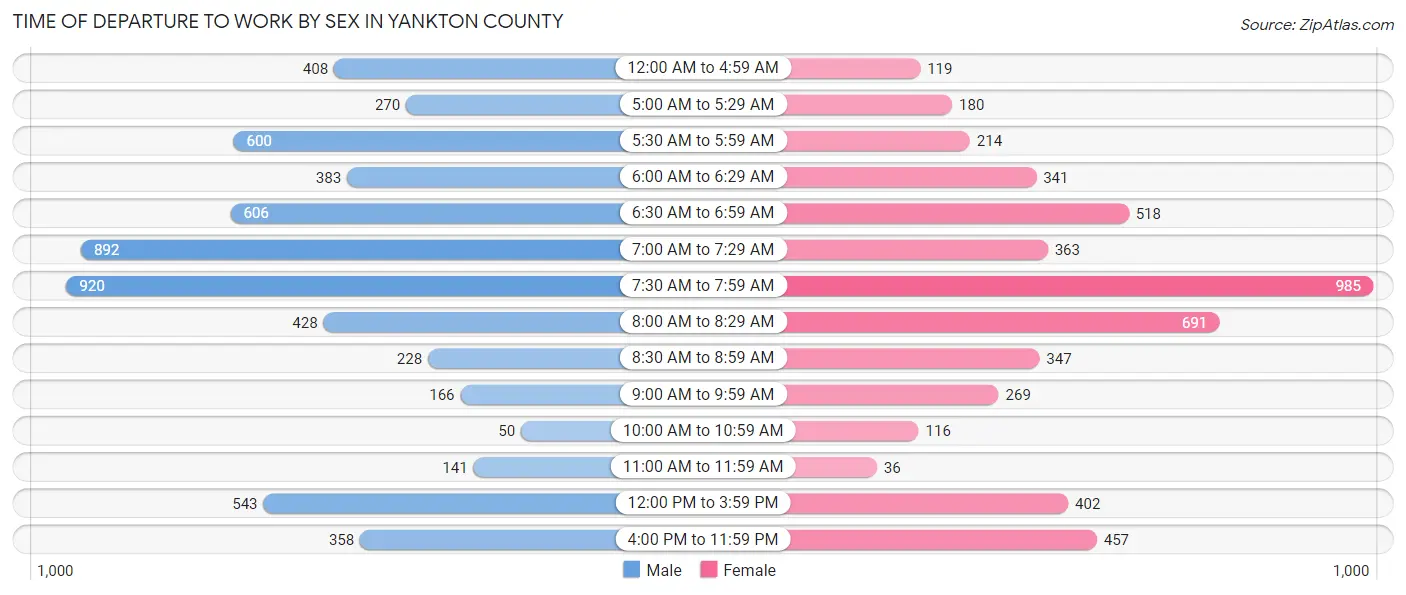
| Time of Departure | Male | Female |
| 12:00 AM to 4:59 AM | 408 (6.8%) | 119 (2.4%) |
| 5:00 AM to 5:29 AM | 270 (4.5%) | 180 (3.6%) |
| 5:30 AM to 5:59 AM | 600 (10.0%) | 214 (4.3%) |
| 6:00 AM to 6:29 AM | 383 (6.4%) | 341 (6.8%) |
| 6:30 AM to 6:59 AM | 606 (10.1%) | 518 (10.3%) |
| 7:00 AM to 7:29 AM | 892 (14.9%) | 363 (7.2%) |
| 7:30 AM to 7:59 AM | 920 (15.3%) | 985 (19.6%) |
| 8:00 AM to 8:29 AM | 428 (7.1%) | 691 (13.7%) |
| 8:30 AM to 8:59 AM | 228 (3.8%) | 347 (6.9%) |
| 9:00 AM to 9:59 AM | 166 (2.8%) | 269 (5.3%) |
| 10:00 AM to 10:59 AM | 50 (0.8%) | 116 (2.3%) |
| 11:00 AM to 11:59 AM | 141 (2.4%) | 36 (0.7%) |
| 12:00 PM to 3:59 PM | 543 (9.1%) | 402 (8.0%) |
| 4:00 PM to 11:59 PM | 358 (6.0%) | 457 (9.1%) |
| Total | 5,993 (100.0%) | 5,038 (100.0%) |
Housing Occupancy in Yankton County
Occupancy by Ownership in Yankton County
Of the total 9,789 dwellings in Yankton County, owner-occupied units account for 6,890 (70.4%), while renter-occupied units make up 2,899 (29.6%).
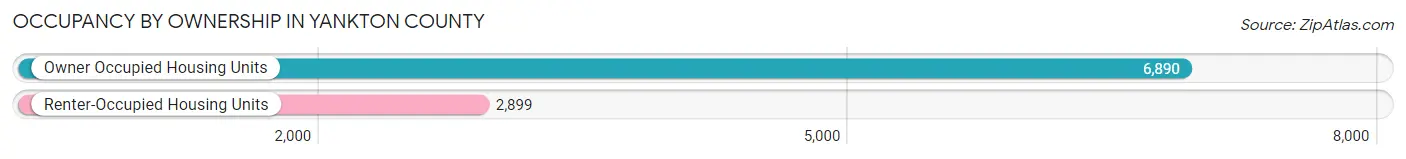
| Occupancy | # Housing Units | % Housing Units |
| Owner Occupied Housing Units | 6,890 | 70.4% |
| Renter-Occupied Housing Units | 2,899 | 29.6% |
| Total Occupied Housing Units | 9,789 | 100.0% |
Occupancy by Household Size in Yankton County
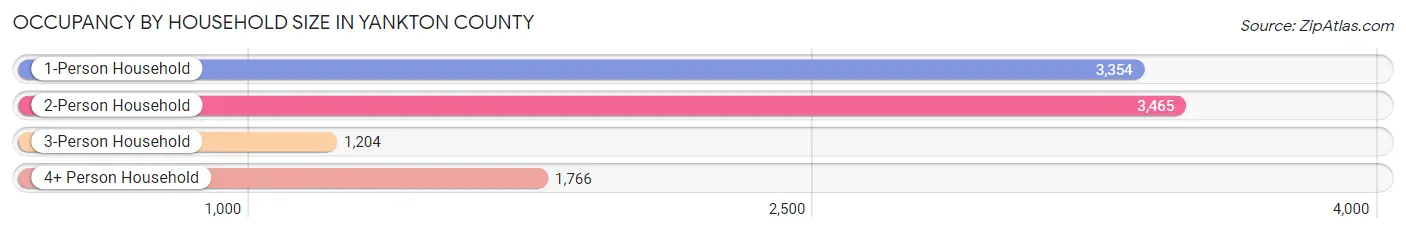
| Household Size | # Housing Units | % Housing Units |
| 1-Person Household | 3,354 | 34.3% |
| 2-Person Household | 3,465 | 35.4% |
| 3-Person Household | 1,204 | 12.3% |
| 4+ Person Household | 1,766 | 18.0% |
| Total Housing Units | 9,789 | 100.0% |
Occupancy by Ownership by Household Size in Yankton County
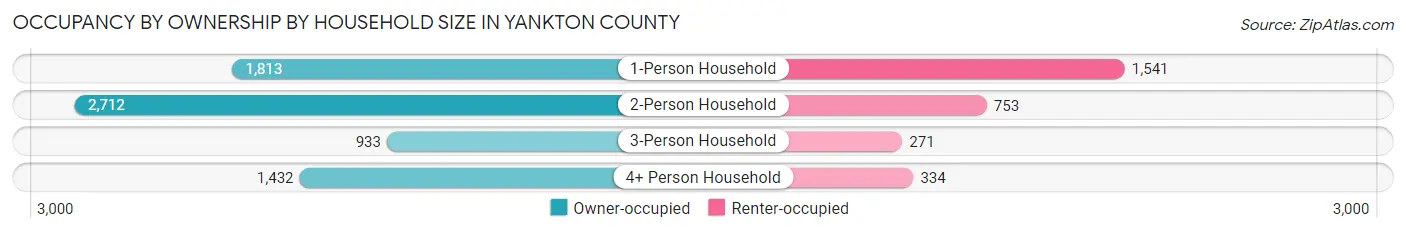
| Household Size | Owner-occupied | Renter-occupied |
| 1-Person Household | 1,813 (54.0%) | 1,541 (46.0%) |
| 2-Person Household | 2,712 (78.3%) | 753 (21.7%) |
| 3-Person Household | 933 (77.5%) | 271 (22.5%) |
| 4+ Person Household | 1,432 (81.1%) | 334 (18.9%) |
| Total Housing Units | 6,890 (70.4%) | 2,899 (29.6%) |
Occupancy by Educational Attainment in Yankton County
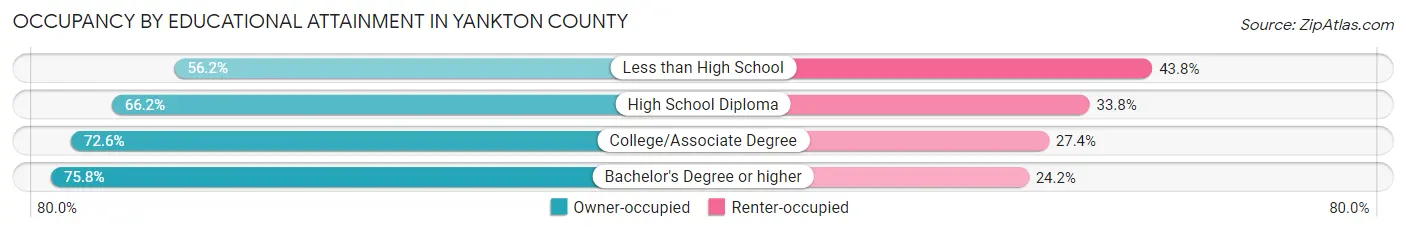
| Household Size | Owner-occupied | Renter-occupied |
| Less than High School | 326 (56.2%) | 254 (43.8%) |
| High School Diploma | 2,166 (66.2%) | 1,108 (33.8%) |
| College/Associate Degree | 2,304 (72.6%) | 869 (27.4%) |
| Bachelor's Degree or higher | 2,094 (75.8%) | 668 (24.2%) |
Occupancy by Age of Householder in Yankton County
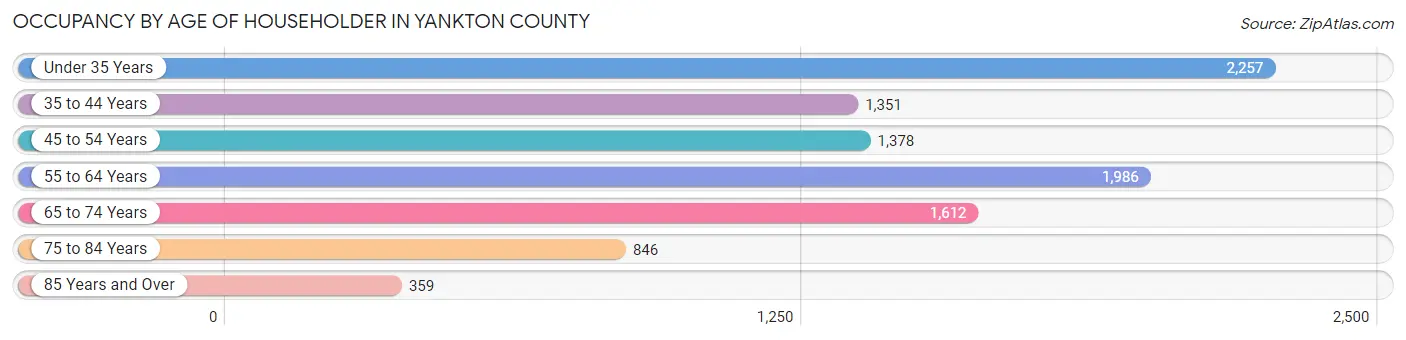
| Age Bracket | # Households | % Households |
| Under 35 Years | 2,257 | 23.1% |
| 35 to 44 Years | 1,351 | 13.8% |
| 45 to 54 Years | 1,378 | 14.1% |
| 55 to 64 Years | 1,986 | 20.3% |
| 65 to 74 Years | 1,612 | 16.5% |
| 75 to 84 Years | 846 | 8.6% |
| 85 Years and Over | 359 | 3.7% |
| Total | 9,789 | 100.0% |
Housing Finances in Yankton County
Median Income by Occupancy in Yankton County
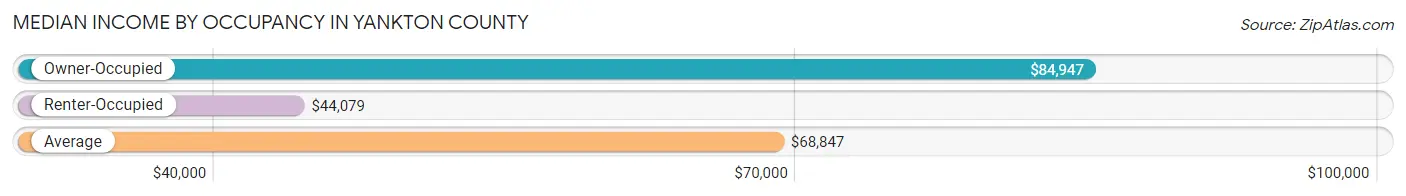
| Occupancy Type | # Households | Median Income |
| Owner-Occupied | 6,890 (70.4%) | $84,947 |
| Renter-Occupied | 2,899 (29.6%) | $44,079 |
| Average | 9,789 (100.0%) | $68,847 |
Occupancy by Householder Income Bracket in Yankton County
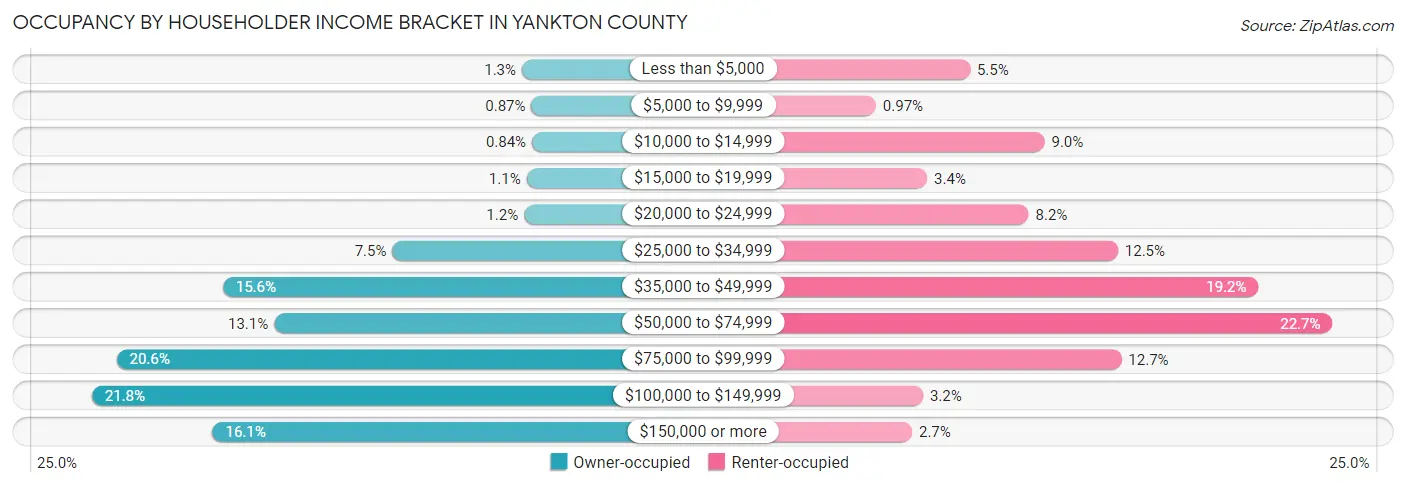
| Income Bracket | Owner-occupied | Renter-occupied |
| Less than $5,000 | 91 (1.3%) | 158 (5.4%) |
| $5,000 to $9,999 | 60 (0.9%) | 28 (1.0%) |
| $10,000 to $14,999 | 58 (0.8%) | 261 (9.0%) |
| $15,000 to $19,999 | 76 (1.1%) | 99 (3.4%) |
| $20,000 to $24,999 | 84 (1.2%) | 239 (8.2%) |
| $25,000 to $34,999 | 516 (7.5%) | 362 (12.5%) |
| $35,000 to $49,999 | 1,072 (15.6%) | 556 (19.2%) |
| $50,000 to $74,999 | 904 (13.1%) | 658 (22.7%) |
| $75,000 to $99,999 | 1,421 (20.6%) | 367 (12.7%) |
| $100,000 to $149,999 | 1,502 (21.8%) | 93 (3.2%) |
| $150,000 or more | 1,106 (16.1%) | 78 (2.7%) |
| Total | 6,890 (100.0%) | 2,899 (100.0%) |
Monthly Housing Cost Tiers in Yankton County
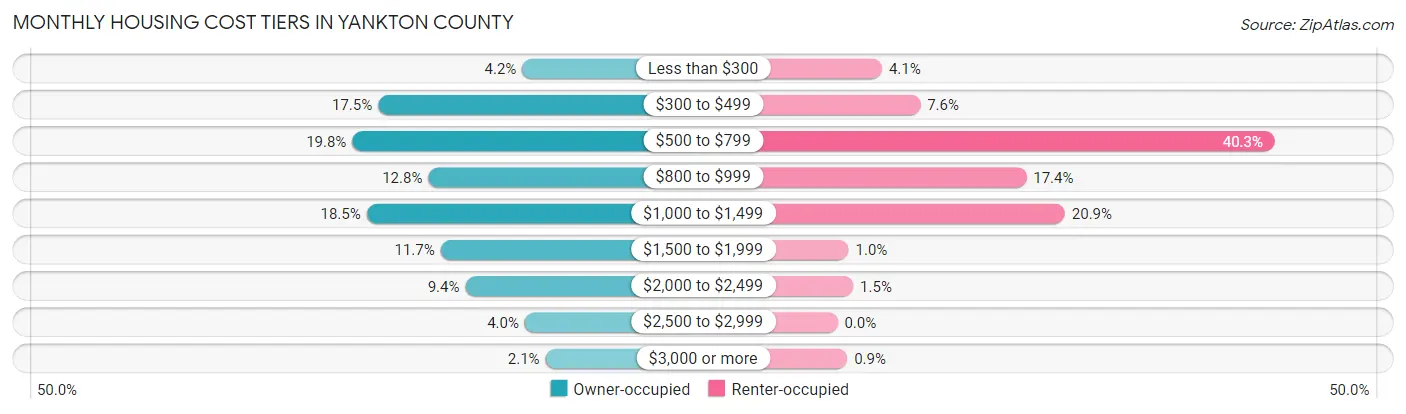
| Monthly Cost | Owner-occupied | Renter-occupied |
| Less than $300 | 289 (4.2%) | 119 (4.1%) |
| $300 to $499 | 1,203 (17.5%) | 221 (7.6%) |
| $500 to $799 | 1,367 (19.8%) | 1,167 (40.3%) |
| $800 to $999 | 885 (12.8%) | 504 (17.4%) |
| $1,000 to $1,499 | 1,276 (18.5%) | 607 (20.9%) |
| $1,500 to $1,999 | 807 (11.7%) | 30 (1.0%) |
| $2,000 to $2,499 | 650 (9.4%) | 42 (1.5%) |
| $2,500 to $2,999 | 272 (4.0%) | 0 (0.0%) |
| $3,000 or more | 141 (2.1%) | 26 (0.9%) |
| Total | 6,890 (100.0%) | 2,899 (100.0%) |
Physical Housing Characteristics in Yankton County
Housing Structures in Yankton County
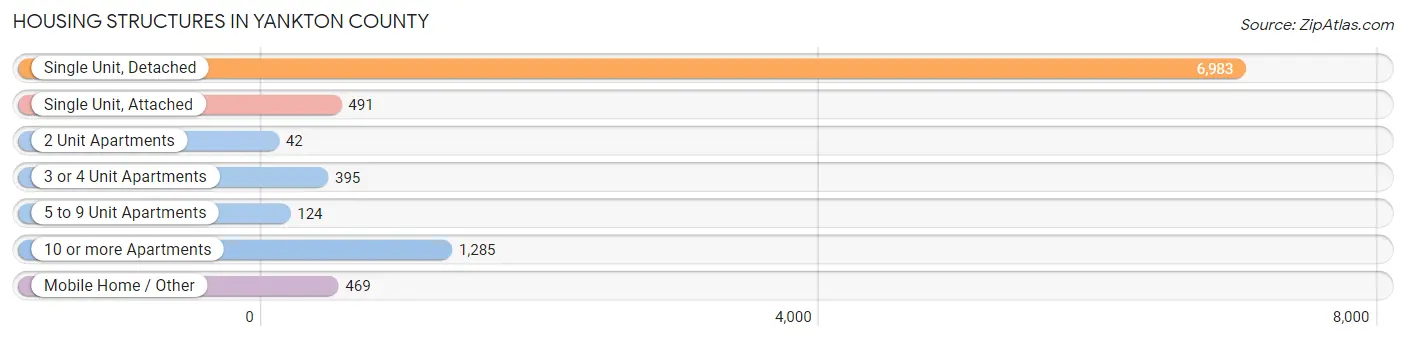
| Structure Type | # Housing Units | % Housing Units |
| Single Unit, Detached | 6,983 | 71.3% |
| Single Unit, Attached | 491 | 5.0% |
| 2 Unit Apartments | 42 | 0.4% |
| 3 or 4 Unit Apartments | 395 | 4.0% |
| 5 to 9 Unit Apartments | 124 | 1.3% |
| 10 or more Apartments | 1,285 | 13.1% |
| Mobile Home / Other | 469 | 4.8% |
| Total | 9,789 | 100.0% |
Housing Structures by Occupancy in Yankton County
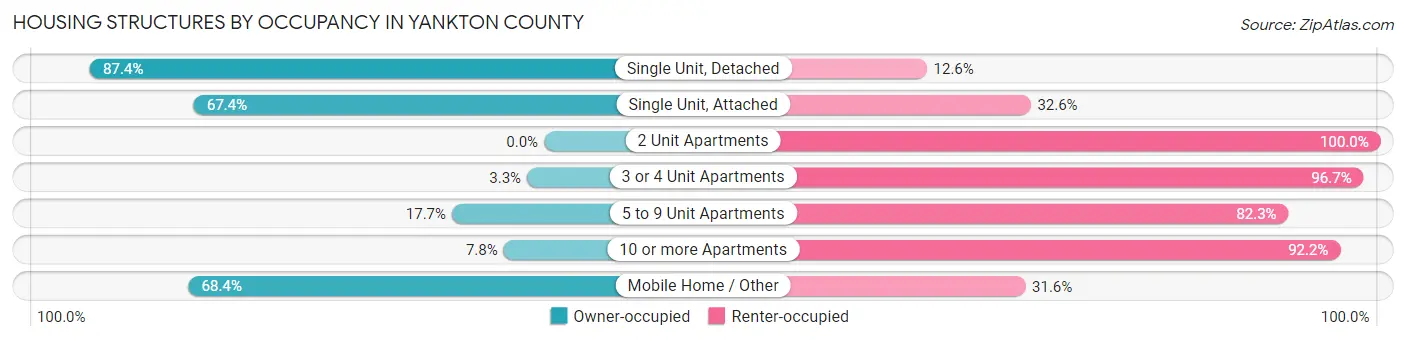
| Structure Type | Owner-occupied | Renter-occupied |
| Single Unit, Detached | 6,103 (87.4%) | 880 (12.6%) |
| Single Unit, Attached | 331 (67.4%) | 160 (32.6%) |
| 2 Unit Apartments | 0 (0.0%) | 42 (100.0%) |
| 3 or 4 Unit Apartments | 13 (3.3%) | 382 (96.7%) |
| 5 to 9 Unit Apartments | 22 (17.7%) | 102 (82.3%) |
| 10 or more Apartments | 100 (7.8%) | 1,185 (92.2%) |
| Mobile Home / Other | 321 (68.4%) | 148 (31.6%) |
| Total | 6,890 (70.4%) | 2,899 (29.6%) |
Housing Structures by Number of Rooms in Yankton County
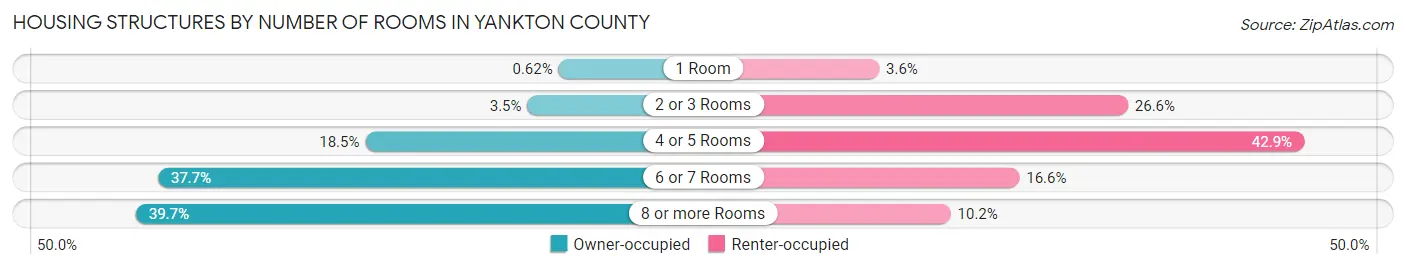
| Number of Rooms | Owner-occupied | Renter-occupied |
| 1 Room | 43 (0.6%) | 105 (3.6%) |
| 2 or 3 Rooms | 241 (3.5%) | 772 (26.6%) |
| 4 or 5 Rooms | 1,274 (18.5%) | 1,244 (42.9%) |
| 6 or 7 Rooms | 2,596 (37.7%) | 481 (16.6%) |
| 8 or more Rooms | 2,736 (39.7%) | 297 (10.2%) |
| Total | 6,890 (100.0%) | 2,899 (100.0%) |
Housing Structure by Heating Type in Yankton County
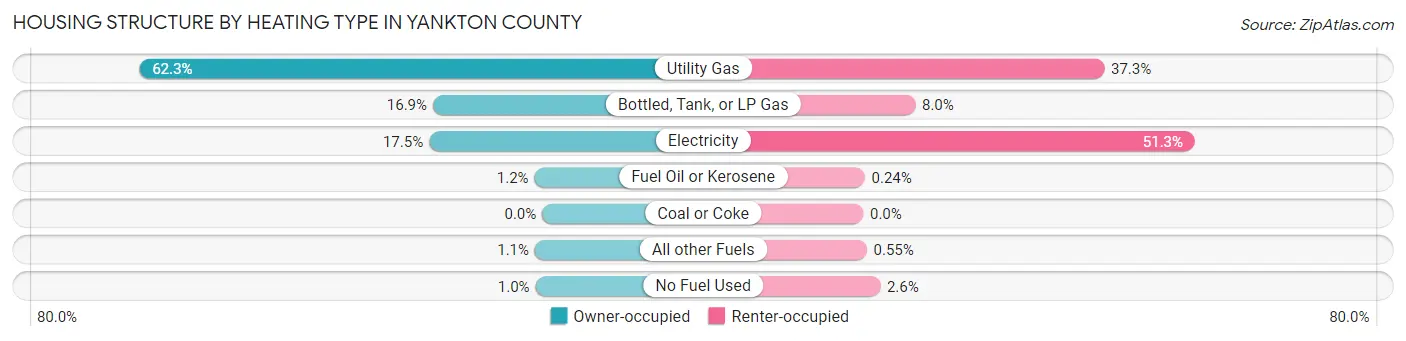
| Heating Type | Owner-occupied | Renter-occupied |
| Utility Gas | 4,291 (62.3%) | 1,080 (37.2%) |
| Bottled, Tank, or LP Gas | 1,164 (16.9%) | 233 (8.0%) |
| Electricity | 1,205 (17.5%) | 1,487 (51.3%) |
| Fuel Oil or Kerosene | 82 (1.2%) | 7 (0.2%) |
| Coal or Coke | 0 (0.0%) | 0 (0.0%) |
| All other Fuels | 77 (1.1%) | 16 (0.5%) |
| No Fuel Used | 71 (1.0%) | 76 (2.6%) |
| Total | 6,890 (100.0%) | 2,899 (100.0%) |
Household Vehicle Usage in Yankton County
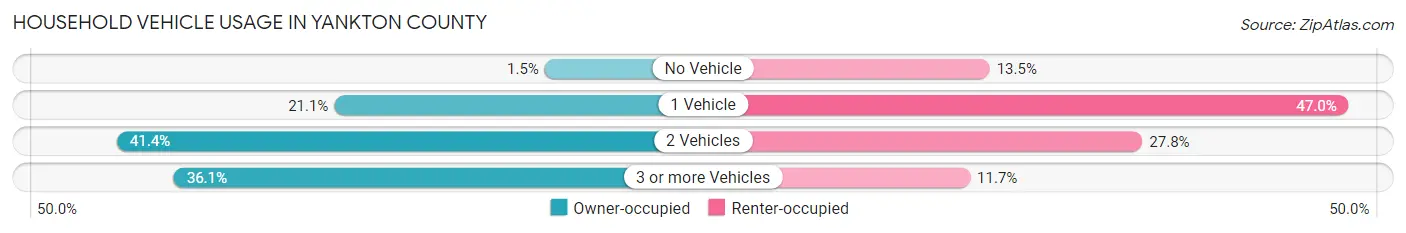
| Vehicles per Household | Owner-occupied | Renter-occupied |
| No Vehicle | 100 (1.5%) | 392 (13.5%) |
| 1 Vehicle | 1,454 (21.1%) | 1,363 (47.0%) |
| 2 Vehicles | 2,851 (41.4%) | 805 (27.8%) |
| 3 or more Vehicles | 2,485 (36.1%) | 339 (11.7%) |
| Total | 6,890 (100.0%) | 2,899 (100.0%) |
Real Estate & Mortgages in Yankton County
Real Estate and Mortgage Overview in Yankton County
| Characteristic | Without Mortgage | With Mortgage |
| Housing Units | 3,184 | 3,706 |
| Median Property Value | $178,600 | $200,400 |
| Median Household Income | $65,530 | $636 |
| Monthly Housing Costs | $523 | $141 |
| Real Estate Taxes | $1,966 | $53 |
Property Value by Mortgage Status in Yankton County
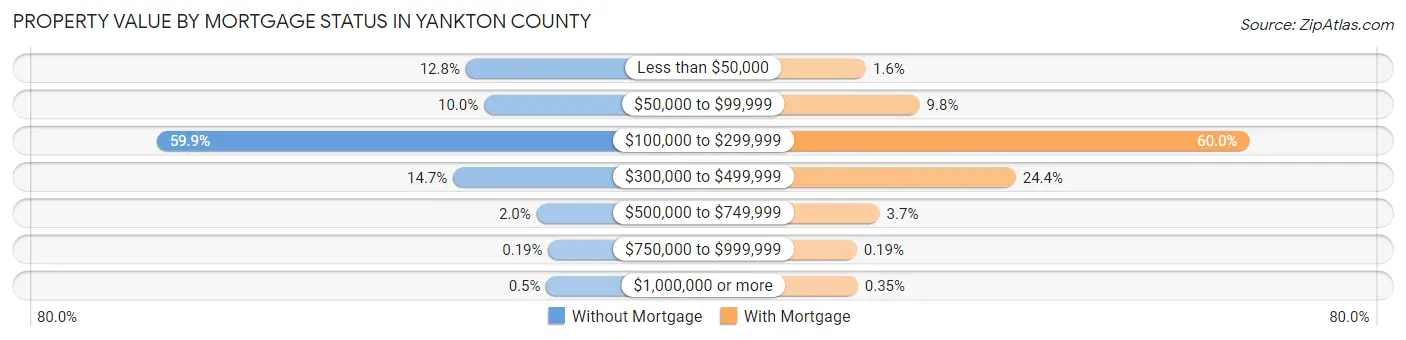
| Property Value | Without Mortgage | With Mortgage |
| Less than $50,000 | 407 (12.8%) | 59 (1.6%) |
| $50,000 to $99,999 | 318 (10.0%) | 362 (9.8%) |
| $100,000 to $299,999 | 1,906 (59.9%) | 2,224 (60.0%) |
| $300,000 to $499,999 | 468 (14.7%) | 905 (24.4%) |
| $500,000 to $749,999 | 63 (2.0%) | 136 (3.7%) |
| $750,000 to $999,999 | 6 (0.2%) | 7 (0.2%) |
| $1,000,000 or more | 16 (0.5%) | 13 (0.4%) |
| Total | 3,184 (100.0%) | 3,706 (100.0%) |
Household Income by Mortgage Status in Yankton County
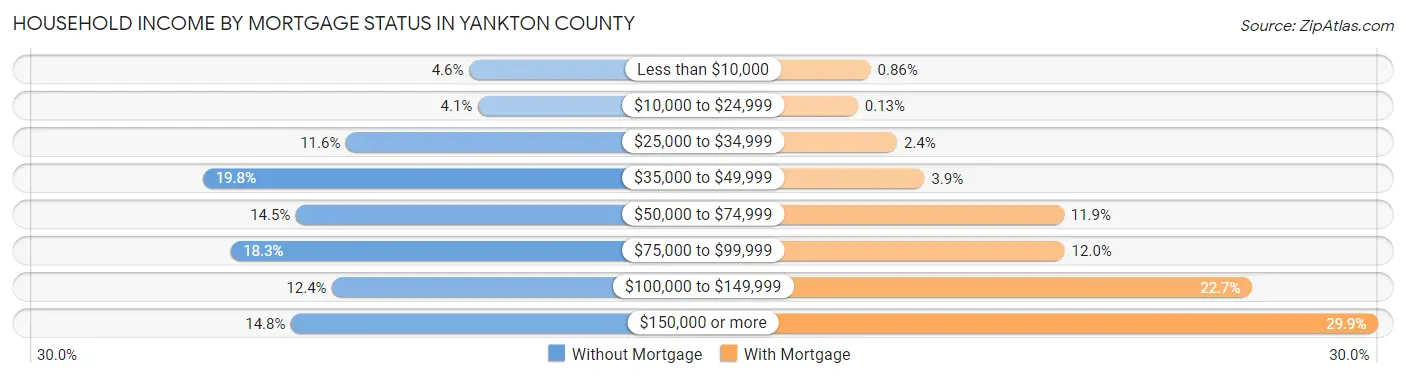
| Household Income | Without Mortgage | With Mortgage |
| Less than $10,000 | 146 (4.6%) | 32 (0.9%) |
| $10,000 to $24,999 | 130 (4.1%) | 5 (0.1%) |
| $25,000 to $34,999 | 370 (11.6%) | 88 (2.4%) |
| $35,000 to $49,999 | 631 (19.8%) | 146 (3.9%) |
| $50,000 to $74,999 | 461 (14.5%) | 441 (11.9%) |
| $75,000 to $99,999 | 581 (18.2%) | 443 (11.9%) |
| $100,000 to $149,999 | 395 (12.4%) | 840 (22.7%) |
| $150,000 or more | 470 (14.8%) | 1,107 (29.9%) |
| Total | 3,184 (100.0%) | 3,706 (100.0%) |
Property Value to Household Income Ratio in Yankton County
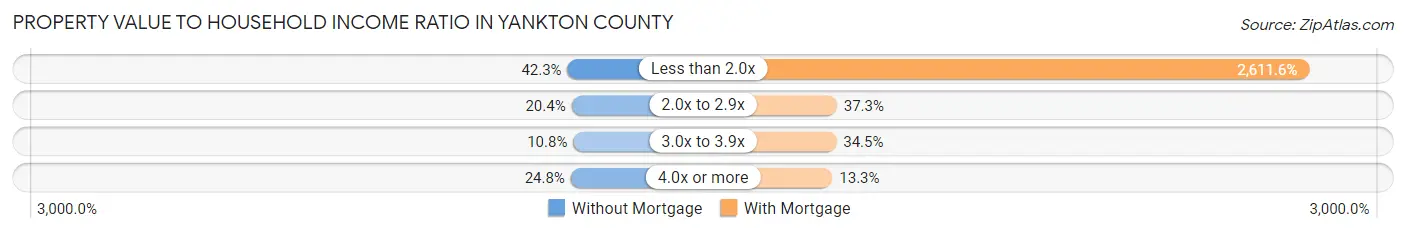
| Value-to-Income Ratio | Without Mortgage | With Mortgage |
| Less than 2.0x | 1,346 (42.3%) | 96,786 (2,611.6%) |
| 2.0x to 2.9x | 648 (20.3%) | 1,381 (37.3%) |
| 3.0x to 3.9x | 344 (10.8%) | 1,279 (34.5%) |
| 4.0x or more | 789 (24.8%) | 493 (13.3%) |
| Total | 3,184 (100.0%) | 3,706 (100.0%) |
Real Estate Taxes by Mortgage Status in Yankton County
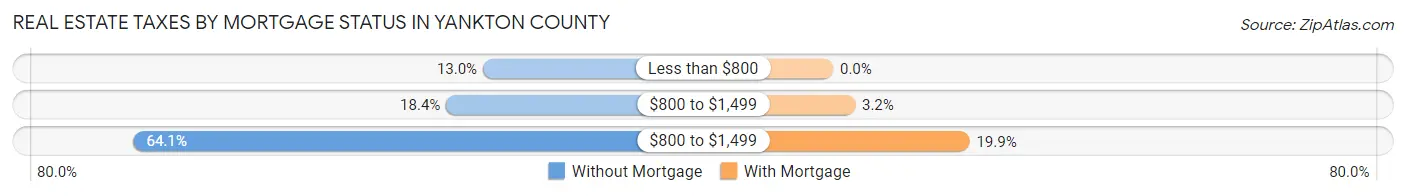
| Property Taxes | Without Mortgage | With Mortgage |
| Less than $800 | 415 (13.0%) | 0 (0.0%) |
| $800 to $1,499 | 586 (18.4%) | 119 (3.2%) |
| $800 to $1,499 | 2,040 (64.1%) | 739 (19.9%) |
| Total | 3,184 (100.0%) | 3,706 (100.0%) |
Health & Disability in Yankton County
Health Insurance Coverage by Age in Yankton County
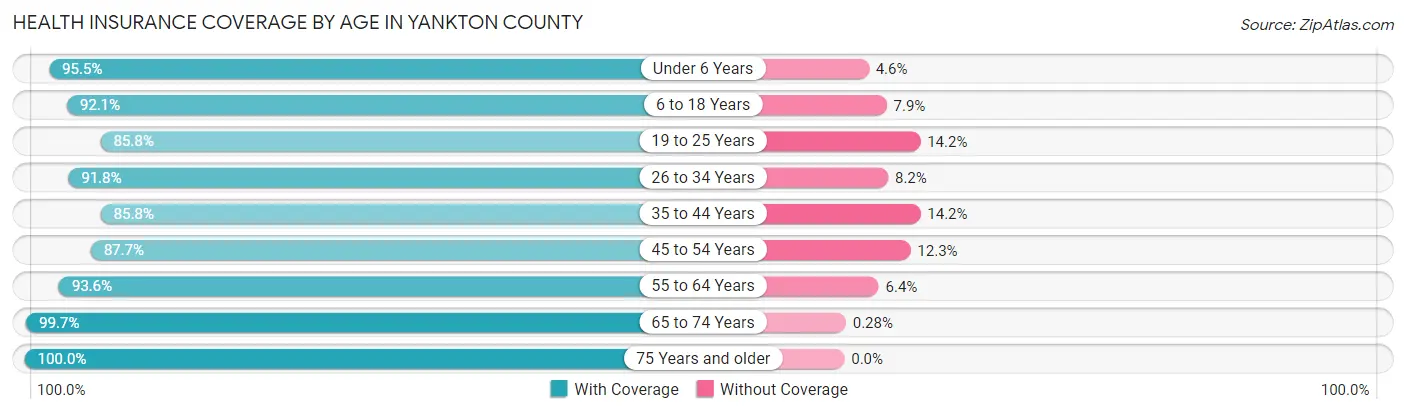
| Age Bracket | With Coverage | Without Coverage |
| Under 6 Years | 1,406 (95.5%) | 67 (4.5%) |
| 6 to 18 Years | 3,446 (92.1%) | 295 (7.9%) |
| 19 to 25 Years | 1,595 (85.8%) | 263 (14.2%) |
| 26 to 34 Years | 2,116 (91.8%) | 188 (8.2%) |
| 35 to 44 Years | 2,161 (85.8%) | 357 (14.2%) |
| 45 to 54 Years | 2,255 (87.7%) | 317 (12.3%) |
| 55 to 64 Years | 2,960 (93.6%) | 202 (6.4%) |
| 65 to 74 Years | 2,523 (99.7%) | 7 (0.3%) |
| 75 Years and older | 1,793 (100.0%) | 0 (0.0%) |
| Total | 20,255 (92.3%) | 1,696 (7.7%) |
Health Insurance Coverage by Citizenship Status in Yankton County
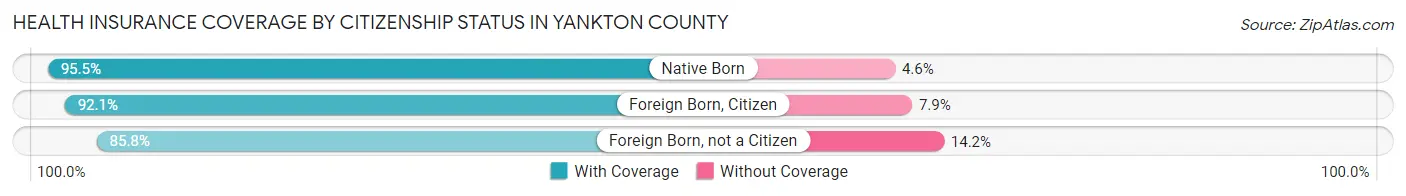
| Citizenship Status | With Coverage | Without Coverage |
| Native Born | 1,406 (95.5%) | 67 (4.5%) |
| Foreign Born, Citizen | 3,446 (92.1%) | 295 (7.9%) |
| Foreign Born, not a Citizen | 1,595 (85.8%) | 263 (14.2%) |
Health Insurance Coverage by Household Income in Yankton County
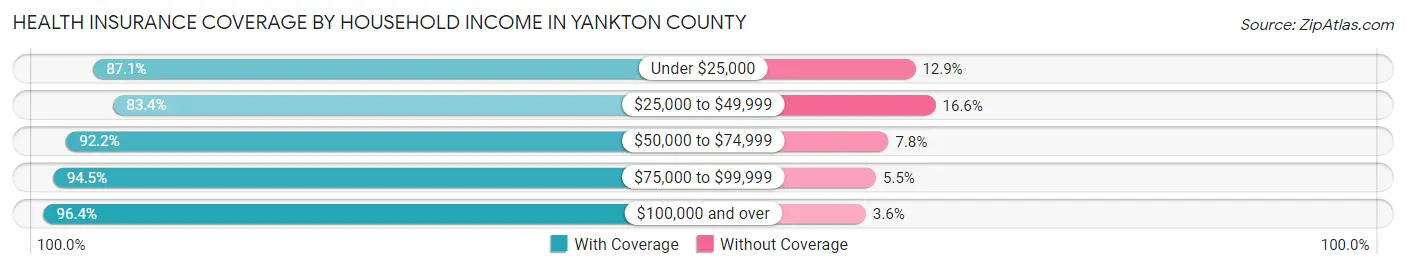
| Household Income | With Coverage | Without Coverage |
| Under $25,000 | 1,335 (87.1%) | 197 (12.9%) |
| $25,000 to $49,999 | 3,206 (83.4%) | 640 (16.6%) |
| $50,000 to $74,999 | 3,382 (92.2%) | 287 (7.8%) |
| $75,000 to $99,999 | 3,838 (94.5%) | 223 (5.5%) |
| $100,000 and over | 8,042 (96.4%) | 299 (3.6%) |
Public vs Private Health Insurance Coverage by Age in Yankton County
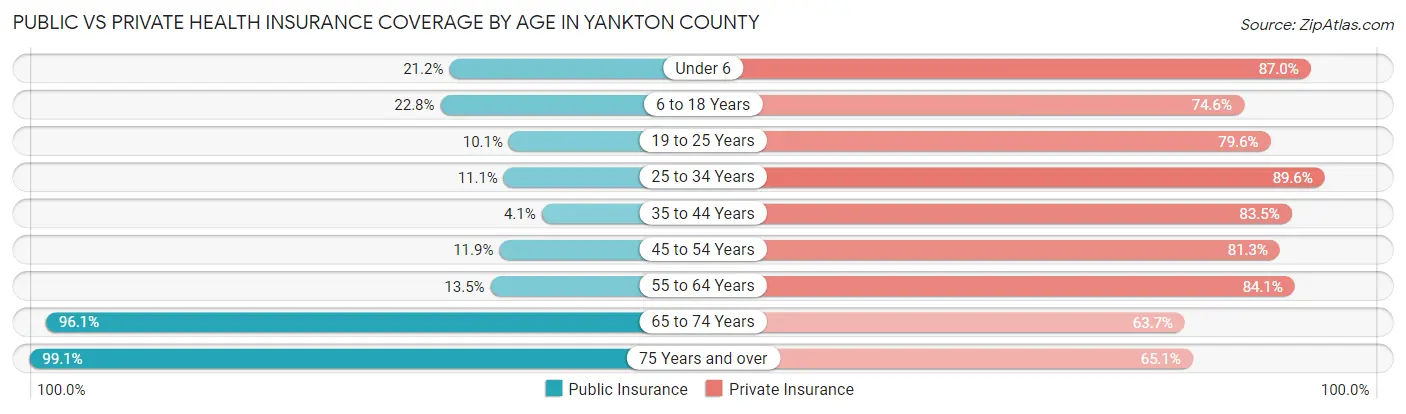
| Age Bracket | Public Insurance | Private Insurance |
| Under 6 | 312 (21.2%) | 1,282 (87.0%) |
| 6 to 18 Years | 854 (22.8%) | 2,791 (74.6%) |
| 19 to 25 Years | 188 (10.1%) | 1,478 (79.5%) |
| 25 to 34 Years | 255 (11.1%) | 2,065 (89.6%) |
| 35 to 44 Years | 102 (4.1%) | 2,102 (83.5%) |
| 45 to 54 Years | 306 (11.9%) | 2,091 (81.3%) |
| 55 to 64 Years | 428 (13.5%) | 2,658 (84.1%) |
| 65 to 74 Years | 2,430 (96.1%) | 1,611 (63.7%) |
| 75 Years and over | 1,777 (99.1%) | 1,168 (65.1%) |
| Total | 6,652 (30.3%) | 17,246 (78.6%) |
Disability Status by Sex by Age in Yankton County
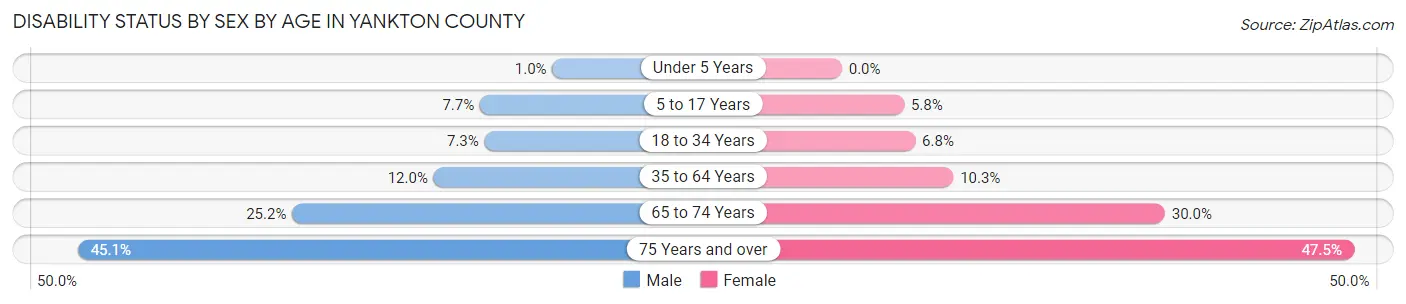
| Age Bracket | Male | Female |
| Under 5 Years | 7 (1.0%) | 0 (0.0%) |
| 5 to 17 Years | 145 (7.7%) | 103 (5.8%) |
| 18 to 34 Years | 176 (7.3%) | 138 (6.8%) |
| 35 to 64 Years | 495 (12.0%) | 428 (10.3%) |
| 65 to 74 Years | 311 (25.2%) | 388 (30.0%) |
| 75 Years and over | 329 (45.1%) | 505 (47.5%) |
Disability Class by Sex by Age in Yankton County
Disability Class: Hearing Difficulty
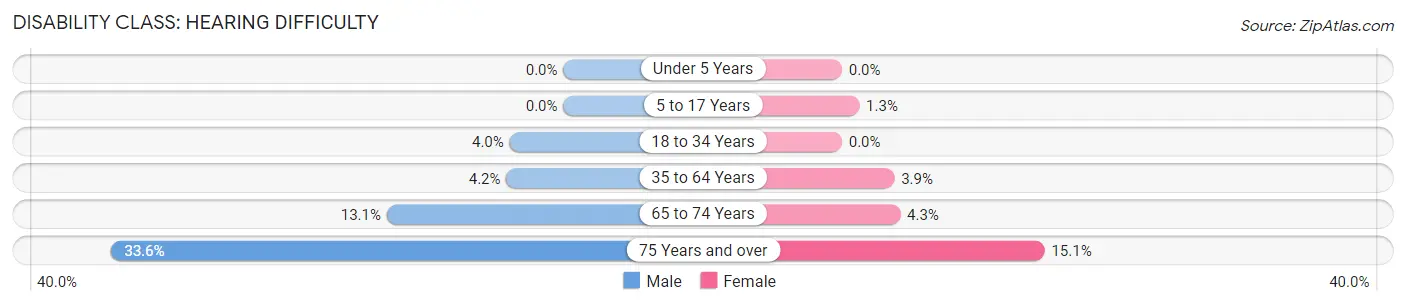
| Age Bracket | Male | Female |
| Under 5 Years | 0 (0.0%) | 0 (0.0%) |
| 5 to 17 Years | 0 (0.0%) | 23 (1.3%) |
| 18 to 34 Years | 96 (4.0%) | 0 (0.0%) |
| 35 to 64 Years | 174 (4.2%) | 161 (3.9%) |
| 65 to 74 Years | 162 (13.1%) | 56 (4.3%) |
| 75 Years and over | 245 (33.6%) | 160 (15.0%) |
Disability Class: Vision Difficulty
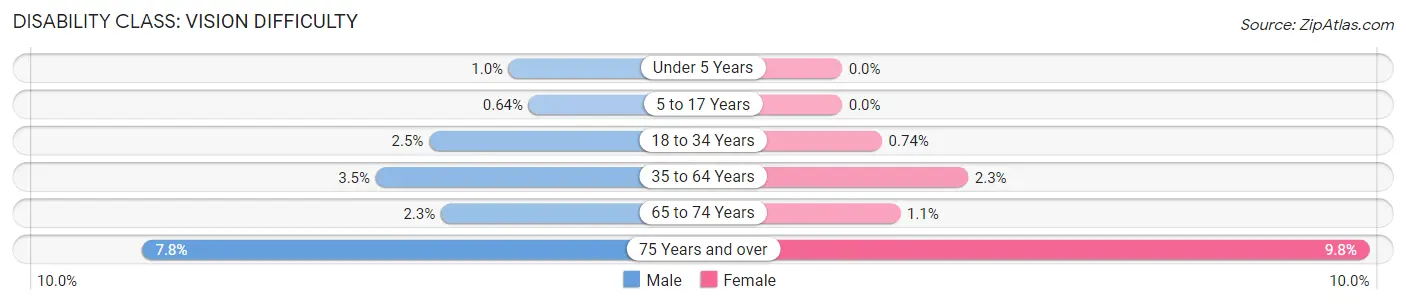
| Age Bracket | Male | Female |
| Under 5 Years | 7 (1.0%) | 0 (0.0%) |
| 5 to 17 Years | 12 (0.6%) | 0 (0.0%) |
| 18 to 34 Years | 60 (2.5%) | 15 (0.7%) |
| 35 to 64 Years | 143 (3.5%) | 97 (2.3%) |
| 65 to 74 Years | 28 (2.3%) | 14 (1.1%) |
| 75 Years and over | 57 (7.8%) | 104 (9.8%) |
Disability Class: Cognitive Difficulty
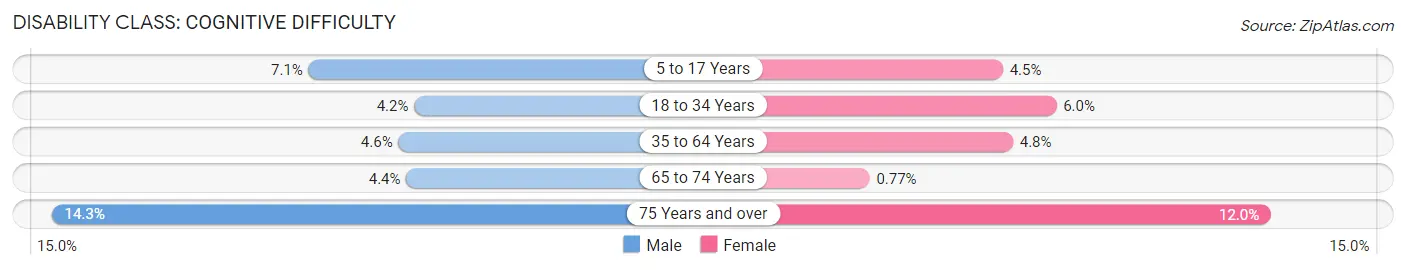
| Age Bracket | Male | Female |
| 5 to 17 Years | 133 (7.1%) | 80 (4.5%) |
| 18 to 34 Years | 100 (4.2%) | 121 (6.0%) |
| 35 to 64 Years | 189 (4.6%) | 197 (4.8%) |
| 65 to 74 Years | 54 (4.4%) | 10 (0.8%) |
| 75 Years and over | 104 (14.2%) | 127 (11.9%) |
Disability Class: Ambulatory Difficulty
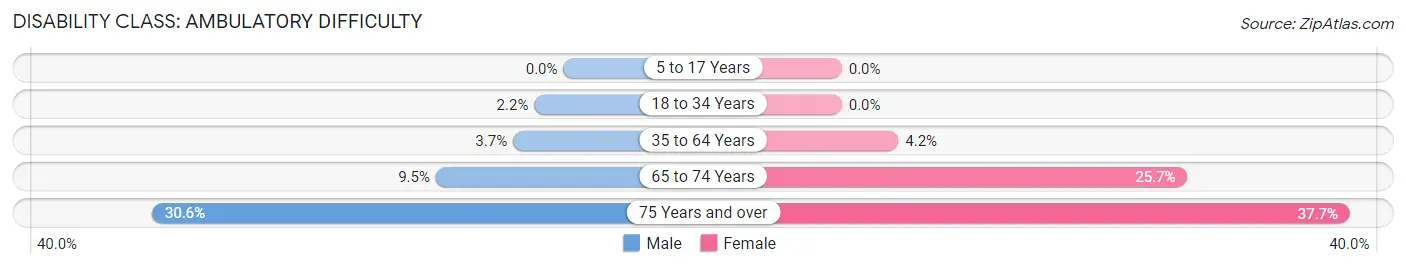
| Age Bracket | Male | Female |
| 5 to 17 Years | 0 (0.0%) | 0 (0.0%) |
| 18 to 34 Years | 52 (2.2%) | 0 (0.0%) |
| 35 to 64 Years | 154 (3.7%) | 174 (4.2%) |
| 65 to 74 Years | 117 (9.5%) | 332 (25.7%) |
| 75 Years and over | 223 (30.5%) | 401 (37.7%) |
Disability Class: Self-Care Difficulty
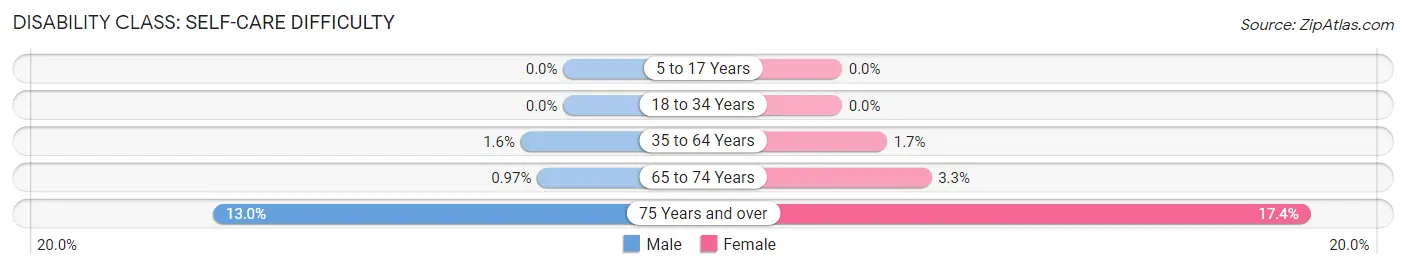
| Age Bracket | Male | Female |
| 5 to 17 Years | 0 (0.0%) | 0 (0.0%) |
| 18 to 34 Years | 0 (0.0%) | 0 (0.0%) |
| 35 to 64 Years | 65 (1.6%) | 69 (1.7%) |
| 65 to 74 Years | 12 (1.0%) | 43 (3.3%) |
| 75 Years and over | 95 (13.0%) | 185 (17.4%) |
Technology Access in Yankton County
Computing Device Access in Yankton County
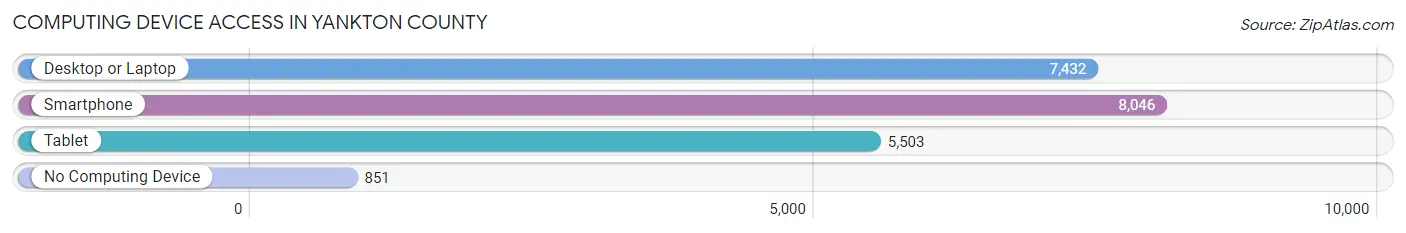
| Device Type | # Households | % Households |
| Desktop or Laptop | 7,432 | 75.9% |
| Smartphone | 8,046 | 82.2% |
| Tablet | 5,503 | 56.2% |
| No Computing Device | 851 | 8.7% |
| Total | 9,789 | 100.0% |
Internet Access in Yankton County
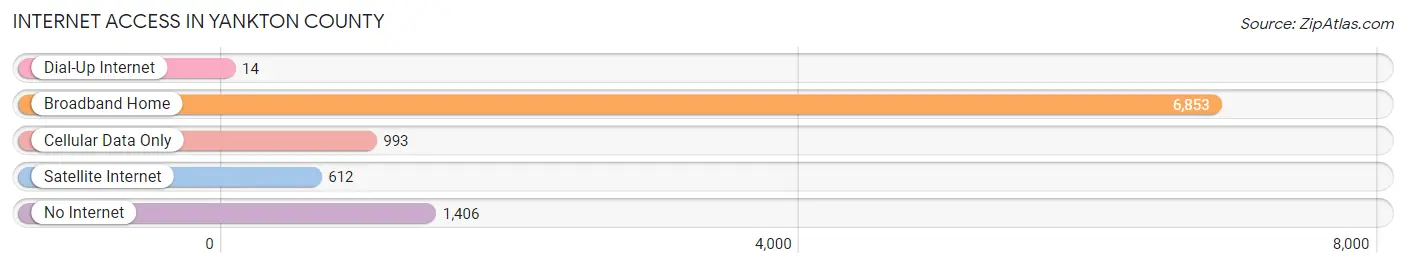
| Internet Type | # Households | % Households |
| Dial-Up Internet | 14 | 0.1% |
| Broadband Home | 6,853 | 70.0% |
| Cellular Data Only | 993 | 10.1% |
| Satellite Internet | 612 | 6.2% |
| No Internet | 1,406 | 14.4% |
| Total | 9,789 | 100.0% |
Yankton County Summary
Yankton County is located in the southeastern corner of South Dakota, along the Missouri River. It is bordered by Clay County to the north, Union County to the east, Bon Homme County to the south, and Charles Mix County to the west. The county seat is Yankton, the state's fourth-largest city. Yankton County is part of the Yankton, SD Micropolitan Statistical Area.
History
Yankton County was established in 1862, when the Dakota Territory was created. It was named after the Yankton Sioux tribe, who had inhabited the area for centuries. The county was originally part of the Dakota Territory, but became part of South Dakota when it was admitted to the Union in 1889.
The county was home to several Native American tribes, including the Yankton Sioux, Omaha, Ponca, and Santee Sioux. The first white settlers arrived in the area in the early 1800s, and the county was officially organized in 1862.
The county was home to several important historical events, including the signing of the Treaty of Fort Laramie in 1868, which established the Great Sioux Reservation. The treaty was signed by the Yankton Sioux, as well as the Oglala, Brule, Miniconjou, and Hunkpapa Sioux.
The county was also home to the Yankton Indian Agency, which was established in 1871. The agency was responsible for managing the affairs of the Yankton Sioux, as well as other Native American tribes in the area.
Geography
Yankton County covers an area of 1,072 square miles, making it the fourth-largest county in South Dakota. The county is located in the southeastern corner of the state, along the Missouri River. It is bordered by Clay County to the north, Union County to the east, Bon Homme County to the south, and Charles Mix County to the west.
The county is mostly flat, with rolling hills in the western part of the county. The eastern part of the county is mostly prairie, while the western part is more heavily forested. The county is home to several lakes, including Lake Yankton, Lake Francis Case, and Lake Andes.
Economy
Yankton County has a diverse economy, with a mix of agriculture, manufacturing, and services. The county is home to several large employers, including the Yankton Medical Center, Yankton School District, and Yankton County Government.
Agriculture is a major part of the county's economy, with corn, soybeans, and wheat being the main crops. Livestock production is also important, with cattle, hogs, and sheep being raised in the county.
Manufacturing is also an important part of the county's economy, with several companies producing a variety of products, including furniture, plastics, and food products.
Demographics
As of the 2010 census, Yankton County had a population of 22,442. The population was spread out, with 49.3% male and 50.7% female. The median age was 40.7 years.
The racial makeup of the county was 94.2% White, 0.7% African American, 0.5% Native American, 0.5% Asian, 0.1% Pacific Islander, 2.7% from other races, and 1.4% from two or more races. Hispanic or Latino of any race were 4.2% of the population.
The median household income was $48,945, and the median family income was $58,945. The per capita income was $24,945. About 8.2% of families and 11.2% of the population were below the poverty line.
Common Questions
What is the Total Population of Yankton County?
Total Population of Yankton County is 23,311.
What is the Total Male Population of Yankton County?
Total Male Population of Yankton County is 12,132.
What is the Total Female Population of Yankton County?
Total Female Population of Yankton County is 11,179.
What is the Ratio of Males per 100 Females in Yankton County?
There are 108.52 Males per 100 Females in Yankton County.
What is the Ratio of Females per 100 Males in Yankton County?
There are 92.14 Females per 100 Males in Yankton County.
What is the Median Population Age in Yankton County?
Median Population Age in Yankton County is 41.7 Years.
What is the Average Family Size in Yankton County
Average Family Size in Yankton County is 2.8 People.
What is the Average Household Size in Yankton County
Average Household Size in Yankton County is 2.2 People.
What is Per Capita Income in Yankton County?
Per Capita income in Yankton County is $37,202.
What is the Median Family Income in Yankton County?
Median Family Income in Yankton County is $90,804.
What is the Median Household income in Yankton County?
Median Household Income in Yankton County is $68,847.
What is Income or Wage Gap in Yankton County?
Income or Wage Gap in Yankton County is 21.6%.
Women in Yankton County earn 78.4 cents for every dollar earned by a man.
What is Family Income Deficit in Yankton County?
Family Income Deficit in Yankton County is $14,054.
Families that are below poverty line in Yankton County earn $14,054 less on average than the poverty threshold level.
What is Inequality or Gini Index in Yankton County?
Inequality or Gini Index in Yankton County is 0.43.
How Large is the Labor Force in Yankton County?
There are 12,093 People in the Labor Forcein in Yankton County.
What is the Percentage of People in the Labor Force in Yankton County?
63.8% of People are in the Labor Force in Yankton County.
What is the Unemployment Rate in Yankton County?
Unemployment Rate in Yankton County is 1.6%.