Walworth County, SD
Walworth County Map

Walworth County Overview
5,317
TOTAL POPULATION
2,675
MALE POPULATION
2,642
FEMALE POPULATION
101.25
MALES / 100 FEMALES
98.77
FEMALES / 100 MALES
40.9
MEDIAN AGE
2.6
AVG FAMILY SIZE
2.1
AVG HOUSEHOLD SIZE
$35,602
PER CAPITA INCOME
$75,985
AVG FAMILY INCOME
$57,697
AVG HOUSEHOLD INCOME
21.5%
WAGE / INCOME GAP [ % ]
78.5¢/ $1
WAGE / INCOME GAP [ $ ]
$11,417
FAMILY INCOME DEFICIT
0.43
INEQUALITY / GINI INDEX
2,673
LABOR FORCE [ PEOPLE ]
63.4%
PERCENT IN LABOR FORCE
3.6%
UNEMPLOYMENT RATE
Walworth County Area Codes
Race in Walworth County
The most populous races in Walworth County are White / Caucasian (4,258 | 80.1%), Native / Alaskan (542 | 10.2%), and Two or more Races (364 | 6.9%).

| Race | # Population | % Population |
| Asian | 7 | 0.1% |
| Black / African American | 116 | 2.2% |
| Hawaiian / Pacific | 0 | 0.0% |
| Hispanic or Latino | 109 | 2.1% |
| Native / Alaskan | 542 | 10.2% |
| White / Caucasian | 4,258 | 80.1% |
| Two or more Races | 364 | 6.9% |
| Some other Race | 30 | 0.6% |
| Total | 5,317 | 100.0% |
Ancestry in Walworth County
The most populous ancestries reported in Walworth County are German (2,724 | 51.2%), Norwegian (570 | 10.7%), Sioux (411 | 7.7%), Irish (304 | 5.7%), and American (237 | 4.5%), together accounting for 79.9% of all Walworth County residents.

| Ancestry | # Population | % Population |
| American | 237 | 4.5% |
| Armenian | 4 | 0.1% |
| Belgian | 2 | 0.0% |
| Central American | 40 | 0.7% |
| Cheyenne | 103 | 1.9% |
| Cree | 8 | 0.2% |
| Croatian | 4 | 0.1% |
| Czech | 58 | 1.1% |
| Czechoslovakian | 5 | 0.1% |
| Danish | 123 | 2.3% |
| Dutch | 183 | 3.4% |
| English | 237 | 4.5% |
| European | 9 | 0.2% |
| Finnish | 16 | 0.3% |
| French | 103 | 1.9% |
| French Canadian | 12 | 0.2% |
| German | 2,724 | 51.2% |
| German Russian | 3 | 0.1% |
| Honduran | 14 | 0.3% |
| Hungarian | 23 | 0.4% |
| Icelander | 28 | 0.5% |
| Indian (Asian) | 7 | 0.1% |
| Irish | 304 | 5.7% |
| Italian | 117 | 2.2% |
| Mexican | 25 | 0.5% |
| Nicaraguan | 26 | 0.5% |
| Northern European | 4 | 0.1% |
| Norwegian | 570 | 10.7% |
| Polish | 62 | 1.2% |
| Puerto Rican | 29 | 0.5% |
| Russian | 173 | 3.3% |
| Scotch-Irish | 28 | 0.5% |
| Scottish | 121 | 2.3% |
| Sioux | 411 | 7.7% |
| Slovak | 2 | 0.0% |
| Spaniard | 15 | 0.3% |
| Swedish | 214 | 4.0% |
| Swiss | 36 | 0.7% |
| Ukrainian | 10 | 0.2% |
| Welsh | 25 | 0.5% | View All 40 Rows |
Immigrants in Walworth County
The most numerous immigrant groups reported in Walworth County came from Central America (26 | 0.5%), Latin America (26 | 0.5%), Europe (25 | 0.5%), Nicaragua (23 | 0.4%), and Southern Europe (15 | 0.3%), together accounting for 2.2% of all Walworth County residents.

| Immigration Origin | # Population | % Population |
| Africa | 2 | 0.0% |
| Asia | 7 | 0.1% |
| Central America | 26 | 0.5% |
| China | 7 | 0.1% |
| Eastern Asia | 7 | 0.1% |
| Europe | 25 | 0.5% |
| Germany | 10 | 0.2% |
| Honduras | 3 | 0.1% |
| Latin America | 26 | 0.5% |
| Nicaragua | 23 | 0.4% |
| South Africa | 2 | 0.0% |
| Southern Europe | 15 | 0.3% |
| Spain | 15 | 0.3% |
| Western Europe | 10 | 0.2% | View All 14 Rows |
Sex and Age in Walworth County
Sex and Age in Walworth County
The most populous age groups in Walworth County are 35 to 39 Years (329 | 12.3%) for men and 60 to 64 Years (287 | 10.9%) for women.

| Age Bracket | Male | Female |
| Under 5 Years | 173 (6.5%) | 188 (7.1%) |
| 5 to 9 Years | 190 (7.1%) | 231 (8.7%) |
| 10 to 14 Years | 162 (6.1%) | 121 (4.6%) |
| 15 to 19 Years | 115 (4.3%) | 101 (3.8%) |
| 20 to 24 Years | 141 (5.3%) | 127 (4.8%) |
| 25 to 29 Years | 97 (3.6%) | 103 (3.9%) |
| 30 to 34 Years | 184 (6.9%) | 223 (8.4%) |
| 35 to 39 Years | 329 (12.3%) | 134 (5.1%) |
| 40 to 44 Years | 81 (3.0%) | 213 (8.1%) |
| 45 to 49 Years | 184 (6.9%) | 60 (2.3%) |
| 50 to 54 Years | 34 (1.3%) | 105 (4.0%) |
| 55 to 59 Years | 242 (9.0%) | 106 (4.0%) |
| 60 to 64 Years | 163 (6.1%) | 287 (10.9%) |
| 65 to 69 Years | 204 (7.6%) | 216 (8.2%) |
| 70 to 74 Years | 141 (5.3%) | 117 (4.4%) |
| 75 to 79 Years | 146 (5.5%) | 145 (5.5%) |
| 80 to 84 Years | 43 (1.6%) | 65 (2.5%) |
| 85 Years and over | 46 (1.7%) | 100 (3.8%) |
| Total | 2,675 (100.0%) | 2,642 (100.0%) |
Families and Households in Walworth County
Median Family Size in Walworth County
The median family size in Walworth County is 2.61 persons per family, with married-couple families (1,222 | 77.3%) accounting for the largest median family size of 2.75 persons per family. On the other hand, single male/father families (143 | 9.0%) represent the smallest median family size with 1.95 persons per family.

| Family Type | # Families | Family Size |
| Married-Couple | 1,222 (77.3%) | 2.75 |
| Single Male/Father | 143 (9.0%) | 1.95 |
| Single Female/Mother | 215 (13.6%) | 2.23 |
| Total Families | 1,580 (100.0%) | 2.61 |
Median Household Size in Walworth County
The median household size in Walworth County is 2.13 persons per household, with married-couple households (1,222 | 51.3%) accounting for the largest median household size of 2.77 persons per household. non-family households (800 | 33.6%) represent the smallest median household size with 1.07 persons per household.

| Household Type | # Households | Household Size |
| Married-Couple | 1,222 (51.3%) | 2.77 |
| Single Male/Father | 143 (6.0%) | 2.04 |
| Single Female/Mother | 215 (9.0%) | 2.47 |
| Non-family | 800 (33.6%) | 1.07 |
| Total Households | 2,380 (100.0%) | 2.13 |
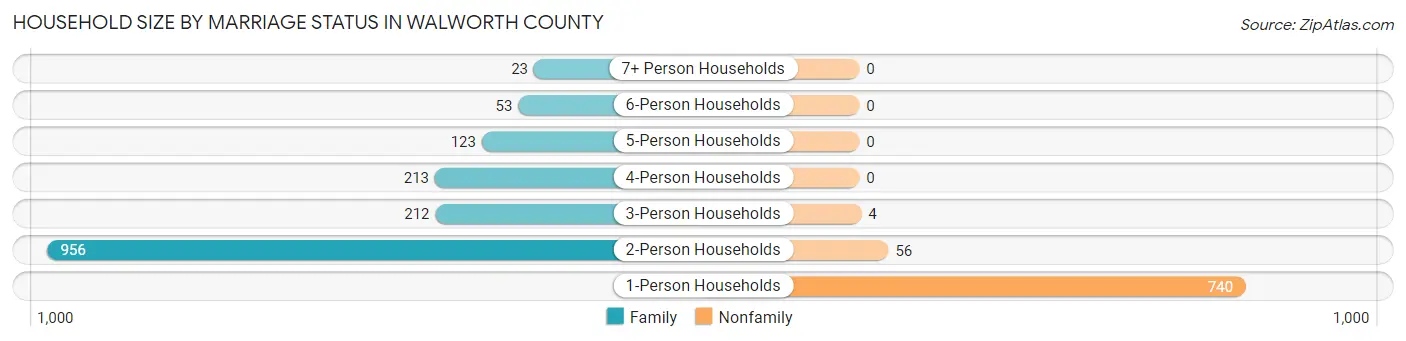
Household Size by Marriage Status in Walworth County
Out of a total of 2,380 households in Walworth County, 1,580 (66.4%) are family households, while 800 (33.6%) are nonfamily households. The most numerous type of family households are 2-person households, comprising 956, and the most common type of nonfamily households are 1-person households, comprising 740.
| Household Size | Family Households | Nonfamily Households |
| 1-Person Households | - | 740 (31.1%) |
| 2-Person Households | 956 (40.2%) | 56 (2.4%) |
| 3-Person Households | 212 (8.9%) | 4 (0.2%) |
| 4-Person Households | 213 (8.9%) | 0 (0.0%) |
| 5-Person Households | 123 (5.2%) | 0 (0.0%) |
| 6-Person Households | 53 (2.2%) | 0 (0.0%) |
| 7+ Person Households | 23 (1.0%) | 0 (0.0%) |
| Total | 1,580 (66.4%) | 800 (33.6%) |
Female Fertility in Walworth County
Fertility by Age in Walworth County
Average fertility rate in Walworth County is 142.0 births per 1,000 women. Women in the age bracket of 20 to 34 years have the highest fertility rate with 258.0 births per 1,000 women. Women in the age bracket of 20 to 34 years acount for 84.8% of all women with births.

| Age Bracket | Women with Births | Births / 1,000 Women |
| 15 to 19 years | 0 (0.0%) | 0.0 |
| 20 to 34 years | 117 (84.8%) | 258.0 |
| 35 to 50 years | 21 (15.2%) | 50.0 |
| Total | 138 (100.0%) | 142.0 |
Fertility by Age by Marriage Status in Walworth County
97.8% of women with births (138) in Walworth County are married. The highest percentage of unmarried women with births falls into 20 to 34 years age bracket with 2.6% of them unmarried at the time of birth, while the lowest percentage of unmarried women with births belong to 35 to 50 years age bracket with 0.0% of them unmarried.

| Age Bracket | Married | Unmarried |
| 15 to 19 years | 0 (0.0%) | 0 (0.0%) |
| 20 to 34 years | 114 (97.4%) | 3 (2.6%) |
| 35 to 50 years | 21 (100.0%) | 0 (0.0%) |
| Total | 135 (97.8%) | 3 (2.2%) |
Fertility by Education in Walworth County

| Educational Attainment | Women with Births | Births / 1,000 Women |
| Less than High School | 0 (0.0%) | 0.0 |
| High School Diploma | 27 (19.6%) | 108.0 |
| College or Associate's Degree | 77 (55.8%) | 234.0 |
| Bachelor's Degree | 33 (23.9%) | 174.0 |
| Graduate Degree | 1 (0.7%) | 13.0 |
| Total | 138 (100.0%) | 142.0 |
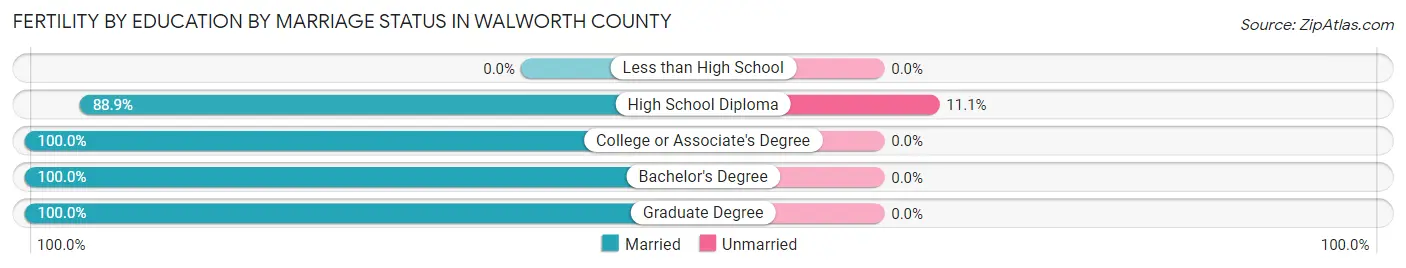
Fertility by Education by Marriage Status in Walworth County
2.2% of women with births in Walworth County are unmarried. Women with the educational attainment of college or associate's degree are most likely to be married with 100.0% of them married at childbirth, while women with the educational attainment of high school diploma are least likely to be married with 11.1% of them unmarried at childbirth.
| Educational Attainment | Married | Unmarried |
| Less than High School | 0 (0.0%) | 0 (0.0%) |
| High School Diploma | 24 (88.9%) | 3 (11.1%) |
| College or Associate's Degree | 77 (100.0%) | 0 (0.0%) |
| Bachelor's Degree | 33 (100.0%) | 0 (0.0%) |
| Graduate Degree | 1 (100.0%) | 0 (0.0%) |
| Total | 135 (97.8%) | 3 (2.2%) |
Income in Walworth County
Income Overview in Walworth County
Per Capita Income in Walworth County is $35,602, while median incomes of families and households are $75,985 and $57,697 respectively.
| Characteristic | Number | Measure |
| Per Capita Income | 5,317 | $35,602 |
| Median Family Income | 1,580 | $75,985 |
| Mean Family Income | 1,580 | $94,451 |
| Median Household Income | 2,380 | $57,697 |
| Mean Household Income | 2,380 | $80,047 |
| Income Deficit | 1,580 | $11,417 |
| Wage / Income Gap (%) | 5,317 | 21.53% |
| Wage / Income Gap ($) | 5,317 | 78.47¢ per $1 |
| Gini / Inequality Index | 5,317 | 0.43 |
Earnings by Sex in Walworth County
Average Earnings in Walworth County are $40,135, $47,643 for men and $37,386 for women, a difference of 21.5%.

| Sex | Number | Average Earnings |
| Male | 1,701 (59.0%) | $47,643 |
| Female | 1,181 (41.0%) | $37,386 |
| Total | 2,882 (100.0%) | $40,135 |
Earnings by Sex by Income Bracket in Walworth County
The most common earnings brackets in Walworth County are $55,000 to $64,999 for men (243 | 14.3%) and $35,000 to $39,999 for women (185 | 15.7%).

| Income | Male | Female |
| $2,499 or less | 101 (5.9%) | 56 (4.7%) |
| $2,500 to $4,999 | 73 (4.3%) | 17 (1.4%) |
| $5,000 to $7,499 | 54 (3.2%) | 62 (5.2%) |
| $7,500 to $9,999 | 33 (1.9%) | 48 (4.1%) |
| $10,000 to $12,499 | 35 (2.1%) | 31 (2.6%) |
| $12,500 to $14,999 | 26 (1.5%) | 0 (0.0%) |
| $15,000 to $17,499 | 22 (1.3%) | 12 (1.0%) |
| $17,500 to $19,999 | 64 (3.8%) | 42 (3.6%) |
| $20,000 to $22,499 | 46 (2.7%) | 59 (5.0%) |
| $22,500 to $24,999 | 41 (2.4%) | 31 (2.6%) |
| $25,000 to $29,999 | 116 (6.8%) | 146 (12.4%) |
| $30,000 to $34,999 | 38 (2.2%) | 55 (4.7%) |
| $35,000 to $39,999 | 42 (2.5%) | 185 (15.7%) |
| $40,000 to $44,999 | 106 (6.2%) | 57 (4.8%) |
| $45,000 to $49,999 | 111 (6.5%) | 65 (5.5%) |
| $50,000 to $54,999 | 27 (1.6%) | 40 (3.4%) |
| $55,000 to $64,999 | 243 (14.3%) | 146 (12.4%) |
| $65,000 to $74,999 | 203 (11.9%) | 25 (2.1%) |
| $75,000 to $99,999 | 131 (7.7%) | 12 (1.0%) |
| $100,000+ | 189 (11.1%) | 92 (7.8%) |
| Total | 1,701 (100.0%) | 1,181 (100.0%) |
Earnings by Sex by Educational Attainment in Walworth County
Average earnings in Walworth County are $57,019 for men and $37,862 for women, a difference of 33.6%. Men with an educational attainment of graduate degree enjoy the highest average annual earnings of $66,493, while those with high school diploma education earn the least with $40,434. Women with an educational attainment of bachelor's degree earn the most with the average annual earnings of $53,426, while those with high school diploma education have the smallest earnings of $28,141.

| Educational Attainment | Male Income | Female Income |
| Less than High School | $47,736 | $0 |
| High School Diploma | $40,434 | $28,141 |
| College or Associate's Degree | $58,929 | $37,799 |
| Bachelor's Degree | $63,750 | $53,426 |
| Graduate Degree | $66,493 | $0 |
| Total | $57,019 | $37,862 |
Family Income in Walworth County
Family Income Brackets in Walworth County
According to the Walworth County family income data, there are 329 families falling into the $100,000 to $149,999 income range, which is the most common income bracket and makes up 20.8% of all families. Conversely, the $10,000 to $14,999 income bracket is the least frequent group with only 22 families (1.4%) belonging to this category.

| Income Bracket | # Families | % Families |
| Less than $10,000 | 54 | 3.4% |
| $10,000 to $14,999 | 22 | 1.4% |
| $15,000 to $24,999 | 88 | 5.6% |
| $25,000 to $34,999 | 123 | 7.8% |
| $35,000 to $49,999 | 273 | 17.3% |
| $50,000 to $74,999 | 190 | 12.0% |
| $75,000 to $99,999 | 322 | 20.4% |
| $100,000 to $149,999 | 329 | 20.8% |
| $150,000 to $199,999 | 106 | 6.7% |
| $200,000+ | 73 | 4.6% |
Family Income by Famaliy Size in Walworth County
4-person families (197 | 12.5%) account for the highest median family income in Walworth County with $92,383 per family, while 2-person families (994 | 62.9%) have the highest median income of $33,542 per family member.

| Income Bracket | # Families | Median Income |
| 2-Person Families | 994 (62.9%) | $67,083 |
| 3-Person Families | 209 (13.2%) | $0 |
| 4-Person Families | 197 (12.5%) | $92,383 |
| 5-Person Families | 104 (6.6%) | $53,654 |
| 6-Person Families | 53 (3.4%) | $76,602 |
| 7+ Person Families | 23 (1.5%) | $0 |
| Total | 1,580 (100.0%) | $75,985 |
Family Income by Number of Earners in Walworth County
The median family income in Walworth County is $75,985, with families comprising 2 earners (788) having the highest median family income of $105,064, while families with no earners (290) have the lowest median family income of $33,750, accounting for 49.9% and 18.3% of families, respectively.

| Number of Earners | # Families | Median Income |
| No Earners | 290 (18.3%) | $33,750 |
| 1 Earner | 475 (30.1%) | $53,042 |
| 2 Earners | 788 (49.9%) | $105,064 |
| 3+ Earners | 27 (1.7%) | $85,625 |
| Total | 1,580 (100.0%) | $75,985 |
Household Income in Walworth County
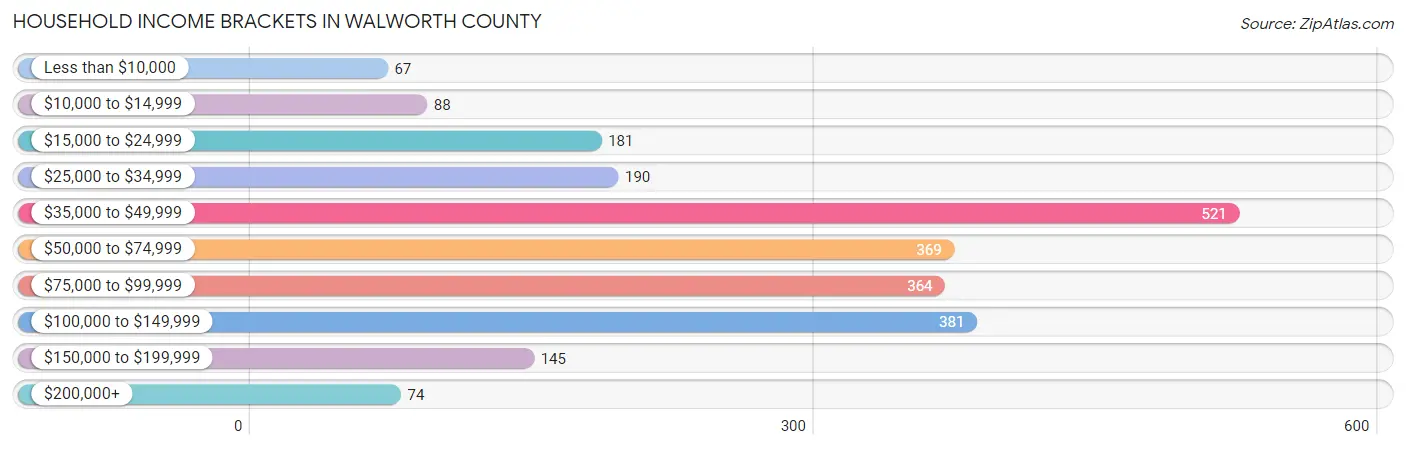
Household Income Brackets in Walworth County
With 521 households falling in the category, the $35,000 to $49,999 income range is the most frequent in Walworth County, accounting for 21.9% of all households. In contrast, only 67 households (2.8%) fall into the less than $10,000 income bracket, making it the least populous group.
| Income Bracket | # Households | % Households |
| Less than $10,000 | 67 | 2.8% |
| $10,000 to $14,999 | 88 | 3.7% |
| $15,000 to $24,999 | 181 | 7.6% |
| $25,000 to $34,999 | 190 | 8.0% |
| $35,000 to $49,999 | 521 | 21.9% |
| $50,000 to $74,999 | 369 | 15.5% |
| $75,000 to $99,999 | 364 | 15.3% |
| $100,000 to $149,999 | 381 | 16.0% |
| $150,000 to $199,999 | 145 | 6.1% |
| $200,000+ | 74 | 3.1% |
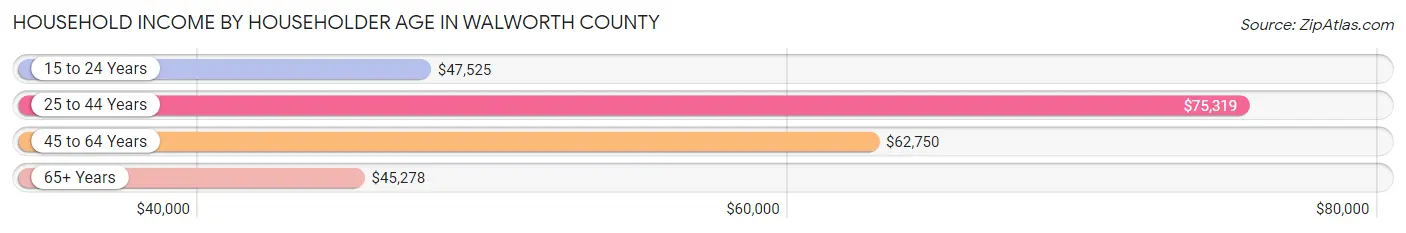
Household Income by Householder Age in Walworth County
The median household income in Walworth County is $57,697, with the highest median household income of $75,319 found in the 25 to 44 years age bracket for the primary householder. A total of 762 households (32.0%) fall into this category. Meanwhile, the 65+ years age bracket for the primary householder has the lowest median household income of $45,278, with 732 households (30.8%) in this group.
| Income Bracket | # Households | Median Income |
| 15 to 24 Years | 141 (5.9%) | $47,525 |
| 25 to 44 Years | 762 (32.0%) | $75,319 |
| 45 to 64 Years | 745 (31.3%) | $62,750 |
| 65+ Years | 732 (30.8%) | $45,278 |
| Total | 2,380 (100.0%) | $57,697 |
Poverty in Walworth County
Income Below Poverty by Sex and Age in Walworth County
With 13.2% poverty level for males and 13.3% for females among the residents of Walworth County, under 5 year old males and 6 to 11 year old females are the most vulnerable to poverty, with 56 males (32.4%) and 60 females (24.0%) in their respective age groups living below the poverty level.
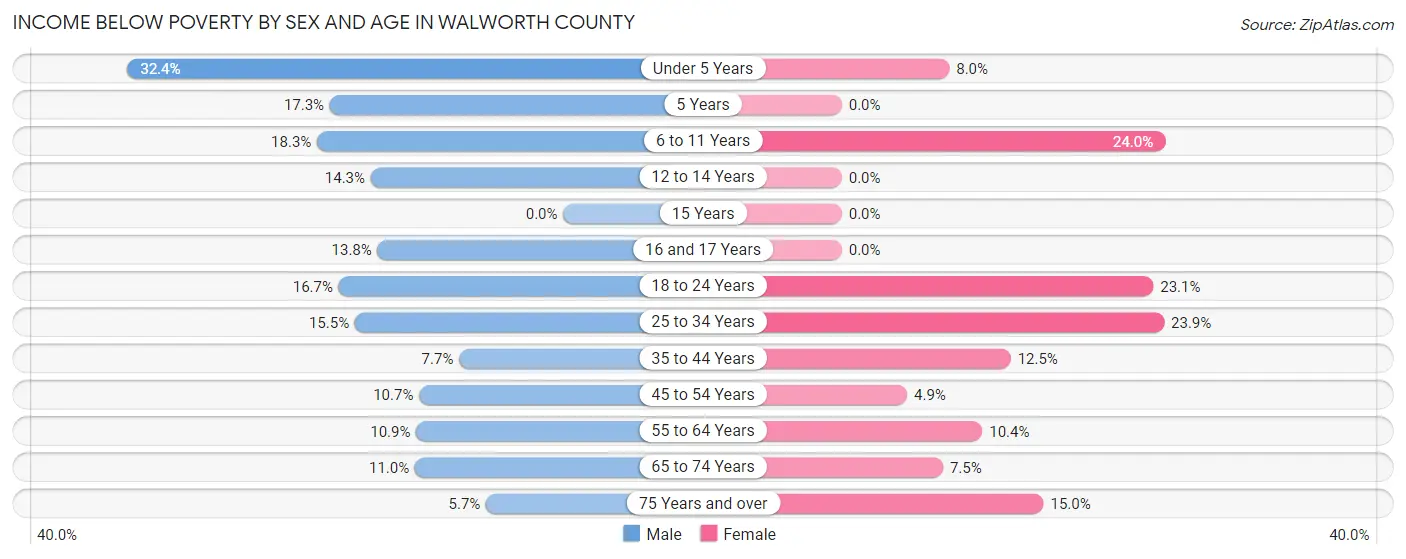
| Age Bracket | Male | Female |
| Under 5 Years | 56 (32.4%) | 15 (8.0%) |
| 5 Years | 13 (17.3%) | 0 (0.0%) |
| 6 to 11 Years | 34 (18.3%) | 60 (24.0%) |
| 12 to 14 Years | 13 (14.3%) | 0 (0.0%) |
| 15 Years | 0 (0.0%) | 0 (0.0%) |
| 16 and 17 Years | 8 (13.8%) | 0 (0.0%) |
| 18 to 24 Years | 33 (16.7%) | 34 (23.1%) |
| 25 to 34 Years | 43 (15.5%) | 78 (23.9%) |
| 35 to 44 Years | 29 (7.7%) | 43 (12.5%) |
| 45 to 54 Years | 23 (10.7%) | 8 (4.9%) |
| 55 to 64 Years | 44 (10.9%) | 41 (10.4%) |
| 65 to 74 Years | 38 (11.0%) | 25 (7.5%) |
| 75 Years and over | 13 (5.7%) | 37 (15.0%) |
| Total | 347 (13.2%) | 341 (13.3%) |
Income Above Poverty by Sex and Age in Walworth County
According to the poverty statistics in Walworth County, males aged 75 years and over and females aged 5 years are the age groups that are most secure financially, with 94.3% of males and 100.0% of females in these age groups living above the poverty line.

| Age Bracket | Male | Female |
| Under 5 Years | 117 (67.6%) | 173 (92.0%) |
| 5 Years | 62 (82.7%) | 52 (100.0%) |
| 6 to 11 Years | 152 (81.7%) | 190 (76.0%) |
| 12 to 14 Years | 78 (85.7%) | 48 (100.0%) |
| 15 Years | 0 (0.0%) | 36 (100.0%) |
| 16 and 17 Years | 50 (86.2%) | 45 (100.0%) |
| 18 to 24 Years | 165 (83.3%) | 113 (76.9%) |
| 25 to 34 Years | 235 (84.5%) | 248 (76.1%) |
| 35 to 44 Years | 346 (92.3%) | 300 (87.5%) |
| 45 to 54 Years | 192 (89.3%) | 157 (95.2%) |
| 55 to 64 Years | 359 (89.1%) | 352 (89.6%) |
| 65 to 74 Years | 307 (89.0%) | 308 (92.5%) |
| 75 Years and over | 214 (94.3%) | 210 (85.0%) |
| Total | 2,277 (86.8%) | 2,232 (86.8%) |
Income Below Poverty Among Married-Couple Families in Walworth County
The poverty statistics for married-couple families in Walworth County show that 6.7% or 82 of the total 1,222 families live below the poverty line. Families with 3 or 4 children have the highest poverty rate of 24.7%, comprising of 36 families. On the other hand, families with 5 or more children have the lowest poverty rate of 0.0%, which includes 0 families.

| Children | Above Poverty | Below Poverty |
| No Children | 758 (94.4%) | 45 (5.6%) |
| 1 or 2 Children | 249 (99.6%) | 1 (0.4%) |
| 3 or 4 Children | 110 (75.3%) | 36 (24.7%) |
| 5 or more Children | 23 (100.0%) | 0 (0.0%) |
| Total | 1,140 (93.3%) | 82 (6.7%) |
Income Below Poverty Among Single-Parent Households in Walworth County

| Children | Single Father | Single Mother |
| No Children | 0 (0.0%) | 9 (7.8%) |
| 1 or 2 Children | 0 (0.0%) | 38 (48.7%) |
| 3 or 4 Children | 0 (0.0%) | 15 (71.4%) |
| 5 or more Children | 0 (0.0%) | 0 (0.0%) |
| Total | 0 (0.0%) | 62 (28.8%) |
Income Below Poverty Among Married-Couple vs Single-Parent Households in Walworth County
The poverty data for Walworth County shows that 82 of the married-couple family households (6.7%) and 62 of the single-parent households (17.3%) are living below the poverty level. Within the married-couple family households, those with 3 or 4 children have the highest poverty rate, with 36 households (24.7%) falling below the poverty line. Among the single-parent households, those with 3 or 4 children have the highest poverty rate, with 15 household (71.4%) living below poverty.
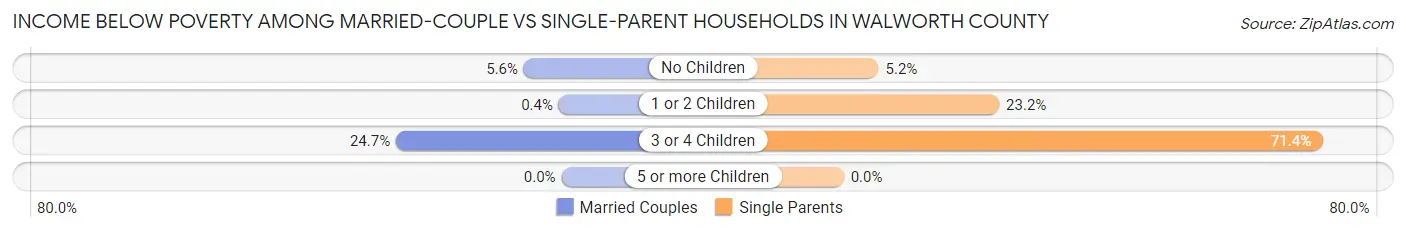
| Children | Married-Couple Families | Single-Parent Households |
| No Children | 45 (5.6%) | 9 (5.2%) |
| 1 or 2 Children | 1 (0.4%) | 38 (23.2%) |
| 3 or 4 Children | 36 (24.7%) | 15 (71.4%) |
| 5 or more Children | 0 (0.0%) | 0 (0.0%) |
| Total | 82 (6.7%) | 62 (17.3%) |
Employment Characteristics in Walworth County
Employment by Class of Employer in Walworth County
Among the 2,516 employed individuals in Walworth County, private company employees (1,416 | 56.3%), not-for-profit organizations (277 | 11.0%), and self-employed (not incorporated) (228 | 9.1%) make up the most common classes of employment.
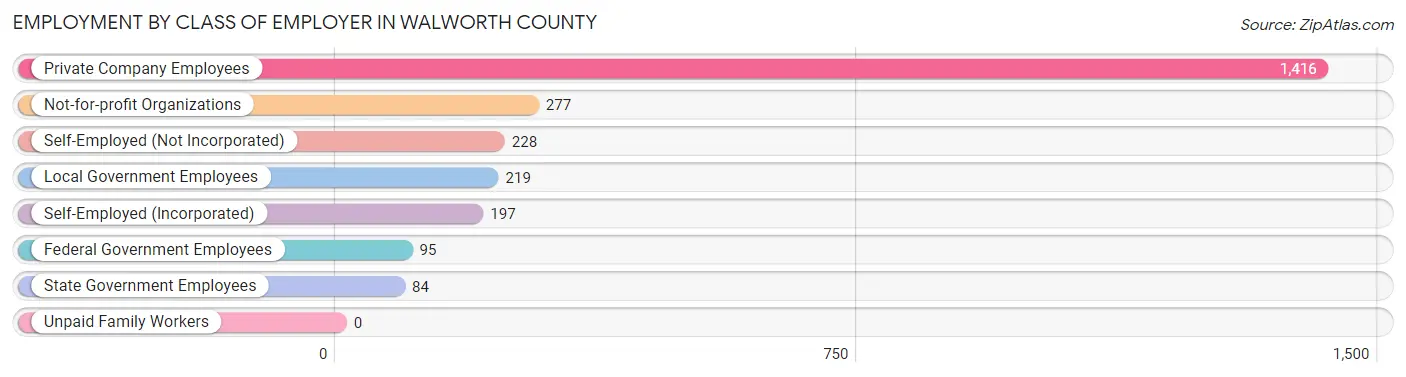
| Employer Class | # Employees | % Employees |
| Private Company Employees | 1,416 | 56.3% |
| Self-Employed (Incorporated) | 197 | 7.8% |
| Self-Employed (Not Incorporated) | 228 | 9.1% |
| Not-for-profit Organizations | 277 | 11.0% |
| Local Government Employees | 219 | 8.7% |
| State Government Employees | 84 | 3.3% |
| Federal Government Employees | 95 | 3.8% |
| Unpaid Family Workers | 0 | 0.0% |
| Total | 2,516 | 100.0% |
Employment Status by Age in Walworth County
According to the labor force statistics for Walworth County, out of the total population over 16 years of age (4,216), 63.4% or 2,673 individuals are in the labor force, with 3.6% or 96 of them unemployed. The age group with the highest labor force participation rate is 45 to 54 years, with 96.6% or 370 individuals in the labor force. Within the labor force, the 20 to 24 years age range has the highest percentage of unemployed individuals, with 22.0% or 47 of them being unemployed.

| Age Bracket | In Labor Force | Unemployed |
| 16 to 19 Years | 83 (46.1%) | 17 (20.5%) |
| 20 to 24 Years | 214 (79.9%) | 47 (22.0%) |
| 25 to 29 Years | 190 (95.0%) | 0 (0.0%) |
| 30 to 34 Years | 331 (81.3%) | 3 (0.9%) |
| 35 to 44 Years | 581 (76.8%) | 8 (1.4%) |
| 45 to 54 Years | 370 (96.6%) | 0 (0.0%) |
| 55 to 59 Years | 295 (84.8%) | 12 (4.1%) |
| 60 to 64 Years | 312 (69.3%) | 8 (2.6%) |
| 65 to 74 Years | 274 (40.4%) | 0 (0.0%) |
| 75 Years and over | 21 (3.9%) | 0 (0.0%) |
| Total | 2,673 (63.4%) | 96 (3.6%) |
Employment Status by Educational Attainment in Walworth County
According to labor force statistics for Walworth County, 81.7% of individuals (2,079) out of the total population between 25 and 64 years of age (2,545) are in the labor force, with 1.5% or 31 of them being unemployed. The group with the highest labor force participation rate are those with the educational attainment of bachelor's degree or higher, with 91.0% or 707 individuals in the labor force. Within the labor force, individuals with less than high school education have the highest percentage of unemployment, with 9.0% or 11 of them being unemployed.
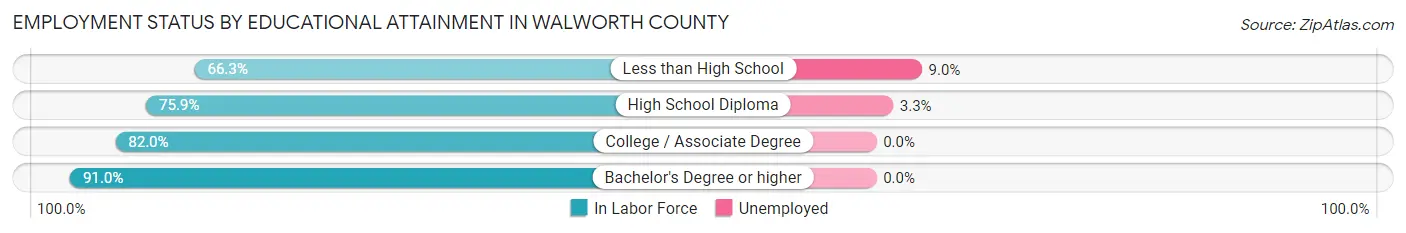
| Educational Attainment | In Labor Force | Unemployed |
| Less than High School | 122 (66.3%) | 17 (9.0%) |
| High School Diploma | 609 (75.9%) | 26 (3.3%) |
| College / Associate Degree | 641 (82.0%) | 0 (0.0%) |
| Bachelor's Degree or higher | 707 (91.0%) | 0 (0.0%) |
| Total | 2,079 (81.7%) | 38 (1.5%) |
Employment Occupations by Sex in Walworth County
Management, Business, Science and Arts Occupations
The most common Management, Business, Science and Arts occupations in Walworth County are Management (466 | 18.2%), Health Diagnosing & Treating (279 | 10.9%), Community & Social Service (210 | 8.2%), Health Technologists (172 | 6.7%), and Education Instruction & Library (145 | 5.7%).

Management, Business, Science and Arts Occupations by Sex
Within the Management, Business, Science and Arts occupations in Walworth County, the most male-oriented occupations are Architecture & Engineering (100.0%), Legal Services & Support (100.0%), and Computers, Engineering & Science (95.6%), while the most female-oriented occupations are Arts, Media & Entertainment (100.0%), Business & Financial (97.1%), and Education Instruction & Library (89.0%).

| Occupation | Male | Female |
| Management | 317 (68.0%) | 149 (32.0%) |
| Business & Financial | 3 (2.9%) | 101 (97.1%) |
| Computers, Engineering & Science | 130 (95.6%) | 6 (4.4%) |
| Computers & Mathematics | 9 (81.8%) | 2 (18.2%) |
| Architecture & Engineering | 43 (100.0%) | 0 (0.0%) |
| Life, Physical & Social Science | 78 (95.1%) | 4 (4.9%) |
| Community & Social Service | 76 (36.2%) | 134 (63.8%) |
| Education, Arts & Media | 52 (94.6%) | 3 (5.4%) |
| Legal Services & Support | 8 (100.0%) | 0 (0.0%) |
| Education Instruction & Library | 16 (11.0%) | 129 (89.0%) |
| Arts, Media & Entertainment | 0 (0.0%) | 2 (100.0%) |
| Health Diagnosing & Treating | 110 (39.4%) | 169 (60.6%) |
| Health Technologists | 77 (44.8%) | 95 (55.2%) |
| Total (Category) | 636 (53.2%) | 559 (46.8%) |
| Total (Overall) | 1,486 (58.1%) | 1,071 (41.9%) |
Services Occupations
The most common Services occupations in Walworth County are Food Preparation & Serving (121 | 4.7%), Security & Protection (74 | 2.9%), Cleaning & Maintenance (66 | 2.6%), Healthcare Support (45 | 1.8%), and Law Enforcement (41 | 1.6%).

Services Occupations by Sex
Within the Services occupations in Walworth County, the most male-oriented occupations are Security & Protection (100.0%), Firefighting & Prevention (100.0%), and Law Enforcement (100.0%), while the most female-oriented occupations are Personal Care & Service (93.8%), Healthcare Support (91.1%), and Cleaning & Maintenance (60.6%).

| Occupation | Male | Female |
| Healthcare Support | 4 (8.9%) | 41 (91.1%) |
| Security & Protection | 74 (100.0%) | 0 (0.0%) |
| Firefighting & Prevention | 33 (100.0%) | 0 (0.0%) |
| Law Enforcement | 41 (100.0%) | 0 (0.0%) |
| Food Preparation & Serving | 85 (70.3%) | 36 (29.7%) |
| Cleaning & Maintenance | 26 (39.4%) | 40 (60.6%) |
| Personal Care & Service | 2 (6.2%) | 30 (93.8%) |
| Total (Category) | 191 (56.5%) | 147 (43.5%) |
| Total (Overall) | 1,486 (58.1%) | 1,071 (41.9%) |
Sales and Office Occupations
The most common Sales and Office occupations in Walworth County are Office & Administration (245 | 9.6%), and Sales & Related (209 | 8.2%).

Sales and Office Occupations by Sex

| Occupation | Male | Female |
| Sales & Related | 104 (49.8%) | 105 (50.2%) |
| Office & Administration | 19 (7.8%) | 226 (92.2%) |
| Total (Category) | 123 (27.1%) | 331 (72.9%) |
| Total (Overall) | 1,486 (58.1%) | 1,071 (41.9%) |
Natural Resources, Construction and Maintenance Occupations
The most common Natural Resources, Construction and Maintenance occupations in Walworth County are Construction & Extraction (131 | 5.1%), Farming, Fishing & Forestry (84 | 3.3%), and Installation, Maintenance & Repair (68 | 2.7%).

Natural Resources, Construction and Maintenance Occupations by Sex

| Occupation | Male | Female |
| Farming, Fishing & Forestry | 82 (97.6%) | 2 (2.4%) |
| Construction & Extraction | 117 (89.3%) | 14 (10.7%) |
| Installation, Maintenance & Repair | 68 (100.0%) | 0 (0.0%) |
| Total (Category) | 267 (94.4%) | 16 (5.7%) |
| Total (Overall) | 1,486 (58.1%) | 1,071 (41.9%) |
Production, Transportation and Moving Occupations
The most common Production, Transportation and Moving occupations in Walworth County are Transportation (126 | 4.9%), Production (102 | 4.0%), and Material Moving (59 | 2.3%).

Production, Transportation and Moving Occupations by Sex

| Occupation | Male | Female |
| Production | 102 (100.0%) | 0 (0.0%) |
| Transportation | 126 (100.0%) | 0 (0.0%) |
| Material Moving | 41 (69.5%) | 18 (30.5%) |
| Total (Category) | 269 (93.7%) | 18 (6.3%) |
| Total (Overall) | 1,486 (58.1%) | 1,071 (41.9%) |
Employment Industries by Sex in Walworth County
Employment Industries in Walworth County
The major employment industries in Walworth County include Health Care & Social Assistance (369 | 14.4%), Accommodation & Food Services (258 | 10.1%), Agriculture, Fishing & Hunting (253 | 9.9%), Educational Services (200 | 7.8%), and Retail Trade (183 | 7.2%).

Employment Industries by Sex in Walworth County
The Walworth County industries that see more men than women are Mining, Quarrying, & Extraction (100.0%), Wholesale Trade (100.0%), and Utilities (100.0%), whereas the industries that tend to have a higher number of women are Information (100.0%), Arts, Entertainment & Recreation (100.0%), and Finance & Insurance (82.1%).

| Industry | Male | Female |
| Agriculture, Fishing & Hunting | 222 (87.7%) | 31 (12.2%) |
| Mining, Quarrying, & Extraction | 51 (100.0%) | 0 (0.0%) |
| Construction | 163 (89.6%) | 19 (10.4%) |
| Manufacturing | 103 (67.8%) | 49 (32.2%) |
| Wholesale Trade | 98 (100.0%) | 0 (0.0%) |
| Retail Trade | 95 (51.9%) | 88 (48.1%) |
| Transportation & Warehousing | 61 (98.4%) | 1 (1.6%) |
| Utilities | 35 (100.0%) | 0 (0.0%) |
| Information | 0 (0.0%) | 2 (100.0%) |
| Finance & Insurance | 28 (17.9%) | 128 (82.1%) |
| Real Estate, Rental & Leasing | 9 (100.0%) | 0 (0.0%) |
| Professional & Scientific | 53 (85.5%) | 9 (14.5%) |
| Enterprise Management | 0 (0.0%) | 0 (0.0%) |
| Administrative & Support | 38 (46.9%) | 43 (53.1%) |
| Educational Services | 46 (23.0%) | 154 (77.0%) |
| Health Care & Social Assistance | 110 (29.8%) | 259 (70.2%) |
| Arts, Entertainment & Recreation | 0 (0.0%) | 6 (100.0%) |
| Accommodation & Food Services | 122 (47.3%) | 136 (52.7%) |
| Public Administration | 69 (60.0%) | 46 (40.0%) |
| Total | 1,486 (58.1%) | 1,071 (41.9%) |
Education in Walworth County
School Enrollment in Walworth County
The most common levels of schooling among the 1,013 students in Walworth County are elementary school (278 | 27.4%), middle school (229 | 22.6%), and high school (159 | 15.7%).

| School Level | # Students | % Students |
| Nursery / Preschool | 100 | 9.9% |
| Kindergarten | 121 | 11.9% |
| Elementary School | 278 | 27.4% |
| Middle School | 229 | 22.6% |
| High School | 159 | 15.7% |
| College / Undergraduate | 105 | 10.4% |
| Graduate / Professional | 21 | 2.1% |
| Total | 1,013 | 100.0% |
School Enrollment by Age by Funding Source in Walworth County
Out of a total of 1,013 students who are enrolled in schools in Walworth County, 163 (16.1%) attend a private institution, while the remaining 850 (83.9%) are enrolled in public schools. The age group of 3 to 4 year olds has the highest likelihood of being enrolled in private schools, with 22 (61.1% in the age bracket) enrolled. Conversely, the age group of 10 to 14 year olds has the lowest likelihood of being enrolled in a private school, with 271 (98.9% in the age bracket) attending a public institution.

| Age Bracket | Public School | Private School |
| 3 to 4 Year Olds | 14 (38.9%) | 22 (61.1%) |
| 5 to 9 Year Old | 343 (81.5%) | 78 (18.5%) |
| 10 to 14 Year Olds | 271 (98.9%) | 3 (1.1%) |
| 15 to 17 Year Olds | 108 (81.8%) | 24 (18.2%) |
| 18 to 19 Year Olds | 28 (96.6%) | 1 (3.5%) |
| 20 to 24 Year Olds | 49 (90.7%) | 5 (9.3%) |
| 25 to 34 Year Olds | 20 (60.6%) | 13 (39.4%) |
| 35 Years and over | 17 (50.0%) | 17 (50.0%) |
| Total | 850 (83.9%) | 163 (16.1%) |
Educational Attainment by Field of Study in Walworth County
Education (194 | 16.9%), science & technology (192 | 16.7%), bio, nature & agricultural (173 | 15.0%), business (157 | 13.6%), and engineering (98 | 8.5%) are the most common fields of study among 1,151 individuals in Walworth County who have obtained a bachelor's degree or higher.
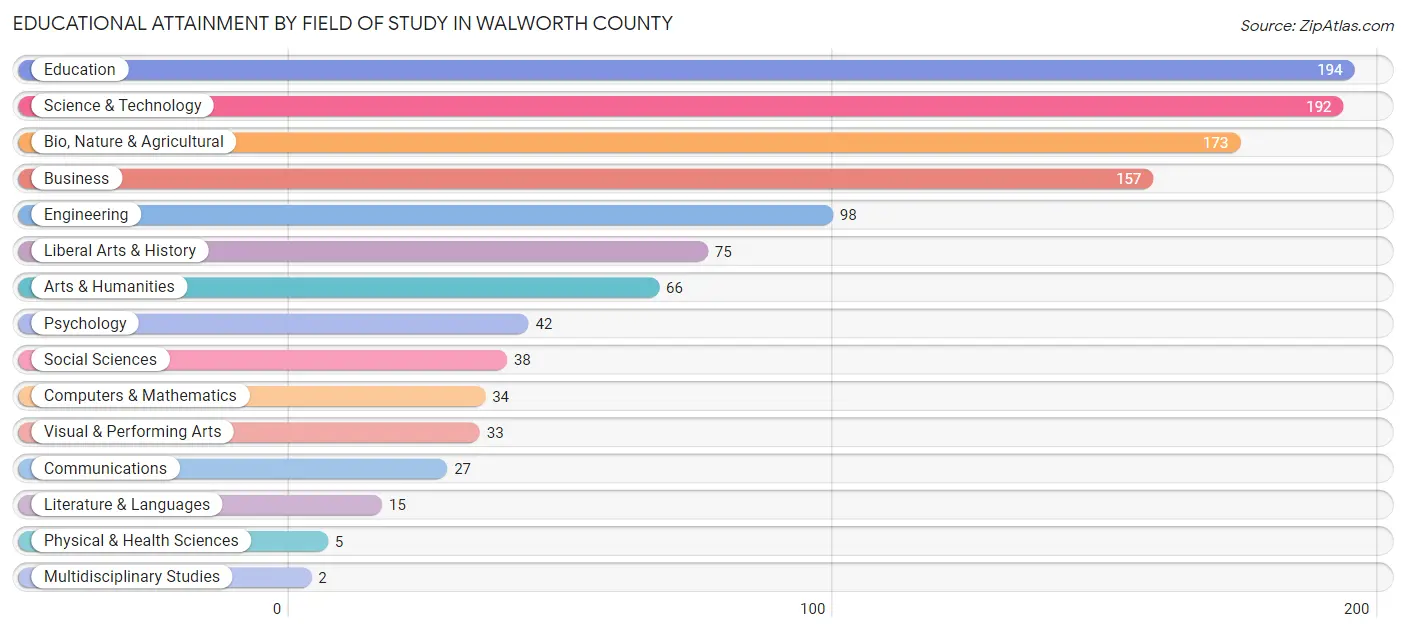
| Field of Study | # Graduates | % Graduates |
| Computers & Mathematics | 34 | 2.9% |
| Bio, Nature & Agricultural | 173 | 15.0% |
| Physical & Health Sciences | 5 | 0.4% |
| Psychology | 42 | 3.6% |
| Social Sciences | 38 | 3.3% |
| Engineering | 98 | 8.5% |
| Multidisciplinary Studies | 2 | 0.2% |
| Science & Technology | 192 | 16.7% |
| Business | 157 | 13.6% |
| Education | 194 | 16.9% |
| Literature & Languages | 15 | 1.3% |
| Liberal Arts & History | 75 | 6.5% |
| Visual & Performing Arts | 33 | 2.9% |
| Communications | 27 | 2.4% |
| Arts & Humanities | 66 | 5.7% |
| Total | 1,151 | 100.0% |
Transportation & Commute in Walworth County
Vehicle Availability by Sex in Walworth County
The most prevalent vehicle ownership categories in Walworth County are males with 2 vehicles (581, accounting for 41.1%) and females with 2 vehicles (396, making up 54.9%).

| Vehicles Available | Male | Female |
| No Vehicle | 8 (0.6%) | 3 (0.3%) |
| 1 Vehicle | 358 (25.3%) | 261 (24.7%) |
| 2 Vehicles | 581 (41.1%) | 396 (37.4%) |
| 3 Vehicles | 235 (16.6%) | 200 (18.9%) |
| 4 Vehicles | 136 (9.6%) | 100 (9.5%) |
| 5 or more Vehicles | 97 (6.9%) | 98 (9.3%) |
| Total | 1,415 (100.0%) | 1,058 (100.0%) |
Commute Time in Walworth County
The most frequently occuring commute durations in Walworth County are 5 to 9 minutes (835 commuters, 35.0%), 10 to 14 minutes (364 commuters, 15.3%), and 15 to 19 minutes (360 commuters, 15.1%).
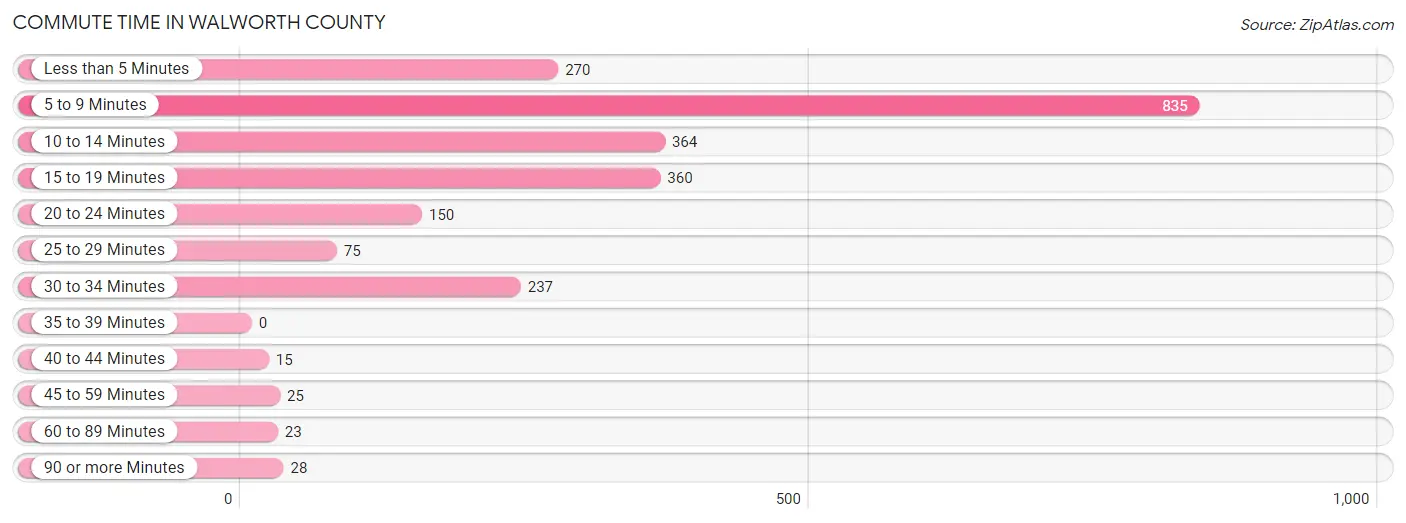
| Commute Time | # Commuters | % Commuters |
| Less than 5 Minutes | 270 | 11.3% |
| 5 to 9 Minutes | 835 | 35.0% |
| 10 to 14 Minutes | 364 | 15.3% |
| 15 to 19 Minutes | 360 | 15.1% |
| 20 to 24 Minutes | 150 | 6.3% |
| 25 to 29 Minutes | 75 | 3.2% |
| 30 to 34 Minutes | 237 | 10.0% |
| 35 to 39 Minutes | 0 | 0.0% |
| 40 to 44 Minutes | 15 | 0.6% |
| 45 to 59 Minutes | 25 | 1.1% |
| 60 to 89 Minutes | 23 | 1.0% |
| 90 or more Minutes | 28 | 1.2% |
Commute Time by Sex in Walworth County
The most common commute times in Walworth County are 5 to 9 minutes (446 commuters, 32.1%) for males and 5 to 9 minutes (389 commuters, 39.2%) for females.

| Commute Time | Male | Female |
| Less than 5 Minutes | 169 (12.2%) | 101 (10.2%) |
| 5 to 9 Minutes | 446 (32.1%) | 389 (39.2%) |
| 10 to 14 Minutes | 242 (17.4%) | 122 (12.3%) |
| 15 to 19 Minutes | 214 (15.4%) | 146 (14.7%) |
| 20 to 24 Minutes | 109 (7.8%) | 41 (4.1%) |
| 25 to 29 Minutes | 58 (4.2%) | 17 (1.7%) |
| 30 to 34 Minutes | 100 (7.2%) | 137 (13.8%) |
| 35 to 39 Minutes | 0 (0.0%) | 0 (0.0%) |
| 40 to 44 Minutes | 1 (0.1%) | 14 (1.4%) |
| 45 to 59 Minutes | 23 (1.7%) | 2 (0.2%) |
| 60 to 89 Minutes | 17 (1.2%) | 6 (0.6%) |
| 90 or more Minutes | 11 (0.8%) | 17 (1.7%) |
Time of Departure to Work by Sex in Walworth County
The most frequent times of departure to work in Walworth County are 7:30 AM to 7:59 AM (367, 26.4%) for males and 7:30 AM to 7:59 AM (305, 30.7%) for females.

| Time of Departure | Male | Female |
| 12:00 AM to 4:59 AM | 69 (5.0%) | 22 (2.2%) |
| 5:00 AM to 5:29 AM | 10 (0.7%) | 0 (0.0%) |
| 5:30 AM to 5:59 AM | 76 (5.5%) | 31 (3.1%) |
| 6:00 AM to 6:29 AM | 172 (12.4%) | 45 (4.5%) |
| 6:30 AM to 6:59 AM | 95 (6.8%) | 89 (9.0%) |
| 7:00 AM to 7:29 AM | 188 (13.5%) | 210 (21.2%) |
| 7:30 AM to 7:59 AM | 367 (26.4%) | 305 (30.7%) |
| 8:00 AM to 8:29 AM | 189 (13.6%) | 144 (14.5%) |
| 8:30 AM to 8:59 AM | 13 (0.9%) | 22 (2.2%) |
| 9:00 AM to 9:59 AM | 63 (4.5%) | 35 (3.5%) |
| 10:00 AM to 10:59 AM | 17 (1.2%) | 0 (0.0%) |
| 11:00 AM to 11:59 AM | 64 (4.6%) | 3 (0.3%) |
| 12:00 PM to 3:59 PM | 53 (3.8%) | 17 (1.7%) |
| 4:00 PM to 11:59 PM | 14 (1.0%) | 69 (7.0%) |
| Total | 1,390 (100.0%) | 992 (100.0%) |
Housing Occupancy in Walworth County
Occupancy by Ownership in Walworth County
Of the total 2,380 dwellings in Walworth County, owner-occupied units account for 1,746 (73.4%), while renter-occupied units make up 634 (26.6%).
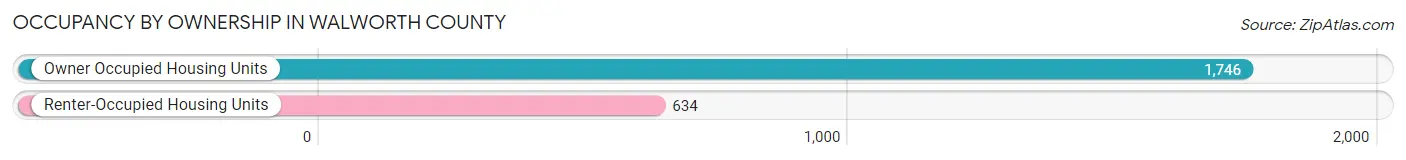
| Occupancy | # Housing Units | % Housing Units |
| Owner Occupied Housing Units | 1,746 | 73.4% |
| Renter-Occupied Housing Units | 634 | 26.6% |
| Total Occupied Housing Units | 2,380 | 100.0% |
Occupancy by Household Size in Walworth County
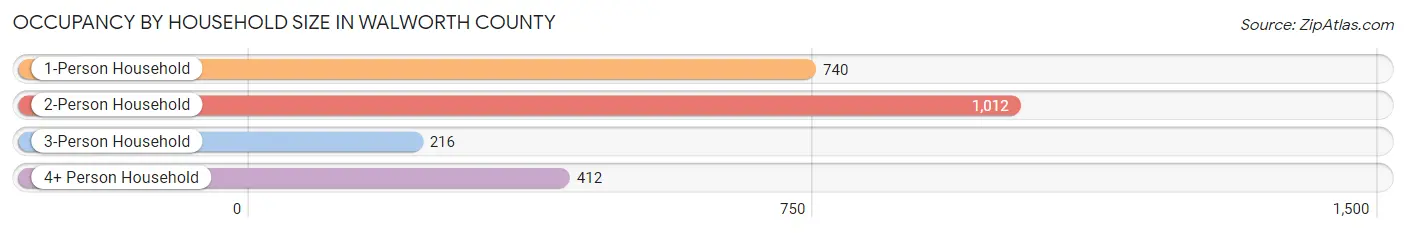
| Household Size | # Housing Units | % Housing Units |
| 1-Person Household | 740 | 31.1% |
| 2-Person Household | 1,012 | 42.5% |
| 3-Person Household | 216 | 9.1% |
| 4+ Person Household | 412 | 17.3% |
| Total Housing Units | 2,380 | 100.0% |
Occupancy by Ownership by Household Size in Walworth County

| Household Size | Owner-occupied | Renter-occupied |
| 1-Person Household | 503 (68.0%) | 237 (32.0%) |
| 2-Person Household | 813 (80.3%) | 199 (19.7%) |
| 3-Person Household | 126 (58.3%) | 90 (41.7%) |
| 4+ Person Household | 304 (73.8%) | 108 (26.2%) |
| Total Housing Units | 1,746 (73.4%) | 634 (26.6%) |
Occupancy by Educational Attainment in Walworth County
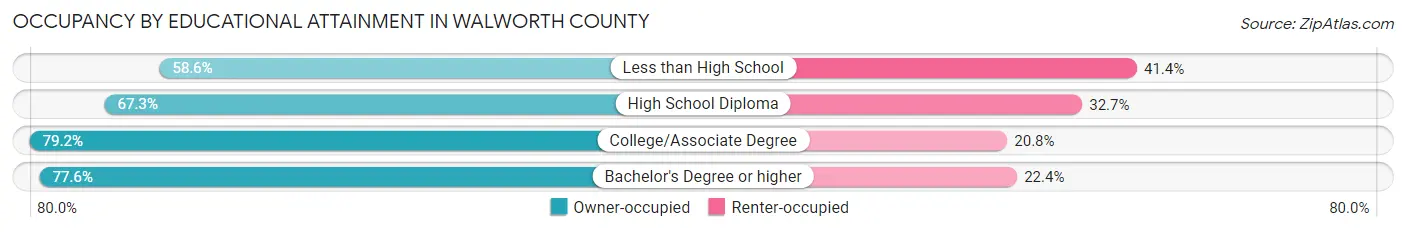
| Household Size | Owner-occupied | Renter-occupied |
| Less than High School | 102 (58.6%) | 72 (41.4%) |
| High School Diploma | 525 (67.3%) | 255 (32.7%) |
| College/Associate Degree | 609 (79.2%) | 160 (20.8%) |
| Bachelor's Degree or higher | 510 (77.6%) | 147 (22.4%) |
Occupancy by Age of Householder in Walworth County

| Age Bracket | # Households | % Households |
| Under 35 Years | 418 | 17.6% |
| 35 to 44 Years | 485 | 20.4% |
| 45 to 54 Years | 252 | 10.6% |
| 55 to 64 Years | 493 | 20.7% |
| 65 to 74 Years | 418 | 17.6% |
| 75 to 84 Years | 223 | 9.4% |
| 85 Years and Over | 91 | 3.8% |
| Total | 2,380 | 100.0% |
Housing Finances in Walworth County
Median Income by Occupancy in Walworth County

| Occupancy Type | # Households | Median Income |
| Owner-Occupied | 1,746 (73.4%) | $64,474 |
| Renter-Occupied | 634 (26.6%) | $41,250 |
| Average | 2,380 (100.0%) | $57,697 |
Occupancy by Householder Income Bracket in Walworth County

| Income Bracket | Owner-occupied | Renter-occupied |
| Less than $5,000 | 12 (0.7%) | 40 (6.3%) |
| $5,000 to $9,999 | 12 (0.7%) | 2 (0.3%) |
| $10,000 to $14,999 | 26 (1.5%) | 61 (9.6%) |
| $15,000 to $19,999 | 36 (2.1%) | 20 (3.2%) |
| $20,000 to $24,999 | 65 (3.7%) | 61 (9.6%) |
| $25,000 to $34,999 | 130 (7.4%) | 61 (9.6%) |
| $35,000 to $49,999 | 314 (18.0%) | 208 (32.8%) |
| $50,000 to $74,999 | 338 (19.4%) | 32 (5.1%) |
| $75,000 to $99,999 | 295 (16.9%) | 69 (10.9%) |
| $100,000 to $149,999 | 316 (18.1%) | 65 (10.2%) |
| $150,000 or more | 202 (11.6%) | 15 (2.4%) |
| Total | 1,746 (100.0%) | 634 (100.0%) |
Monthly Housing Cost Tiers in Walworth County

| Monthly Cost | Owner-occupied | Renter-occupied |
| Less than $300 | 178 (10.2%) | 26 (4.1%) |
| $300 to $499 | 307 (17.6%) | 27 (4.3%) |
| $500 to $799 | 358 (20.5%) | 188 (29.6%) |
| $800 to $999 | 300 (17.2%) | 161 (25.4%) |
| $1,000 to $1,499 | 265 (15.2%) | 139 (21.9%) |
| $1,500 to $1,999 | 130 (7.4%) | 5 (0.8%) |
| $2,000 to $2,499 | 121 (6.9%) | 0 (0.0%) |
| $2,500 to $2,999 | 27 (1.5%) | 0 (0.0%) |
| $3,000 or more | 60 (3.4%) | 11 (1.7%) |
| Total | 1,746 (100.0%) | 634 (100.0%) |
Physical Housing Characteristics in Walworth County
Housing Structures in Walworth County

| Structure Type | # Housing Units | % Housing Units |
| Single Unit, Detached | 1,969 | 82.7% |
| Single Unit, Attached | 17 | 0.7% |
| 2 Unit Apartments | 9 | 0.4% |
| 3 or 4 Unit Apartments | 57 | 2.4% |
| 5 to 9 Unit Apartments | 32 | 1.3% |
| 10 or more Apartments | 90 | 3.8% |
| Mobile Home / Other | 206 | 8.7% |
| Total | 2,380 | 100.0% |
Housing Structures by Occupancy in Walworth County

| Structure Type | Owner-occupied | Renter-occupied |
| Single Unit, Detached | 1,606 (81.6%) | 363 (18.4%) |
| Single Unit, Attached | 8 (47.1%) | 9 (52.9%) |
| 2 Unit Apartments | 0 (0.0%) | 9 (100.0%) |
| 3 or 4 Unit Apartments | 0 (0.0%) | 57 (100.0%) |
| 5 to 9 Unit Apartments | 0 (0.0%) | 32 (100.0%) |
| 10 or more Apartments | 0 (0.0%) | 90 (100.0%) |
| Mobile Home / Other | 132 (64.1%) | 74 (35.9%) |
| Total | 1,746 (73.4%) | 634 (26.6%) |
Housing Structures by Number of Rooms in Walworth County

| Number of Rooms | Owner-occupied | Renter-occupied |
| 1 Room | 0 (0.0%) | 12 (1.9%) |
| 2 or 3 Rooms | 15 (0.9%) | 110 (17.3%) |
| 4 or 5 Rooms | 380 (21.8%) | 345 (54.4%) |
| 6 or 7 Rooms | 655 (37.5%) | 61 (9.6%) |
| 8 or more Rooms | 696 (39.9%) | 106 (16.7%) |
| Total | 1,746 (100.0%) | 634 (100.0%) |
Housing Structure by Heating Type in Walworth County

| Heating Type | Owner-occupied | Renter-occupied |
| Utility Gas | 1,001 (57.3%) | 219 (34.5%) |
| Bottled, Tank, or LP Gas | 424 (24.3%) | 136 (21.4%) |
| Electricity | 263 (15.1%) | 256 (40.4%) |
| Fuel Oil or Kerosene | 40 (2.3%) | 8 (1.3%) |
| Coal or Coke | 0 (0.0%) | 0 (0.0%) |
| All other Fuels | 12 (0.7%) | 15 (2.4%) |
| No Fuel Used | 6 (0.3%) | 0 (0.0%) |
| Total | 1,746 (100.0%) | 634 (100.0%) |
Household Vehicle Usage in Walworth County

| Vehicles per Household | Owner-occupied | Renter-occupied |
| No Vehicle | 15 (0.9%) | 54 (8.5%) |
| 1 Vehicle | 415 (23.8%) | 390 (61.5%) |
| 2 Vehicles | 703 (40.3%) | 165 (26.0%) |
| 3 or more Vehicles | 613 (35.1%) | 25 (3.9%) |
| Total | 1,746 (100.0%) | 634 (100.0%) |
Real Estate & Mortgages in Walworth County
Real Estate and Mortgage Overview in Walworth County
| Characteristic | Without Mortgage | With Mortgage |
| Housing Units | 866 | 880 |
| Median Property Value | $96,200 | $146,400 |
| Median Household Income | $55,741 | $117 |
| Monthly Housing Costs | $480 | $60 |
| Real Estate Taxes | $1,260 | $3 |
Property Value by Mortgage Status in Walworth County

| Property Value | Without Mortgage | With Mortgage |
| Less than $50,000 | 192 (22.2%) | 97 (11.0%) |
| $50,000 to $99,999 | 266 (30.7%) | 194 (22.1%) |
| $100,000 to $299,999 | 325 (37.5%) | 412 (46.8%) |
| $300,000 to $499,999 | 51 (5.9%) | 124 (14.1%) |
| $500,000 to $749,999 | 15 (1.7%) | 42 (4.8%) |
| $750,000 to $999,999 | 6 (0.7%) | 11 (1.3%) |
| $1,000,000 or more | 11 (1.3%) | 0 (0.0%) |
| Total | 866 (100.0%) | 880 (100.0%) |
Household Income by Mortgage Status in Walworth County
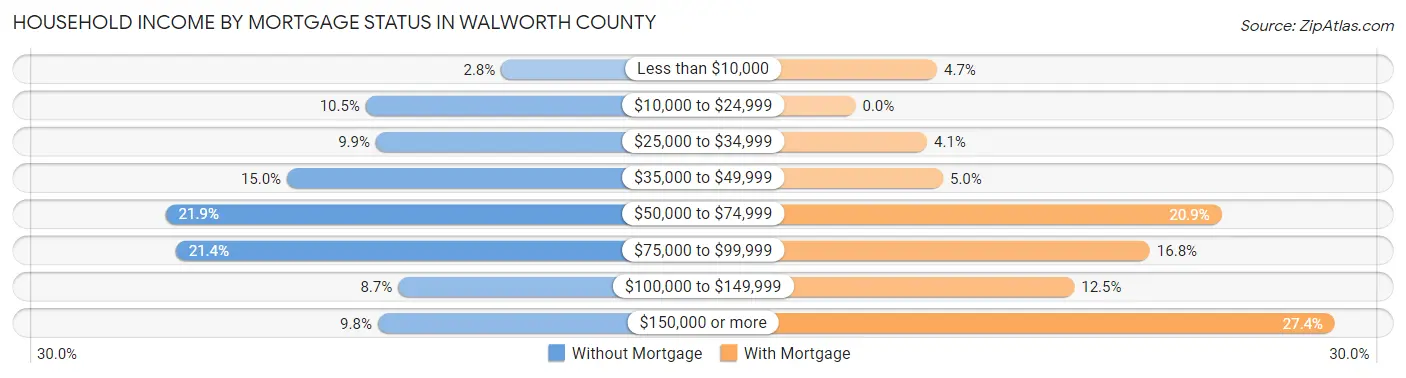
| Household Income | Without Mortgage | With Mortgage |
| Less than $10,000 | 24 (2.8%) | 41 (4.7%) |
| $10,000 to $24,999 | 91 (10.5%) | 0 (0.0%) |
| $25,000 to $34,999 | 86 (9.9%) | 36 (4.1%) |
| $35,000 to $49,999 | 130 (15.0%) | 44 (5.0%) |
| $50,000 to $74,999 | 190 (21.9%) | 184 (20.9%) |
| $75,000 to $99,999 | 185 (21.4%) | 148 (16.8%) |
| $100,000 to $149,999 | 75 (8.7%) | 110 (12.5%) |
| $150,000 or more | 85 (9.8%) | 241 (27.4%) |
| Total | 866 (100.0%) | 880 (100.0%) |
Property Value to Household Income Ratio in Walworth County

| Value-to-Income Ratio | Without Mortgage | With Mortgage |
| Less than 2.0x | 472 (54.5%) | 77,581 (8,816.0%) |
| 2.0x to 2.9x | 133 (15.4%) | 451 (51.2%) |
| 3.0x to 3.9x | 102 (11.8%) | 239 (27.2%) |
| 4.0x or more | 152 (17.5%) | 48 (5.4%) |
| Total | 866 (100.0%) | 880 (100.0%) |
Real Estate Taxes by Mortgage Status in Walworth County

| Property Taxes | Without Mortgage | With Mortgage |
| Less than $800 | 243 (28.1%) | 0 (0.0%) |
| $800 to $1,499 | 208 (24.0%) | 159 (18.1%) |
| $800 to $1,499 | 378 (43.6%) | 150 (17.1%) |
| Total | 866 (100.0%) | 880 (100.0%) |
Health & Disability in Walworth County
Health Insurance Coverage by Age in Walworth County

| Age Bracket | With Coverage | Without Coverage |
| Under 6 Years | 424 (86.9%) | 64 (13.1%) |
| 6 to 18 Years | 684 (89.2%) | 83 (10.8%) |
| 19 to 25 Years | 191 (61.0%) | 122 (39.0%) |
| 26 to 34 Years | 393 (67.4%) | 190 (32.6%) |
| 35 to 44 Years | 651 (93.1%) | 48 (6.9%) |
| 45 to 54 Years | 375 (98.7%) | 5 (1.3%) |
| 55 to 64 Years | 711 (89.3%) | 85 (10.7%) |
| 65 to 74 Years | 667 (98.4%) | 11 (1.6%) |
| 75 Years and older | 474 (100.0%) | 0 (0.0%) |
| Total | 4,570 (88.3%) | 608 (11.7%) |
Health Insurance Coverage by Citizenship Status in Walworth County

| Citizenship Status | With Coverage | Without Coverage |
| Native Born | 424 (86.9%) | 64 (13.1%) |
| Foreign Born, Citizen | 684 (89.2%) | 83 (10.8%) |
| Foreign Born, not a Citizen | 191 (61.0%) | 122 (39.0%) |
Health Insurance Coverage by Household Income in Walworth County

| Household Income | With Coverage | Without Coverage |
| Under $25,000 | 431 (77.2%) | 127 (22.8%) |
| $25,000 to $49,999 | 1,002 (82.7%) | 209 (17.3%) |
| $50,000 to $74,999 | 607 (91.5%) | 56 (8.5%) |
| $75,000 to $99,999 | 1,050 (97.0%) | 32 (3.0%) |
| $100,000 and over | 1,459 (95.0%) | 77 (5.0%) |
Public vs Private Health Insurance Coverage by Age in Walworth County

| Age Bracket | Public Insurance | Private Insurance |
| Under 6 | 77 (15.8%) | 347 (71.1%) |
| 6 to 18 Years | 141 (18.4%) | 562 (73.3%) |
| 19 to 25 Years | 38 (12.1%) | 153 (48.9%) |
| 25 to 34 Years | 13 (2.2%) | 385 (66.0%) |
| 35 to 44 Years | 104 (14.9%) | 547 (78.2%) |
| 45 to 54 Years | 31 (8.2%) | 349 (91.8%) |
| 55 to 64 Years | 89 (11.2%) | 635 (79.8%) |
| 65 to 74 Years | 637 (94.0%) | 465 (68.6%) |
| 75 Years and over | 474 (100.0%) | 211 (44.5%) |
| Total | 1,604 (31.0%) | 3,654 (70.6%) |
Disability Status by Sex by Age in Walworth County

| Age Bracket | Male | Female |
| Under 5 Years | 0 (0.0%) | 0 (0.0%) |
| 5 to 17 Years | 38 (9.3%) | 79 (18.3%) |
| 18 to 34 Years | 25 (5.2%) | 0 (0.0%) |
| 35 to 64 Years | 106 (10.9%) | 105 (11.7%) |
| 65 to 74 Years | 82 (23.8%) | 59 (17.7%) |
| 75 Years and over | 87 (38.3%) | 94 (38.1%) |
Disability Class by Sex by Age in Walworth County
Disability Class: Hearing Difficulty

| Age Bracket | Male | Female |
| Under 5 Years | 0 (0.0%) | 0 (0.0%) |
| 5 to 17 Years | 0 (0.0%) | 0 (0.0%) |
| 18 to 34 Years | 0 (0.0%) | 0 (0.0%) |
| 35 to 64 Years | 54 (5.5%) | 31 (3.4%) |
| 65 to 74 Years | 47 (13.6%) | 3 (0.9%) |
| 75 Years and over | 66 (29.1%) | 46 (18.6%) |
Disability Class: Vision Difficulty

| Age Bracket | Male | Female |
| Under 5 Years | 0 (0.0%) | 0 (0.0%) |
| 5 to 17 Years | 5 (1.2%) | 25 (5.8%) |
| 18 to 34 Years | 17 (3.6%) | 0 (0.0%) |
| 35 to 64 Years | 16 (1.6%) | 53 (5.9%) |
| 65 to 74 Years | 30 (8.7%) | 3 (0.9%) |
| 75 Years and over | 9 (4.0%) | 27 (10.9%) |
Disability Class: Cognitive Difficulty

| Age Bracket | Male | Female |
| 5 to 17 Years | 33 (8.1%) | 54 (12.5%) |
| 18 to 34 Years | 19 (4.0%) | 0 (0.0%) |
| 35 to 64 Years | 33 (3.4%) | 6 (0.7%) |
| 65 to 74 Years | 12 (3.5%) | 11 (3.3%) |
| 75 Years and over | 3 (1.3%) | 12 (4.9%) |
Disability Class: Ambulatory Difficulty

| Age Bracket | Male | Female |
| 5 to 17 Years | 0 (0.0%) | 0 (0.0%) |
| 18 to 34 Years | 11 (2.3%) | 0 (0.0%) |
| 35 to 64 Years | 33 (3.4%) | 38 (4.2%) |
| 65 to 74 Years | 39 (11.3%) | 54 (16.2%) |
| 75 Years and over | 37 (16.3%) | 67 (27.1%) |
Disability Class: Self-Care Difficulty

| Age Bracket | Male | Female |
| 5 to 17 Years | 0 (0.0%) | 0 (0.0%) |
| 18 to 34 Years | 8 (1.7%) | 0 (0.0%) |
| 35 to 64 Years | 3 (0.3%) | 13 (1.4%) |
| 65 to 74 Years | 12 (3.5%) | 3 (0.9%) |
| 75 Years and over | 20 (8.8%) | 11 (4.4%) |
Technology Access in Walworth County
Computing Device Access in Walworth County

| Device Type | # Households | % Households |
| Desktop or Laptop | 1,750 | 73.5% |
| Smartphone | 1,930 | 81.1% |
| Tablet | 1,341 | 56.3% |
| No Computing Device | 261 | 11.0% |
| Total | 2,380 | 100.0% |
Internet Access in Walworth County

| Internet Type | # Households | % Households |
| Dial-Up Internet | 8 | 0.3% |
| Broadband Home | 1,724 | 72.4% |
| Cellular Data Only | 130 | 5.5% |
| Satellite Internet | 130 | 5.5% |
| No Internet | 445 | 18.7% |
| Total | 2,380 | 100.0% |
Walworth County Summary
Walworth County, South Dakota is located in the north-central part of the state and is bordered by Potter County to the north, Edmunds County to the east, Campbell County to the south, and McPherson County to the west. The county seat is Selby, and the largest city is Mobridge. The county was created in 1873 and named after Reuben H. Walworth, a former New York state attorney general.
Geography
Walworth County covers an area of 1,845 square miles and is located in the Missouri Plateau region of South Dakota. The terrain is mostly flat, with rolling hills in the east and south. The county is drained by the Grand and Moreau rivers, as well as several smaller streams. The county is home to several lakes, including Lake Oahe, Lake Sharpe, and Lake Traverse. The county is mostly covered in grassland, with some areas of forest.
Demographics
As of the 2010 census, the population of Walworth County was 5,845. The population density was 3.2 people per square mile. The racial makeup of the county was 94.2% White, 0.3% African American, 3.2% Native American, 0.2% Asian, 0.1% Pacific Islander, 0.5% from other races, and 1.5% from two or more races. Hispanic or Latino of any race were 1.3% of the population.
Economy
Agriculture is the main economic activity in Walworth County. The county is home to several large farms, and the main crops grown are wheat, corn, soybeans, and sunflowers. Livestock production is also important, with cattle, sheep, and hogs being the main animals raised.
The county is also home to several oil and gas fields, and there is some mining activity in the area. Tourism is also an important part of the economy, with several recreational areas and attractions in the county.
History
The area that is now Walworth County was first inhabited by the Sioux and other Native American tribes. The first white settlers arrived in the area in the late 1800s, and the county was officially established in 1873. The county was named after Reuben H. Walworth, a former New York state attorney general.
The county grew slowly in the early years, but the population began to increase in the early 1900s. The county was largely agricultural, and the main crops grown were wheat, corn, and hay. The county also had several oil and gas fields, and mining activity began in the area in the early 1900s.
The county continued to grow in the mid-1900s, and the population reached its peak in 1960. Since then, the population has declined slightly, but the county remains largely agricultural. Tourism has become an important part of the economy in recent years, with several recreational areas and attractions in the county.
Common Questions
What is the Total Population of Walworth County?
Total Population of Walworth County is 5,317.
What is the Total Male Population of Walworth County?
Total Male Population of Walworth County is 2,675.
What is the Total Female Population of Walworth County?
Total Female Population of Walworth County is 2,642.
What is the Ratio of Males per 100 Females in Walworth County?
There are 101.25 Males per 100 Females in Walworth County.
What is the Ratio of Females per 100 Males in Walworth County?
There are 98.77 Females per 100 Males in Walworth County.
What is the Median Population Age in Walworth County?
Median Population Age in Walworth County is 40.9 Years.
What is the Average Family Size in Walworth County
Average Family Size in Walworth County is 2.6 People.
What is the Average Household Size in Walworth County
Average Household Size in Walworth County is 2.1 People.
What is Per Capita Income in Walworth County?
Per Capita income in Walworth County is $35,602.
What is the Median Family Income in Walworth County?
Median Family Income in Walworth County is $75,985.
What is the Median Household income in Walworth County?
Median Household Income in Walworth County is $57,697.
What is Income or Wage Gap in Walworth County?
Income or Wage Gap in Walworth County is 21.5%.
Women in Walworth County earn 78.5 cents for every dollar earned by a man.
What is Family Income Deficit in Walworth County?
Family Income Deficit in Walworth County is $11,417.
Families that are below poverty line in Walworth County earn $11,417 less on average than the poverty threshold level.
What is Inequality or Gini Index in Walworth County?
Inequality or Gini Index in Walworth County is 0.43.
How Large is the Labor Force in Walworth County?
There are 2,673 People in the Labor Forcein in Walworth County.
What is the Percentage of People in the Labor Force in Walworth County?
63.4% of People are in the Labor Force in Walworth County.
What is the Unemployment Rate in Walworth County?
Unemployment Rate in Walworth County is 3.6%.