Union County, SD
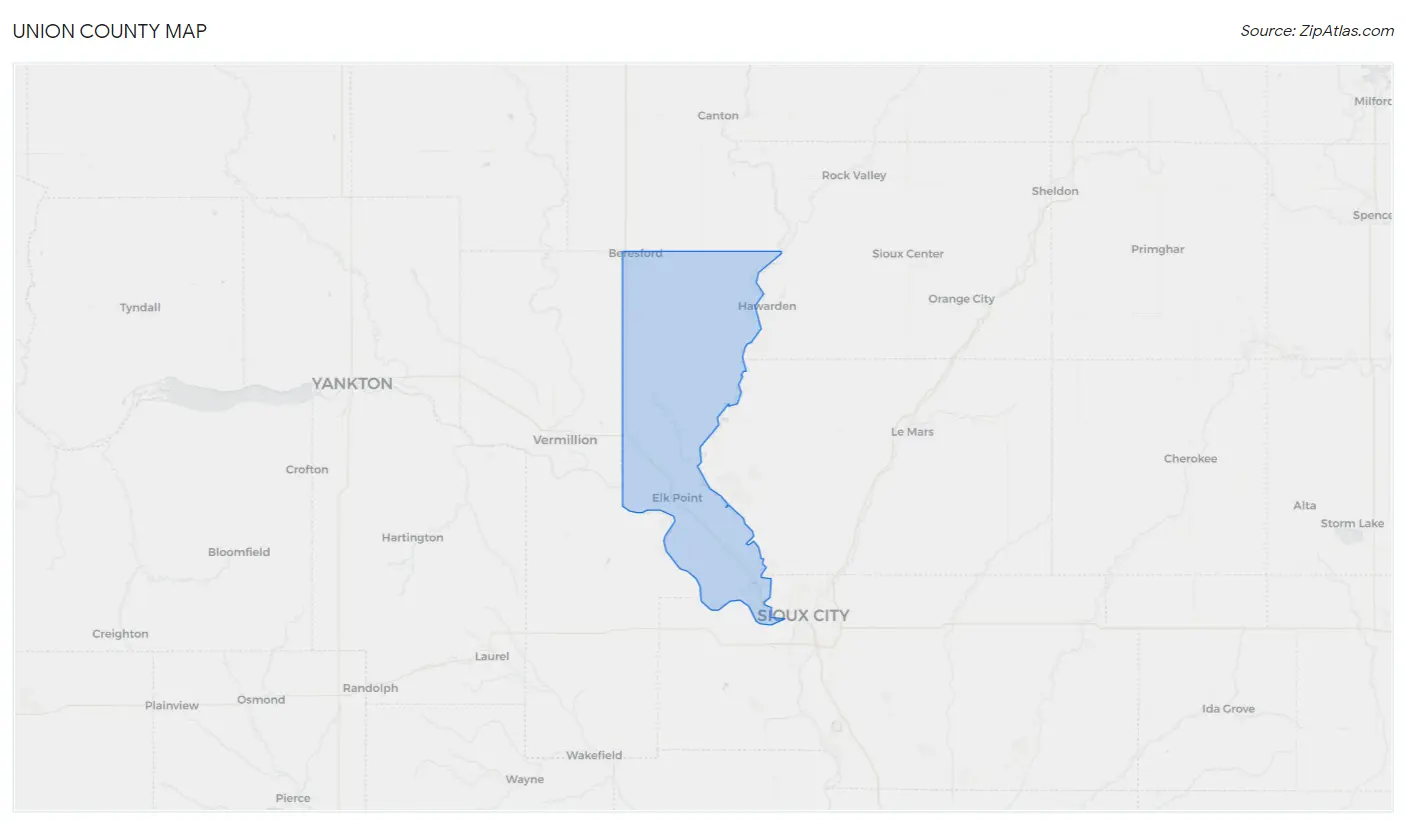
Union County Map
Union County Overview
16,700
TOTAL POPULATION
8,531
MALE POPULATION
8,169
FEMALE POPULATION
104.43
MALES / 100 FEMALES
95.76
FEMALES / 100 MALES
40.1
MEDIAN AGE
2.9
AVG FAMILY SIZE
2.4
AVG HOUSEHOLD SIZE
$47,193
PER CAPITA INCOME
$100,727
AVG FAMILY INCOME
$82,036
AVG HOUSEHOLD INCOME
31.3%
WAGE / INCOME GAP [ % ]
68.7¢/ $1
WAGE / INCOME GAP [ $ ]
$10,115
FAMILY INCOME DEFICIT
0.47
INEQUALITY / GINI INDEX
8,814
LABOR FORCE [ PEOPLE ]
67.3%
PERCENT IN LABOR FORCE
3.0%
UNEMPLOYMENT RATE
Union County Area Codes
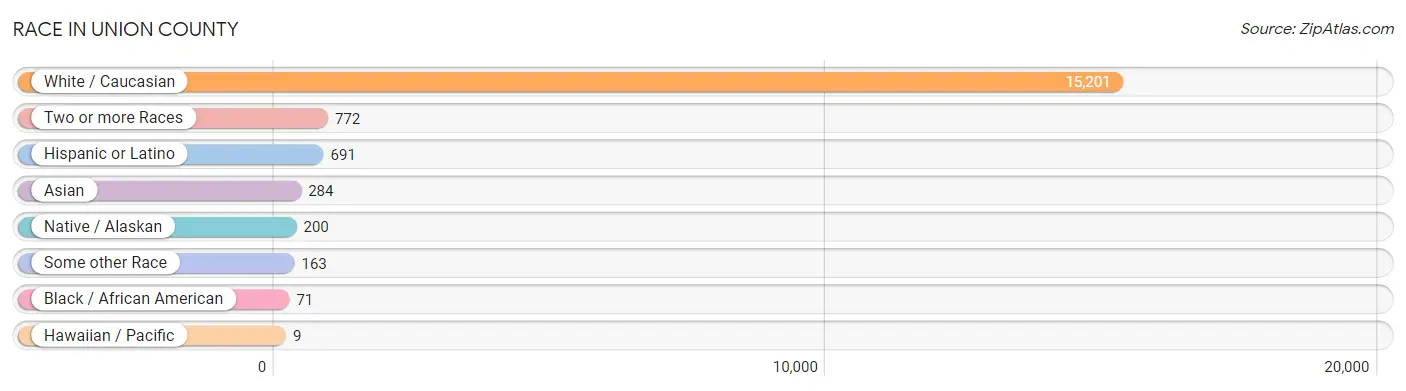
Race in Union County
The most populous races in Union County are White / Caucasian (15,201 | 91.0%), Two or more Races (772 | 4.6%), and Hispanic or Latino (691 | 4.1%).
| Race | # Population | % Population |
| Asian | 284 | 1.7% |
| Black / African American | 71 | 0.4% |
| Hawaiian / Pacific | 9 | 0.1% |
| Hispanic or Latino | 691 | 4.1% |
| Native / Alaskan | 200 | 1.2% |
| White / Caucasian | 15,201 | 91.0% |
| Two or more Races | 772 | 4.6% |
| Some other Race | 163 | 1.0% |
| Total | 16,700 | 100.0% |
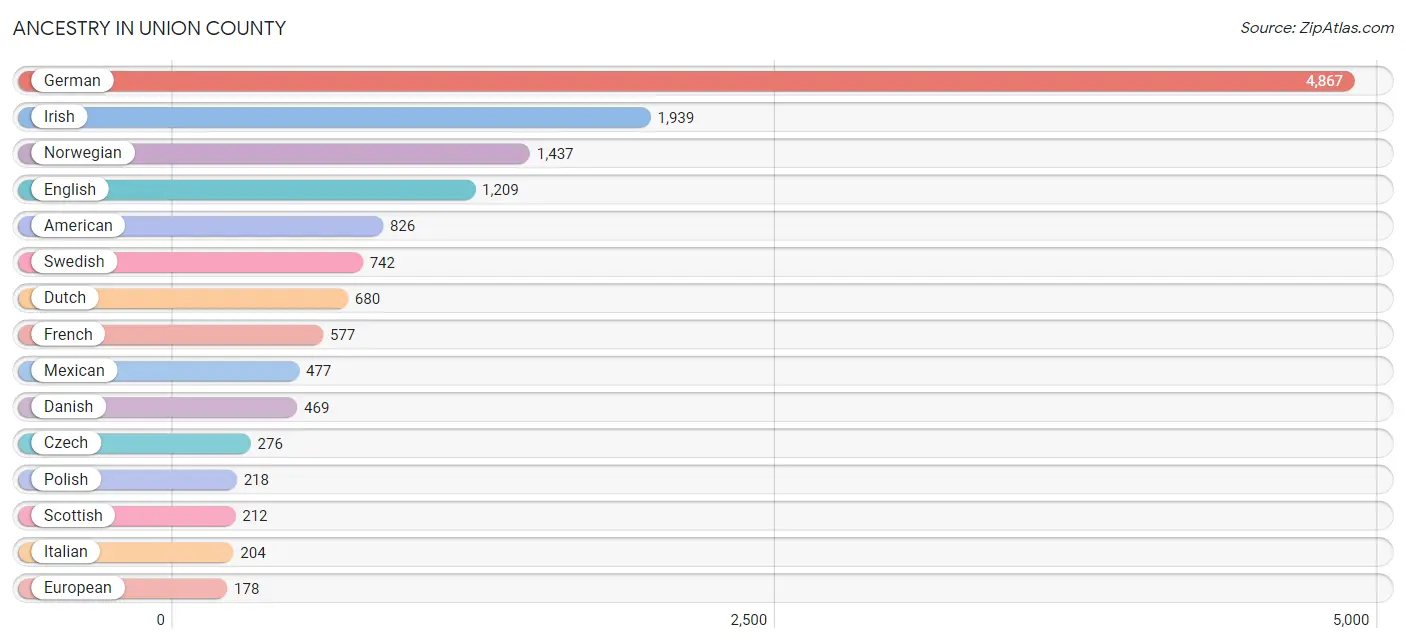
Ancestry in Union County
The most populous ancestries reported in Union County are German (4,867 | 29.1%), Irish (1,939 | 11.6%), Norwegian (1,437 | 8.6%), English (1,209 | 7.2%), and American (826 | 5.0%), together accounting for 61.5% of all Union County residents.
| Ancestry | # Population | % Population |
| American | 826 | 5.0% |
| Apache | 4 | 0.0% |
| Arab | 15 | 0.1% |
| Austrian | 16 | 0.1% |
| Belgian | 15 | 0.1% |
| British | 32 | 0.2% |
| Burmese | 9 | 0.1% |
| Canadian | 24 | 0.1% |
| Central American | 142 | 0.9% |
| Cherokee | 4 | 0.0% |
| Cheyenne | 6 | 0.0% |
| Chippewa | 2 | 0.0% |
| Croatian | 13 | 0.1% |
| Cuban | 3 | 0.0% |
| Czech | 276 | 1.7% |
| Czechoslovakian | 20 | 0.1% |
| Danish | 469 | 2.8% |
| Dutch | 680 | 4.1% |
| Dutch West Indian | 2 | 0.0% |
| Eastern European | 16 | 0.1% |
| English | 1,209 | 7.2% |
| European | 178 | 1.1% |
| Fijian | 9 | 0.1% |
| French | 577 | 3.5% |
| French Canadian | 93 | 0.6% |
| German | 4,867 | 29.1% |
| Greek | 12 | 0.1% |
| Guatemalan | 90 | 0.5% |
| Hungarian | 6 | 0.0% |
| Icelander | 1 | 0.0% |
| Indian (Asian) | 105 | 0.6% |
| Irish | 1,939 | 11.6% |
| Italian | 204 | 1.2% |
| Korean | 55 | 0.3% |
| Luxembourger | 12 | 0.1% |
| Malaysian | 10 | 0.1% |
| Mexican | 477 | 2.9% |
| Mexican American Indian | 26 | 0.2% |
| Nicaraguan | 52 | 0.3% |
| Northern European | 45 | 0.3% |
| Norwegian | 1,437 | 8.6% |
| Polish | 218 | 1.3% |
| Portuguese | 3 | 0.0% |
| Russian | 32 | 0.2% |
| Scandinavian | 168 | 1.0% |
| Scotch-Irish | 54 | 0.3% |
| Scottish | 212 | 1.3% |
| Sioux | 171 | 1.0% |
| Slavic | 64 | 0.4% |
| Sri Lankan | 12 | 0.1% |
| Swedish | 742 | 4.4% |
| Swiss | 84 | 0.5% |
| Thai | 140 | 0.8% |
| Ukrainian | 158 | 0.9% |
| Welsh | 73 | 0.4% | View All 55 Rows |
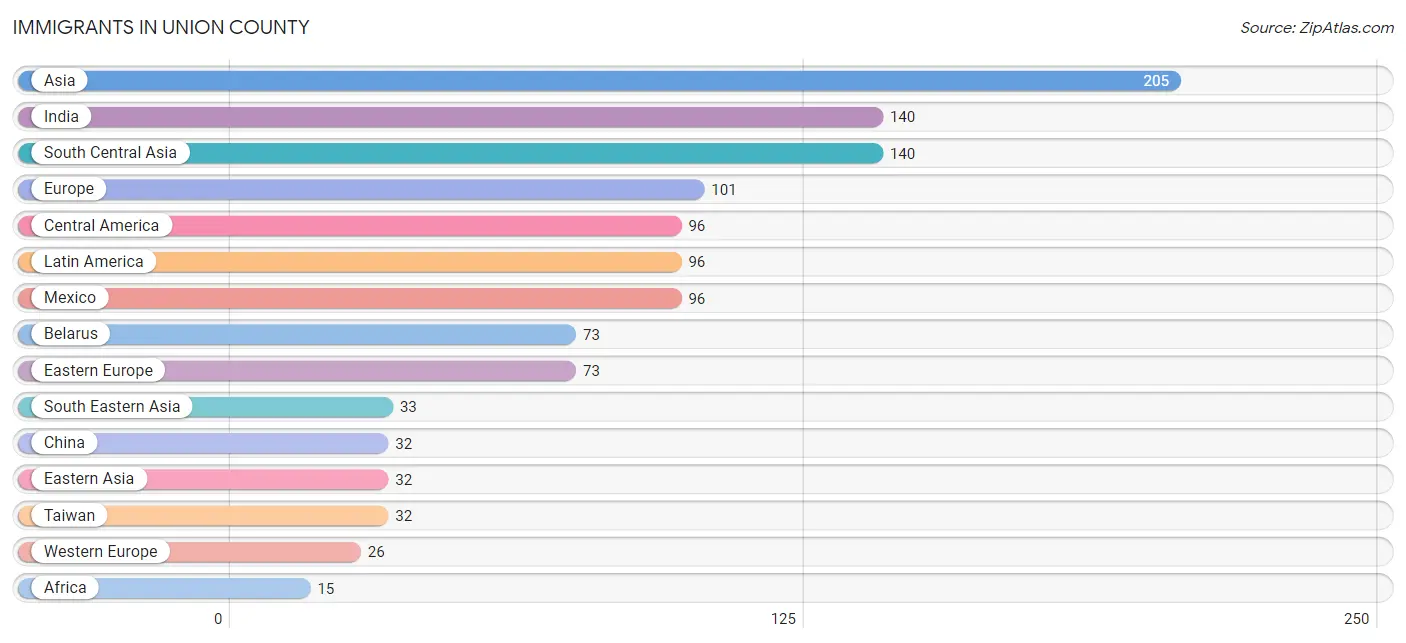
Immigrants in Union County
The most numerous immigrant groups reported in Union County came from Asia (205 | 1.2%), India (140 | 0.8%), South Central Asia (140 | 0.8%), Europe (101 | 0.6%), and Central America (96 | 0.6%), together accounting for 4.1% of all Union County residents.
| Immigration Origin | # Population | % Population |
| Africa | 15 | 0.1% |
| Asia | 205 | 1.2% |
| Belarus | 73 | 0.4% |
| Central America | 96 | 0.6% |
| China | 32 | 0.2% |
| Eastern Asia | 32 | 0.2% |
| Eastern Europe | 73 | 0.4% |
| England | 2 | 0.0% |
| Europe | 101 | 0.6% |
| Germany | 14 | 0.1% |
| India | 140 | 0.8% |
| Laos | 10 | 0.1% |
| Latin America | 96 | 0.6% |
| Mexico | 96 | 0.6% |
| Netherlands | 12 | 0.1% |
| Northern Africa | 15 | 0.1% |
| Northern Europe | 2 | 0.0% |
| Philippines | 11 | 0.1% |
| South Central Asia | 140 | 0.8% |
| South Eastern Asia | 33 | 0.2% |
| Taiwan | 32 | 0.2% |
| Vietnam | 12 | 0.1% |
| Western Europe | 26 | 0.2% | View All 23 Rows |
Sex and Age in Union County
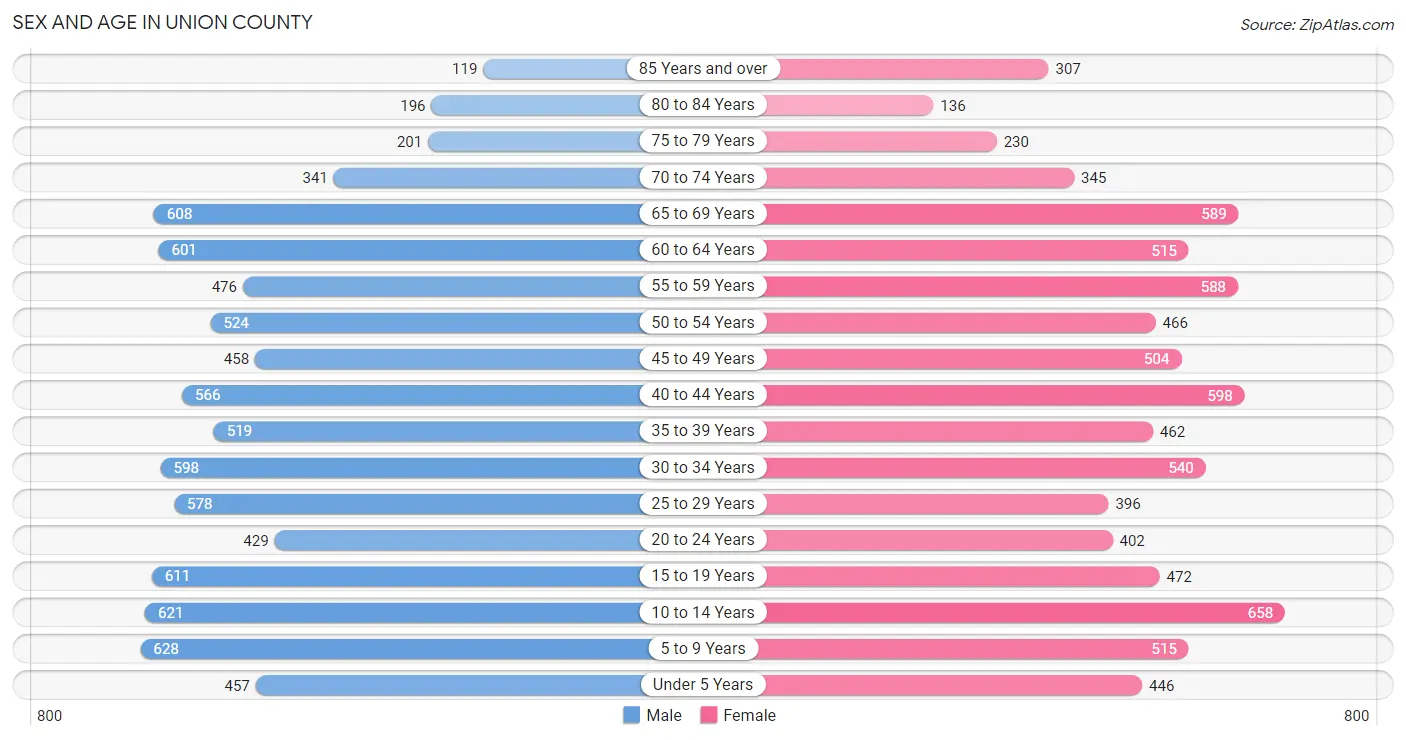
Sex and Age in Union County
The most populous age groups in Union County are 5 to 9 Years (628 | 7.4%) for men and 10 to 14 Years (658 | 8.1%) for women.
| Age Bracket | Male | Female |
| Under 5 Years | 457 (5.4%) | 446 (5.5%) |
| 5 to 9 Years | 628 (7.4%) | 515 (6.3%) |
| 10 to 14 Years | 621 (7.3%) | 658 (8.1%) |
| 15 to 19 Years | 611 (7.2%) | 472 (5.8%) |
| 20 to 24 Years | 429 (5.0%) | 402 (4.9%) |
| 25 to 29 Years | 578 (6.8%) | 396 (4.9%) |
| 30 to 34 Years | 598 (7.0%) | 540 (6.6%) |
| 35 to 39 Years | 519 (6.1%) | 462 (5.7%) |
| 40 to 44 Years | 566 (6.6%) | 598 (7.3%) |
| 45 to 49 Years | 458 (5.4%) | 504 (6.2%) |
| 50 to 54 Years | 524 (6.1%) | 466 (5.7%) |
| 55 to 59 Years | 476 (5.6%) | 588 (7.2%) |
| 60 to 64 Years | 601 (7.0%) | 515 (6.3%) |
| 65 to 69 Years | 608 (7.1%) | 589 (7.2%) |
| 70 to 74 Years | 341 (4.0%) | 345 (4.2%) |
| 75 to 79 Years | 201 (2.4%) | 230 (2.8%) |
| 80 to 84 Years | 196 (2.3%) | 136 (1.7%) |
| 85 Years and over | 119 (1.4%) | 307 (3.8%) |
| Total | 8,531 (100.0%) | 8,169 (100.0%) |
Families and Households in Union County
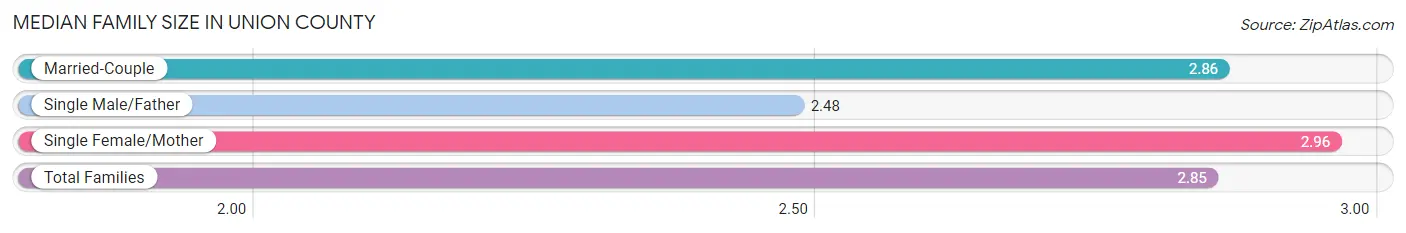
Median Family Size in Union County
The median family size in Union County is 2.85 persons per family, with single female/mother families (464 | 9.9%) accounting for the largest median family size of 2.96 persons per family. On the other hand, single male/father families (341 | 7.3%) represent the smallest median family size with 2.48 persons per family.
| Family Type | # Families | Family Size |
| Married-Couple | 3,876 (82.8%) | 2.86 |
| Single Male/Father | 341 (7.3%) | 2.48 |
| Single Female/Mother | 464 (9.9%) | 2.96 |
| Total Families | 4,681 (100.0%) | 2.85 |
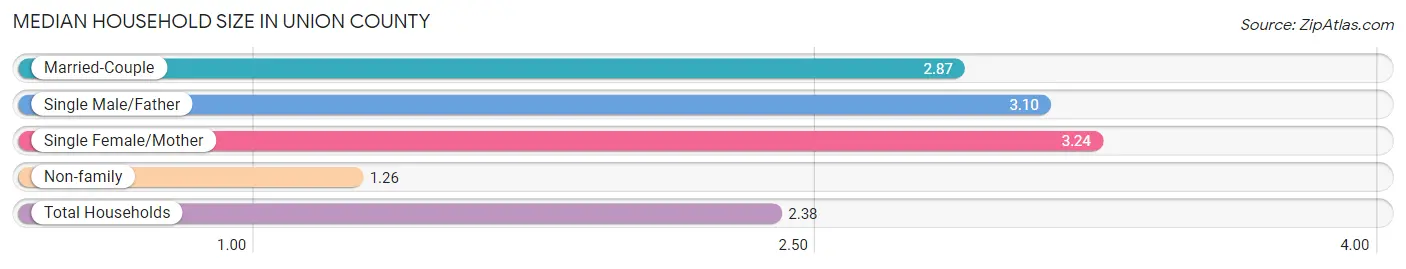
Median Household Size in Union County
The median household size in Union County is 2.38 persons per household, with single female/mother households (464 | 6.7%) accounting for the largest median household size of 3.24 persons per household. non-family households (2,286 | 32.8%) represent the smallest median household size with 1.26 persons per household.
| Household Type | # Households | Household Size |
| Married-Couple | 3,876 (55.6%) | 2.87 |
| Single Male/Father | 341 (4.9%) | 3.10 |
| Single Female/Mother | 464 (6.7%) | 3.24 |
| Non-family | 2,286 (32.8%) | 1.26 |
| Total Households | 6,967 (100.0%) | 2.38 |
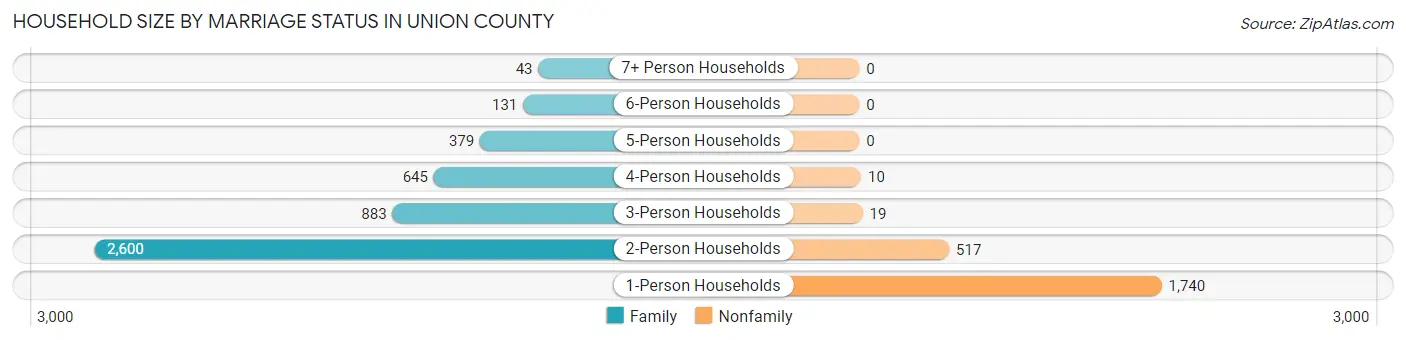
Household Size by Marriage Status in Union County
Out of a total of 6,967 households in Union County, 4,681 (67.2%) are family households, while 2,286 (32.8%) are nonfamily households. The most numerous type of family households are 2-person households, comprising 2,600, and the most common type of nonfamily households are 1-person households, comprising 1,740.
| Household Size | Family Households | Nonfamily Households |
| 1-Person Households | - | 1,740 (25.0%) |
| 2-Person Households | 2,600 (37.3%) | 517 (7.4%) |
| 3-Person Households | 883 (12.7%) | 19 (0.3%) |
| 4-Person Households | 645 (9.3%) | 10 (0.1%) |
| 5-Person Households | 379 (5.4%) | 0 (0.0%) |
| 6-Person Households | 131 (1.9%) | 0 (0.0%) |
| 7+ Person Households | 43 (0.6%) | 0 (0.0%) |
| Total | 4,681 (67.2%) | 2,286 (32.8%) |
Female Fertility in Union County
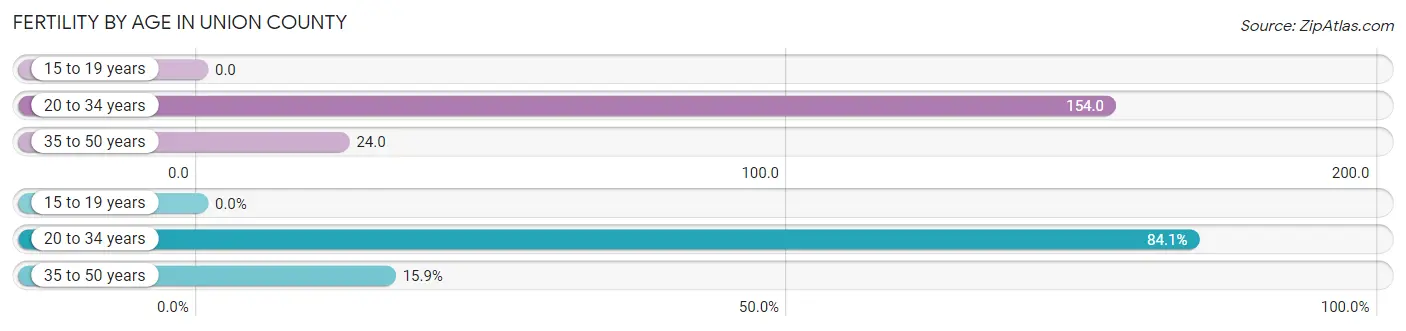
Fertility by Age in Union County
Average fertility rate in Union County is 71.0 births per 1,000 women. Women in the age bracket of 20 to 34 years have the highest fertility rate with 154.0 births per 1,000 women. Women in the age bracket of 20 to 34 years acount for 84.1% of all women with births.
| Age Bracket | Women with Births | Births / 1,000 Women |
| 15 to 19 years | 0 (0.0%) | 0.0 |
| 20 to 34 years | 206 (84.1%) | 154.0 |
| 35 to 50 years | 39 (15.9%) | 24.0 |
| Total | 245 (100.0%) | 71.0 |
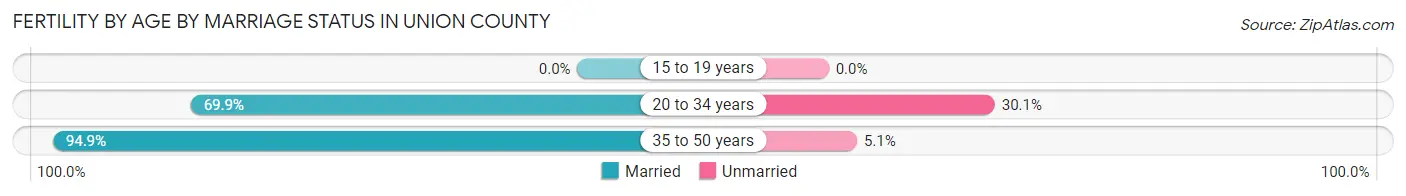
Fertility by Age by Marriage Status in Union County
73.9% of women with births (245) in Union County are married. The highest percentage of unmarried women with births falls into 20 to 34 years age bracket with 30.1% of them unmarried at the time of birth, while the lowest percentage of unmarried women with births belong to 35 to 50 years age bracket with 5.1% of them unmarried.
| Age Bracket | Married | Unmarried |
| 15 to 19 years | 0 (0.0%) | 0 (0.0%) |
| 20 to 34 years | 144 (69.9%) | 62 (30.1%) |
| 35 to 50 years | 37 (94.9%) | 2 (5.1%) |
| Total | 181 (73.9%) | 64 (26.1%) |
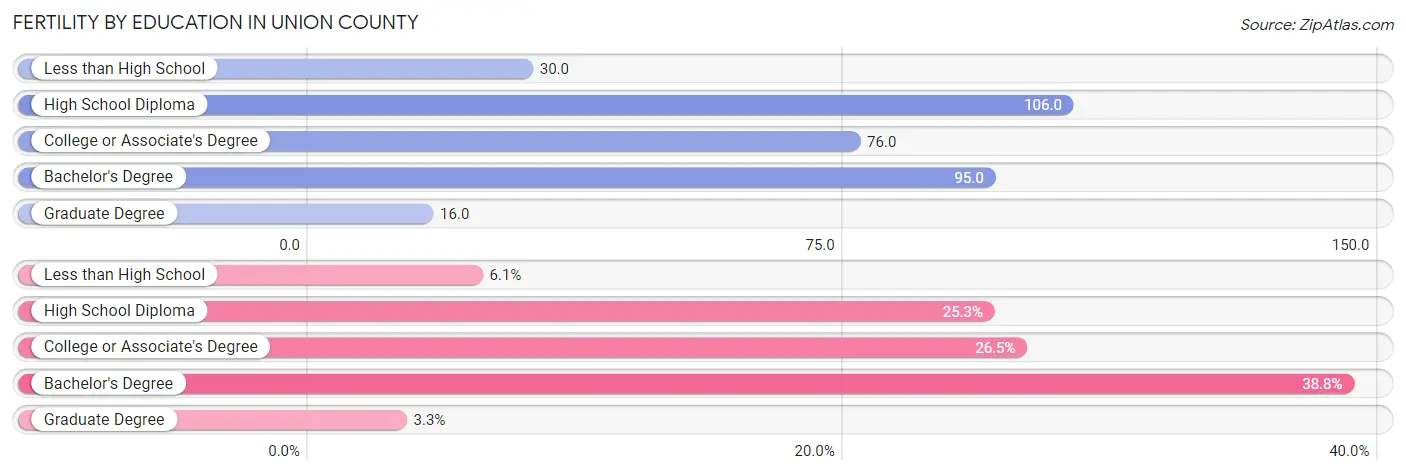
Fertility by Education in Union County
Average fertility rate in Union County is 71.0 births per 1,000 women. Women with the education attainment of high school diploma have the highest fertility rate of 106.0 births per 1,000 women, while women with the education attainment of graduate degree have the lowest fertility at 16.0 births per 1,000 women. Women with the education attainment of bachelor's degree represent 38.8% of all women with births.
| Educational Attainment | Women with Births | Births / 1,000 Women |
| Less than High School | 15 (6.1%) | 30.0 |
| High School Diploma | 62 (25.3%) | 106.0 |
| College or Associate's Degree | 65 (26.5%) | 76.0 |
| Bachelor's Degree | 95 (38.8%) | 95.0 |
| Graduate Degree | 8 (3.3%) | 16.0 |
| Total | 245 (100.0%) | 71.0 |
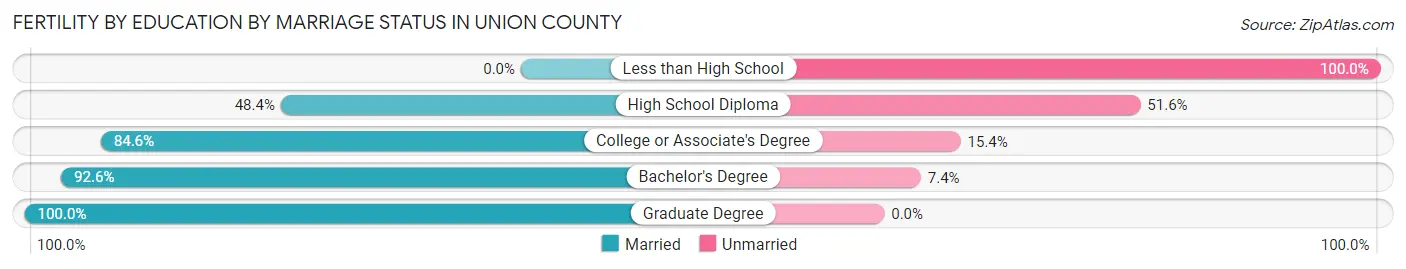
Fertility by Education by Marriage Status in Union County
26.1% of women with births in Union County are unmarried. Women with the educational attainment of graduate degree are most likely to be married with 100.0% of them married at childbirth, while women with the educational attainment of less than high school are least likely to be married with 100.0% of them unmarried at childbirth.
| Educational Attainment | Married | Unmarried |
| Less than High School | 0 (0.0%) | 15 (100.0%) |
| High School Diploma | 30 (48.4%) | 32 (51.6%) |
| College or Associate's Degree | 55 (84.6%) | 10 (15.4%) |
| Bachelor's Degree | 88 (92.6%) | 7 (7.4%) |
| Graduate Degree | 8 (100.0%) | 0 (0.0%) |
| Total | 181 (73.9%) | 64 (26.1%) |
Income in Union County
Income Overview in Union County
Per Capita Income in Union County is $47,193, while median incomes of families and households are $100,727 and $82,036 respectively.
| Characteristic | Number | Measure |
| Per Capita Income | 16,700 | $47,193 |
| Median Family Income | 4,681 | $100,727 |
| Mean Family Income | 4,681 | $135,336 |
| Median Household Income | 6,967 | $82,036 |
| Mean Household Income | 6,967 | $113,111 |
| Income Deficit | 4,681 | $10,115 |
| Wage / Income Gap (%) | 16,700 | 31.25% |
| Wage / Income Gap ($) | 16,700 | 68.75¢ per $1 |
| Gini / Inequality Index | 16,700 | 0.47 |
Earnings by Sex in Union County
Average Earnings in Union County are $45,153, $54,235 for men and $37,285 for women, a difference of 31.2%.
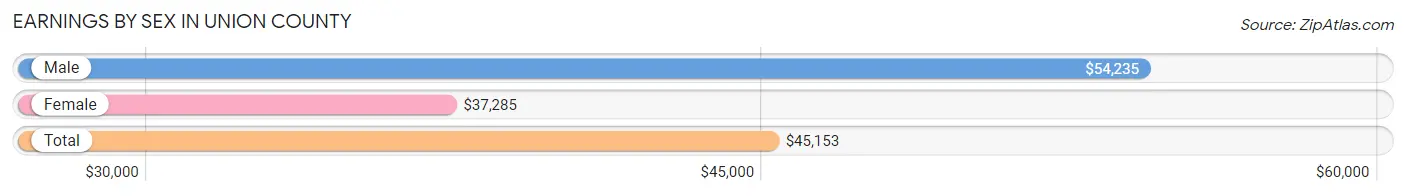
| Sex | Number | Average Earnings |
| Male | 5,278 (55.7%) | $54,235 |
| Female | 4,203 (44.3%) | $37,285 |
| Total | 9,481 (100.0%) | $45,153 |
Earnings by Sex by Income Bracket in Union County
The most common earnings brackets in Union County are $100,000+ for men (1,129 | 21.4%) and $100,000+ for women (489 | 11.6%).
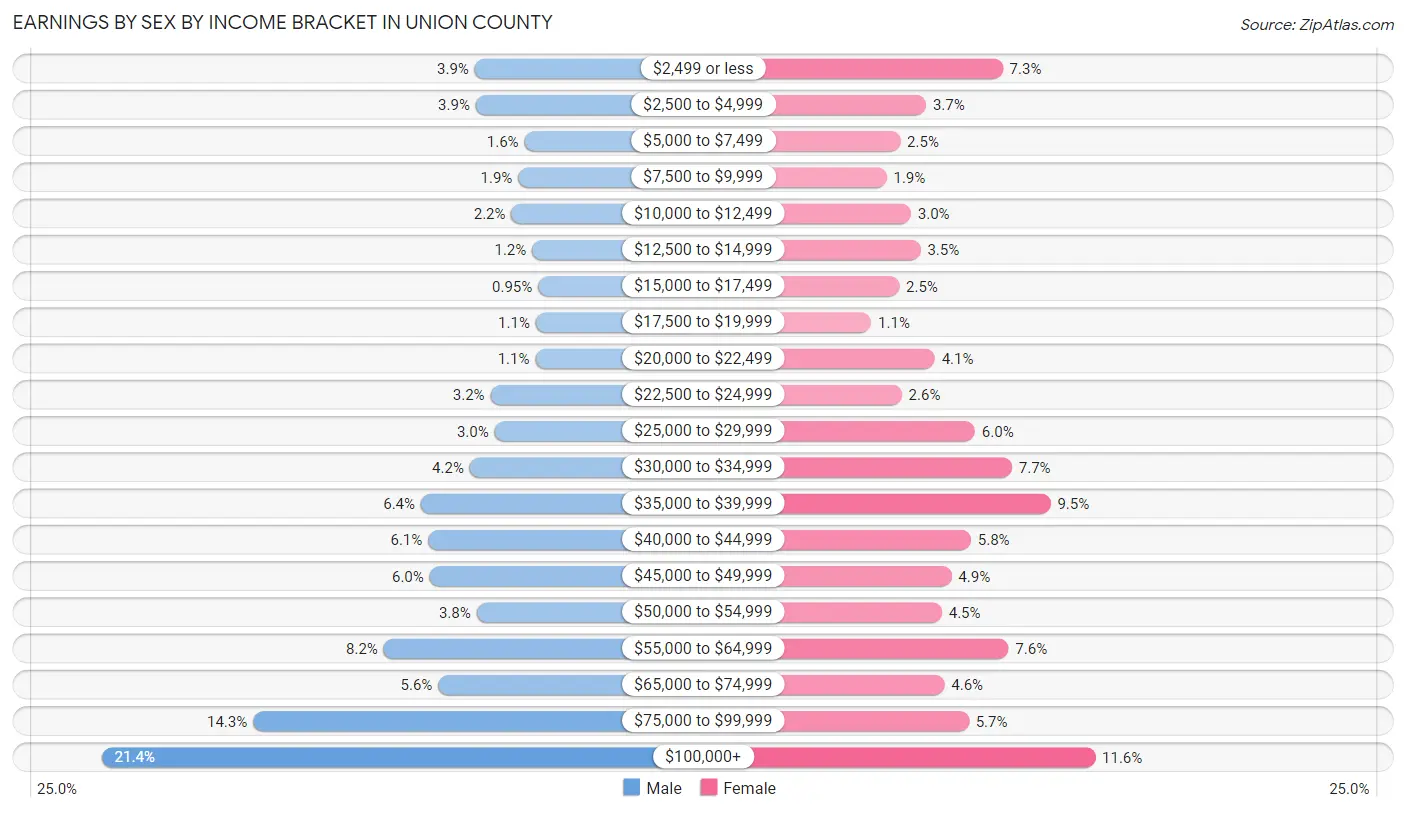
| Income | Male | Female |
| $2,499 or less | 207 (3.9%) | 307 (7.3%) |
| $2,500 to $4,999 | 204 (3.9%) | 156 (3.7%) |
| $5,000 to $7,499 | 84 (1.6%) | 105 (2.5%) |
| $7,500 to $9,999 | 99 (1.9%) | 78 (1.9%) |
| $10,000 to $12,499 | 116 (2.2%) | 126 (3.0%) |
| $12,500 to $14,999 | 65 (1.2%) | 145 (3.5%) |
| $15,000 to $17,499 | 50 (0.9%) | 103 (2.5%) |
| $17,500 to $19,999 | 56 (1.1%) | 48 (1.1%) |
| $20,000 to $22,499 | 57 (1.1%) | 173 (4.1%) |
| $22,500 to $24,999 | 168 (3.2%) | 108 (2.6%) |
| $25,000 to $29,999 | 158 (3.0%) | 252 (6.0%) |
| $30,000 to $34,999 | 219 (4.2%) | 325 (7.7%) |
| $35,000 to $39,999 | 340 (6.4%) | 401 (9.5%) |
| $40,000 to $44,999 | 322 (6.1%) | 244 (5.8%) |
| $45,000 to $49,999 | 318 (6.0%) | 206 (4.9%) |
| $50,000 to $54,999 | 202 (3.8%) | 187 (4.4%) |
| $55,000 to $64,999 | 432 (8.2%) | 318 (7.6%) |
| $65,000 to $74,999 | 297 (5.6%) | 192 (4.6%) |
| $75,000 to $99,999 | 755 (14.3%) | 240 (5.7%) |
| $100,000+ | 1,129 (21.4%) | 489 (11.6%) |
| Total | 5,278 (100.0%) | 4,203 (100.0%) |
Earnings by Sex by Educational Attainment in Union County
Average earnings in Union County are $61,526 for men and $40,836 for women, a difference of 33.6%. Men with an educational attainment of graduate degree enjoy the highest average annual earnings of $141,500, while those with less than high school education earn the least with $39,861. Women with an educational attainment of graduate degree earn the most with the average annual earnings of $72,045, while those with high school diploma education have the smallest earnings of $23,633.
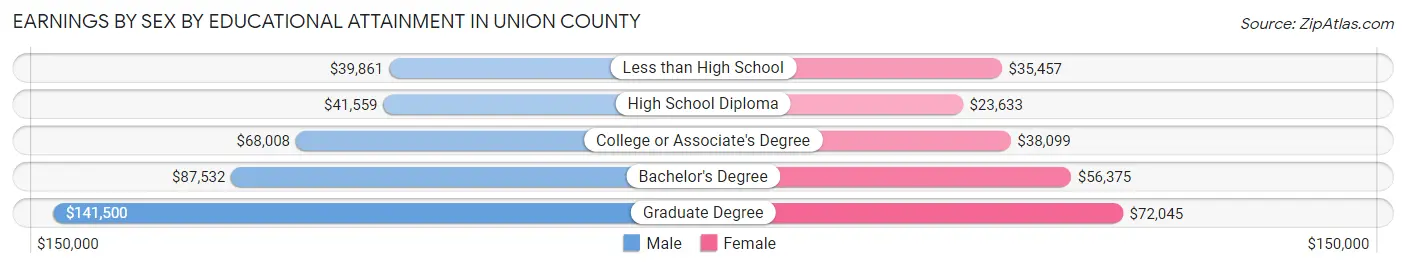
| Educational Attainment | Male Income | Female Income |
| Less than High School | $39,861 | $35,457 |
| High School Diploma | $41,559 | $23,633 |
| College or Associate's Degree | $68,008 | $38,099 |
| Bachelor's Degree | $87,532 | $56,375 |
| Graduate Degree | $141,500 | $72,045 |
| Total | $61,526 | $40,836 |
Family Income in Union County
Family Income Brackets in Union County
According to the Union County family income data, there are 1,109 families falling into the $100,000 to $149,999 income range, which is the most common income bracket and makes up 23.7% of all families. Conversely, the $10,000 to $14,999 income bracket is the least frequent group with only 103 families (2.2%) belonging to this category.
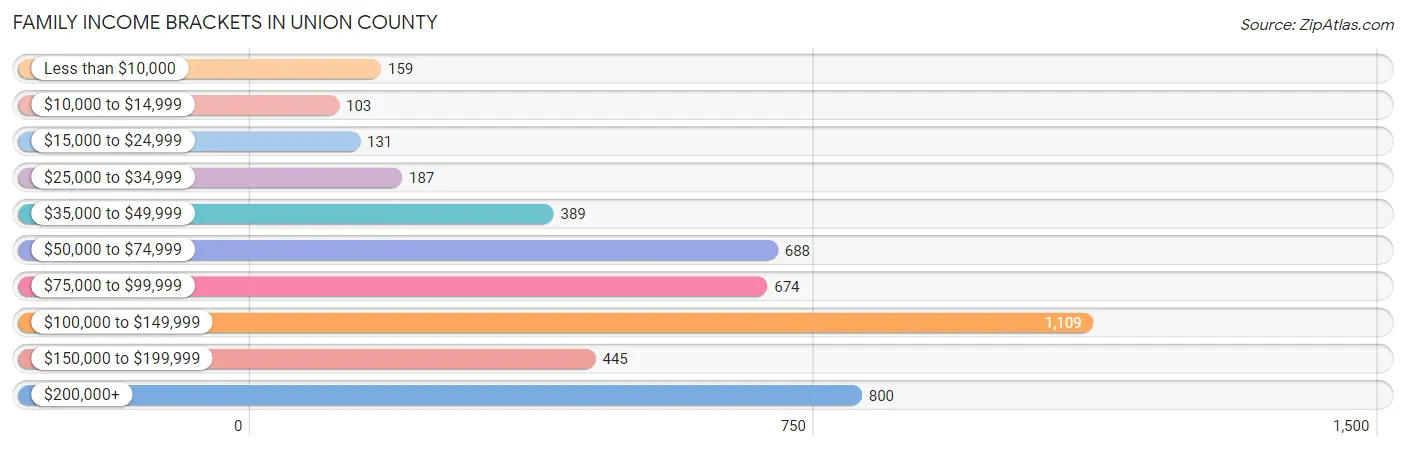
| Income Bracket | # Families | % Families |
| Less than $10,000 | 159 | 3.4% |
| $10,000 to $14,999 | 103 | 2.2% |
| $15,000 to $24,999 | 131 | 2.8% |
| $25,000 to $34,999 | 187 | 4.0% |
| $35,000 to $49,999 | 389 | 8.3% |
| $50,000 to $74,999 | 688 | 14.7% |
| $75,000 to $99,999 | 674 | 14.4% |
| $100,000 to $149,999 | 1,109 | 23.7% |
| $150,000 to $199,999 | 445 | 9.5% |
| $200,000+ | 800 | 17.1% |
Family Income by Famaliy Size in Union County
7+ person families (43 | 0.9%) account for the highest median family income in Union County with $146,991 per family, while 2-person families (2,731 | 58.3%) have the highest median income of $42,036 per family member.
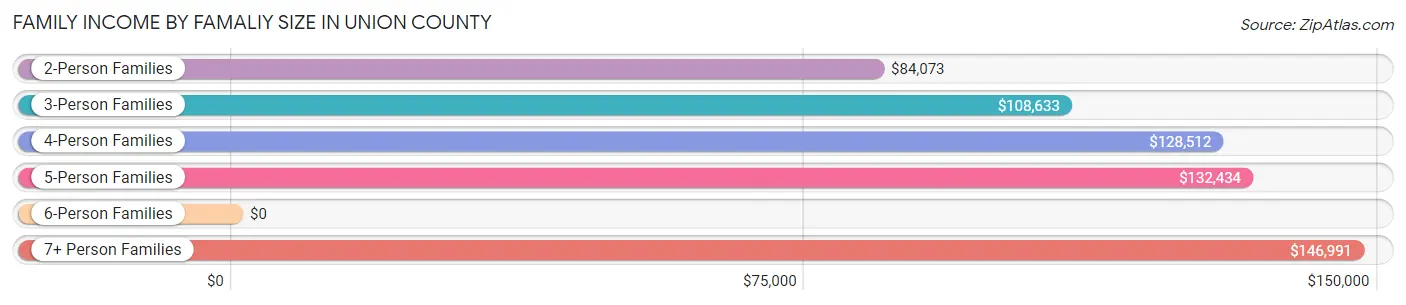
| Income Bracket | # Families | Median Income |
| 2-Person Families | 2,731 (58.3%) | $84,073 |
| 3-Person Families | 843 (18.0%) | $108,633 |
| 4-Person Families | 671 (14.3%) | $128,512 |
| 5-Person Families | 297 (6.3%) | $132,434 |
| 6-Person Families | 96 (2.1%) | $0 |
| 7+ Person Families | 43 (0.9%) | $146,991 |
| Total | 4,681 (100.0%) | $100,727 |
Family Income by Number of Earners in Union County
The median family income in Union County is $100,727, with families comprising 3+ earners (466) having the highest median family income of $184,444, while families with no earners (797) have the lowest median family income of $48,237, accounting for 10.0% and 17.0% of families, respectively.
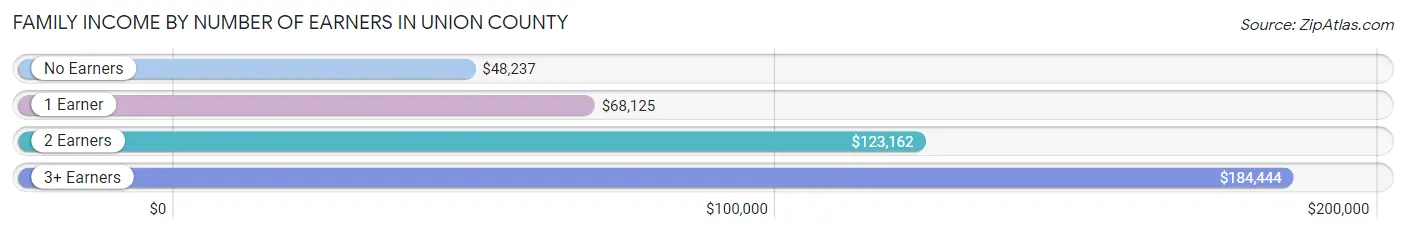
| Number of Earners | # Families | Median Income |
| No Earners | 797 (17.0%) | $48,237 |
| 1 Earner | 1,223 (26.1%) | $68,125 |
| 2 Earners | 2,195 (46.9%) | $123,162 |
| 3+ Earners | 466 (10.0%) | $184,444 |
| Total | 4,681 (100.0%) | $100,727 |
Household Income in Union County
Household Income Brackets in Union County
With 1,331 households falling in the category, the $100,000 to $149,999 income range is the most frequent in Union County, accounting for 19.1% of all households. In contrast, only 195 households (2.8%) fall into the $10,000 to $14,999 income bracket, making it the least populous group.
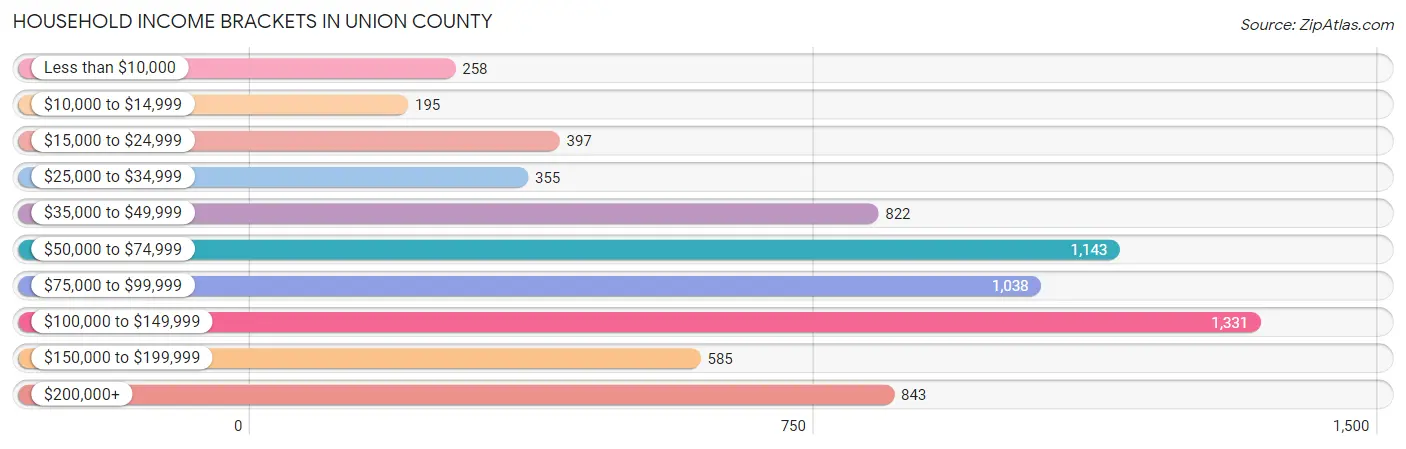
| Income Bracket | # Households | % Households |
| Less than $10,000 | 258 | 3.7% |
| $10,000 to $14,999 | 195 | 2.8% |
| $15,000 to $24,999 | 397 | 5.7% |
| $25,000 to $34,999 | 355 | 5.1% |
| $35,000 to $49,999 | 822 | 11.8% |
| $50,000 to $74,999 | 1,143 | 16.4% |
| $75,000 to $99,999 | 1,038 | 14.9% |
| $100,000 to $149,999 | 1,331 | 19.1% |
| $150,000 to $199,999 | 585 | 8.4% |
| $200,000+ | 843 | 12.1% |
Household Income by Householder Age in Union County
The median household income in Union County is $82,036, with the highest median household income of $110,542 found in the 45 to 64 years age bracket for the primary householder. A total of 2,425 households (34.8%) fall into this category. Meanwhile, the 65+ years age bracket for the primary householder has the lowest median household income of $50,000, with 1,862 households (26.7%) in this group.
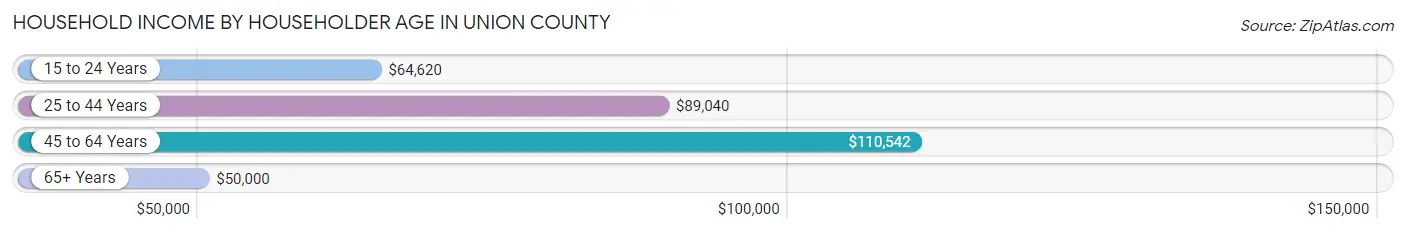
| Income Bracket | # Households | Median Income |
| 15 to 24 Years | 353 (5.1%) | $64,620 |
| 25 to 44 Years | 2,327 (33.4%) | $89,040 |
| 45 to 64 Years | 2,425 (34.8%) | $110,542 |
| 65+ Years | 1,862 (26.7%) | $50,000 |
| Total | 6,967 (100.0%) | $82,036 |
Poverty in Union County
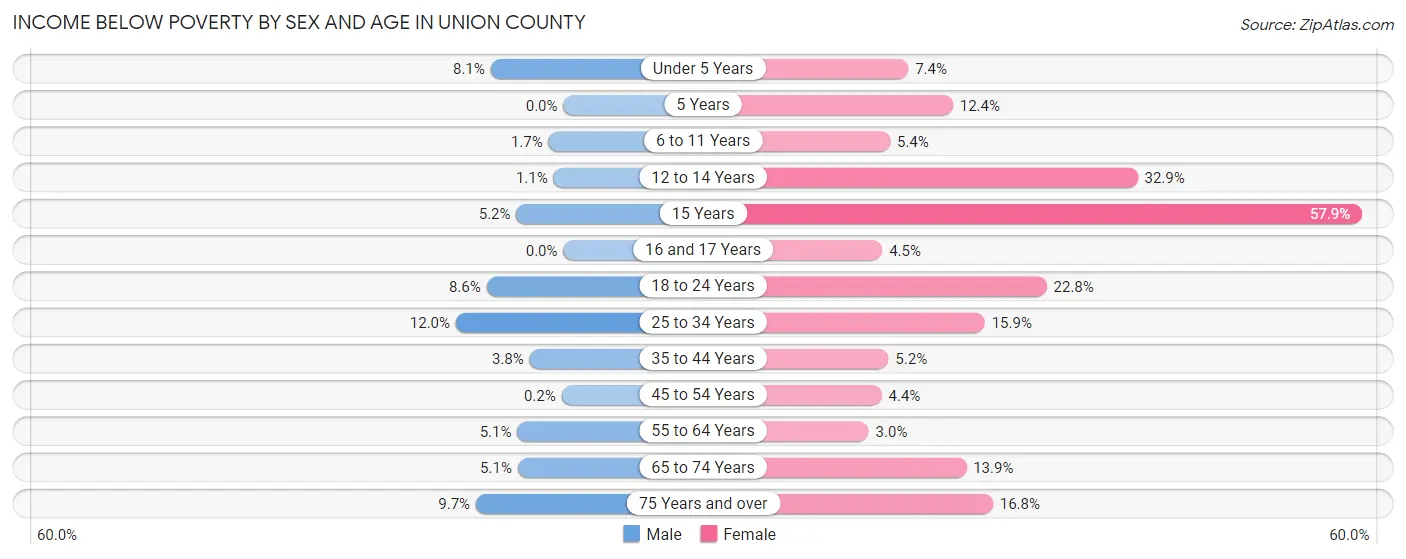
Income Below Poverty by Sex and Age in Union County
With 5.3% poverty level for males and 11.4% for females among the residents of Union County, 25 to 34 year old males and 15 year old females are the most vulnerable to poverty, with 140 males (12.0%) and 73 females (57.9%) in their respective age groups living below the poverty level.
| Age Bracket | Male | Female |
| Under 5 Years | 37 (8.1%) | 33 (7.4%) |
| 5 Years | 0 (0.0%) | 11 (12.4%) |
| 6 to 11 Years | 11 (1.7%) | 36 (5.4%) |
| 12 to 14 Years | 5 (1.1%) | 112 (32.9%) |
| 15 Years | 8 (5.2%) | 73 (57.9%) |
| 16 and 17 Years | 0 (0.0%) | 9 (4.5%) |
| 18 to 24 Years | 53 (8.6%) | 125 (22.8%) |
| 25 to 34 Years | 140 (12.0%) | 149 (15.9%) |
| 35 to 44 Years | 40 (3.8%) | 55 (5.2%) |
| 45 to 54 Years | 2 (0.2%) | 43 (4.4%) |
| 55 to 64 Years | 55 (5.1%) | 33 (3.0%) |
| 65 to 74 Years | 48 (5.1%) | 127 (13.9%) |
| 75 Years and over | 48 (9.7%) | 107 (16.8%) |
| Total | 447 (5.3%) | 913 (11.4%) |
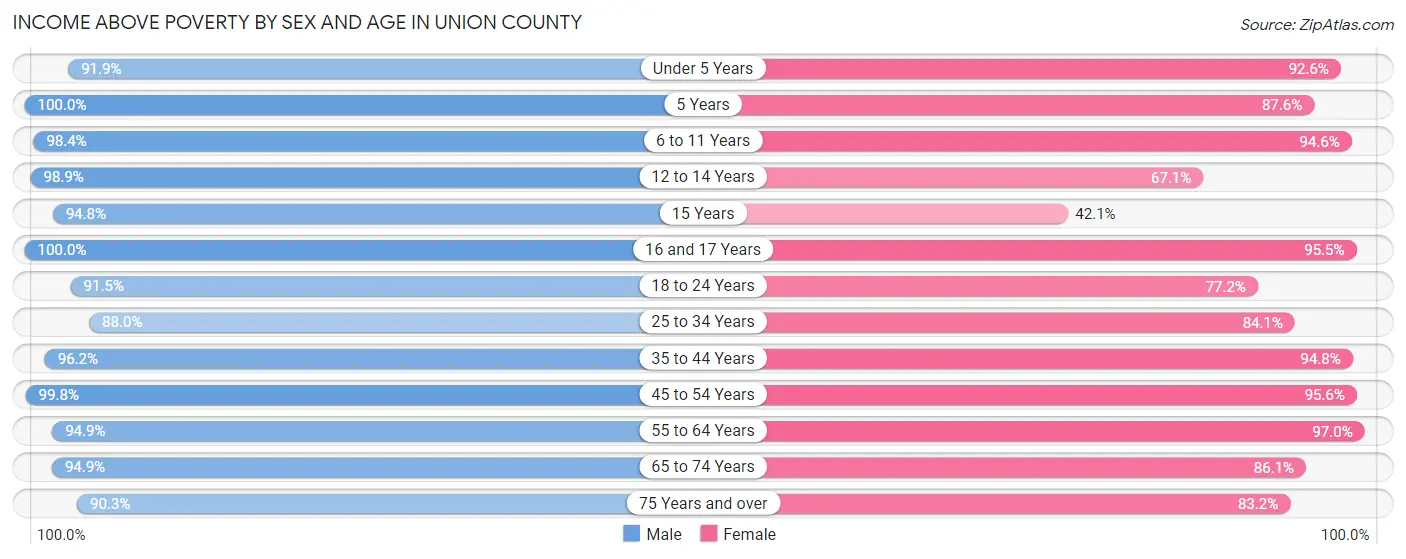
Income Above Poverty by Sex and Age in Union County
According to the poverty statistics in Union County, males aged 5 years and females aged 55 to 64 years are the age groups that are most secure financially, with 100.0% of males and 97.0% of females in these age groups living above the poverty line.
| Age Bracket | Male | Female |
| Under 5 Years | 420 (91.9%) | 413 (92.6%) |
| 5 Years | 112 (100.0%) | 78 (87.6%) |
| 6 to 11 Years | 654 (98.4%) | 634 (94.6%) |
| 12 to 14 Years | 454 (98.9%) | 228 (67.1%) |
| 15 Years | 145 (94.8%) | 53 (42.1%) |
| 16 and 17 Years | 252 (100.0%) | 191 (95.5%) |
| 18 to 24 Years | 567 (91.4%) | 423 (77.2%) |
| 25 to 34 Years | 1,030 (88.0%) | 787 (84.1%) |
| 35 to 44 Years | 1,024 (96.2%) | 1,005 (94.8%) |
| 45 to 54 Years | 980 (99.8%) | 927 (95.6%) |
| 55 to 64 Years | 1,018 (94.9%) | 1,070 (97.0%) |
| 65 to 74 Years | 897 (94.9%) | 789 (86.1%) |
| 75 Years and over | 445 (90.3%) | 529 (83.2%) |
| Total | 7,998 (94.7%) | 7,127 (88.6%) |
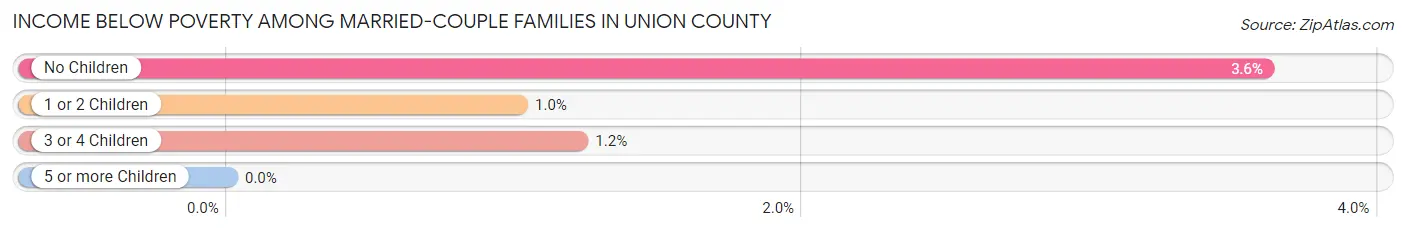
Income Below Poverty Among Married-Couple Families in Union County
The poverty statistics for married-couple families in Union County show that 2.8% or 108 of the total 3,876 families live below the poverty line. Families with no children have the highest poverty rate of 3.6%, comprising of 95 families. On the other hand, families with 5 or more children have the lowest poverty rate of 0.0%, which includes 0 families.
| Children | Above Poverty | Below Poverty |
| No Children | 2,537 (96.4%) | 95 (3.6%) |
| 1 or 2 Children | 880 (99.0%) | 9 (1.0%) |
| 3 or 4 Children | 324 (98.8%) | 4 (1.2%) |
| 5 or more Children | 27 (100.0%) | 0 (0.0%) |
| Total | 3,768 (97.2%) | 108 (2.8%) |
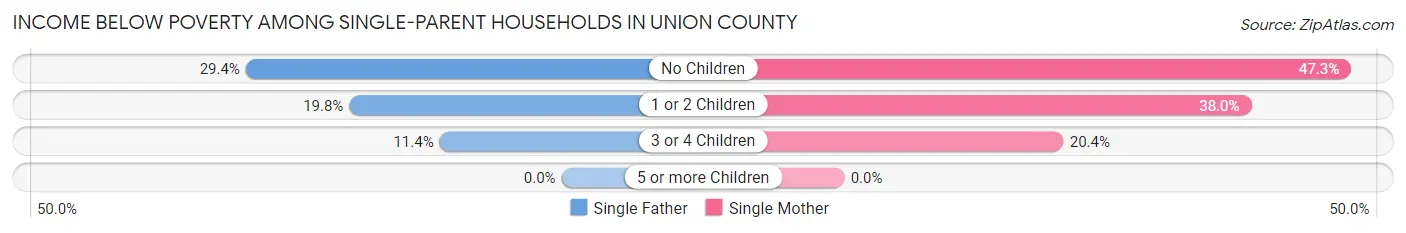
Income Below Poverty Among Single-Parent Households in Union County
According to the poverty data in Union County, 19.7% or 67 single-father households and 37.9% or 176 single-mother households are living below the poverty line. Among single-father households, those with no children have the highest poverty rate, with 10 households (29.4%) experiencing poverty. Likewise, among single-mother households, those with no children have the highest poverty rate, with 43 households (47.2%) falling below the poverty line.
| Children | Single Father | Single Mother |
| No Children | 10 (29.4%) | 43 (47.2%) |
| 1 or 2 Children | 52 (19.8%) | 123 (38.0%) |
| 3 or 4 Children | 5 (11.4%) | 10 (20.4%) |
| 5 or more Children | 0 (0.0%) | 0 (0.0%) |
| Total | 67 (19.7%) | 176 (37.9%) |
Income Below Poverty Among Married-Couple vs Single-Parent Households in Union County
The poverty data for Union County shows that 108 of the married-couple family households (2.8%) and 243 of the single-parent households (30.2%) are living below the poverty level. Within the married-couple family households, those with no children have the highest poverty rate, with 95 households (3.6%) falling below the poverty line. Among the single-parent households, those with no children have the highest poverty rate, with 53 household (42.4%) living below poverty.
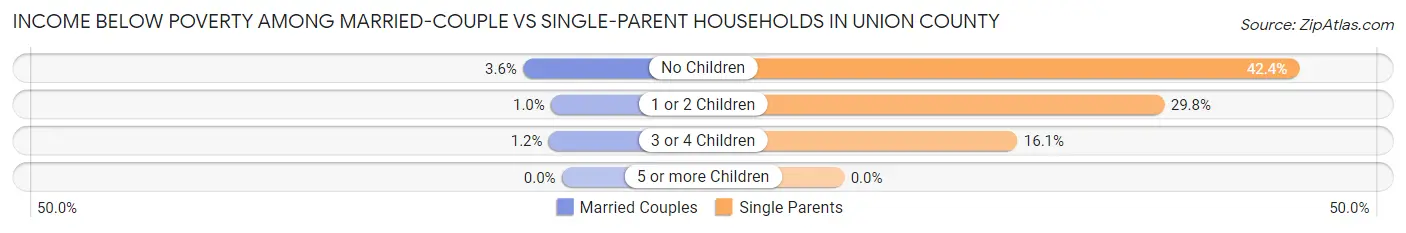
| Children | Married-Couple Families | Single-Parent Households |
| No Children | 95 (3.6%) | 53 (42.4%) |
| 1 or 2 Children | 9 (1.0%) | 175 (29.8%) |
| 3 or 4 Children | 4 (1.2%) | 15 (16.1%) |
| 5 or more Children | 0 (0.0%) | 0 (0.0%) |
| Total | 108 (2.8%) | 243 (30.2%) |
Employment Characteristics in Union County
Employment by Class of Employer in Union County
Among the 8,435 employed individuals in Union County, private company employees (5,990 | 71.0%), not-for-profit organizations (648 | 7.7%), and self-employed (not incorporated) (601 | 7.1%) make up the most common classes of employment.
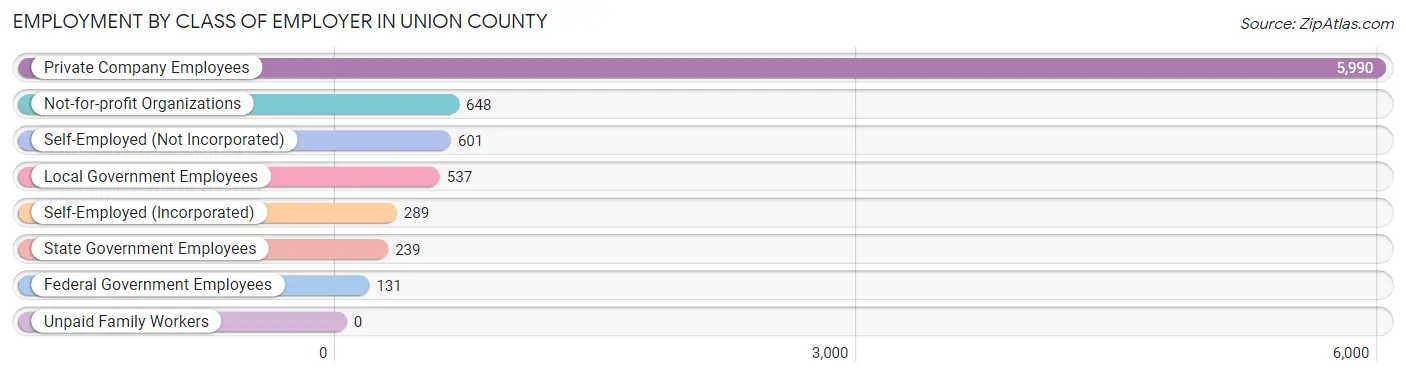
| Employer Class | # Employees | % Employees |
| Private Company Employees | 5,990 | 71.0% |
| Self-Employed (Incorporated) | 289 | 3.4% |
| Self-Employed (Not Incorporated) | 601 | 7.1% |
| Not-for-profit Organizations | 648 | 7.7% |
| Local Government Employees | 537 | 6.4% |
| State Government Employees | 239 | 2.8% |
| Federal Government Employees | 131 | 1.5% |
| Unpaid Family Workers | 0 | 0.0% |
| Total | 8,435 | 100.0% |
Employment Status by Age in Union County
According to the labor force statistics for Union County, out of the total population over 16 years of age (13,096), 67.3% or 8,814 individuals are in the labor force, with 3.0% or 264 of them unemployed. The age group with the highest labor force participation rate is 25 to 29 years, with 93.6% or 912 individuals in the labor force. Within the labor force, the 16 to 19 years age range has the highest percentage of unemployed individuals, with 10.7% or 51 of them being unemployed.
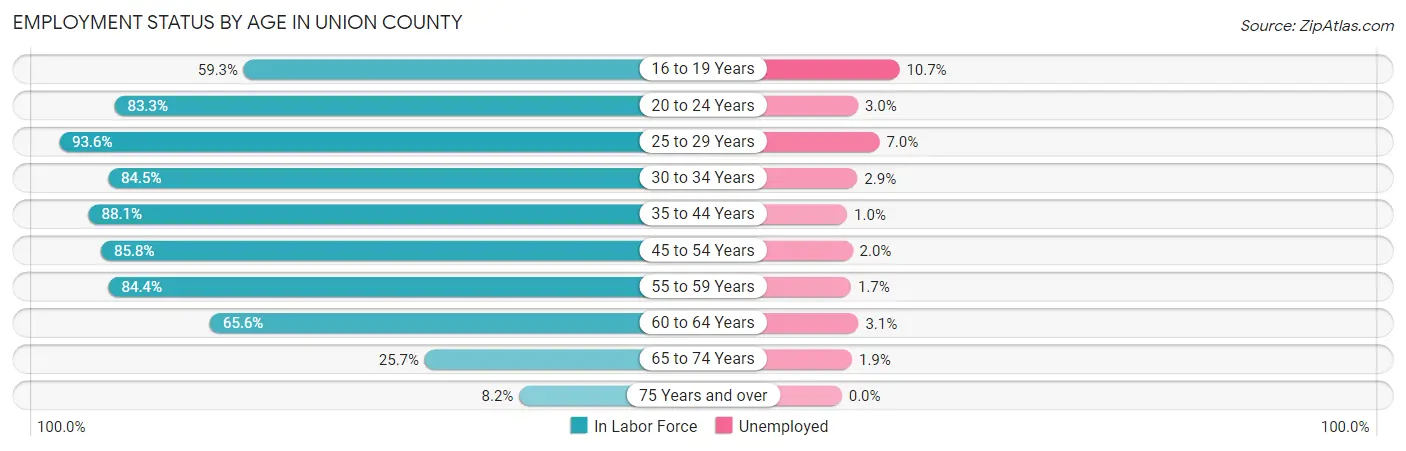
| Age Bracket | In Labor Force | Unemployed |
| 16 to 19 Years | 477 (59.3%) | 51 (10.7%) |
| 20 to 24 Years | 692 (83.3%) | 21 (3.0%) |
| 25 to 29 Years | 912 (93.6%) | 64 (7.0%) |
| 30 to 34 Years | 962 (84.5%) | 28 (2.9%) |
| 35 to 44 Years | 1,890 (88.1%) | 19 (1.0%) |
| 45 to 54 Years | 1,675 (85.8%) | 34 (2.0%) |
| 55 to 59 Years | 898 (84.4%) | 15 (1.7%) |
| 60 to 64 Years | 732 (65.6%) | 23 (3.1%) |
| 65 to 74 Years | 484 (25.7%) | 9 (1.9%) |
| 75 Years and over | 97 (8.2%) | 0 (0.0%) |
| Total | 8,814 (67.3%) | 264 (3.0%) |
Employment Status by Educational Attainment in Union County
According to labor force statistics for Union County, 84.3% of individuals (7,072) out of the total population between 25 and 64 years of age (8,389) are in the labor force, with 2.6% or 184 of them being unemployed. The group with the highest labor force participation rate are those with the educational attainment of bachelor's degree or higher, with 87.9% or 2,867 individuals in the labor force. Within the labor force, individuals with high school diploma education have the highest percentage of unemployment, with 6.0% or 101 of them being unemployed.
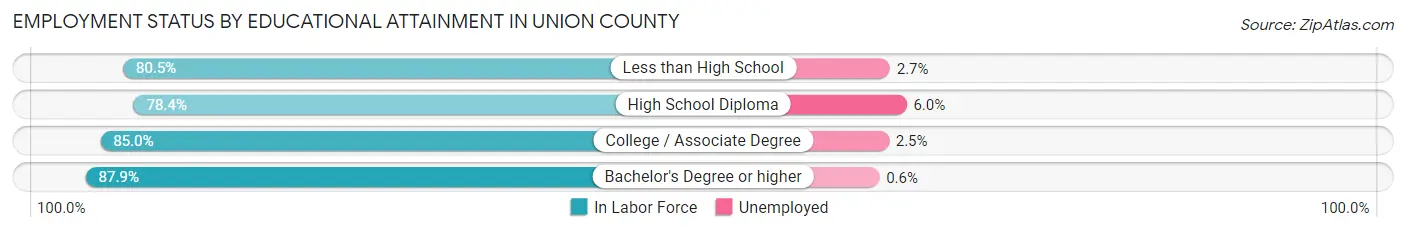
| Educational Attainment | In Labor Force | Unemployed |
| Less than High School | 297 (80.5%) | 10 (2.7%) |
| High School Diploma | 1,676 (78.4%) | 128 (6.0%) |
| College / Associate Degree | 2,227 (85.0%) | 66 (2.5%) |
| Bachelor's Degree or higher | 2,867 (87.9%) | 20 (0.6%) |
| Total | 7,072 (84.3%) | 218 (2.6%) |
Employment Occupations by Sex in Union County
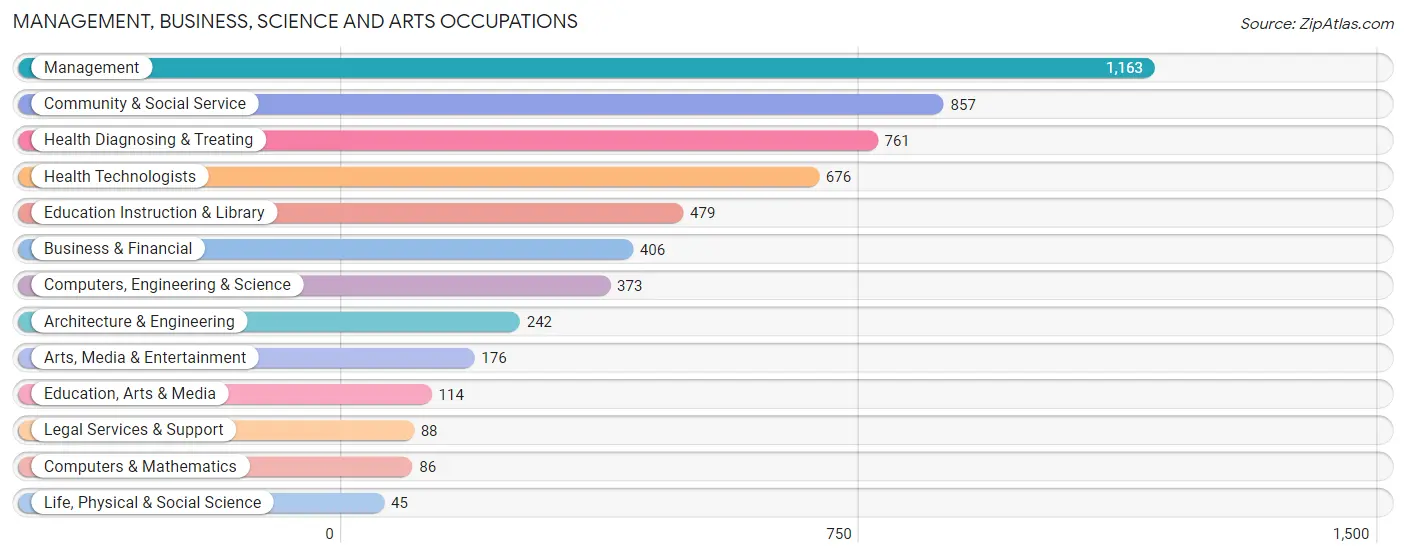
Management, Business, Science and Arts Occupations
The most common Management, Business, Science and Arts occupations in Union County are Management (1,163 | 13.7%), Community & Social Service (857 | 10.1%), Health Diagnosing & Treating (761 | 8.9%), Health Technologists (676 | 8.0%), and Education Instruction & Library (479 | 5.6%).
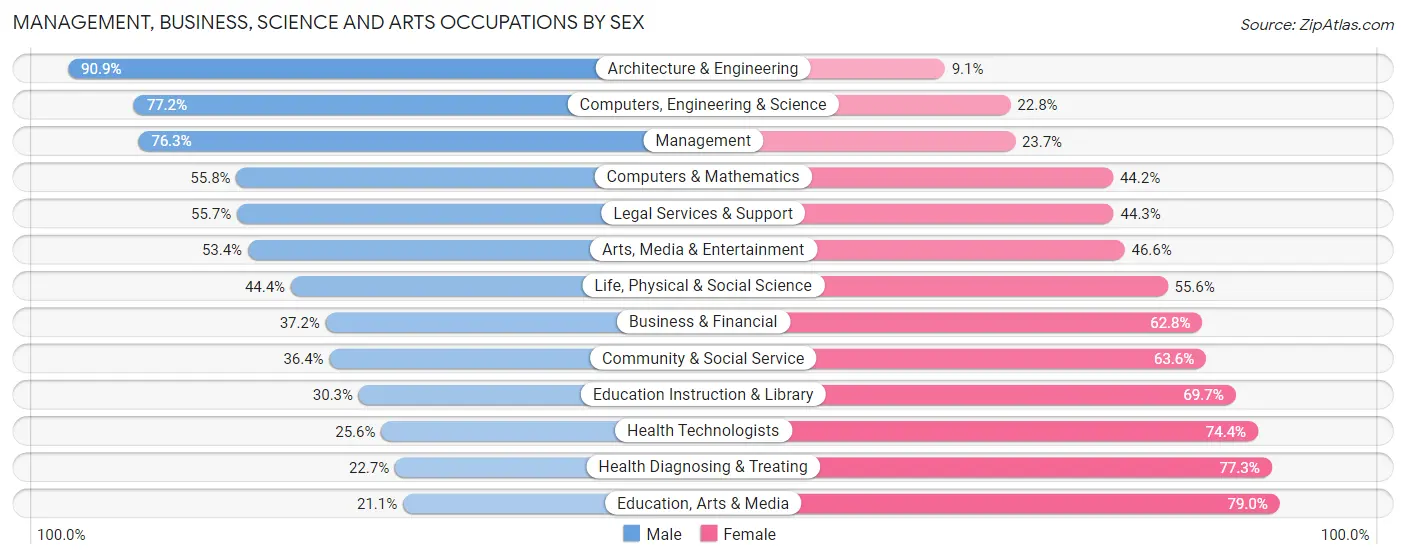
Management, Business, Science and Arts Occupations by Sex
Within the Management, Business, Science and Arts occupations in Union County, the most male-oriented occupations are Architecture & Engineering (90.9%), Computers, Engineering & Science (77.2%), and Management (76.3%), while the most female-oriented occupations are Education, Arts & Media (78.9%), Health Diagnosing & Treating (77.3%), and Health Technologists (74.4%).
| Occupation | Male | Female |
| Management | 887 (76.3%) | 276 (23.7%) |
| Business & Financial | 151 (37.2%) | 255 (62.8%) |
| Computers, Engineering & Science | 288 (77.2%) | 85 (22.8%) |
| Computers & Mathematics | 48 (55.8%) | 38 (44.2%) |
| Architecture & Engineering | 220 (90.9%) | 22 (9.1%) |
| Life, Physical & Social Science | 20 (44.4%) | 25 (55.6%) |
| Community & Social Service | 312 (36.4%) | 545 (63.6%) |
| Education, Arts & Media | 24 (21.0%) | 90 (78.9%) |
| Legal Services & Support | 49 (55.7%) | 39 (44.3%) |
| Education Instruction & Library | 145 (30.3%) | 334 (69.7%) |
| Arts, Media & Entertainment | 94 (53.4%) | 82 (46.6%) |
| Health Diagnosing & Treating | 173 (22.7%) | 588 (77.3%) |
| Health Technologists | 173 (25.6%) | 503 (74.4%) |
| Total (Category) | 1,811 (50.9%) | 1,749 (49.1%) |
| Total (Overall) | 4,773 (56.1%) | 3,734 (43.9%) |
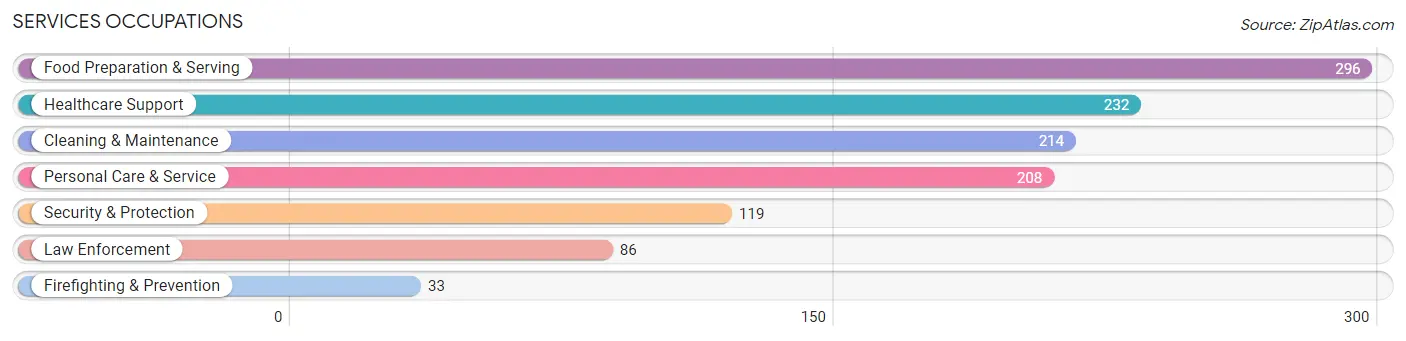
Services Occupations
The most common Services occupations in Union County are Food Preparation & Serving (296 | 3.5%), Healthcare Support (232 | 2.7%), Cleaning & Maintenance (214 | 2.5%), Personal Care & Service (208 | 2.5%), and Security & Protection (119 | 1.4%).
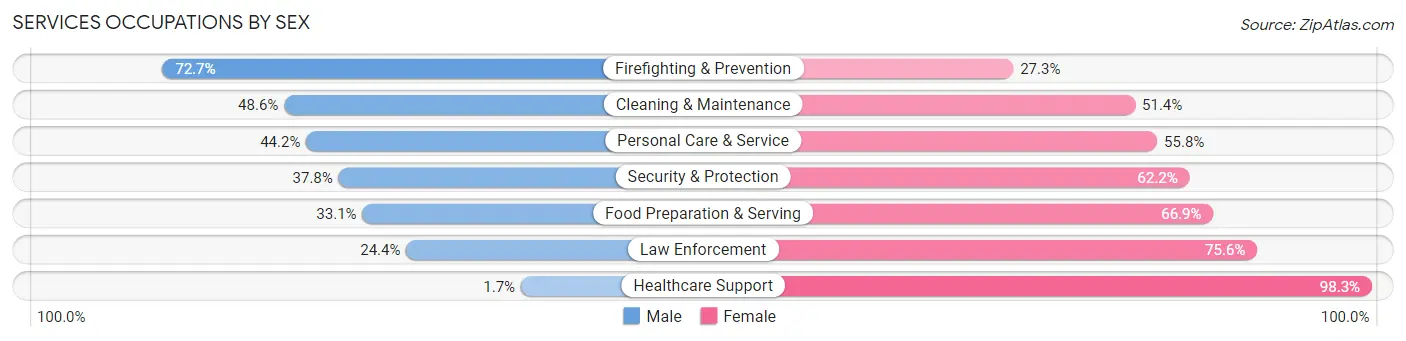
Services Occupations by Sex
Within the Services occupations in Union County, the most male-oriented occupations are Firefighting & Prevention (72.7%), Cleaning & Maintenance (48.6%), and Personal Care & Service (44.2%), while the most female-oriented occupations are Healthcare Support (98.3%), Law Enforcement (75.6%), and Food Preparation & Serving (66.9%).
| Occupation | Male | Female |
| Healthcare Support | 4 (1.7%) | 228 (98.3%) |
| Security & Protection | 45 (37.8%) | 74 (62.2%) |
| Firefighting & Prevention | 24 (72.7%) | 9 (27.3%) |
| Law Enforcement | 21 (24.4%) | 65 (75.6%) |
| Food Preparation & Serving | 98 (33.1%) | 198 (66.9%) |
| Cleaning & Maintenance | 104 (48.6%) | 110 (51.4%) |
| Personal Care & Service | 92 (44.2%) | 116 (55.8%) |
| Total (Category) | 343 (32.1%) | 726 (67.9%) |
| Total (Overall) | 4,773 (56.1%) | 3,734 (43.9%) |
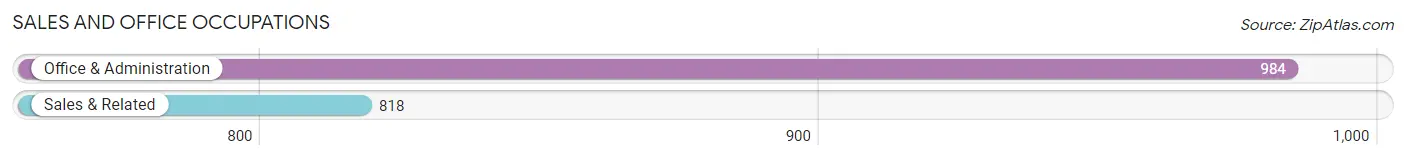
Sales and Office Occupations
The most common Sales and Office occupations in Union County are Office & Administration (984 | 11.6%), and Sales & Related (818 | 9.6%).
Sales and Office Occupations by Sex
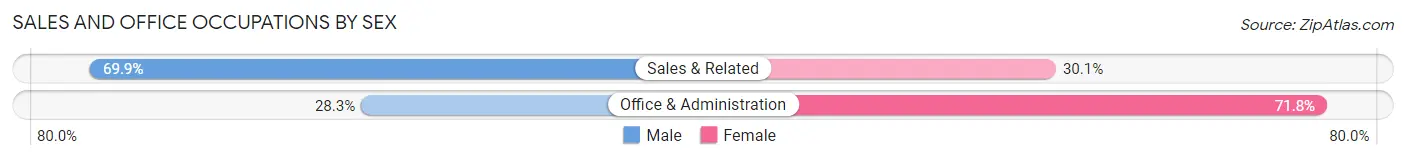
| Occupation | Male | Female |
| Sales & Related | 572 (69.9%) | 246 (30.1%) |
| Office & Administration | 278 (28.2%) | 706 (71.8%) |
| Total (Category) | 850 (47.2%) | 952 (52.8%) |
| Total (Overall) | 4,773 (56.1%) | 3,734 (43.9%) |
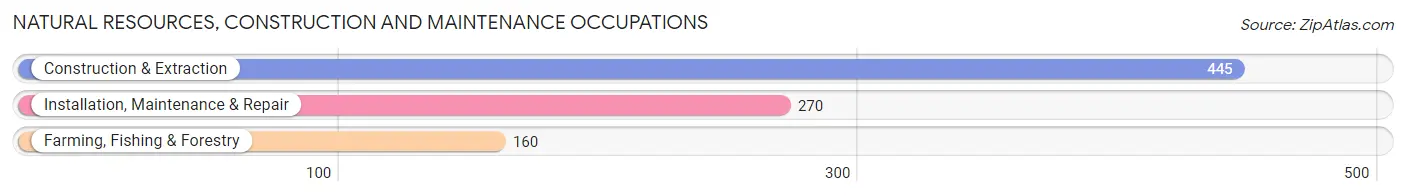
Natural Resources, Construction and Maintenance Occupations
The most common Natural Resources, Construction and Maintenance occupations in Union County are Construction & Extraction (445 | 5.2%), Installation, Maintenance & Repair (270 | 3.2%), and Farming, Fishing & Forestry (160 | 1.9%).
Natural Resources, Construction and Maintenance Occupations by Sex
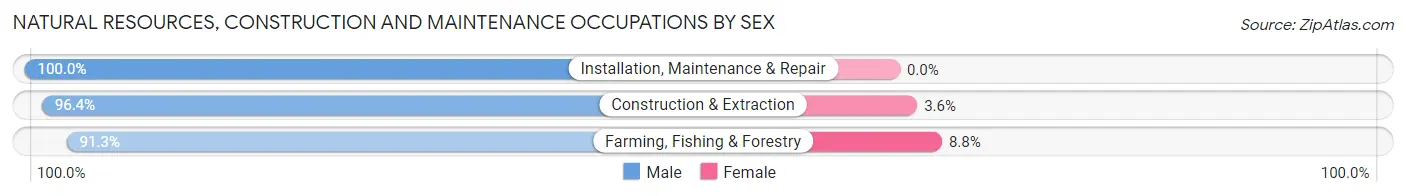
| Occupation | Male | Female |
| Farming, Fishing & Forestry | 146 (91.2%) | 14 (8.7%) |
| Construction & Extraction | 429 (96.4%) | 16 (3.6%) |
| Installation, Maintenance & Repair | 270 (100.0%) | 0 (0.0%) |
| Total (Category) | 845 (96.6%) | 30 (3.4%) |
| Total (Overall) | 4,773 (56.1%) | 3,734 (43.9%) |
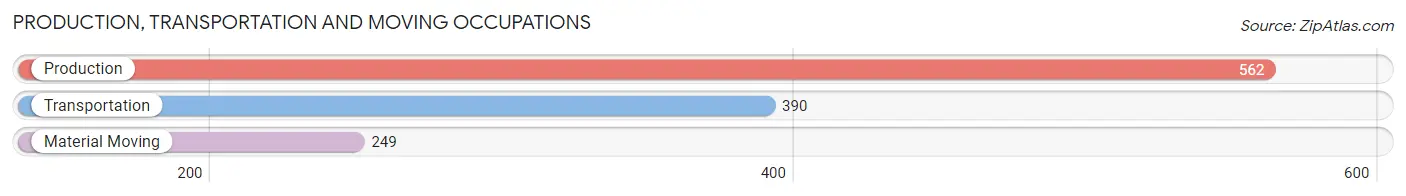
Production, Transportation and Moving Occupations
The most common Production, Transportation and Moving occupations in Union County are Production (562 | 6.6%), Transportation (390 | 4.6%), and Material Moving (249 | 2.9%).
Production, Transportation and Moving Occupations by Sex
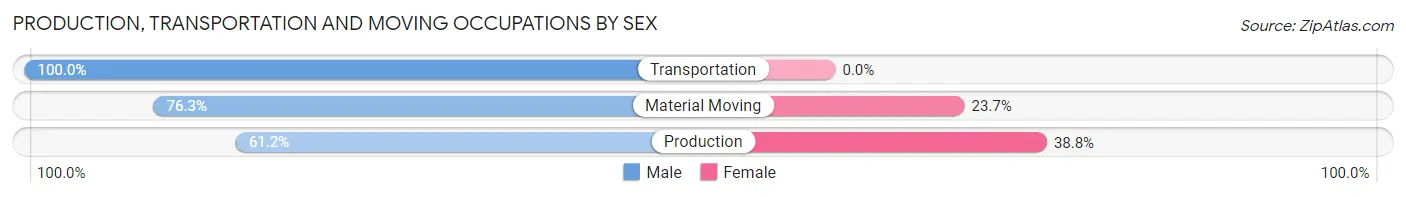
| Occupation | Male | Female |
| Production | 344 (61.2%) | 218 (38.8%) |
| Transportation | 390 (100.0%) | 0 (0.0%) |
| Material Moving | 190 (76.3%) | 59 (23.7%) |
| Total (Category) | 924 (76.9%) | 277 (23.1%) |
| Total (Overall) | 4,773 (56.1%) | 3,734 (43.9%) |
Employment Industries by Sex in Union County
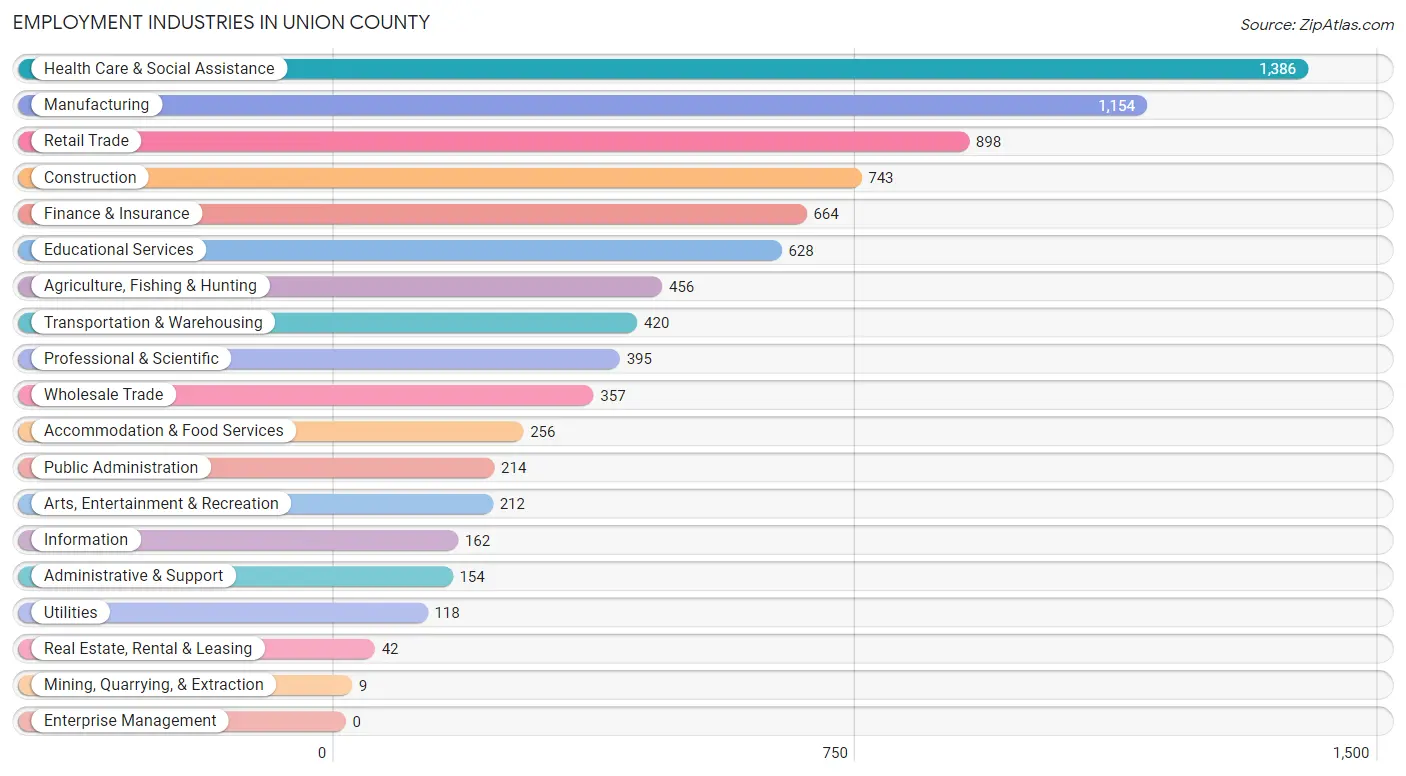
Employment Industries in Union County
The major employment industries in Union County include Health Care & Social Assistance (1,386 | 16.3%), Manufacturing (1,154 | 13.6%), Retail Trade (898 | 10.6%), Construction (743 | 8.7%), and Finance & Insurance (664 | 7.8%).
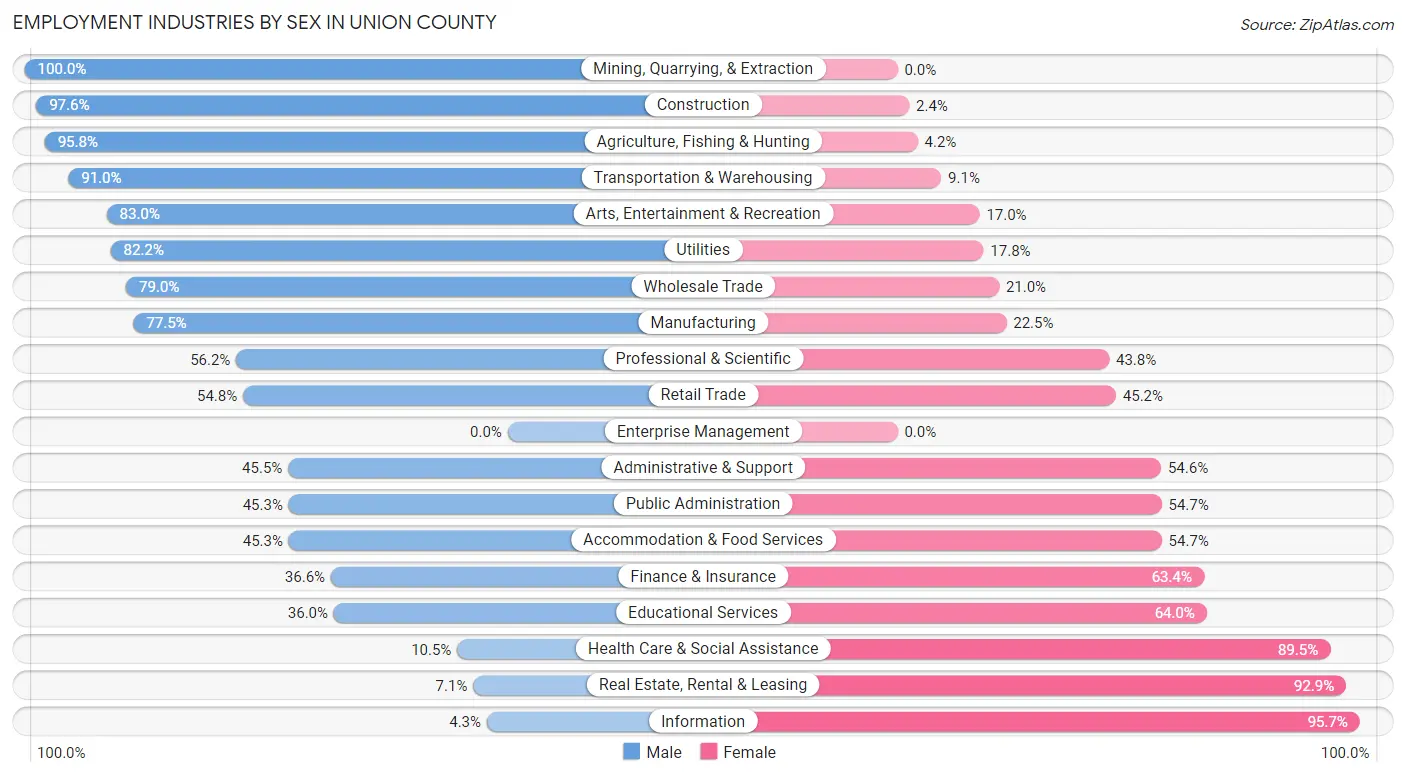
Employment Industries by Sex in Union County
The Union County industries that see more men than women are Mining, Quarrying, & Extraction (100.0%), Construction (97.6%), and Agriculture, Fishing & Hunting (95.8%), whereas the industries that tend to have a higher number of women are Information (95.7%), Real Estate, Rental & Leasing (92.9%), and Health Care & Social Assistance (89.5%).
| Industry | Male | Female |
| Agriculture, Fishing & Hunting | 437 (95.8%) | 19 (4.2%) |
| Mining, Quarrying, & Extraction | 9 (100.0%) | 0 (0.0%) |
| Construction | 725 (97.6%) | 18 (2.4%) |
| Manufacturing | 894 (77.5%) | 260 (22.5%) |
| Wholesale Trade | 282 (79.0%) | 75 (21.0%) |
| Retail Trade | 492 (54.8%) | 406 (45.2%) |
| Transportation & Warehousing | 382 (90.9%) | 38 (9.0%) |
| Utilities | 97 (82.2%) | 21 (17.8%) |
| Information | 7 (4.3%) | 155 (95.7%) |
| Finance & Insurance | 243 (36.6%) | 421 (63.4%) |
| Real Estate, Rental & Leasing | 3 (7.1%) | 39 (92.9%) |
| Professional & Scientific | 222 (56.2%) | 173 (43.8%) |
| Enterprise Management | 0 (0.0%) | 0 (0.0%) |
| Administrative & Support | 70 (45.5%) | 84 (54.5%) |
| Educational Services | 226 (36.0%) | 402 (64.0%) |
| Health Care & Social Assistance | 145 (10.5%) | 1,241 (89.5%) |
| Arts, Entertainment & Recreation | 176 (83.0%) | 36 (17.0%) |
| Accommodation & Food Services | 116 (45.3%) | 140 (54.7%) |
| Public Administration | 97 (45.3%) | 117 (54.7%) |
| Total | 4,773 (56.1%) | 3,734 (43.9%) |
Education in Union County
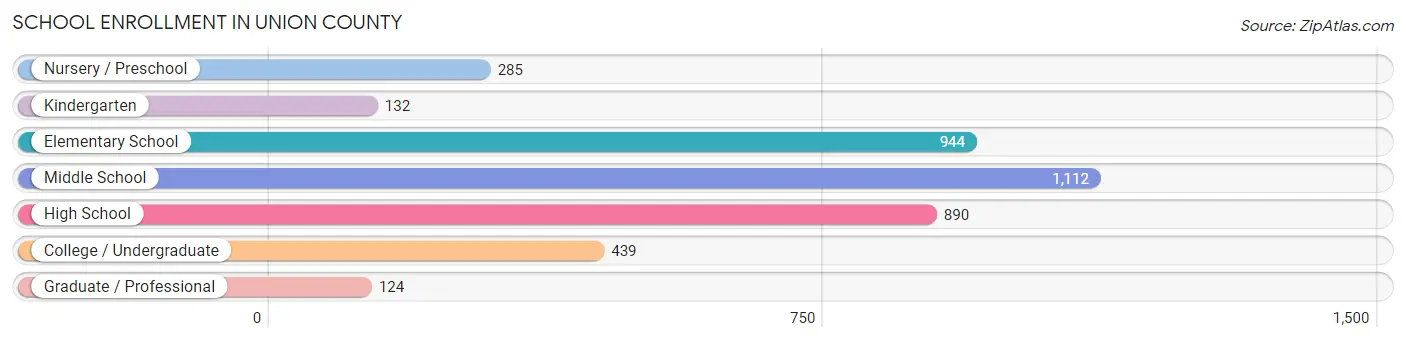
School Enrollment in Union County
The most common levels of schooling among the 3,926 students in Union County are middle school (1,112 | 28.3%), elementary school (944 | 24.0%), and high school (890 | 22.7%).
| School Level | # Students | % Students |
| Nursery / Preschool | 285 | 7.3% |
| Kindergarten | 132 | 3.4% |
| Elementary School | 944 | 24.0% |
| Middle School | 1,112 | 28.3% |
| High School | 890 | 22.7% |
| College / Undergraduate | 439 | 11.2% |
| Graduate / Professional | 124 | 3.2% |
| Total | 3,926 | 100.0% |
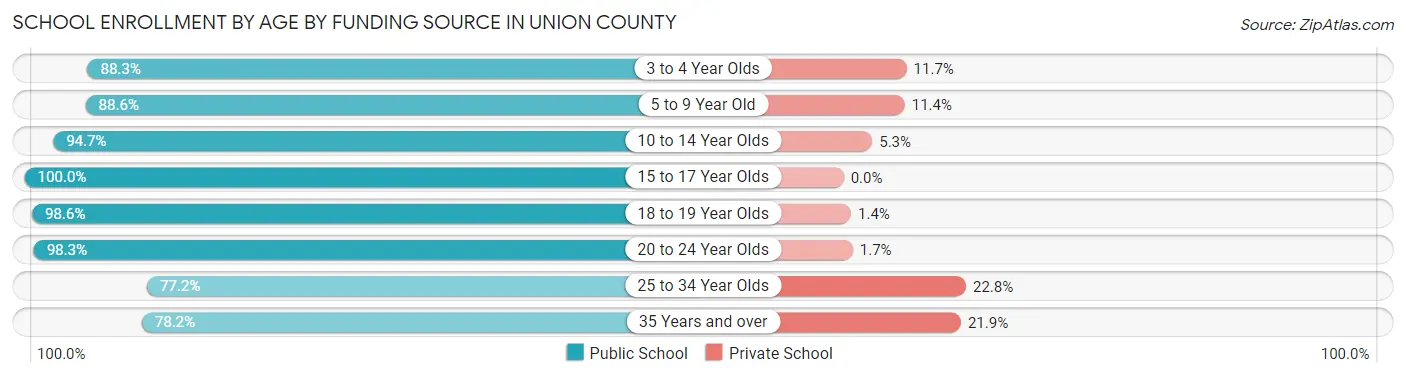
School Enrollment by Age by Funding Source in Union County
Out of a total of 3,926 students who are enrolled in schools in Union County, 287 (7.3%) attend a private institution, while the remaining 3,639 (92.7%) are enrolled in public schools. The age group of 25 to 34 year olds has the highest likelihood of being enrolled in private schools, with 44 (22.8% in the age bracket) enrolled. Conversely, the age group of 15 to 17 year olds has the lowest likelihood of being enrolled in a private school, with 651 (100.0% in the age bracket) attending a public institution.
| Age Bracket | Public School | Private School |
| 3 to 4 Year Olds | 143 (88.3%) | 19 (11.7%) |
| 5 to 9 Year Old | 958 (88.6%) | 123 (11.4%) |
| 10 to 14 Year Olds | 1,189 (94.7%) | 67 (5.3%) |
| 15 to 17 Year Olds | 651 (100.0%) | 0 (0.0%) |
| 18 to 19 Year Olds | 285 (98.6%) | 4 (1.4%) |
| 20 to 24 Year Olds | 172 (98.3%) | 3 (1.7%) |
| 25 to 34 Year Olds | 149 (77.2%) | 44 (22.8%) |
| 35 Years and over | 93 (78.1%) | 26 (21.8%) |
| Total | 3,639 (92.7%) | 287 (7.3%) |
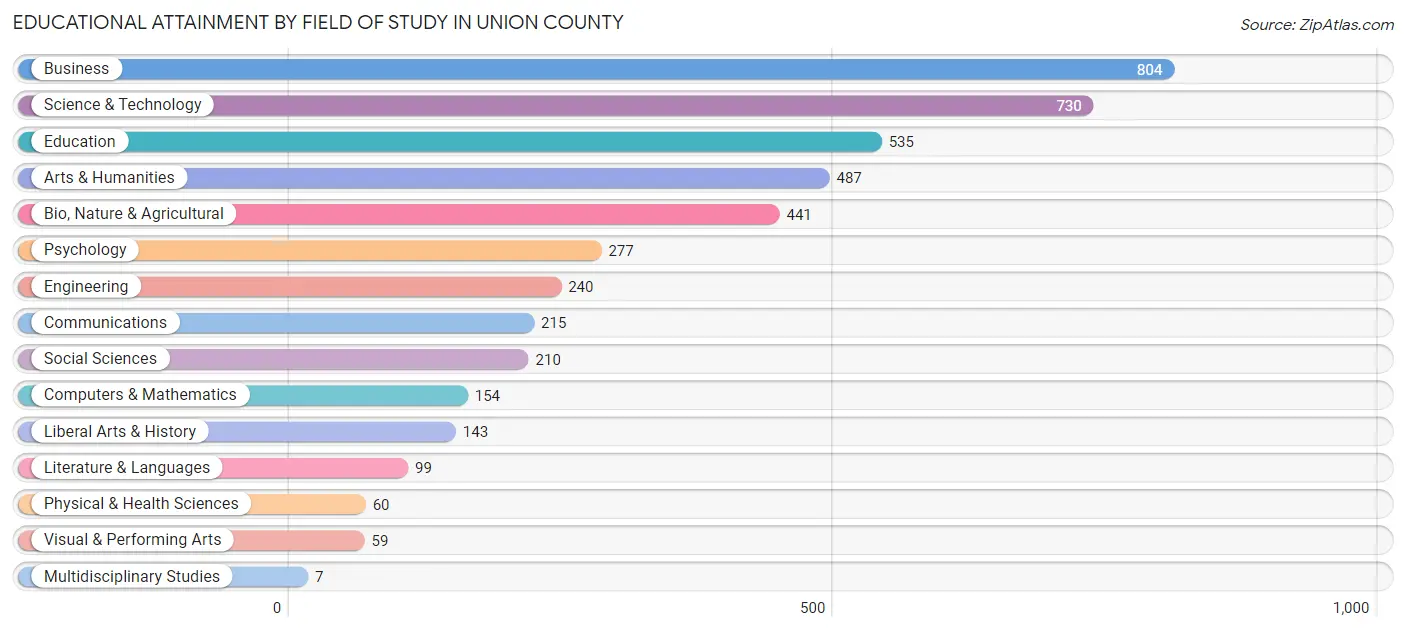
Educational Attainment by Field of Study in Union County
Business (804 | 18.0%), science & technology (730 | 16.4%), education (535 | 12.0%), arts & humanities (487 | 10.9%), and bio, nature & agricultural (441 | 9.9%) are the most common fields of study among 4,461 individuals in Union County who have obtained a bachelor's degree or higher.
| Field of Study | # Graduates | % Graduates |
| Computers & Mathematics | 154 | 3.5% |
| Bio, Nature & Agricultural | 441 | 9.9% |
| Physical & Health Sciences | 60 | 1.3% |
| Psychology | 277 | 6.2% |
| Social Sciences | 210 | 4.7% |
| Engineering | 240 | 5.4% |
| Multidisciplinary Studies | 7 | 0.2% |
| Science & Technology | 730 | 16.4% |
| Business | 804 | 18.0% |
| Education | 535 | 12.0% |
| Literature & Languages | 99 | 2.2% |
| Liberal Arts & History | 143 | 3.2% |
| Visual & Performing Arts | 59 | 1.3% |
| Communications | 215 | 4.8% |
| Arts & Humanities | 487 | 10.9% |
| Total | 4,461 | 100.0% |
Transportation & Commute in Union County
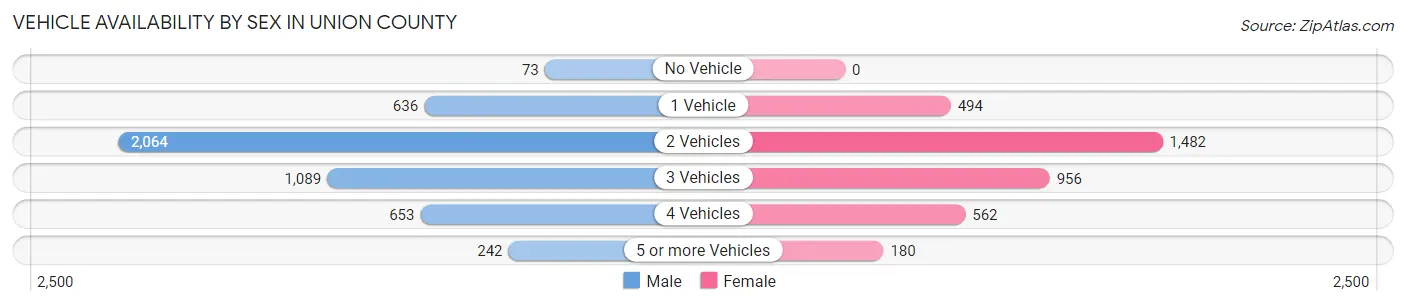
Vehicle Availability by Sex in Union County
The most prevalent vehicle ownership categories in Union County are males with 2 vehicles (2,064, accounting for 43.4%) and females with 2 vehicles (1,482, making up 56.2%).
| Vehicles Available | Male | Female |
| No Vehicle | 73 (1.5%) | 0 (0.0%) |
| 1 Vehicle | 636 (13.4%) | 494 (13.5%) |
| 2 Vehicles | 2,064 (43.4%) | 1,482 (40.3%) |
| 3 Vehicles | 1,089 (22.9%) | 956 (26.0%) |
| 4 Vehicles | 653 (13.7%) | 562 (15.3%) |
| 5 or more Vehicles | 242 (5.1%) | 180 (4.9%) |
| Total | 4,757 (100.0%) | 3,674 (100.0%) |
Commute Time in Union County
The most frequently occuring commute durations in Union County are 5 to 9 minutes (1,586 commuters, 20.3%), 15 to 19 minutes (1,340 commuters, 17.2%), and 10 to 14 minutes (1,083 commuters, 13.9%).
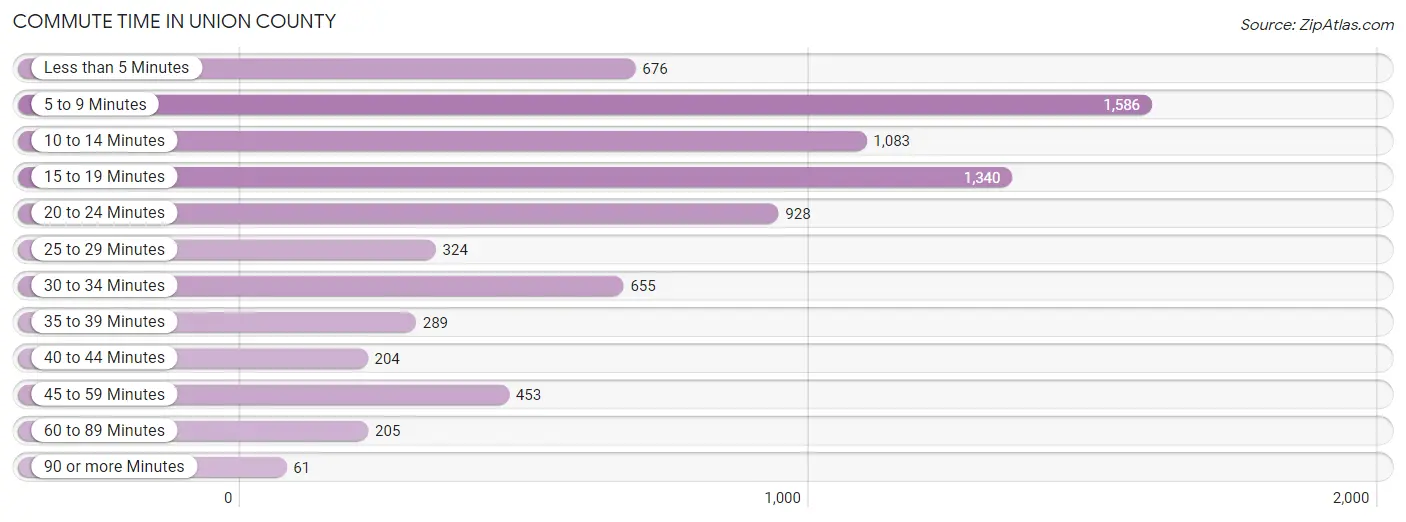
| Commute Time | # Commuters | % Commuters |
| Less than 5 Minutes | 676 | 8.7% |
| 5 to 9 Minutes | 1,586 | 20.3% |
| 10 to 14 Minutes | 1,083 | 13.9% |
| 15 to 19 Minutes | 1,340 | 17.2% |
| 20 to 24 Minutes | 928 | 11.9% |
| 25 to 29 Minutes | 324 | 4.2% |
| 30 to 34 Minutes | 655 | 8.4% |
| 35 to 39 Minutes | 289 | 3.7% |
| 40 to 44 Minutes | 204 | 2.6% |
| 45 to 59 Minutes | 453 | 5.8% |
| 60 to 89 Minutes | 205 | 2.6% |
| 90 or more Minutes | 61 | 0.8% |
Commute Time by Sex in Union County
The most common commute times in Union County are 5 to 9 minutes (906 commuters, 20.8%) for males and 5 to 9 minutes (680 commuters, 19.8%) for females.
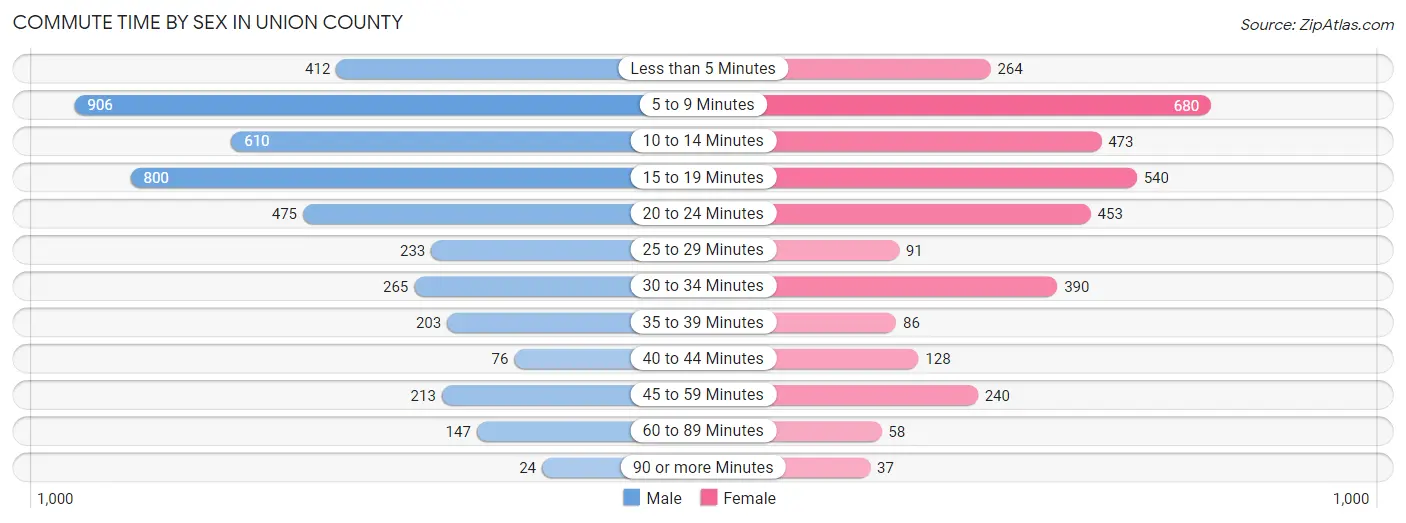
| Commute Time | Male | Female |
| Less than 5 Minutes | 412 (9.4%) | 264 (7.7%) |
| 5 to 9 Minutes | 906 (20.8%) | 680 (19.8%) |
| 10 to 14 Minutes | 610 (14.0%) | 473 (13.8%) |
| 15 to 19 Minutes | 800 (18.3%) | 540 (15.7%) |
| 20 to 24 Minutes | 475 (10.9%) | 453 (13.2%) |
| 25 to 29 Minutes | 233 (5.3%) | 91 (2.6%) |
| 30 to 34 Minutes | 265 (6.1%) | 390 (11.3%) |
| 35 to 39 Minutes | 203 (4.6%) | 86 (2.5%) |
| 40 to 44 Minutes | 76 (1.7%) | 128 (3.7%) |
| 45 to 59 Minutes | 213 (4.9%) | 240 (7.0%) |
| 60 to 89 Minutes | 147 (3.4%) | 58 (1.7%) |
| 90 or more Minutes | 24 (0.5%) | 37 (1.1%) |
Time of Departure to Work by Sex in Union County
The most frequent times of departure to work in Union County are 7:00 AM to 7:29 AM (886, 20.3%) for males and 7:00 AM to 7:29 AM (881, 25.6%) for females.
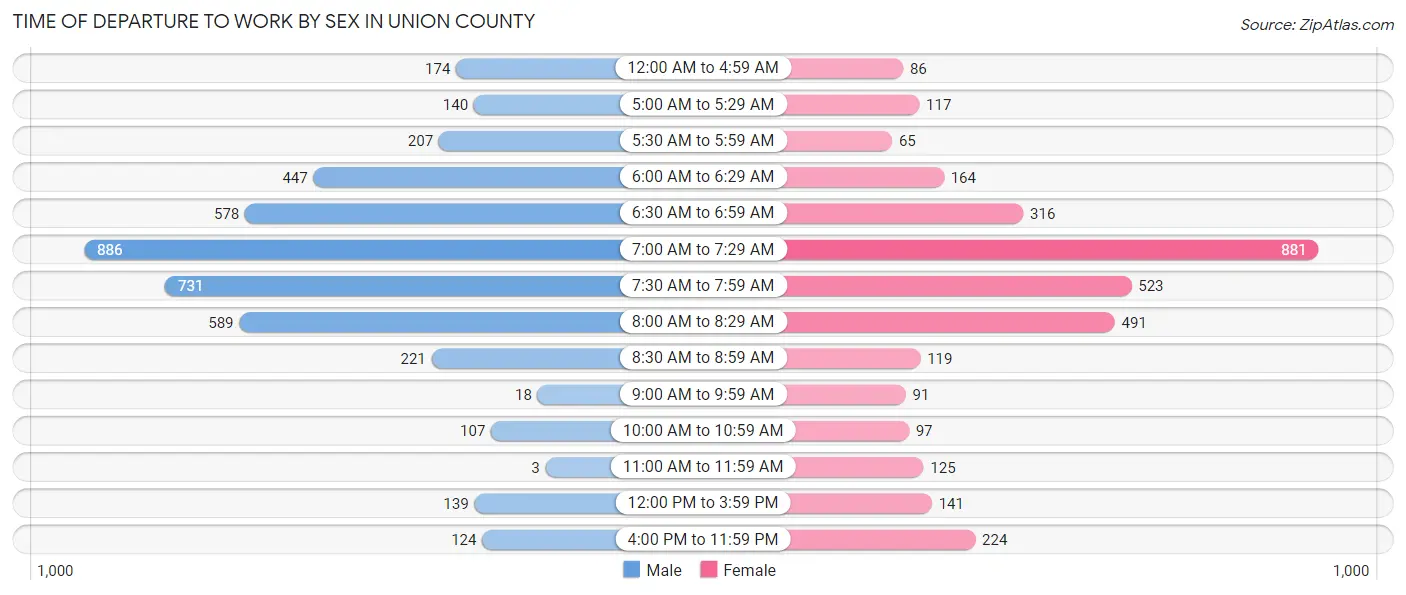
| Time of Departure | Male | Female |
| 12:00 AM to 4:59 AM | 174 (4.0%) | 86 (2.5%) |
| 5:00 AM to 5:29 AM | 140 (3.2%) | 117 (3.4%) |
| 5:30 AM to 5:59 AM | 207 (4.7%) | 65 (1.9%) |
| 6:00 AM to 6:29 AM | 447 (10.2%) | 164 (4.8%) |
| 6:30 AM to 6:59 AM | 578 (13.2%) | 316 (9.2%) |
| 7:00 AM to 7:29 AM | 886 (20.3%) | 881 (25.6%) |
| 7:30 AM to 7:59 AM | 731 (16.8%) | 523 (15.2%) |
| 8:00 AM to 8:29 AM | 589 (13.5%) | 491 (14.3%) |
| 8:30 AM to 8:59 AM | 221 (5.1%) | 119 (3.5%) |
| 9:00 AM to 9:59 AM | 18 (0.4%) | 91 (2.6%) |
| 10:00 AM to 10:59 AM | 107 (2.5%) | 97 (2.8%) |
| 11:00 AM to 11:59 AM | 3 (0.1%) | 125 (3.6%) |
| 12:00 PM to 3:59 PM | 139 (3.2%) | 141 (4.1%) |
| 4:00 PM to 11:59 PM | 124 (2.8%) | 224 (6.5%) |
| Total | 4,364 (100.0%) | 3,440 (100.0%) |
Housing Occupancy in Union County
Occupancy by Ownership in Union County
Of the total 6,967 dwellings in Union County, owner-occupied units account for 4,880 (70.0%), while renter-occupied units make up 2,087 (30.0%).
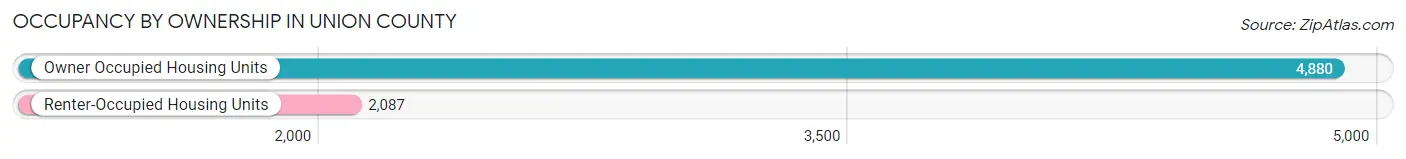
| Occupancy | # Housing Units | % Housing Units |
| Owner Occupied Housing Units | 4,880 | 70.0% |
| Renter-Occupied Housing Units | 2,087 | 30.0% |
| Total Occupied Housing Units | 6,967 | 100.0% |
Occupancy by Household Size in Union County
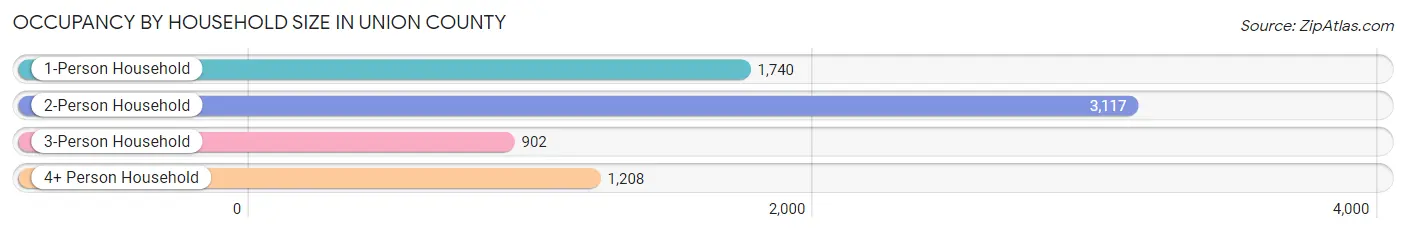
| Household Size | # Housing Units | % Housing Units |
| 1-Person Household | 1,740 | 25.0% |
| 2-Person Household | 3,117 | 44.7% |
| 3-Person Household | 902 | 13.0% |
| 4+ Person Household | 1,208 | 17.3% |
| Total Housing Units | 6,967 | 100.0% |
Occupancy by Ownership by Household Size in Union County
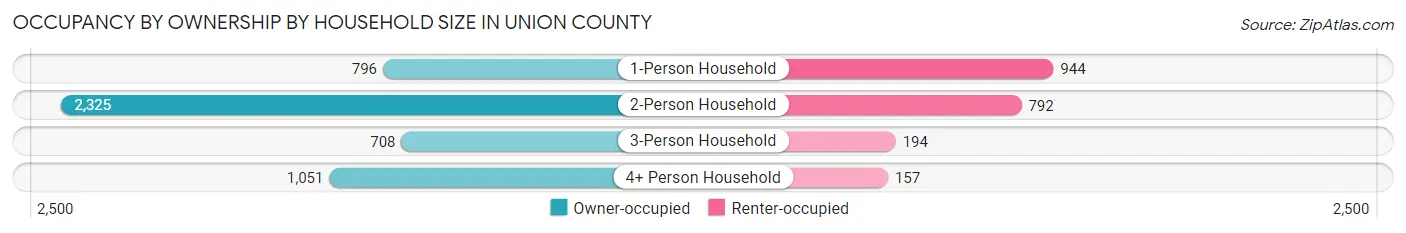
| Household Size | Owner-occupied | Renter-occupied |
| 1-Person Household | 796 (45.8%) | 944 (54.2%) |
| 2-Person Household | 2,325 (74.6%) | 792 (25.4%) |
| 3-Person Household | 708 (78.5%) | 194 (21.5%) |
| 4+ Person Household | 1,051 (87.0%) | 157 (13.0%) |
| Total Housing Units | 4,880 (70.0%) | 2,087 (30.0%) |
Occupancy by Educational Attainment in Union County
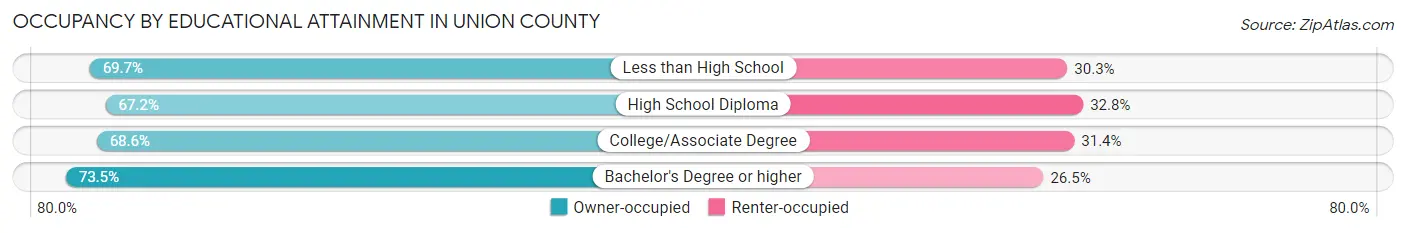
| Household Size | Owner-occupied | Renter-occupied |
| Less than High School | 294 (69.7%) | 128 (30.3%) |
| High School Diploma | 1,174 (67.2%) | 574 (32.8%) |
| College/Associate Degree | 1,566 (68.6%) | 718 (31.4%) |
| Bachelor's Degree or higher | 1,846 (73.5%) | 667 (26.5%) |
Occupancy by Age of Householder in Union County
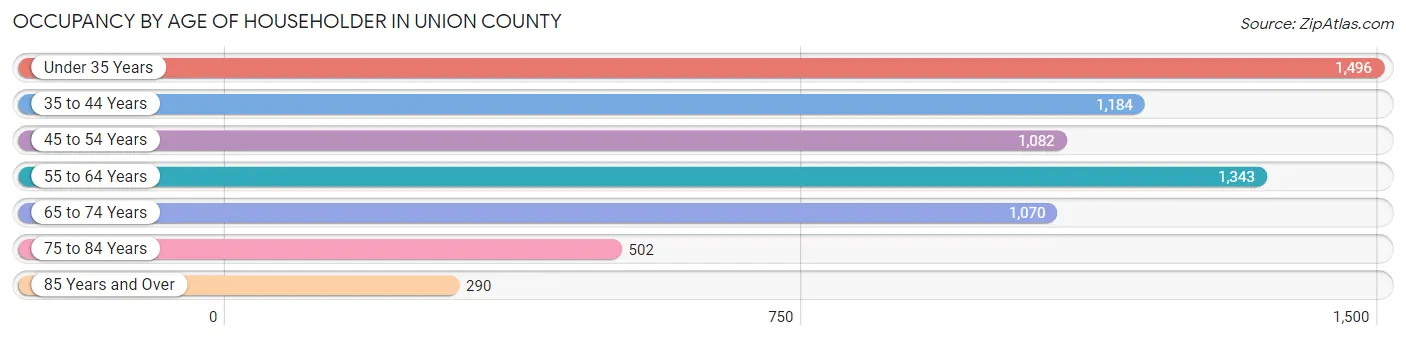
| Age Bracket | # Households | % Households |
| Under 35 Years | 1,496 | 21.5% |
| 35 to 44 Years | 1,184 | 17.0% |
| 45 to 54 Years | 1,082 | 15.5% |
| 55 to 64 Years | 1,343 | 19.3% |
| 65 to 74 Years | 1,070 | 15.4% |
| 75 to 84 Years | 502 | 7.2% |
| 85 Years and Over | 290 | 4.2% |
| Total | 6,967 | 100.0% |
Housing Finances in Union County
Median Income by Occupancy in Union County
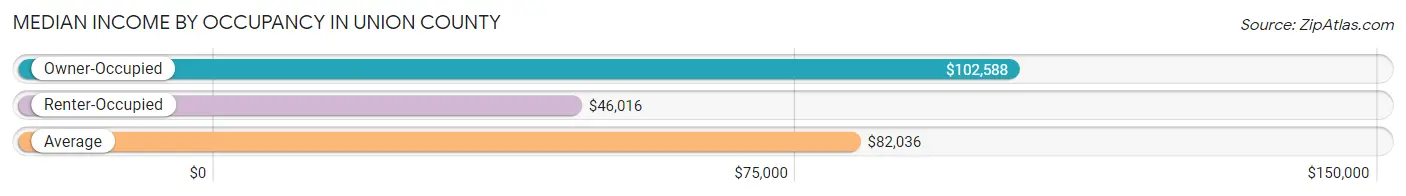
| Occupancy Type | # Households | Median Income |
| Owner-Occupied | 4,880 (70.0%) | $102,588 |
| Renter-Occupied | 2,087 (30.0%) | $46,016 |
| Average | 6,967 (100.0%) | $82,036 |
Occupancy by Householder Income Bracket in Union County
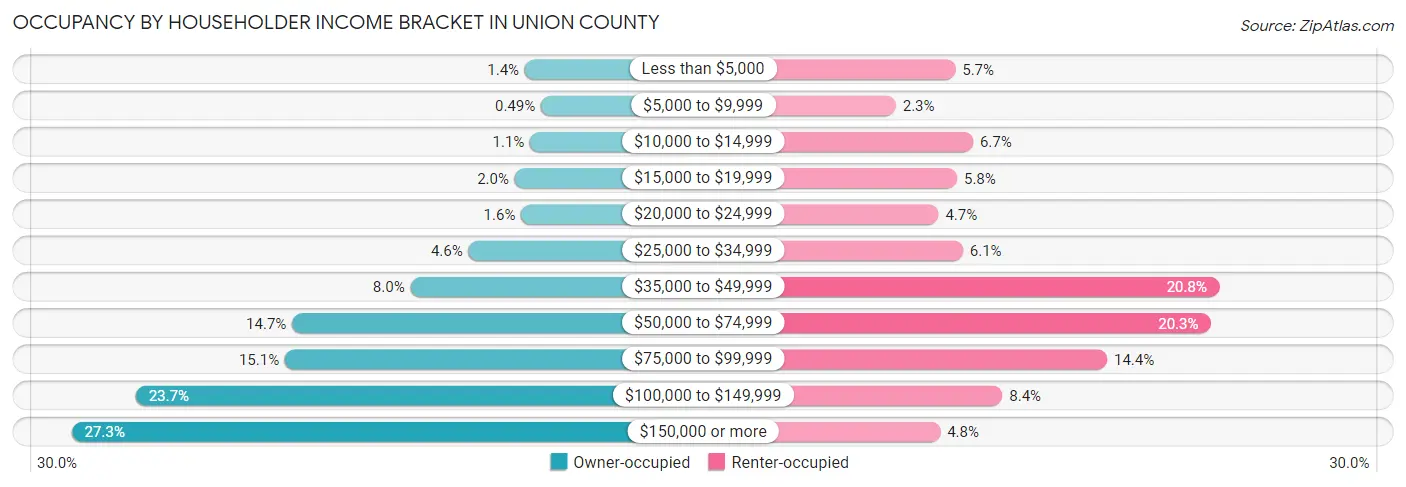
| Income Bracket | Owner-occupied | Renter-occupied |
| Less than $5,000 | 69 (1.4%) | 119 (5.7%) |
| $5,000 to $9,999 | 24 (0.5%) | 48 (2.3%) |
| $10,000 to $14,999 | 54 (1.1%) | 140 (6.7%) |
| $15,000 to $19,999 | 97 (2.0%) | 121 (5.8%) |
| $20,000 to $24,999 | 79 (1.6%) | 99 (4.7%) |
| $25,000 to $34,999 | 226 (4.6%) | 128 (6.1%) |
| $35,000 to $49,999 | 388 (8.0%) | 433 (20.7%) |
| $50,000 to $74,999 | 718 (14.7%) | 423 (20.3%) |
| $75,000 to $99,999 | 738 (15.1%) | 300 (14.4%) |
| $100,000 to $149,999 | 1,154 (23.6%) | 175 (8.4%) |
| $150,000 or more | 1,333 (27.3%) | 101 (4.8%) |
| Total | 4,880 (100.0%) | 2,087 (100.0%) |
Monthly Housing Cost Tiers in Union County
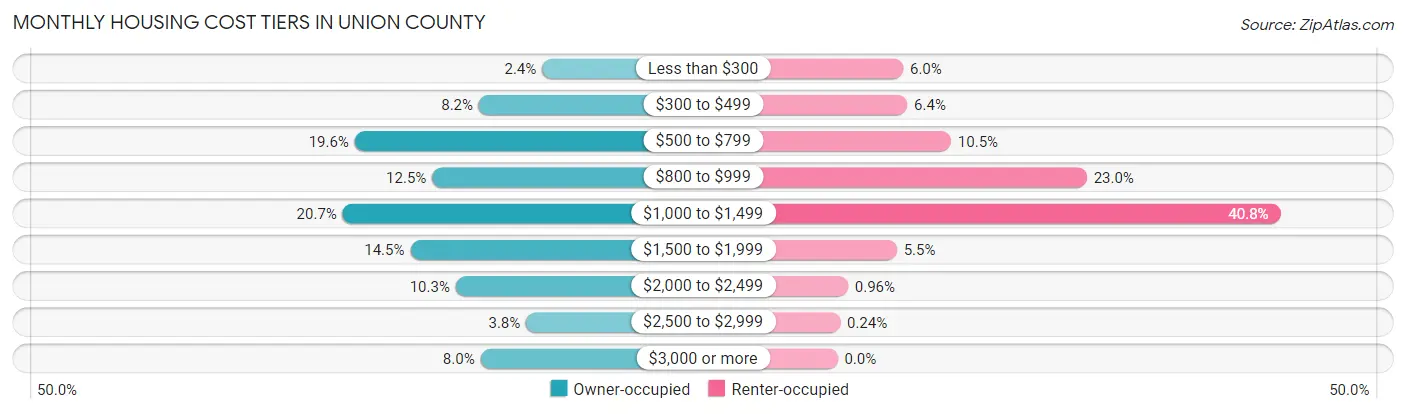
| Monthly Cost | Owner-occupied | Renter-occupied |
| Less than $300 | 115 (2.4%) | 126 (6.0%) |
| $300 to $499 | 399 (8.2%) | 134 (6.4%) |
| $500 to $799 | 957 (19.6%) | 218 (10.4%) |
| $800 to $999 | 609 (12.5%) | 479 (23.0%) |
| $1,000 to $1,499 | 1,011 (20.7%) | 851 (40.8%) |
| $1,500 to $1,999 | 707 (14.5%) | 114 (5.5%) |
| $2,000 to $2,499 | 503 (10.3%) | 20 (1.0%) |
| $2,500 to $2,999 | 187 (3.8%) | 5 (0.2%) |
| $3,000 or more | 392 (8.0%) | 0 (0.0%) |
| Total | 4,880 (100.0%) | 2,087 (100.0%) |
Physical Housing Characteristics in Union County
Housing Structures in Union County
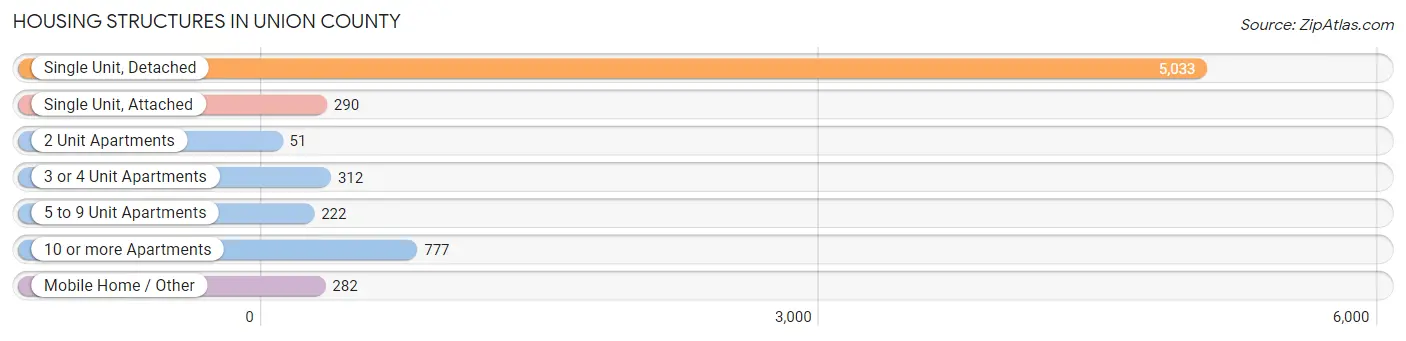
| Structure Type | # Housing Units | % Housing Units |
| Single Unit, Detached | 5,033 | 72.2% |
| Single Unit, Attached | 290 | 4.2% |
| 2 Unit Apartments | 51 | 0.7% |
| 3 or 4 Unit Apartments | 312 | 4.5% |
| 5 to 9 Unit Apartments | 222 | 3.2% |
| 10 or more Apartments | 777 | 11.2% |
| Mobile Home / Other | 282 | 4.1% |
| Total | 6,967 | 100.0% |
Housing Structures by Occupancy in Union County
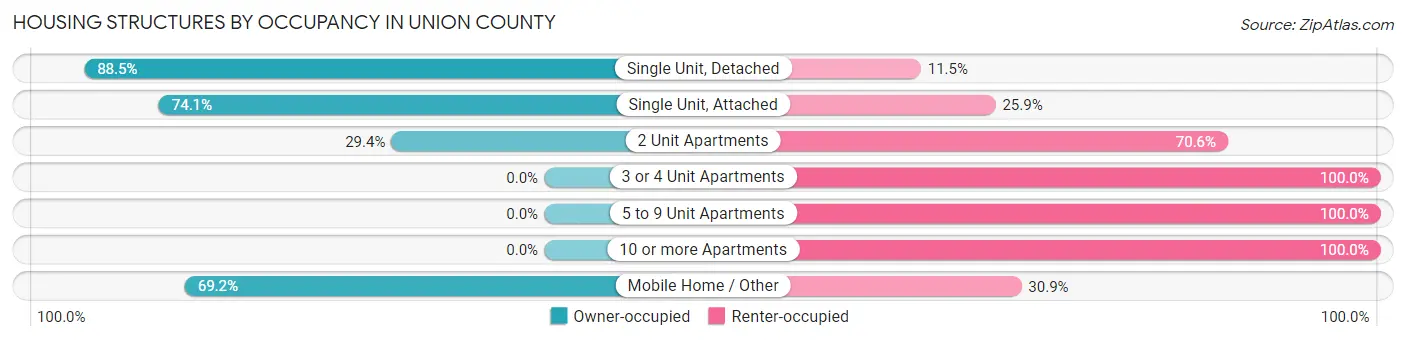
| Structure Type | Owner-occupied | Renter-occupied |
| Single Unit, Detached | 4,455 (88.5%) | 578 (11.5%) |
| Single Unit, Attached | 215 (74.1%) | 75 (25.9%) |
| 2 Unit Apartments | 15 (29.4%) | 36 (70.6%) |
| 3 or 4 Unit Apartments | 0 (0.0%) | 312 (100.0%) |
| 5 to 9 Unit Apartments | 0 (0.0%) | 222 (100.0%) |
| 10 or more Apartments | 0 (0.0%) | 777 (100.0%) |
| Mobile Home / Other | 195 (69.2%) | 87 (30.8%) |
| Total | 4,880 (70.0%) | 2,087 (30.0%) |
Housing Structures by Number of Rooms in Union County
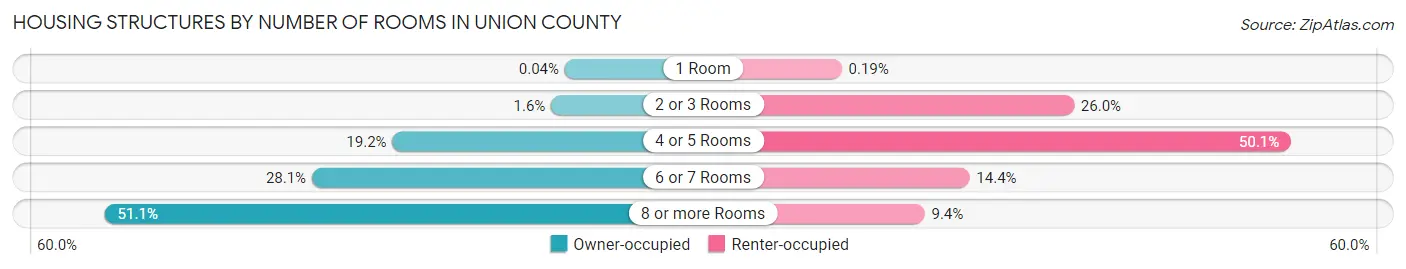
| Number of Rooms | Owner-occupied | Renter-occupied |
| 1 Room | 2 (0.0%) | 4 (0.2%) |
| 2 or 3 Rooms | 76 (1.6%) | 542 (26.0%) |
| 4 or 5 Rooms | 936 (19.2%) | 1,045 (50.1%) |
| 6 or 7 Rooms | 1,372 (28.1%) | 300 (14.4%) |
| 8 or more Rooms | 2,494 (51.1%) | 196 (9.4%) |
| Total | 4,880 (100.0%) | 2,087 (100.0%) |
Housing Structure by Heating Type in Union County
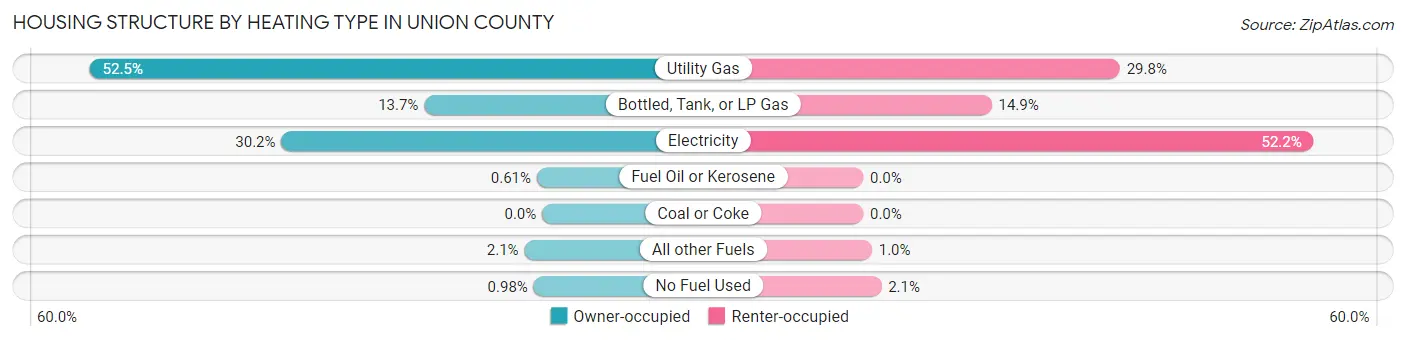
| Heating Type | Owner-occupied | Renter-occupied |
| Utility Gas | 2,560 (52.5%) | 621 (29.8%) |
| Bottled, Tank, or LP Gas | 667 (13.7%) | 311 (14.9%) |
| Electricity | 1,475 (30.2%) | 1,090 (52.2%) |
| Fuel Oil or Kerosene | 30 (0.6%) | 0 (0.0%) |
| Coal or Coke | 0 (0.0%) | 0 (0.0%) |
| All other Fuels | 100 (2.1%) | 21 (1.0%) |
| No Fuel Used | 48 (1.0%) | 44 (2.1%) |
| Total | 4,880 (100.0%) | 2,087 (100.0%) |
Household Vehicle Usage in Union County
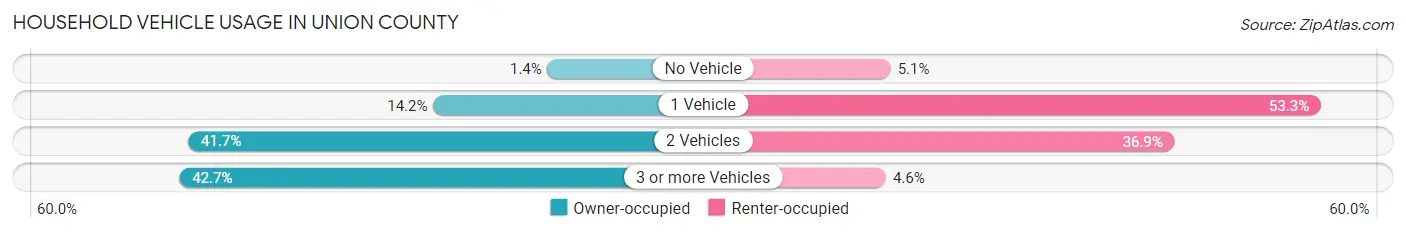
| Vehicles per Household | Owner-occupied | Renter-occupied |
| No Vehicle | 69 (1.4%) | 107 (5.1%) |
| 1 Vehicle | 694 (14.2%) | 1,113 (53.3%) |
| 2 Vehicles | 2,034 (41.7%) | 771 (36.9%) |
| 3 or more Vehicles | 2,083 (42.7%) | 96 (4.6%) |
| Total | 4,880 (100.0%) | 2,087 (100.0%) |
Real Estate & Mortgages in Union County
Real Estate and Mortgage Overview in Union County
| Characteristic | Without Mortgage | With Mortgage |
| Housing Units | 1,995 | 2,885 |
| Median Property Value | $254,000 | $255,300 |
| Median Household Income | $78,798 | $888 |
| Monthly Housing Costs | $662 | $349 |
| Real Estate Taxes | $2,977 | $15 |
Property Value by Mortgage Status in Union County
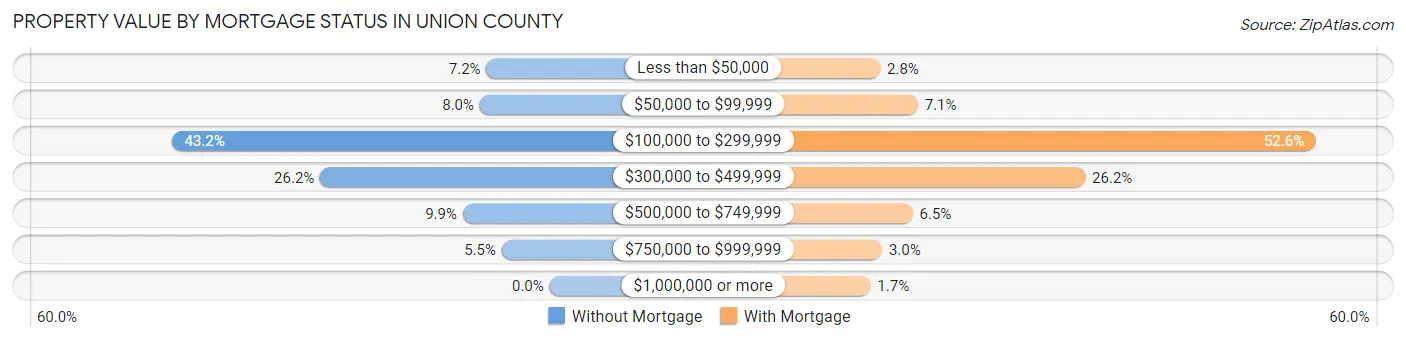
| Property Value | Without Mortgage | With Mortgage |
| Less than $50,000 | 144 (7.2%) | 81 (2.8%) |
| $50,000 to $99,999 | 159 (8.0%) | 205 (7.1%) |
| $100,000 to $299,999 | 862 (43.2%) | 1,518 (52.6%) |
| $300,000 to $499,999 | 523 (26.2%) | 757 (26.2%) |
| $500,000 to $749,999 | 198 (9.9%) | 188 (6.5%) |
| $750,000 to $999,999 | 109 (5.5%) | 87 (3.0%) |
| $1,000,000 or more | 0 (0.0%) | 49 (1.7%) |
| Total | 1,995 (100.0%) | 2,885 (100.0%) |
Household Income by Mortgage Status in Union County
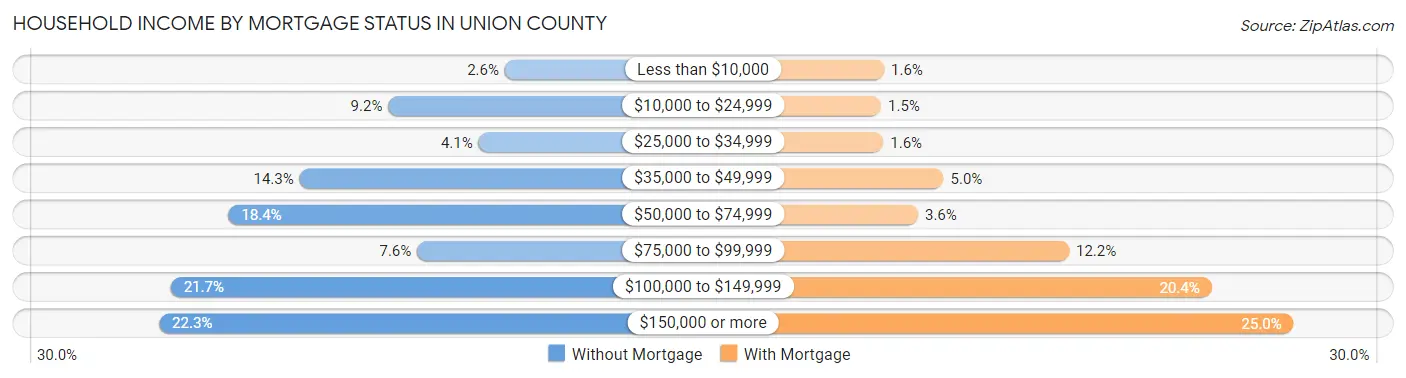
| Household Income | Without Mortgage | With Mortgage |
| Less than $10,000 | 51 (2.6%) | 47 (1.6%) |
| $10,000 to $24,999 | 184 (9.2%) | 42 (1.5%) |
| $25,000 to $34,999 | 81 (4.1%) | 46 (1.6%) |
| $35,000 to $49,999 | 285 (14.3%) | 145 (5.0%) |
| $50,000 to $74,999 | 366 (18.3%) | 103 (3.6%) |
| $75,000 to $99,999 | 151 (7.6%) | 352 (12.2%) |
| $100,000 to $149,999 | 432 (21.6%) | 587 (20.3%) |
| $150,000 or more | 445 (22.3%) | 722 (25.0%) |
| Total | 1,995 (100.0%) | 2,885 (100.0%) |
Property Value to Household Income Ratio in Union County
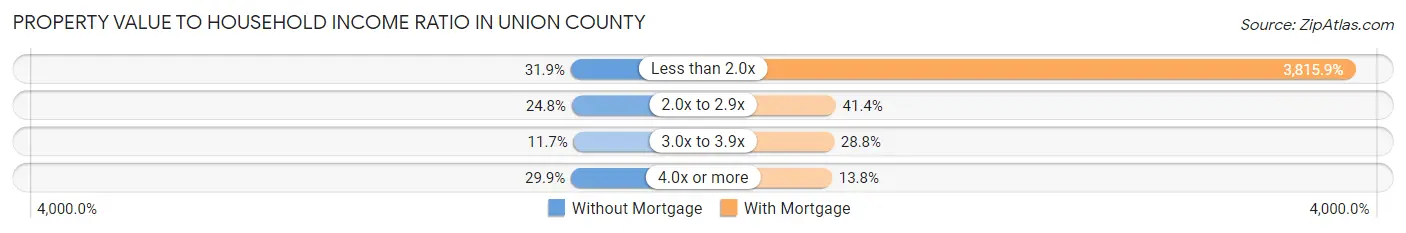
| Value-to-Income Ratio | Without Mortgage | With Mortgage |
| Less than 2.0x | 637 (31.9%) | 110,089 (3,815.9%) |
| 2.0x to 2.9x | 494 (24.8%) | 1,194 (41.4%) |
| 3.0x to 3.9x | 233 (11.7%) | 831 (28.8%) |
| 4.0x or more | 596 (29.9%) | 397 (13.8%) |
| Total | 1,995 (100.0%) | 2,885 (100.0%) |
Real Estate Taxes by Mortgage Status in Union County
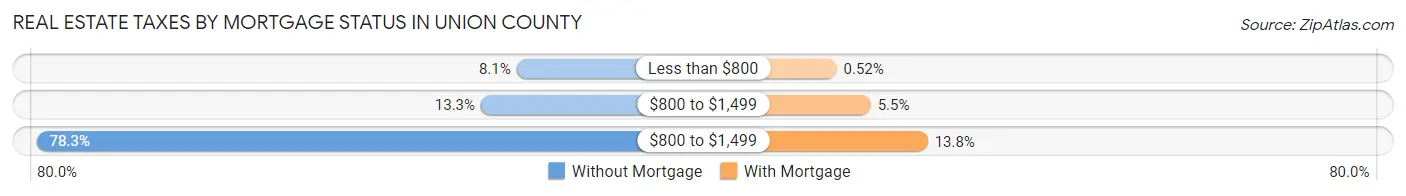
| Property Taxes | Without Mortgage | With Mortgage |
| Less than $800 | 162 (8.1%) | 15 (0.5%) |
| $800 to $1,499 | 266 (13.3%) | 159 (5.5%) |
| $800 to $1,499 | 1,561 (78.2%) | 399 (13.8%) |
| Total | 1,995 (100.0%) | 2,885 (100.0%) |
Health & Disability in Union County
Health Insurance Coverage by Age in Union County
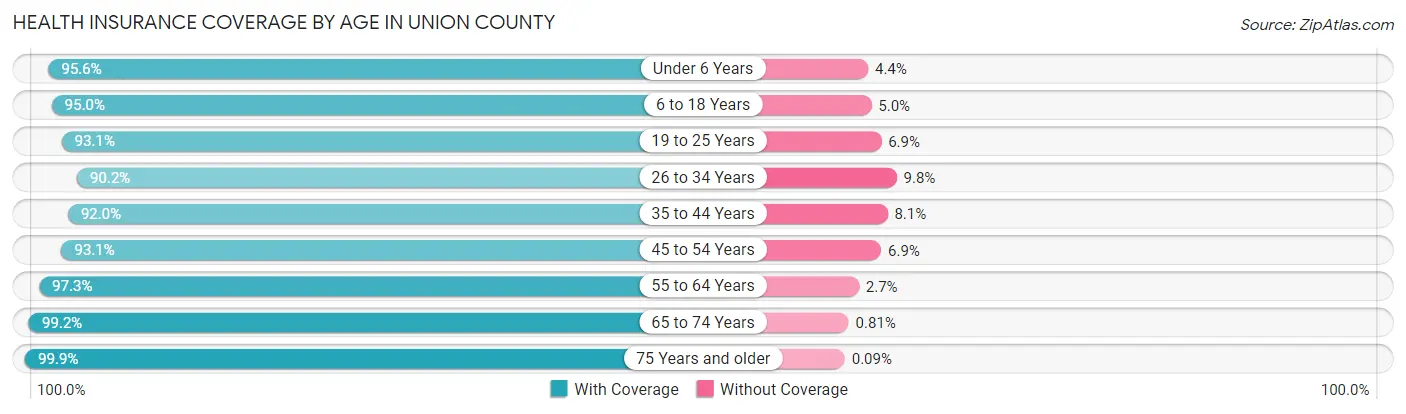
| Age Bracket | With Coverage | Without Coverage |
| Under 6 Years | 1,057 (95.6%) | 49 (4.4%) |
| 6 to 18 Years | 2,975 (95.0%) | 158 (5.0%) |
| 19 to 25 Years | 1,175 (93.1%) | 87 (6.9%) |
| 26 to 34 Years | 1,628 (90.2%) | 176 (9.8%) |
| 35 to 44 Years | 1,930 (91.9%) | 169 (8.1%) |
| 45 to 54 Years | 1,818 (93.1%) | 134 (6.9%) |
| 55 to 64 Years | 2,117 (97.3%) | 59 (2.7%) |
| 65 to 74 Years | 1,846 (99.2%) | 15 (0.8%) |
| 75 Years and older | 1,128 (99.9%) | 1 (0.1%) |
| Total | 15,674 (94.9%) | 848 (5.1%) |
Health Insurance Coverage by Citizenship Status in Union County
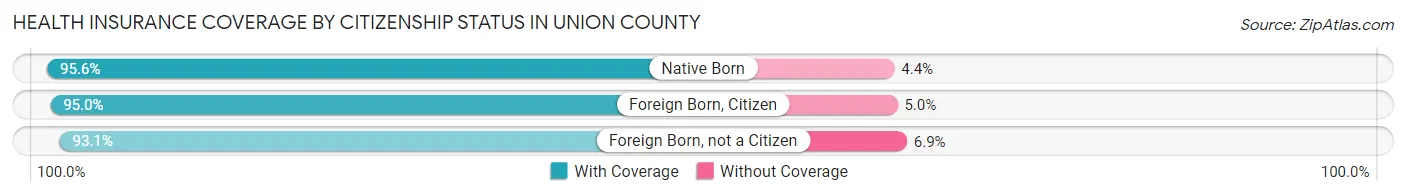
| Citizenship Status | With Coverage | Without Coverage |
| Native Born | 1,057 (95.6%) | 49 (4.4%) |
| Foreign Born, Citizen | 2,975 (95.0%) | 158 (5.0%) |
| Foreign Born, not a Citizen | 1,175 (93.1%) | 87 (6.9%) |
Health Insurance Coverage by Household Income in Union County

| Household Income | With Coverage | Without Coverage |
| Under $25,000 | 1,138 (85.8%) | 188 (14.2%) |
| $25,000 to $49,999 | 1,936 (93.9%) | 126 (6.1%) |
| $50,000 to $74,999 | 2,323 (90.5%) | 243 (9.5%) |
| $75,000 to $99,999 | 2,406 (96.4%) | 90 (3.6%) |
| $100,000 and over | 7,864 (97.5%) | 201 (2.5%) |
Public vs Private Health Insurance Coverage by Age in Union County
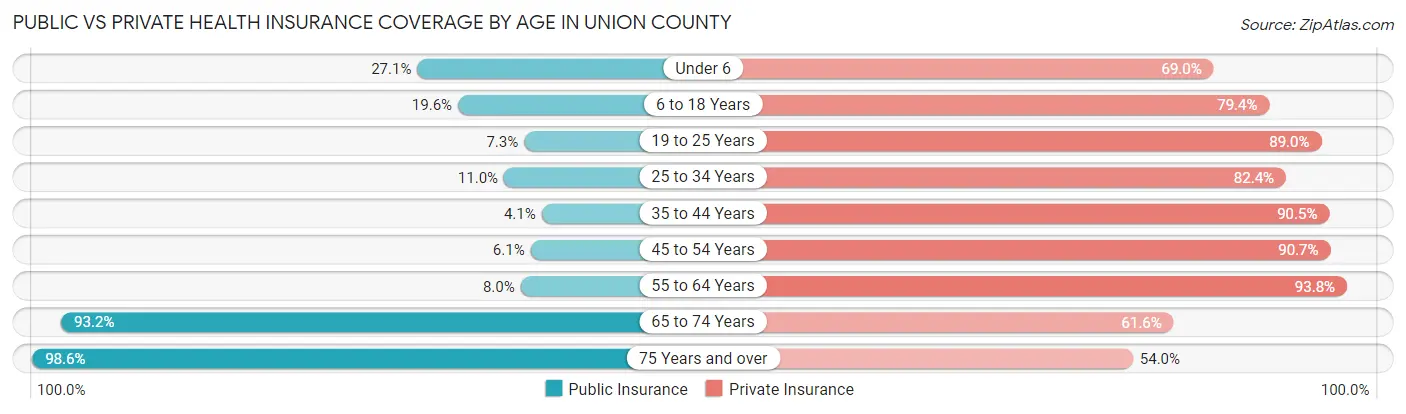
| Age Bracket | Public Insurance | Private Insurance |
| Under 6 | 300 (27.1%) | 763 (69.0%) |
| 6 to 18 Years | 613 (19.6%) | 2,486 (79.3%) |
| 19 to 25 Years | 92 (7.3%) | 1,123 (89.0%) |
| 25 to 34 Years | 199 (11.0%) | 1,487 (82.4%) |
| 35 to 44 Years | 85 (4.1%) | 1,899 (90.5%) |
| 45 to 54 Years | 119 (6.1%) | 1,770 (90.7%) |
| 55 to 64 Years | 173 (8.0%) | 2,040 (93.8%) |
| 65 to 74 Years | 1,735 (93.2%) | 1,146 (61.6%) |
| 75 Years and over | 1,113 (98.6%) | 610 (54.0%) |
| Total | 4,429 (26.8%) | 13,324 (80.6%) |
Disability Status by Sex by Age in Union County
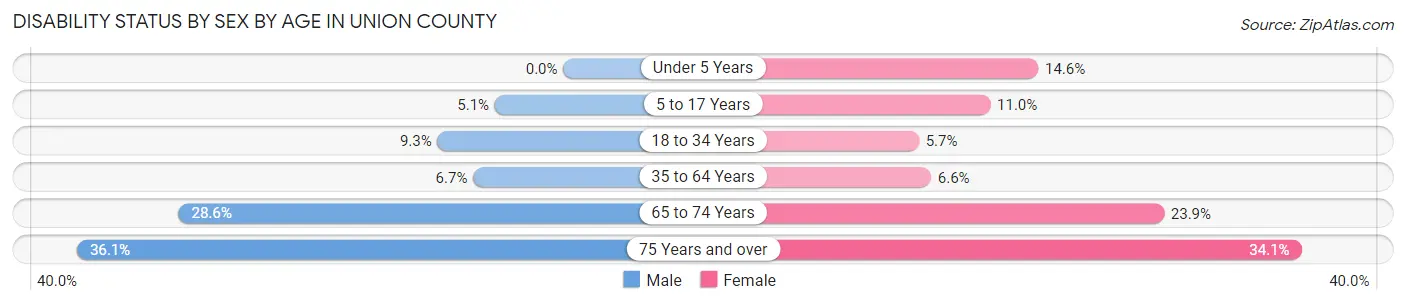
| Age Bracket | Male | Female |
| Under 5 Years | 0 (0.0%) | 65 (14.6%) |
| 5 to 17 Years | 84 (5.1%) | 165 (11.0%) |
| 18 to 34 Years | 166 (9.3%) | 84 (5.7%) |
| 35 to 64 Years | 207 (6.7%) | 207 (6.6%) |
| 65 to 74 Years | 270 (28.6%) | 219 (23.9%) |
| 75 Years and over | 178 (36.1%) | 217 (34.1%) |
Disability Class by Sex by Age in Union County
Disability Class: Hearing Difficulty
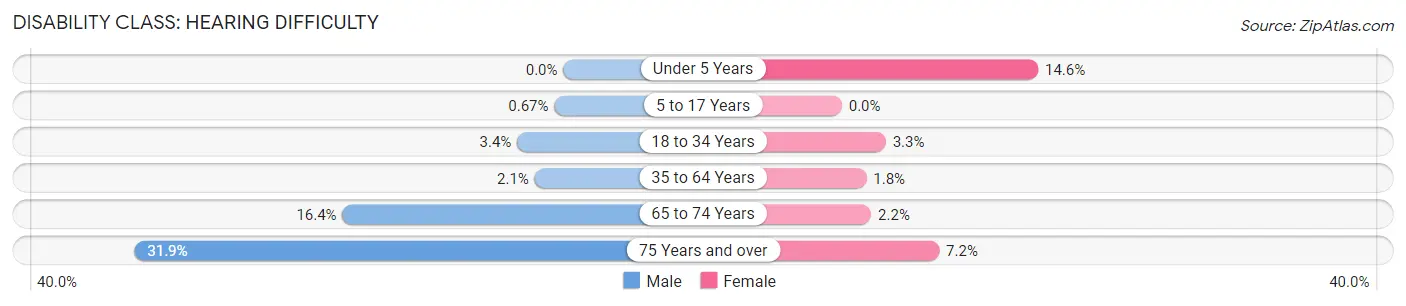
| Age Bracket | Male | Female |
| Under 5 Years | 0 (0.0%) | 65 (14.6%) |
| 5 to 17 Years | 11 (0.7%) | 0 (0.0%) |
| 18 to 34 Years | 61 (3.4%) | 48 (3.3%) |
| 35 to 64 Years | 66 (2.1%) | 57 (1.8%) |
| 65 to 74 Years | 155 (16.4%) | 20 (2.2%) |
| 75 Years and over | 157 (31.9%) | 46 (7.2%) |
Disability Class: Vision Difficulty
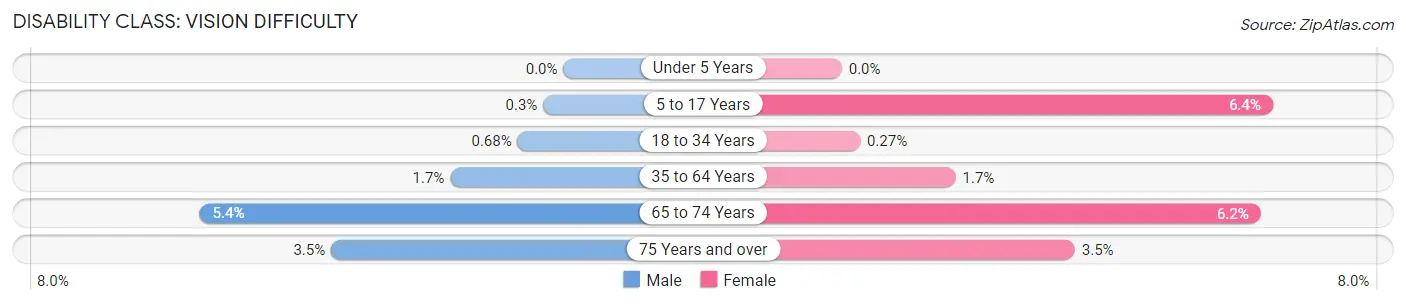
| Age Bracket | Male | Female |
| Under 5 Years | 0 (0.0%) | 0 (0.0%) |
| 5 to 17 Years | 5 (0.3%) | 96 (6.4%) |
| 18 to 34 Years | 12 (0.7%) | 4 (0.3%) |
| 35 to 64 Years | 52 (1.7%) | 53 (1.7%) |
| 65 to 74 Years | 51 (5.4%) | 57 (6.2%) |
| 75 Years and over | 17 (3.5%) | 22 (3.5%) |
Disability Class: Cognitive Difficulty
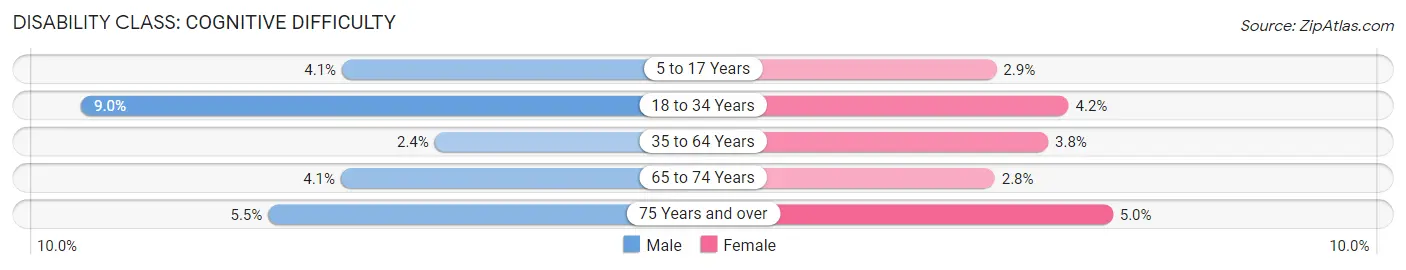
| Age Bracket | Male | Female |
| 5 to 17 Years | 68 (4.1%) | 43 (2.9%) |
| 18 to 34 Years | 159 (8.9%) | 62 (4.2%) |
| 35 to 64 Years | 74 (2.4%) | 120 (3.8%) |
| 65 to 74 Years | 39 (4.1%) | 26 (2.8%) |
| 75 Years and over | 27 (5.5%) | 32 (5.0%) |
Disability Class: Ambulatory Difficulty
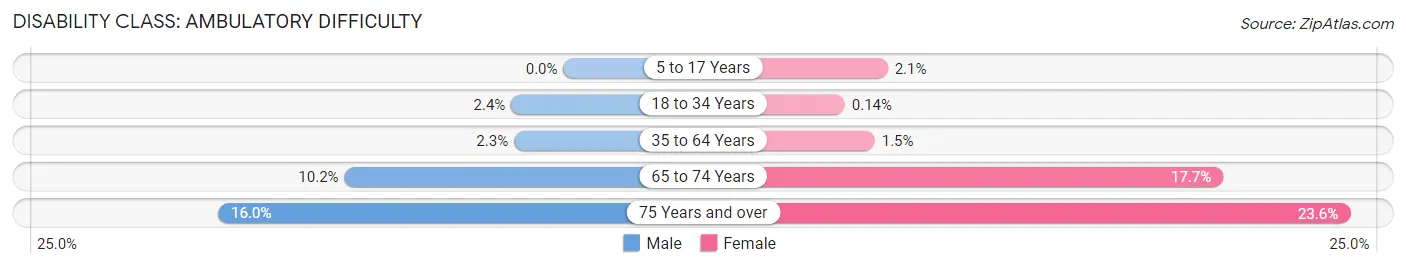
| Age Bracket | Male | Female |
| 5 to 17 Years | 0 (0.0%) | 32 (2.1%) |
| 18 to 34 Years | 43 (2.4%) | 2 (0.1%) |
| 35 to 64 Years | 71 (2.3%) | 48 (1.5%) |
| 65 to 74 Years | 96 (10.2%) | 162 (17.7%) |
| 75 Years and over | 79 (16.0%) | 150 (23.6%) |
Disability Class: Self-Care Difficulty
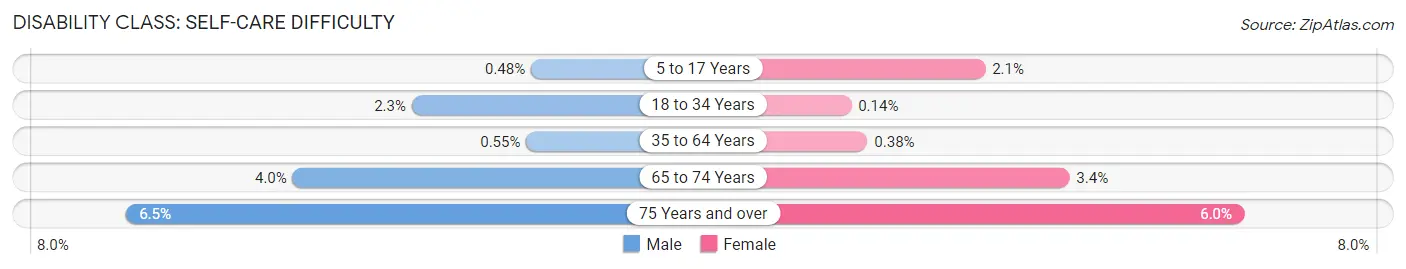
| Age Bracket | Male | Female |
| 5 to 17 Years | 8 (0.5%) | 32 (2.1%) |
| 18 to 34 Years | 40 (2.2%) | 2 (0.1%) |
| 35 to 64 Years | 17 (0.5%) | 12 (0.4%) |
| 65 to 74 Years | 38 (4.0%) | 31 (3.4%) |
| 75 Years and over | 32 (6.5%) | 38 (6.0%) |
Technology Access in Union County
Computing Device Access in Union County
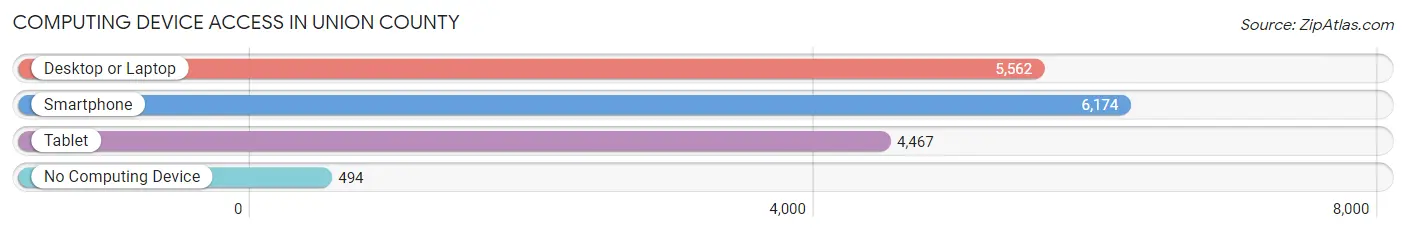
| Device Type | # Households | % Households |
| Desktop or Laptop | 5,562 | 79.8% |
| Smartphone | 6,174 | 88.6% |
| Tablet | 4,467 | 64.1% |
| No Computing Device | 494 | 7.1% |
| Total | 6,967 | 100.0% |
Internet Access in Union County
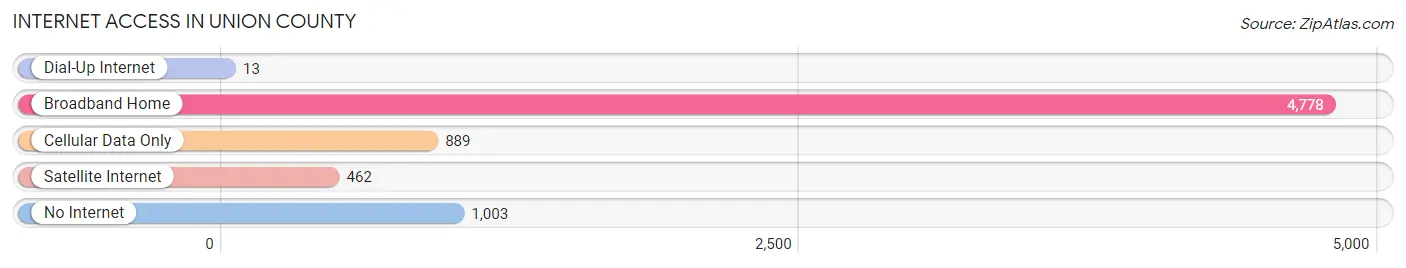
| Internet Type | # Households | % Households |
| Dial-Up Internet | 13 | 0.2% |
| Broadband Home | 4,778 | 68.6% |
| Cellular Data Only | 889 | 12.8% |
| Satellite Internet | 462 | 6.6% |
| No Internet | 1,003 | 14.4% |
| Total | 6,967 | 100.0% |
Union County Summary
County History
Union County, South Dakota is located in the southeastern corner of the state and is bordered by Clay, Turner, Lincoln, and Minnehaha counties. The county was established in 1862 and was named after the Union Army, which was victorious in the Civil War. The county seat is Elk Point, which was founded in 1868.
The first settlers in Union County were of European descent, primarily from Germany, Norway, and Sweden. The first permanent settlement was established in 1868, and the county was officially organized in 1871. The first county courthouse was built in 1872, and the first school was established in 1873.
The county was primarily an agricultural area, with the main crops being wheat, corn, and oats. The county also had a thriving dairy industry, with many of the farmers raising cows for milk and butter.
The county was also home to several small towns, including Elk Point, Alcester, Jefferson, and Beresford. These towns were important centers of commerce and transportation, as they were located along the Sioux City and Pacific Railroad.
The county was also home to several Native American tribes, including the Yankton Sioux, the Santee Sioux, and the Omaha. These tribes were relocated to the area in the late 1800s and early 1900s, and many of them still live in the county today.
Geography
Union County is located in the southeastern corner of South Dakota and is bordered by Clay, Turner, Lincoln, and Minnehaha counties. The county covers an area of 845 square miles and is home to a population of approximately 10,000 people.
The county is mostly flat, with rolling hills in the western part of the county. The terrain is mostly prairie, with some wooded areas in the eastern part of the county. The county is drained by the Big Sioux River, which flows through the county from north to south.
The county is home to several small lakes, including Lake Madison, Lake Poinsett, and Lake Thompson. These lakes are popular for fishing, boating, and swimming.
Economy
Union County is primarily an agricultural area, with the main crops being wheat, corn, and oats. The county also has a thriving dairy industry, with many of the farmers raising cows for milk and butter.
The county is also home to several small businesses, including manufacturing, retail, and service industries. The county is also home to several large employers, including the Union County Hospital, the Union County Courthouse, and the Union County Sheriff’s Office.
Demographics
As of the 2010 census, the population of Union County was 10,068. The racial makeup of the county was 95.3% White, 0.7% African American, 0.4% Native American, 0.3% Asian, 0.1% Pacific Islander, 1.7% from other races, and 1.4% from two or more races. Hispanic or Latino of any race were 3.2% of the population.
The median income for a household in the county was $45,945, and the median income for a family was $53,945. The per capita income for the county was $21,945. About 8.3% of families and 11.2% of the population were below the poverty line, including 14.2% of those under age 18 and 8.2% of those age 65 or over.
Common Questions
What is the Total Population of Union County?
Total Population of Union County is 16,700.
What is the Total Male Population of Union County?
Total Male Population of Union County is 8,531.
What is the Total Female Population of Union County?
Total Female Population of Union County is 8,169.
What is the Ratio of Males per 100 Females in Union County?
There are 104.43 Males per 100 Females in Union County.
What is the Ratio of Females per 100 Males in Union County?
There are 95.76 Females per 100 Males in Union County.
What is the Median Population Age in Union County?
Median Population Age in Union County is 40.1 Years.
What is the Average Family Size in Union County
Average Family Size in Union County is 2.9 People.
What is the Average Household Size in Union County
Average Household Size in Union County is 2.4 People.
What is Per Capita Income in Union County?
Per Capita income in Union County is $47,193.
What is the Median Family Income in Union County?
Median Family Income in Union County is $100,727.
What is the Median Household income in Union County?
Median Household Income in Union County is $82,036.
What is Income or Wage Gap in Union County?
Income or Wage Gap in Union County is 31.3%.
Women in Union County earn 68.7 cents for every dollar earned by a man.
What is Family Income Deficit in Union County?
Family Income Deficit in Union County is $10,115.
Families that are below poverty line in Union County earn $10,115 less on average than the poverty threshold level.
What is Inequality or Gini Index in Union County?
Inequality or Gini Index in Union County is 0.47.
How Large is the Labor Force in Union County?
There are 8,814 People in the Labor Forcein in Union County.
What is the Percentage of People in the Labor Force in Union County?
67.3% of People are in the Labor Force in Union County.
What is the Unemployment Rate in Union County?
Unemployment Rate in Union County is 3.0%.