Todd County, SD
Todd County Map
Todd County Overview
9,353
TOTAL POPULATION
4,616
MALE POPULATION
4,737
FEMALE POPULATION
97.45
MALES / 100 FEMALES
102.62
FEMALES / 100 MALES
25.1
MEDIAN AGE
4.8
AVG FAMILY SIZE
3.8
AVG HOUSEHOLD SIZE
$12,562
PER CAPITA INCOME
$35,458
AVG FAMILY INCOME
$33,792
AVG HOUSEHOLD INCOME
13.8%
WAGE / INCOME GAP [ % ]
86.2¢/ $1
WAGE / INCOME GAP [ $ ]
$19,054
FAMILY INCOME DEFICIT
0.50
INEQUALITY / GINI INDEX
2,716
LABOR FORCE [ PEOPLE ]
45.2%
PERCENT IN LABOR FORCE
15.1%
UNEMPLOYMENT RATE
Todd County Area Codes
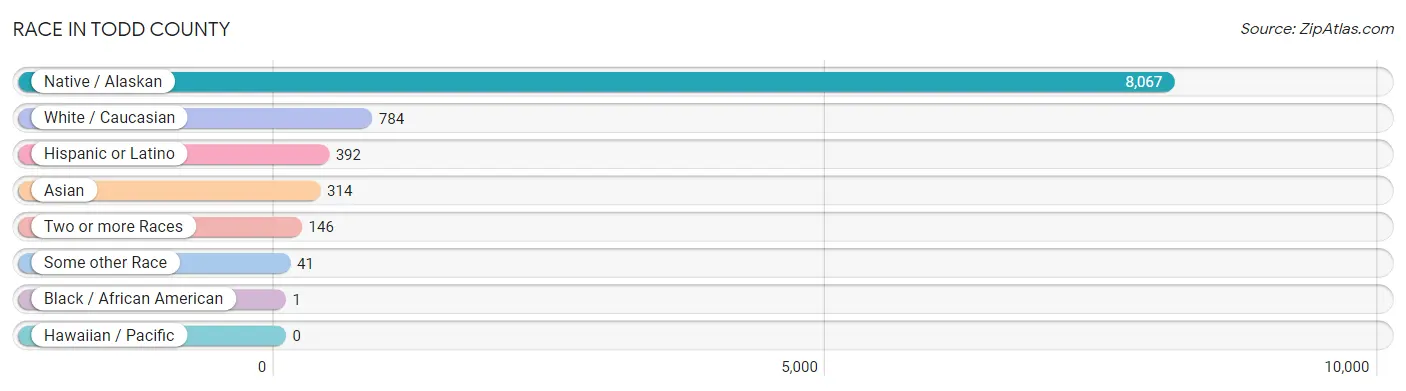
Race in Todd County
The most populous races in Todd County are Native / Alaskan (8,067 | 86.3%), White / Caucasian (784 | 8.4%), and Hispanic or Latino (392 | 4.2%).
| Race | # Population | % Population |
| Asian | 314 | 3.4% |
| Black / African American | 1 | 0.0% |
| Hawaiian / Pacific | 0 | 0.0% |
| Hispanic or Latino | 392 | 4.2% |
| Native / Alaskan | 8,067 | 86.3% |
| White / Caucasian | 784 | 8.4% |
| Two or more Races | 146 | 1.6% |
| Some other Race | 41 | 0.4% |
| Total | 9,353 | 100.0% |
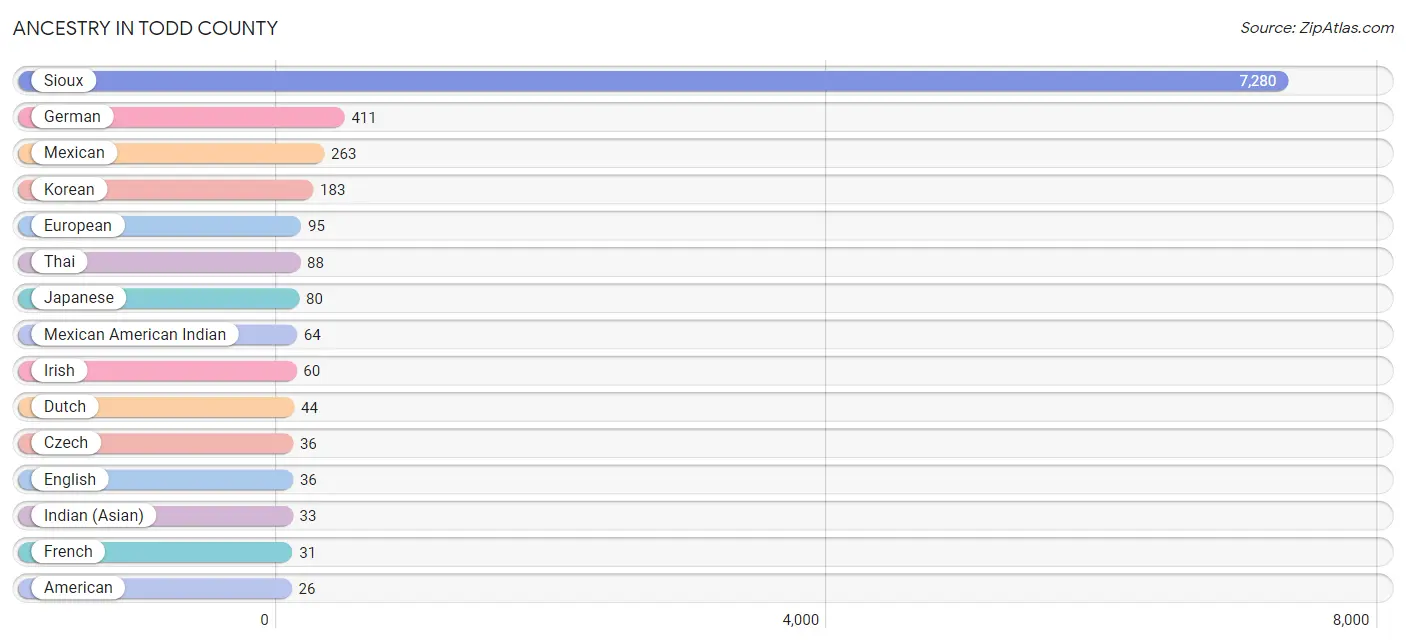
Ancestry in Todd County
The most populous ancestries reported in Todd County are Sioux (7,280 | 77.8%), German (411 | 4.4%), Mexican (263 | 2.8%), Korean (183 | 2.0%), and European (95 | 1.0%), together accounting for 88.0% of all Todd County residents.
| Ancestry | # Population | % Population |
| American | 26 | 0.3% |
| Arab | 3 | 0.0% |
| Austrian | 8 | 0.1% |
| Bhutanese | 11 | 0.1% |
| Cherokee | 5 | 0.1% |
| Chippewa | 22 | 0.2% |
| Crow | 6 | 0.1% |
| Czech | 36 | 0.4% |
| Danish | 21 | 0.2% |
| Dutch | 44 | 0.5% |
| Egyptian | 3 | 0.0% |
| English | 36 | 0.4% |
| Ethiopian | 1 | 0.0% |
| European | 95 | 1.0% |
| French | 31 | 0.3% |
| German | 411 | 4.4% |
| Indian (Asian) | 33 | 0.4% |
| Indonesian | 1 | 0.0% |
| Irish | 60 | 0.6% |
| Italian | 9 | 0.1% |
| Japanese | 80 | 0.9% |
| Korean | 183 | 2.0% |
| Mexican | 263 | 2.8% |
| Mexican American Indian | 64 | 0.7% |
| Navajo | 19 | 0.2% |
| Norwegian | 1 | 0.0% |
| Polish | 4 | 0.0% |
| Russian | 7 | 0.1% |
| Scandinavian | 5 | 0.1% |
| Scotch-Irish | 1 | 0.0% |
| Scottish | 14 | 0.2% |
| Seminole | 12 | 0.1% |
| Sioux | 7,280 | 77.8% |
| Slavic | 5 | 0.1% |
| Subsaharan African | 1 | 0.0% |
| Swedish | 20 | 0.2% |
| Swiss | 23 | 0.3% |
| Thai | 88 | 0.9% |
| Ukrainian | 12 | 0.1% |
| Welsh | 15 | 0.2% | View All 40 Rows |
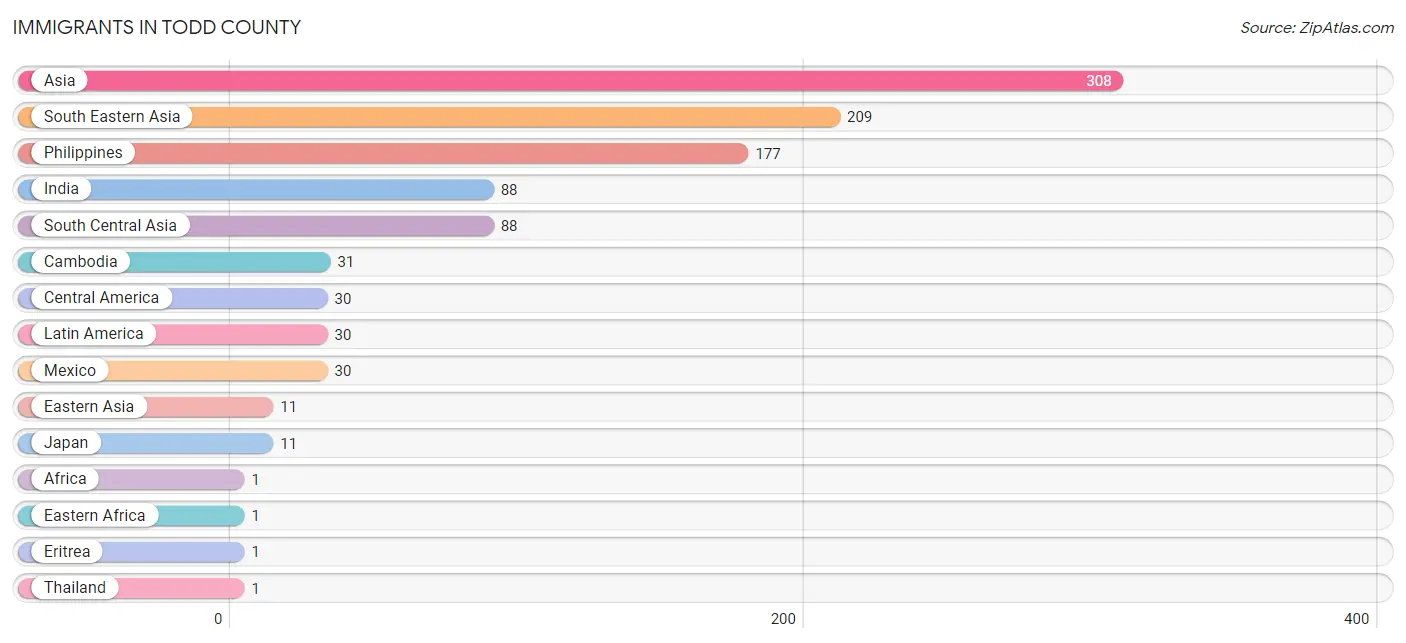
Immigrants in Todd County
The most numerous immigrant groups reported in Todd County came from Asia (308 | 3.3%), South Eastern Asia (209 | 2.2%), Philippines (177 | 1.9%), India (88 | 0.9%), and South Central Asia (88 | 0.9%), together accounting for 9.3% of all Todd County residents.
| Immigration Origin | # Population | % Population |
| Africa | 1 | 0.0% |
| Asia | 308 | 3.3% |
| Cambodia | 31 | 0.3% |
| Central America | 30 | 0.3% |
| Eastern Africa | 1 | 0.0% |
| Eastern Asia | 11 | 0.1% |
| Eritrea | 1 | 0.0% |
| India | 88 | 0.9% |
| Japan | 11 | 0.1% |
| Latin America | 30 | 0.3% |
| Mexico | 30 | 0.3% |
| Philippines | 177 | 1.9% |
| South Central Asia | 88 | 0.9% |
| South Eastern Asia | 209 | 2.2% |
| Thailand | 1 | 0.0% | View All 15 Rows |
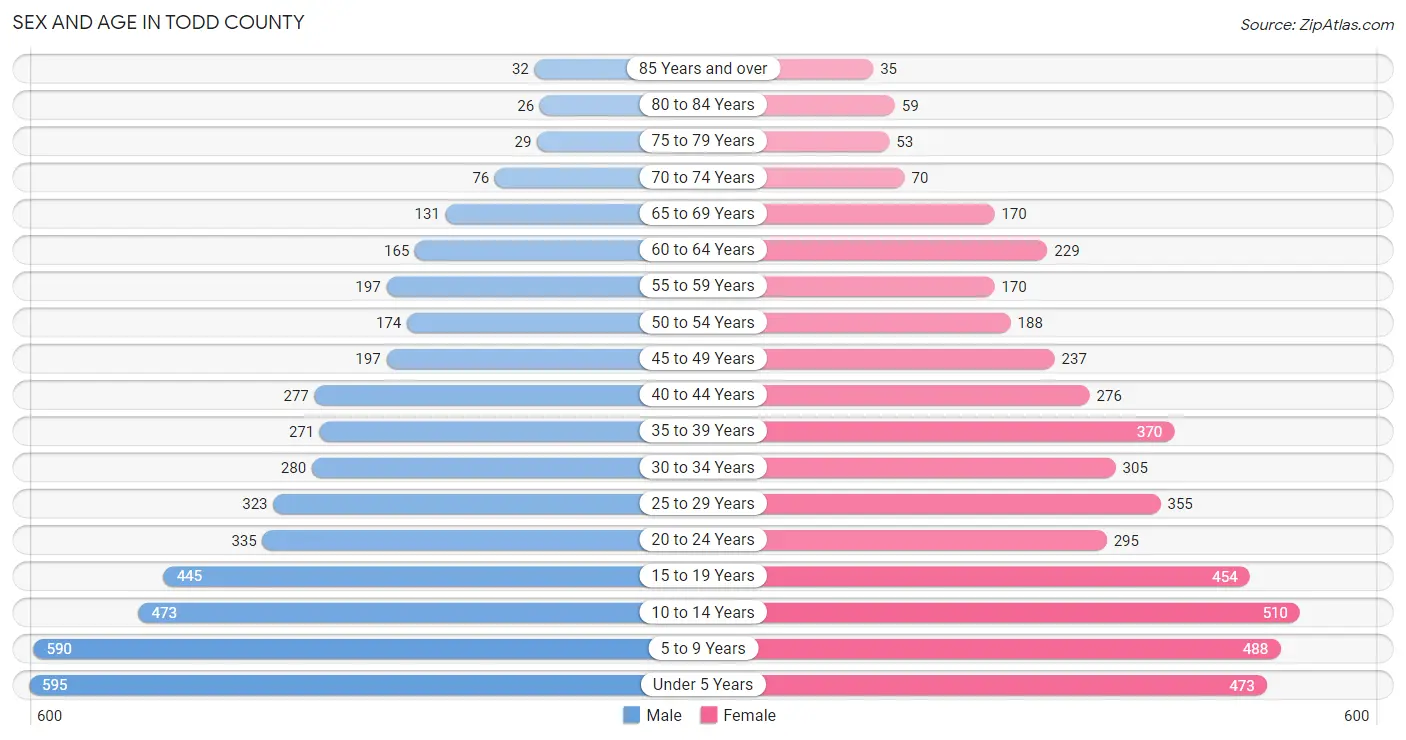
Sex and Age in Todd County
Sex and Age in Todd County
The most populous age groups in Todd County are Under 5 Years (595 | 12.9%) for men and 10 to 14 Years (510 | 10.8%) for women.
| Age Bracket | Male | Female |
| Under 5 Years | 595 (12.9%) | 473 (10.0%) |
| 5 to 9 Years | 590 (12.8%) | 488 (10.3%) |
| 10 to 14 Years | 473 (10.2%) | 510 (10.8%) |
| 15 to 19 Years | 445 (9.6%) | 454 (9.6%) |
| 20 to 24 Years | 335 (7.3%) | 295 (6.2%) |
| 25 to 29 Years | 323 (7.0%) | 355 (7.5%) |
| 30 to 34 Years | 280 (6.1%) | 305 (6.4%) |
| 35 to 39 Years | 271 (5.9%) | 370 (7.8%) |
| 40 to 44 Years | 277 (6.0%) | 276 (5.8%) |
| 45 to 49 Years | 197 (4.3%) | 237 (5.0%) |
| 50 to 54 Years | 174 (3.8%) | 188 (4.0%) |
| 55 to 59 Years | 197 (4.3%) | 170 (3.6%) |
| 60 to 64 Years | 165 (3.6%) | 229 (4.8%) |
| 65 to 69 Years | 131 (2.8%) | 170 (3.6%) |
| 70 to 74 Years | 76 (1.7%) | 70 (1.5%) |
| 75 to 79 Years | 29 (0.6%) | 53 (1.1%) |
| 80 to 84 Years | 26 (0.6%) | 59 (1.3%) |
| 85 Years and over | 32 (0.7%) | 35 (0.7%) |
| Total | 4,616 (100.0%) | 4,737 (100.0%) |
Families and Households in Todd County
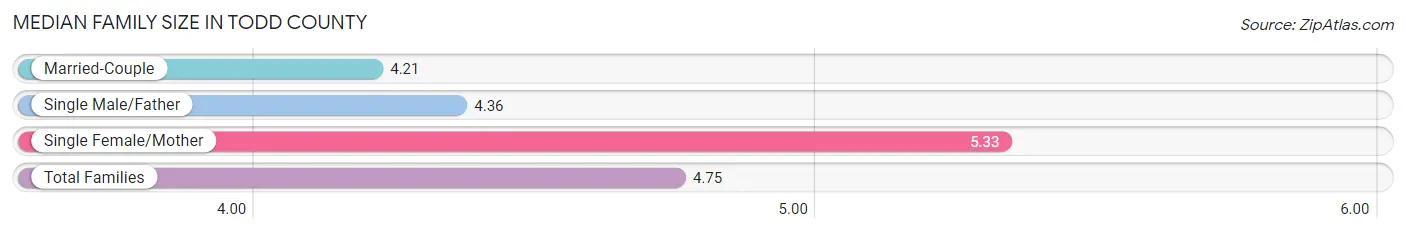
Median Family Size in Todd County
The median family size in Todd County is 4.75 persons per family, with single female/mother families (777 | 46.3%) accounting for the largest median family size of 5.33 persons per family. On the other hand, married-couple families (640 | 38.1%) represent the smallest median family size with 4.21 persons per family.
| Family Type | # Families | Family Size |
| Married-Couple | 640 (38.1%) | 4.21 |
| Single Male/Father | 262 (15.6%) | 4.36 |
| Single Female/Mother | 777 (46.3%) | 5.33 |
| Total Families | 1,679 (100.0%) | 4.75 |
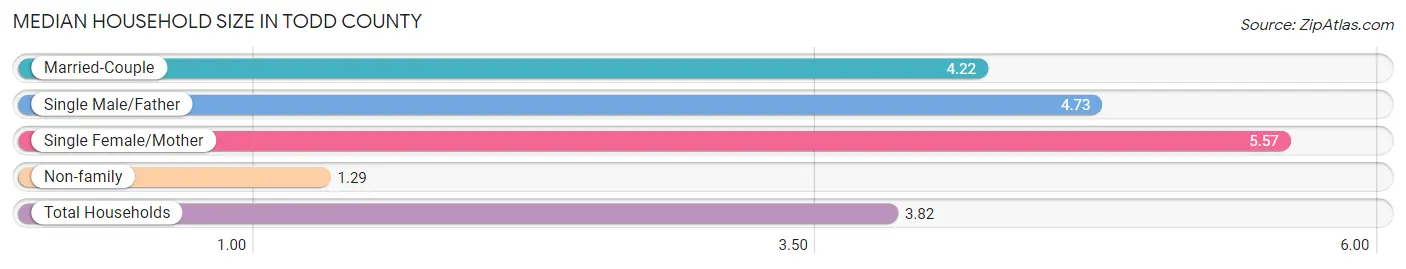
Median Household Size in Todd County
The median household size in Todd County is 3.82 persons per household, with single female/mother households (777 | 32.3%) accounting for the largest median household size of 5.57 persons per household. non-family households (728 | 30.2%) represent the smallest median household size with 1.29 persons per household.
| Household Type | # Households | Household Size |
| Married-Couple | 640 (26.6%) | 4.22 |
| Single Male/Father | 262 (10.9%) | 4.73 |
| Single Female/Mother | 777 (32.3%) | 5.57 |
| Non-family | 728 (30.2%) | 1.29 |
| Total Households | 2,407 (100.0%) | 3.82 |
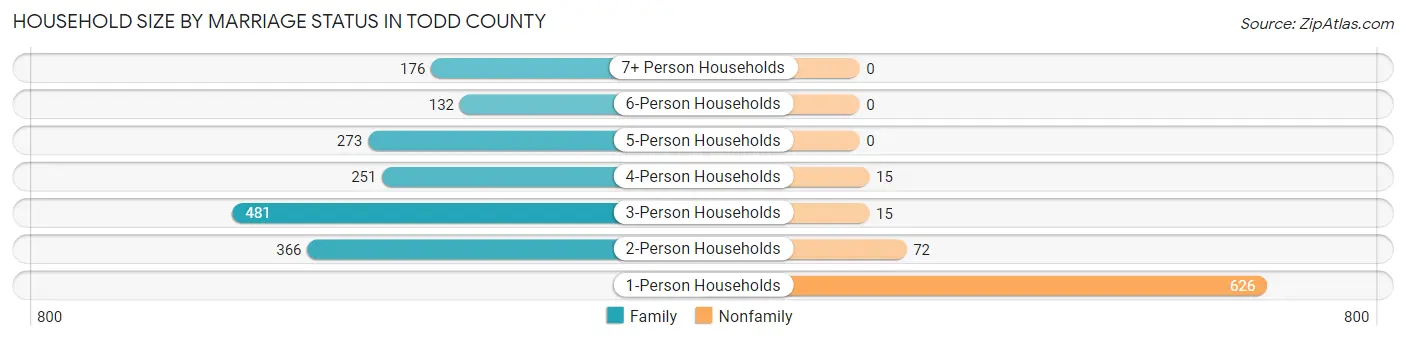
Household Size by Marriage Status in Todd County
Out of a total of 2,407 households in Todd County, 1,679 (69.8%) are family households, while 728 (30.2%) are nonfamily households. The most numerous type of family households are 3-person households, comprising 481, and the most common type of nonfamily households are 1-person households, comprising 626.
| Household Size | Family Households | Nonfamily Households |
| 1-Person Households | - | 626 (26.0%) |
| 2-Person Households | 366 (15.2%) | 72 (3.0%) |
| 3-Person Households | 481 (20.0%) | 15 (0.6%) |
| 4-Person Households | 251 (10.4%) | 15 (0.6%) |
| 5-Person Households | 273 (11.3%) | 0 (0.0%) |
| 6-Person Households | 132 (5.5%) | 0 (0.0%) |
| 7+ Person Households | 176 (7.3%) | 0 (0.0%) |
| Total | 1,679 (69.8%) | 728 (30.2%) |
Female Fertility in Todd County
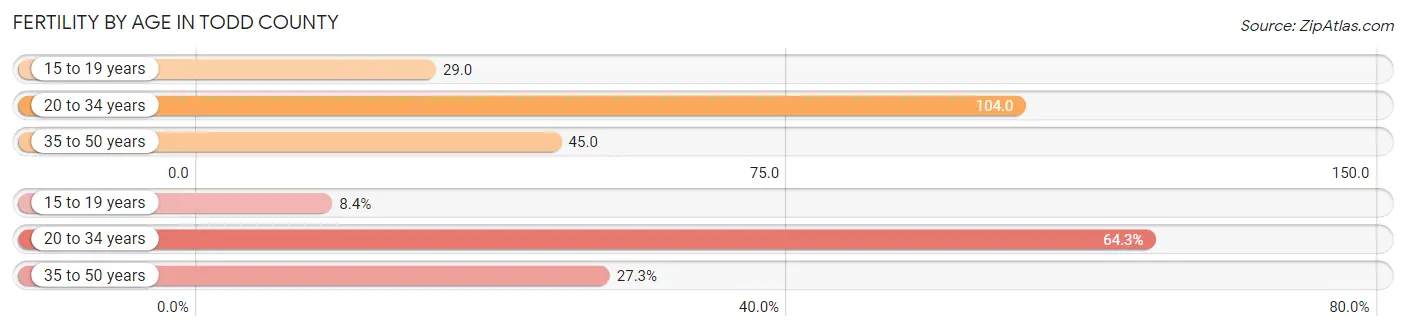
Fertility by Age in Todd County
Average fertility rate in Todd County is 66.0 births per 1,000 women. Women in the age bracket of 20 to 34 years have the highest fertility rate with 104.0 births per 1,000 women. Women in the age bracket of 20 to 34 years acount for 64.3% of all women with births.
| Age Bracket | Women with Births | Births / 1,000 Women |
| 15 to 19 years | 13 (8.4%) | 29.0 |
| 20 to 34 years | 99 (64.3%) | 104.0 |
| 35 to 50 years | 42 (27.3%) | 45.0 |
| Total | 154 (100.0%) | 66.0 |
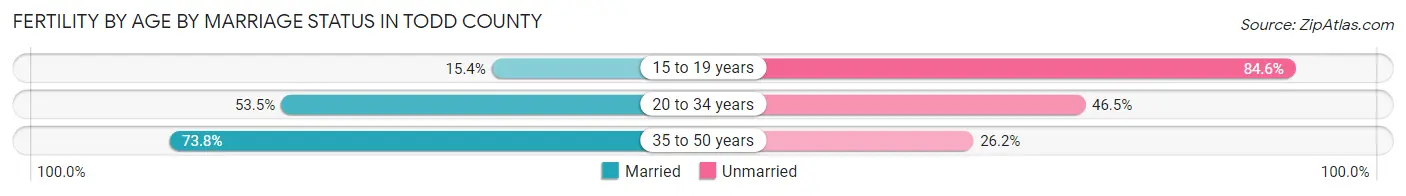
Fertility by Age by Marriage Status in Todd County
55.8% of women with births (154) in Todd County are married. The highest percentage of unmarried women with births falls into 15 to 19 years age bracket with 84.6% of them unmarried at the time of birth, while the lowest percentage of unmarried women with births belong to 35 to 50 years age bracket with 26.2% of them unmarried.
| Age Bracket | Married | Unmarried |
| 15 to 19 years | 2 (15.4%) | 11 (84.6%) |
| 20 to 34 years | 53 (53.5%) | 46 (46.5%) |
| 35 to 50 years | 31 (73.8%) | 11 (26.2%) |
| Total | 86 (55.8%) | 68 (44.2%) |
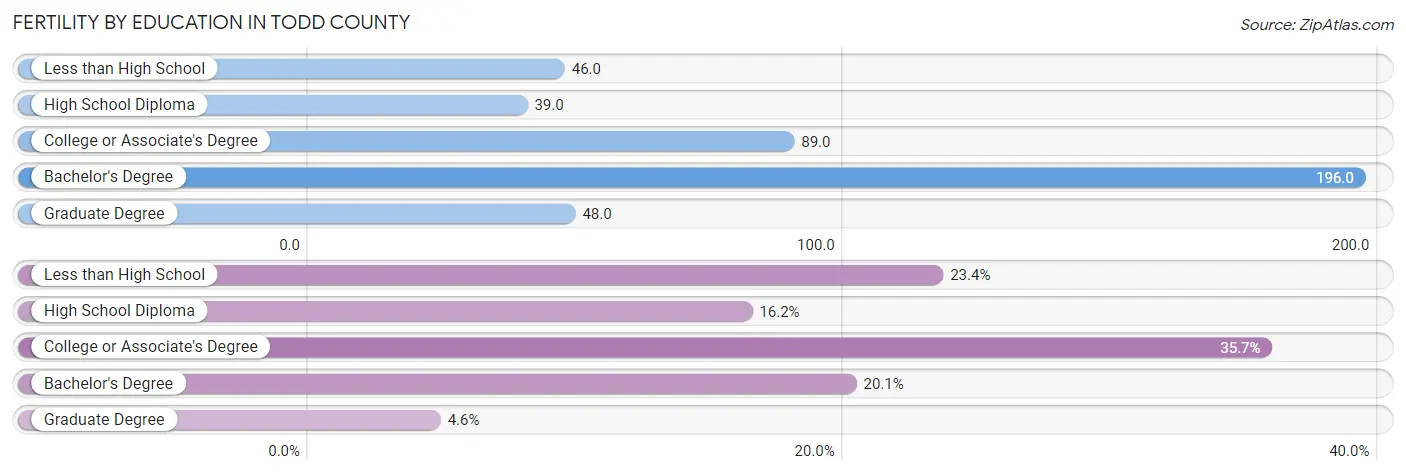
Fertility by Education in Todd County
Average fertility rate in Todd County is 66.0 births per 1,000 women. Women with the education attainment of bachelor's degree have the highest fertility rate of 196.0 births per 1,000 women, while women with the education attainment of high school diploma have the lowest fertility at 39.0 births per 1,000 women. Women with the education attainment of college or associate's degree represent 35.7% of all women with births.
| Educational Attainment | Women with Births | Births / 1,000 Women |
| Less than High School | 36 (23.4%) | 46.0 |
| High School Diploma | 25 (16.2%) | 39.0 |
| College or Associate's Degree | 55 (35.7%) | 89.0 |
| Bachelor's Degree | 31 (20.1%) | 196.0 |
| Graduate Degree | 7 (4.5%) | 48.0 |
| Total | 154 (100.0%) | 66.0 |
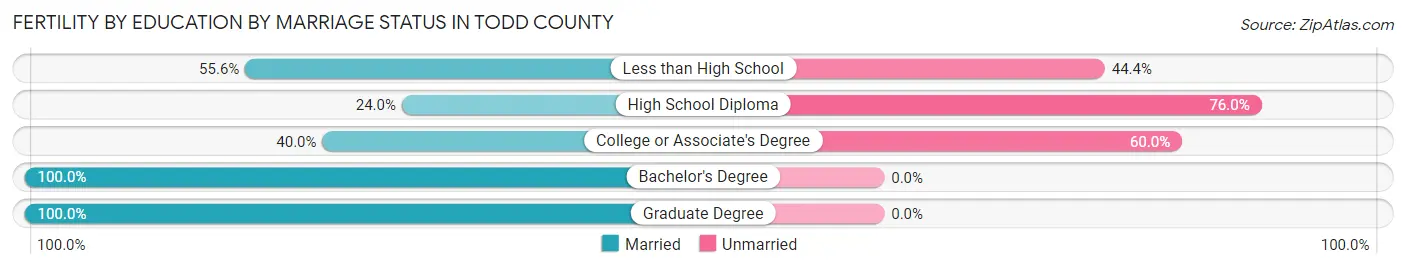
Fertility by Education by Marriage Status in Todd County
44.2% of women with births in Todd County are unmarried. Women with the educational attainment of bachelor's degree are most likely to be married with 100.0% of them married at childbirth, while women with the educational attainment of high school diploma are least likely to be married with 76.0% of them unmarried at childbirth.
| Educational Attainment | Married | Unmarried |
| Less than High School | 20 (55.6%) | 16 (44.4%) |
| High School Diploma | 6 (24.0%) | 19 (76.0%) |
| College or Associate's Degree | 22 (40.0%) | 33 (60.0%) |
| Bachelor's Degree | 31 (100.0%) | 0 (0.0%) |
| Graduate Degree | 7 (100.0%) | 0 (0.0%) |
| Total | 86 (55.8%) | 68 (44.2%) |
Income in Todd County
Income Overview in Todd County
Per Capita Income in Todd County is $12,562, while median incomes of families and households are $35,458 and $33,792 respectively.
| Characteristic | Number | Measure |
| Per Capita Income | 9,353 | $12,562 |
| Median Family Income | 1,679 | $35,458 |
| Mean Family Income | 1,679 | $46,501 |
| Median Household Income | 2,407 | $33,792 |
| Mean Household Income | 2,407 | $44,378 |
| Income Deficit | 1,679 | $19,054 |
| Wage / Income Gap (%) | 9,353 | 13.79% |
| Wage / Income Gap ($) | 9,353 | 86.21¢ per $1 |
| Gini / Inequality Index | 9,353 | 0.50 |
Earnings by Sex in Todd County
Average Earnings in Todd County are $30,577, $32,470 for men and $27,992 for women, a difference of 13.8%.
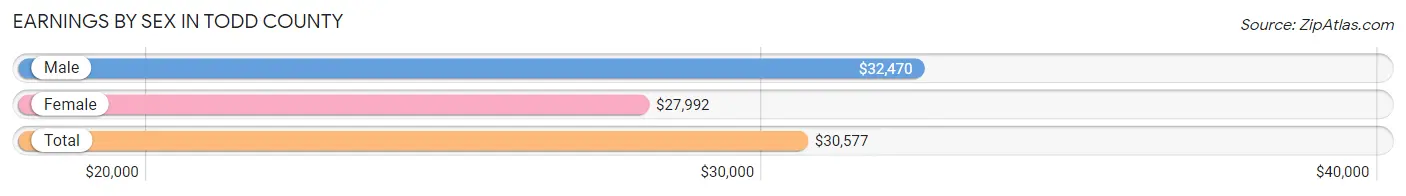
| Sex | Number | Average Earnings |
| Male | 1,291 (48.5%) | $32,470 |
| Female | 1,373 (51.5%) | $27,992 |
| Total | 2,664 (100.0%) | $30,577 |
Earnings by Sex by Income Bracket in Todd County
The most common earnings brackets in Todd County are $30,000 to $34,999 for men (137 | 10.6%) and $7,500 to $9,999 for women (166 | 12.1%).
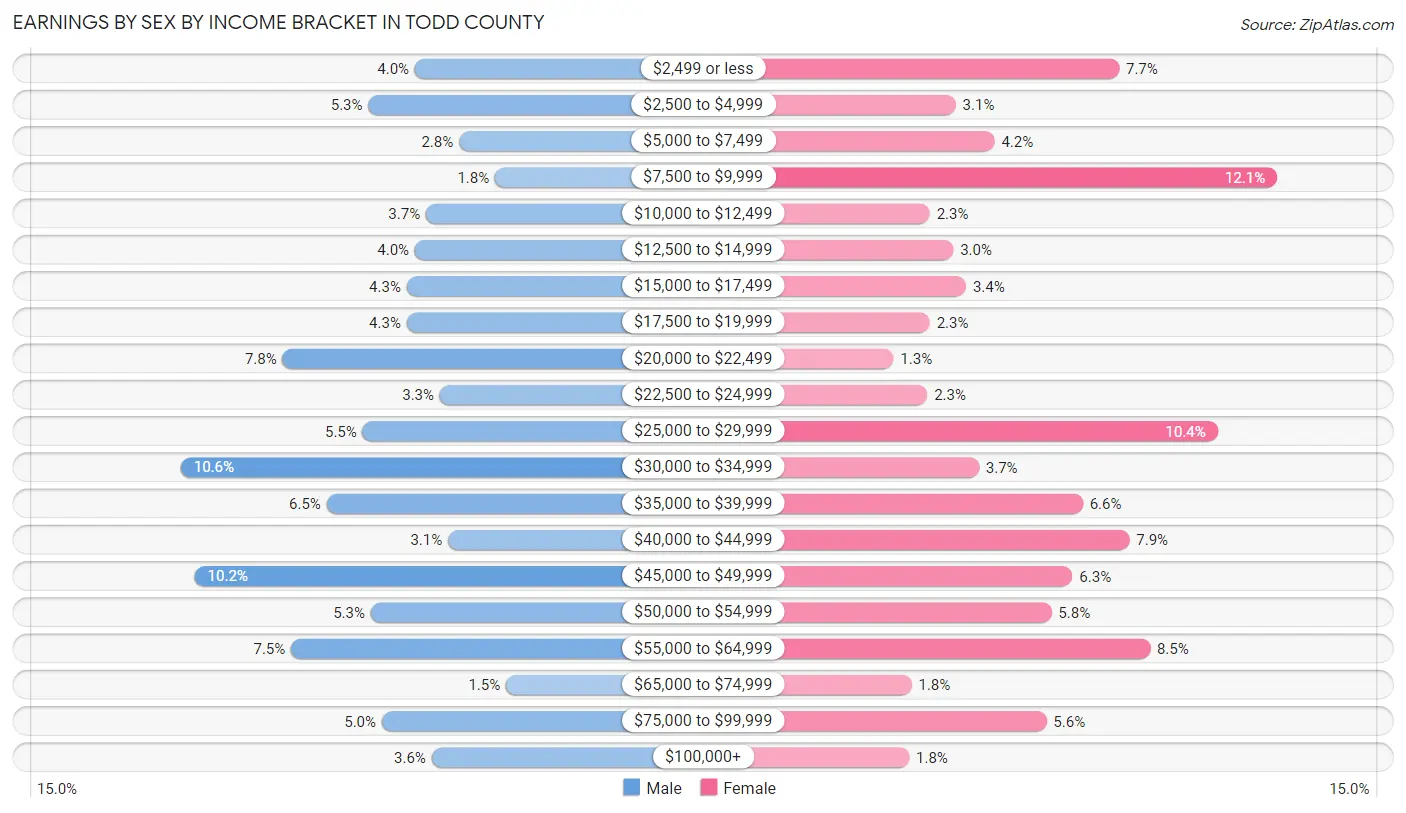
| Income | Male | Female |
| $2,499 or less | 52 (4.0%) | 105 (7.6%) |
| $2,500 to $4,999 | 69 (5.3%) | 42 (3.1%) |
| $5,000 to $7,499 | 36 (2.8%) | 57 (4.2%) |
| $7,500 to $9,999 | 23 (1.8%) | 166 (12.1%) |
| $10,000 to $12,499 | 48 (3.7%) | 32 (2.3%) |
| $12,500 to $14,999 | 52 (4.0%) | 41 (3.0%) |
| $15,000 to $17,499 | 55 (4.3%) | 46 (3.4%) |
| $17,500 to $19,999 | 55 (4.3%) | 32 (2.3%) |
| $20,000 to $22,499 | 100 (7.7%) | 18 (1.3%) |
| $22,500 to $24,999 | 43 (3.3%) | 31 (2.3%) |
| $25,000 to $29,999 | 71 (5.5%) | 143 (10.4%) |
| $30,000 to $34,999 | 137 (10.6%) | 51 (3.7%) |
| $35,000 to $39,999 | 84 (6.5%) | 91 (6.6%) |
| $40,000 to $44,999 | 40 (3.1%) | 109 (7.9%) |
| $45,000 to $49,999 | 132 (10.2%) | 87 (6.3%) |
| $50,000 to $54,999 | 68 (5.3%) | 79 (5.8%) |
| $55,000 to $64,999 | 97 (7.5%) | 117 (8.5%) |
| $65,000 to $74,999 | 19 (1.5%) | 25 (1.8%) |
| $75,000 to $99,999 | 64 (5.0%) | 77 (5.6%) |
| $100,000+ | 46 (3.6%) | 24 (1.8%) |
| Total | 1,291 (100.0%) | 1,373 (100.0%) |
Earnings by Sex by Educational Attainment in Todd County
Average earnings in Todd County are $33,592 for men and $35,530 for women, a difference of 5.4%. Men with an educational attainment of bachelor's degree enjoy the highest average annual earnings of $47,560, while those with less than high school education earn the least with $21,042. Women with an educational attainment of graduate degree earn the most with the average annual earnings of $57,195, while those with less than high school education have the smallest earnings of $9,208.
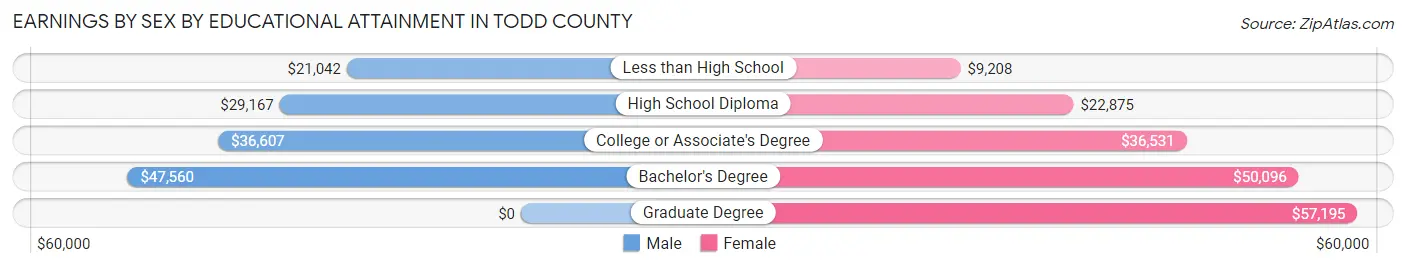
| Educational Attainment | Male Income | Female Income |
| Less than High School | $21,042 | $9,208 |
| High School Diploma | $29,167 | $22,875 |
| College or Associate's Degree | $36,607 | $36,531 |
| Bachelor's Degree | $47,560 | $50,096 |
| Graduate Degree | - | - |
| Total | $33,592 | $35,530 |
Family Income in Todd County
Family Income Brackets in Todd County
According to the Todd County family income data, there are 322 families falling into the less than $10,000 income range, which is the most common income bracket and makes up 19.2% of all families. Conversely, the $200,000+ income bracket is the least frequent group with only 24 families (1.4%) belonging to this category.
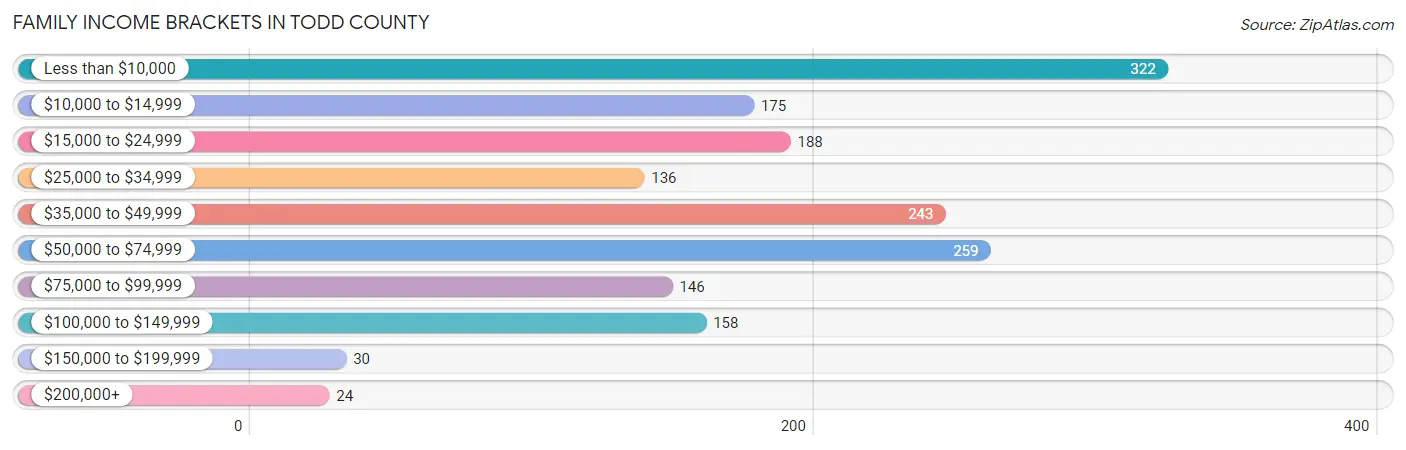
| Income Bracket | # Families | % Families |
| Less than $10,000 | 322 | 19.2% |
| $10,000 to $14,999 | 175 | 10.4% |
| $15,000 to $24,999 | 188 | 11.2% |
| $25,000 to $34,999 | 136 | 8.1% |
| $35,000 to $49,999 | 243 | 14.5% |
| $50,000 to $74,999 | 259 | 15.4% |
| $75,000 to $99,999 | 146 | 8.7% |
| $100,000 to $149,999 | 158 | 9.4% |
| $150,000 to $199,999 | 30 | 1.8% |
| $200,000+ | 24 | 1.4% |
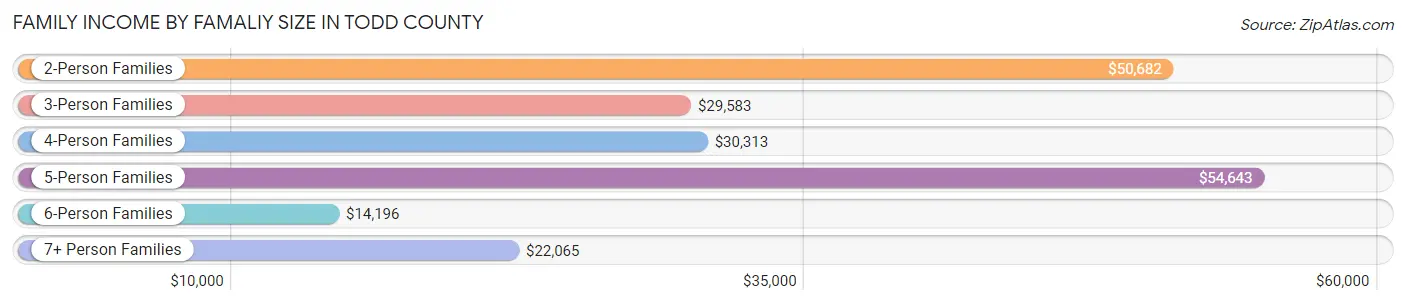
Family Income by Famaliy Size in Todd County
5-person families (254 | 15.1%) account for the highest median family income in Todd County with $54,643 per family, while 2-person families (424 | 25.3%) have the highest median income of $25,341 per family member.
| Income Bracket | # Families | Median Income |
| 2-Person Families | 424 (25.3%) | $50,682 |
| 3-Person Families | 443 (26.4%) | $29,583 |
| 4-Person Families | 273 (16.3%) | $30,313 |
| 5-Person Families | 254 (15.1%) | $54,643 |
| 6-Person Families | 139 (8.3%) | $14,196 |
| 7+ Person Families | 146 (8.7%) | $22,065 |
| Total | 1,679 (100.0%) | $35,458 |
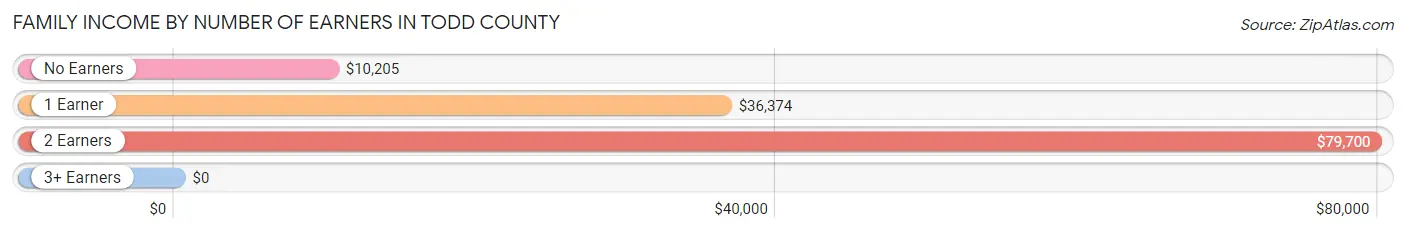
Family Income by Number of Earners in Todd County
| Number of Earners | # Families | Median Income |
| No Earners | 517 (30.8%) | $10,205 |
| 1 Earner | 685 (40.8%) | $36,374 |
| 2 Earners | 386 (23.0%) | $79,700 |
| 3+ Earners | 91 (5.4%) | $0 |
| Total | 1,679 (100.0%) | $35,458 |
Household Income in Todd County
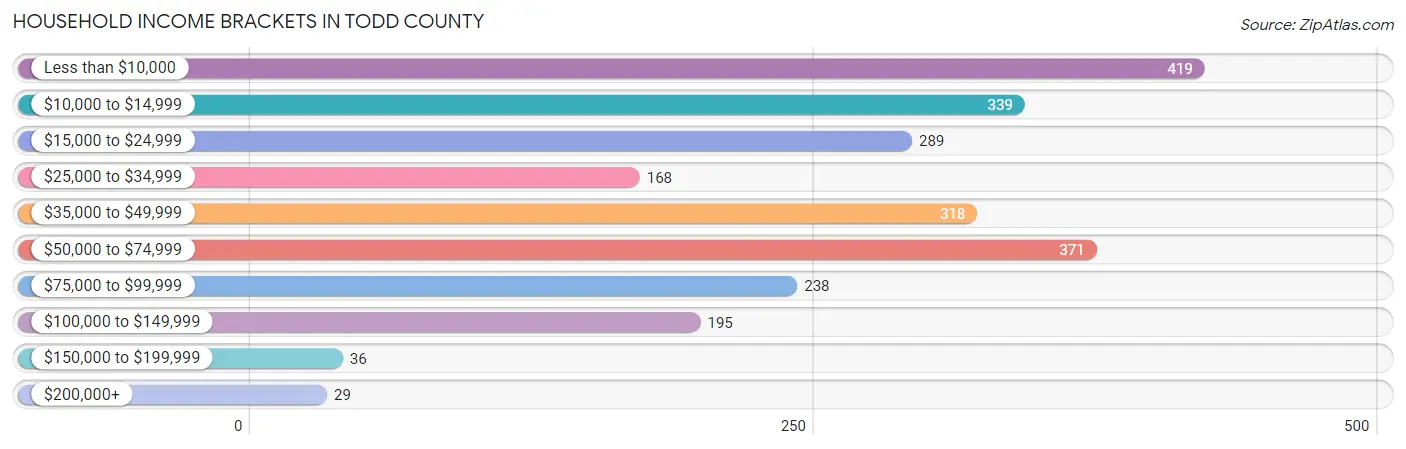
Household Income Brackets in Todd County
With 419 households falling in the category, the less than $10,000 income range is the most frequent in Todd County, accounting for 17.4% of all households. In contrast, only 29 households (1.2%) fall into the $200,000+ income bracket, making it the least populous group.
| Income Bracket | # Households | % Households |
| Less than $10,000 | 419 | 17.4% |
| $10,000 to $14,999 | 339 | 14.1% |
| $15,000 to $24,999 | 289 | 12.0% |
| $25,000 to $34,999 | 168 | 7.0% |
| $35,000 to $49,999 | 318 | 13.2% |
| $50,000 to $74,999 | 371 | 15.4% |
| $75,000 to $99,999 | 238 | 9.9% |
| $100,000 to $149,999 | 195 | 8.1% |
| $150,000 to $199,999 | 36 | 1.5% |
| $200,000+ | 29 | 1.2% |
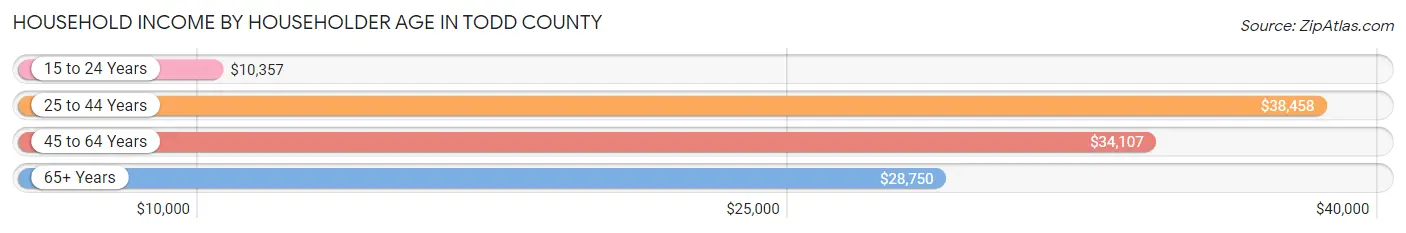
Household Income by Householder Age in Todd County
The median household income in Todd County is $33,792, with the highest median household income of $38,458 found in the 25 to 44 years age bracket for the primary householder. A total of 941 households (39.1%) fall into this category. Meanwhile, the 15 to 24 years age bracket for the primary householder has the lowest median household income of $10,357, with 88 households (3.7%) in this group.
| Income Bracket | # Households | Median Income |
| 15 to 24 Years | 88 (3.7%) | $10,357 |
| 25 to 44 Years | 941 (39.1%) | $38,458 |
| 45 to 64 Years | 950 (39.5%) | $34,107 |
| 65+ Years | 428 (17.8%) | $28,750 |
| Total | 2,407 (100.0%) | $33,792 |
Poverty in Todd County
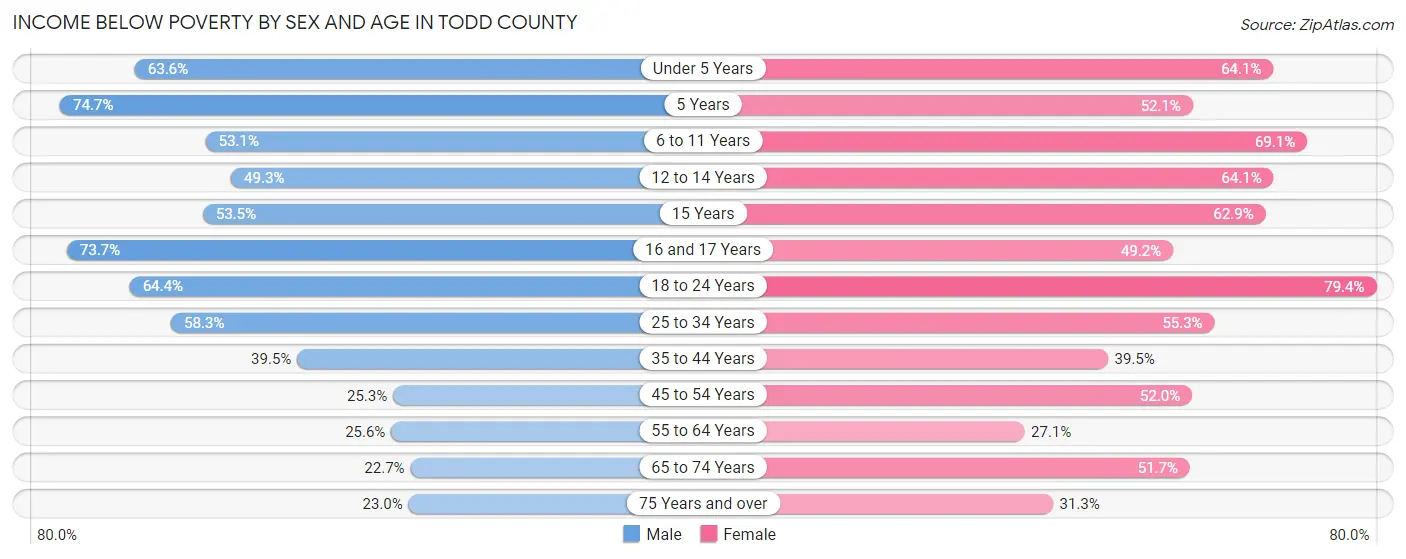
Income Below Poverty by Sex and Age in Todd County
With 49.3% poverty level for males and 54.9% for females among the residents of Todd County, 5 year old males and 18 to 24 year old females are the most vulnerable to poverty, with 68 males (74.7%) and 377 females (79.4%) in their respective age groups living below the poverty level.
| Age Bracket | Male | Female |
| Under 5 Years | 362 (63.6%) | 303 (64.1%) |
| 5 Years | 68 (74.7%) | 62 (52.1%) |
| 6 to 11 Years | 356 (53.1%) | 420 (69.1%) |
| 12 to 14 Years | 145 (49.3%) | 168 (64.1%) |
| 15 Years | 68 (53.5%) | 56 (62.9%) |
| 16 and 17 Years | 115 (73.7%) | 91 (49.2%) |
| 18 to 24 Years | 311 (64.4%) | 377 (79.4%) |
| 25 to 34 Years | 332 (58.3%) | 358 (55.3%) |
| 35 to 44 Years | 202 (39.5%) | 255 (39.5%) |
| 45 to 54 Years | 88 (25.3%) | 221 (52.0%) |
| 55 to 64 Years | 91 (25.6%) | 108 (27.1%) |
| 65 to 74 Years | 47 (22.7%) | 124 (51.7%) |
| 75 Years and over | 20 (23.0%) | 46 (31.3%) |
| Total | 2,205 (49.3%) | 2,589 (54.9%) |
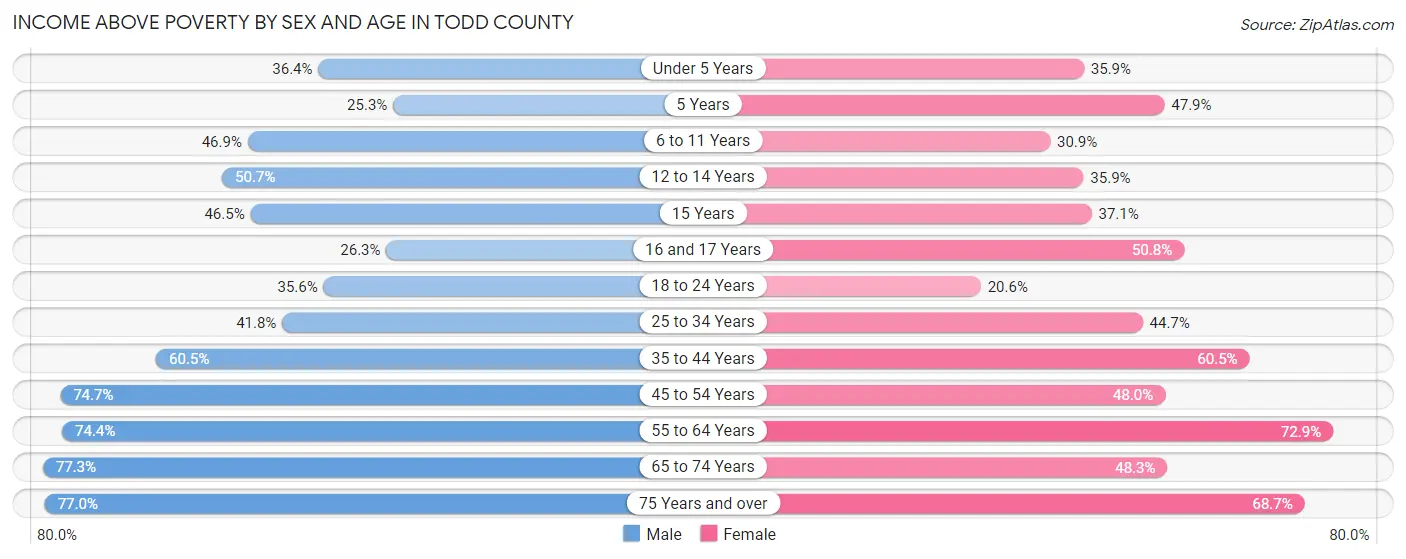
Income Above Poverty by Sex and Age in Todd County
According to the poverty statistics in Todd County, males aged 65 to 74 years and females aged 55 to 64 years are the age groups that are most secure financially, with 77.3% of males and 72.9% of females in these age groups living above the poverty line.
| Age Bracket | Male | Female |
| Under 5 Years | 207 (36.4%) | 170 (35.9%) |
| 5 Years | 23 (25.3%) | 57 (47.9%) |
| 6 to 11 Years | 314 (46.9%) | 188 (30.9%) |
| 12 to 14 Years | 149 (50.7%) | 94 (35.9%) |
| 15 Years | 59 (46.5%) | 33 (37.1%) |
| 16 and 17 Years | 41 (26.3%) | 94 (50.8%) |
| 18 to 24 Years | 172 (35.6%) | 98 (20.6%) |
| 25 to 34 Years | 238 (41.7%) | 289 (44.7%) |
| 35 to 44 Years | 309 (60.5%) | 391 (60.5%) |
| 45 to 54 Years | 260 (74.7%) | 204 (48.0%) |
| 55 to 64 Years | 265 (74.4%) | 291 (72.9%) |
| 65 to 74 Years | 160 (77.3%) | 116 (48.3%) |
| 75 Years and over | 67 (77.0%) | 101 (68.7%) |
| Total | 2,264 (50.7%) | 2,126 (45.1%) |
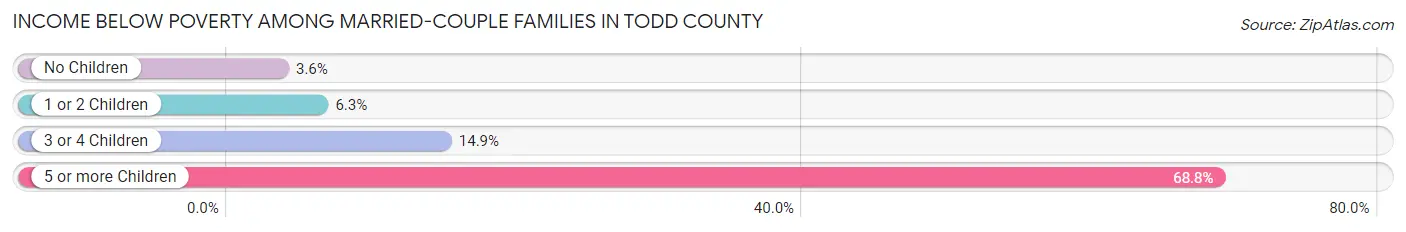
Income Below Poverty Among Married-Couple Families in Todd County
The poverty statistics for married-couple families in Todd County show that 10.5% or 67 of the total 640 families live below the poverty line. Families with 5 or more children have the highest poverty rate of 68.8%, comprising of 22 families. On the other hand, families with no children have the lowest poverty rate of 3.5%, which includes 7 families.
| Children | Above Poverty | Below Poverty |
| No Children | 190 (96.5%) | 7 (3.5%) |
| 1 or 2 Children | 253 (93.7%) | 17 (6.3%) |
| 3 or 4 Children | 120 (85.1%) | 21 (14.9%) |
| 5 or more Children | 10 (31.2%) | 22 (68.8%) |
| Total | 573 (89.5%) | 67 (10.5%) |
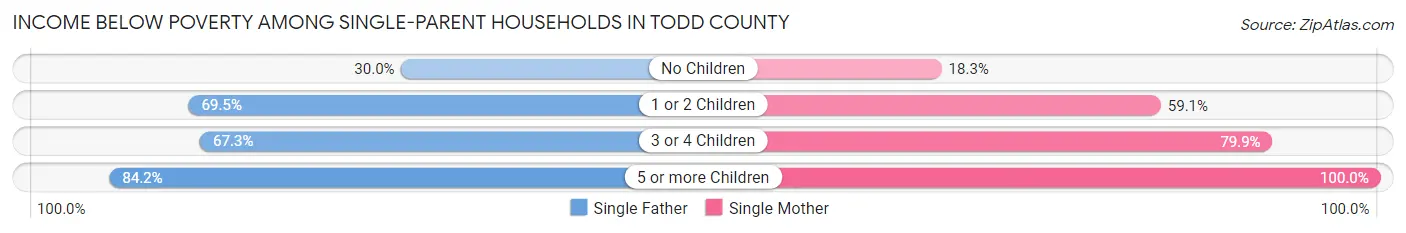
Income Below Poverty Among Single-Parent Households in Todd County
According to the poverty data in Todd County, 61.1% or 160 single-father households and 62.4% or 485 single-mother households are living below the poverty line. Among single-father households, those with 5 or more children have the highest poverty rate, with 16 households (84.2%) experiencing poverty. Likewise, among single-mother households, those with 5 or more children have the highest poverty rate, with 59 households (100.0%) falling below the poverty line.
| Children | Single Father | Single Mother |
| No Children | 18 (30.0%) | 25 (18.2%) |
| 1 or 2 Children | 91 (69.5%) | 179 (59.1%) |
| 3 or 4 Children | 35 (67.3%) | 222 (79.9%) |
| 5 or more Children | 16 (84.2%) | 59 (100.0%) |
| Total | 160 (61.1%) | 485 (62.4%) |
Income Below Poverty Among Married-Couple vs Single-Parent Households in Todd County
The poverty data for Todd County shows that 67 of the married-couple family households (10.5%) and 645 of the single-parent households (62.1%) are living below the poverty level. Within the married-couple family households, those with 5 or more children have the highest poverty rate, with 22 households (68.8%) falling below the poverty line. Among the single-parent households, those with 5 or more children have the highest poverty rate, with 75 household (96.2%) living below poverty.
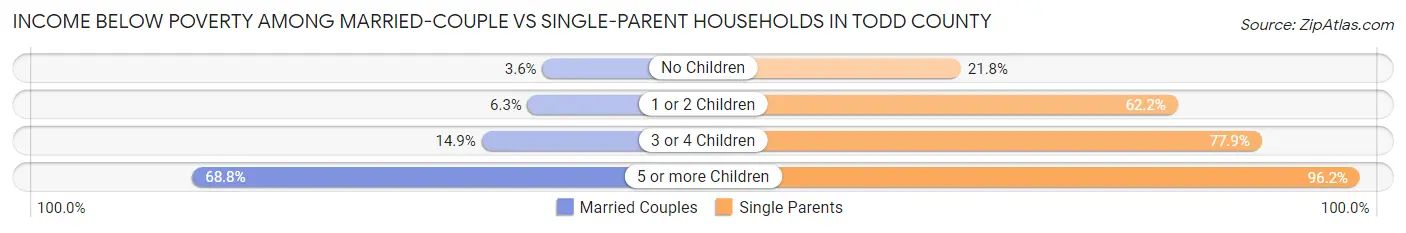
| Children | Married-Couple Families | Single-Parent Households |
| No Children | 7 (3.5%) | 43 (21.8%) |
| 1 or 2 Children | 17 (6.3%) | 270 (62.2%) |
| 3 or 4 Children | 21 (14.9%) | 257 (77.9%) |
| 5 or more Children | 22 (68.8%) | 75 (96.2%) |
| Total | 67 (10.5%) | 645 (62.1%) |
Employment Characteristics in Todd County
Employment by Class of Employer in Todd County
Among the 2,290 employed individuals in Todd County, private company employees (565 | 24.7%), local government employees (457 | 20.0%), and not-for-profit organizations (397 | 17.3%) make up the most common classes of employment.
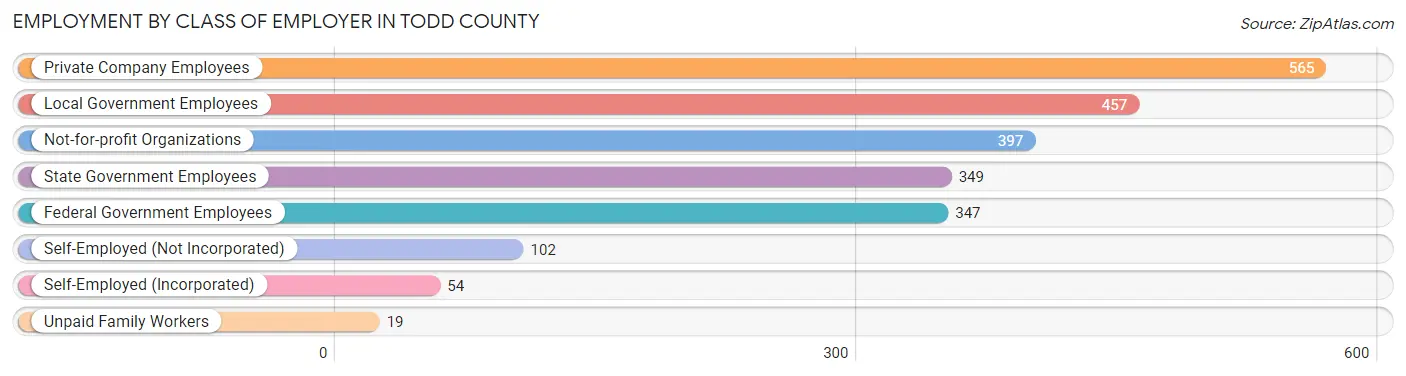
| Employer Class | # Employees | % Employees |
| Private Company Employees | 565 | 24.7% |
| Self-Employed (Incorporated) | 54 | 2.4% |
| Self-Employed (Not Incorporated) | 102 | 4.4% |
| Not-for-profit Organizations | 397 | 17.3% |
| Local Government Employees | 457 | 20.0% |
| State Government Employees | 349 | 15.2% |
| Federal Government Employees | 347 | 15.1% |
| Unpaid Family Workers | 19 | 0.8% |
| Total | 2,290 | 100.0% |
Employment Status by Age in Todd County
According to the labor force statistics for Todd County, out of the total population over 16 years of age (6,008), 45.2% or 2,716 individuals are in the labor force, with 15.1% or 410 of them unemployed. The age group with the highest labor force participation rate is 35 to 44 years, with 64.7% or 773 individuals in the labor force. Within the labor force, the 20 to 24 years age range has the highest percentage of unemployed individuals, with 36.6% or 104 of them being unemployed.
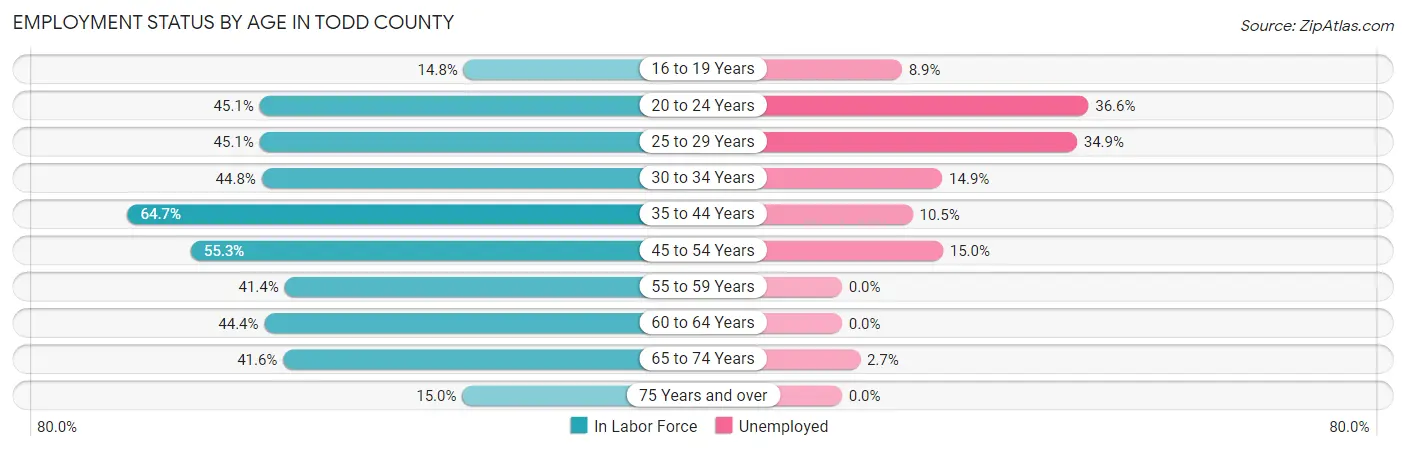
| Age Bracket | In Labor Force | Unemployed |
| 16 to 19 Years | 101 (14.8%) | 9 (8.9%) |
| 20 to 24 Years | 284 (45.1%) | 104 (36.6%) |
| 25 to 29 Years | 306 (45.1%) | 107 (34.9%) |
| 30 to 34 Years | 262 (44.8%) | 39 (14.9%) |
| 35 to 44 Years | 773 (64.7%) | 81 (10.5%) |
| 45 to 54 Years | 440 (55.3%) | 66 (15.0%) |
| 55 to 59 Years | 152 (41.4%) | 0 (0.0%) |
| 60 to 64 Years | 175 (44.4%) | 0 (0.0%) |
| 65 to 74 Years | 186 (41.6%) | 5 (2.7%) |
| 75 Years and over | 35 (15.0%) | 0 (0.0%) |
| Total | 2,716 (45.2%) | 410 (15.1%) |
Employment Status by Educational Attainment in Todd County
According to labor force statistics for Todd County, 52.5% of individuals (2,107) out of the total population between 25 and 64 years of age (4,014) are in the labor force, with 13.8% or 291 of them being unemployed. The group with the highest labor force participation rate are those with the educational attainment of bachelor's degree or higher, with 85.8% or 479 individuals in the labor force. Within the labor force, individuals with less than high school education have the highest percentage of unemployment, with 40.2% or 105 of them being unemployed.
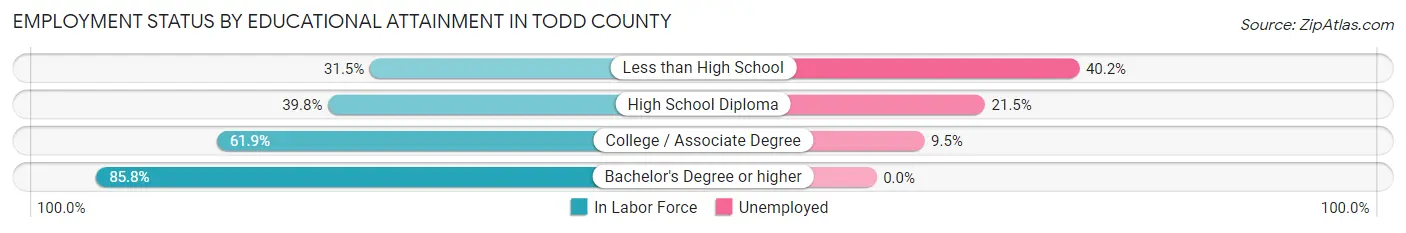
| Educational Attainment | In Labor Force | Unemployed |
| Less than High School | 261 (31.5%) | 333 (40.2%) |
| High School Diploma | 466 (39.8%) | 252 (21.5%) |
| College / Associate Degree | 902 (61.9%) | 138 (9.5%) |
| Bachelor's Degree or higher | 479 (85.8%) | 0 (0.0%) |
| Total | 2,107 (52.5%) | 554 (13.8%) |
Employment Occupations by Sex in Todd County
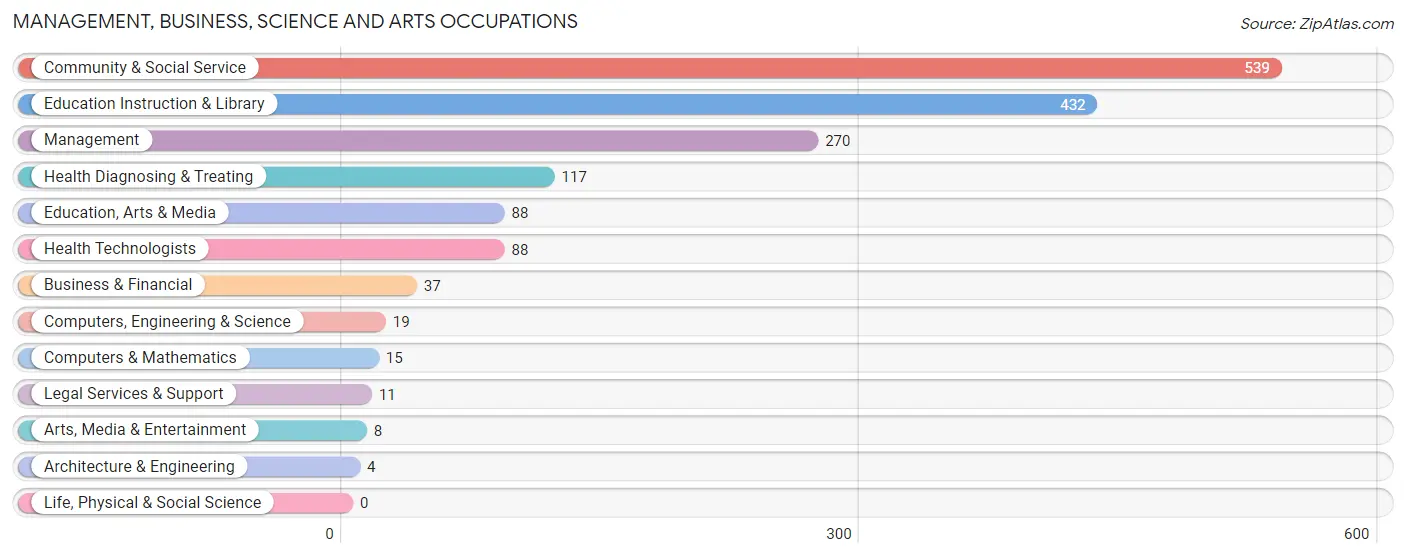
Management, Business, Science and Arts Occupations
The most common Management, Business, Science and Arts occupations in Todd County are Community & Social Service (539 | 23.5%), Education Instruction & Library (432 | 18.8%), Management (270 | 11.8%), Health Diagnosing & Treating (117 | 5.1%), and Education, Arts & Media (88 | 3.8%).
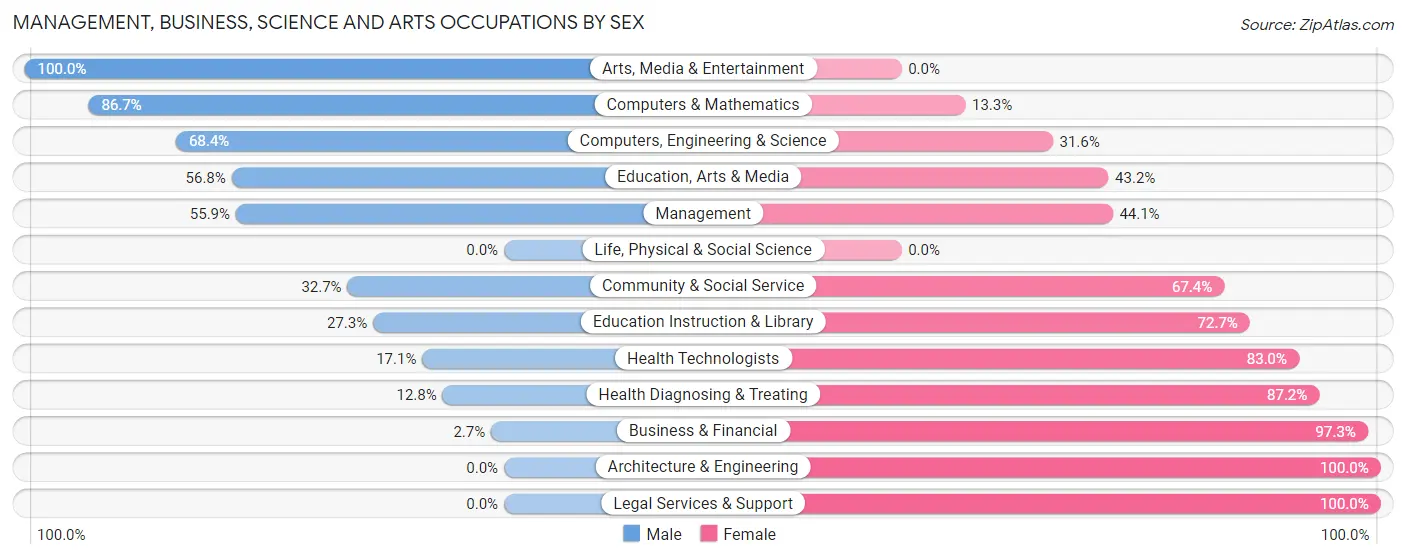
Management, Business, Science and Arts Occupations by Sex
Within the Management, Business, Science and Arts occupations in Todd County, the most male-oriented occupations are Arts, Media & Entertainment (100.0%), Computers & Mathematics (86.7%), and Computers, Engineering & Science (68.4%), while the most female-oriented occupations are Architecture & Engineering (100.0%), Legal Services & Support (100.0%), and Business & Financial (97.3%).
| Occupation | Male | Female |
| Management | 151 (55.9%) | 119 (44.1%) |
| Business & Financial | 1 (2.7%) | 36 (97.3%) |
| Computers, Engineering & Science | 13 (68.4%) | 6 (31.6%) |
| Computers & Mathematics | 13 (86.7%) | 2 (13.3%) |
| Architecture & Engineering | 0 (0.0%) | 4 (100.0%) |
| Life, Physical & Social Science | 0 (0.0%) | 0 (0.0%) |
| Community & Social Service | 176 (32.7%) | 363 (67.3%) |
| Education, Arts & Media | 50 (56.8%) | 38 (43.2%) |
| Legal Services & Support | 0 (0.0%) | 11 (100.0%) |
| Education Instruction & Library | 118 (27.3%) | 314 (72.7%) |
| Arts, Media & Entertainment | 8 (100.0%) | 0 (0.0%) |
| Health Diagnosing & Treating | 15 (12.8%) | 102 (87.2%) |
| Health Technologists | 15 (17.1%) | 73 (83.0%) |
| Total (Category) | 356 (36.2%) | 626 (63.7%) |
| Total (Overall) | 1,083 (47.2%) | 1,213 (52.8%) |
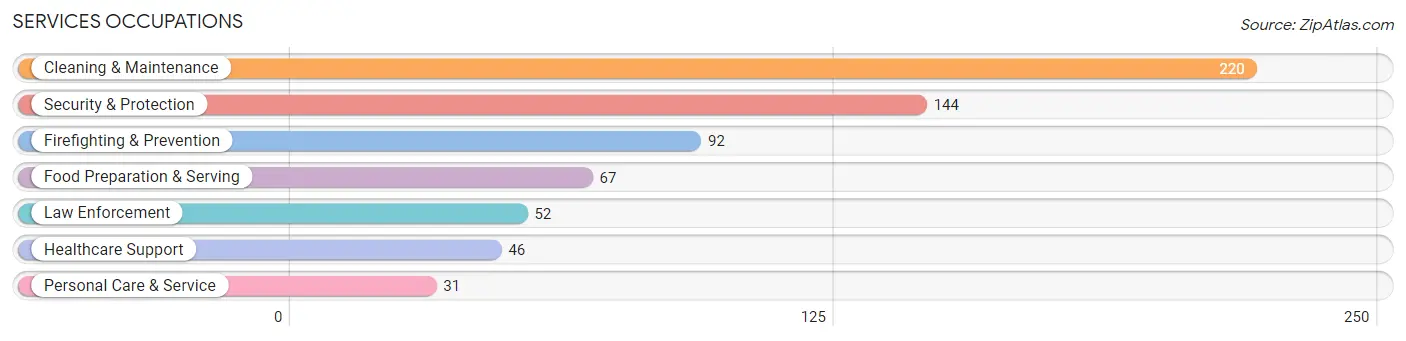
Services Occupations
The most common Services occupations in Todd County are Cleaning & Maintenance (220 | 9.6%), Security & Protection (144 | 6.3%), Firefighting & Prevention (92 | 4.0%), Food Preparation & Serving (67 | 2.9%), and Law Enforcement (52 | 2.3%).
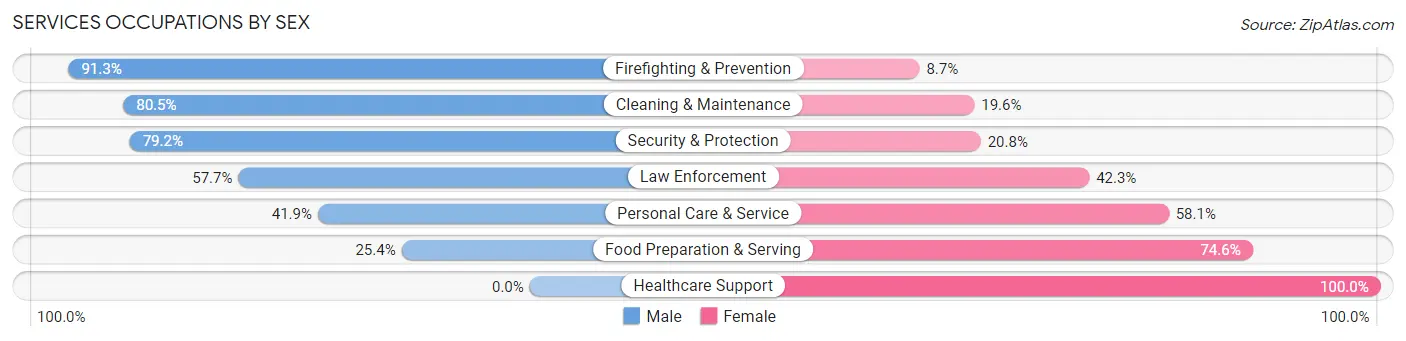
Services Occupations by Sex
Within the Services occupations in Todd County, the most male-oriented occupations are Firefighting & Prevention (91.3%), Cleaning & Maintenance (80.4%), and Security & Protection (79.2%), while the most female-oriented occupations are Healthcare Support (100.0%), Food Preparation & Serving (74.6%), and Personal Care & Service (58.1%).
| Occupation | Male | Female |
| Healthcare Support | 0 (0.0%) | 46 (100.0%) |
| Security & Protection | 114 (79.2%) | 30 (20.8%) |
| Firefighting & Prevention | 84 (91.3%) | 8 (8.7%) |
| Law Enforcement | 30 (57.7%) | 22 (42.3%) |
| Food Preparation & Serving | 17 (25.4%) | 50 (74.6%) |
| Cleaning & Maintenance | 177 (80.4%) | 43 (19.6%) |
| Personal Care & Service | 13 (41.9%) | 18 (58.1%) |
| Total (Category) | 321 (63.2%) | 187 (36.8%) |
| Total (Overall) | 1,083 (47.2%) | 1,213 (52.8%) |
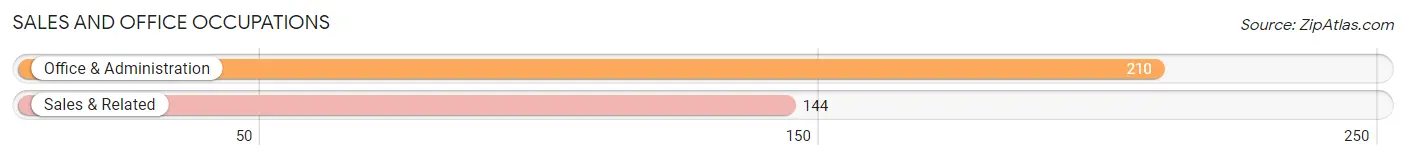
Sales and Office Occupations
The most common Sales and Office occupations in Todd County are Office & Administration (210 | 9.1%), and Sales & Related (144 | 6.3%).
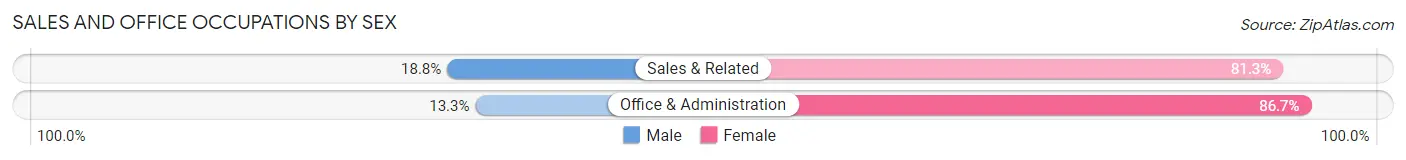
Sales and Office Occupations by Sex
| Occupation | Male | Female |
| Sales & Related | 27 (18.8%) | 117 (81.2%) |
| Office & Administration | 28 (13.3%) | 182 (86.7%) |
| Total (Category) | 55 (15.5%) | 299 (84.5%) |
| Total (Overall) | 1,083 (47.2%) | 1,213 (52.8%) |
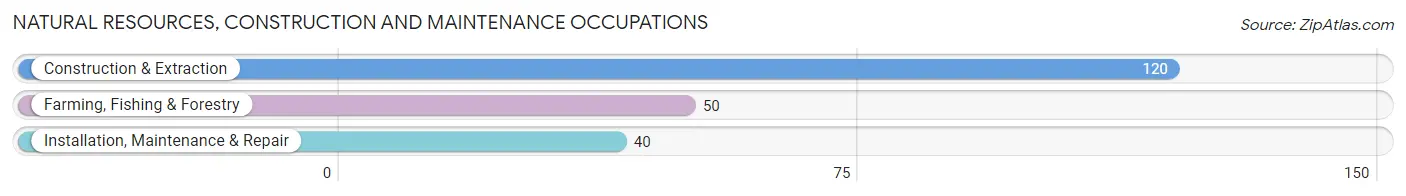
Natural Resources, Construction and Maintenance Occupations
The most common Natural Resources, Construction and Maintenance occupations in Todd County are Construction & Extraction (120 | 5.2%), Farming, Fishing & Forestry (50 | 2.2%), and Installation, Maintenance & Repair (40 | 1.7%).
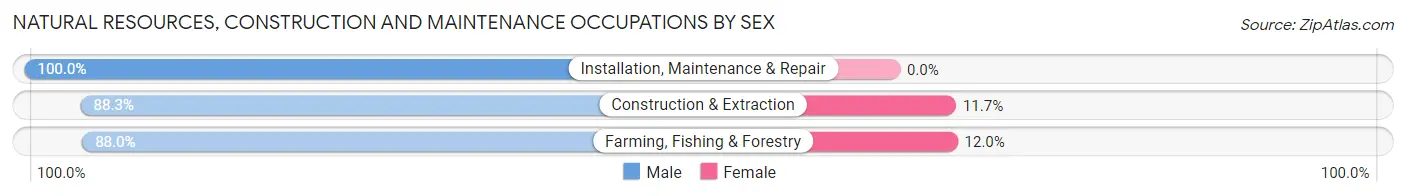
Natural Resources, Construction and Maintenance Occupations by Sex
| Occupation | Male | Female |
| Farming, Fishing & Forestry | 44 (88.0%) | 6 (12.0%) |
| Construction & Extraction | 106 (88.3%) | 14 (11.7%) |
| Installation, Maintenance & Repair | 40 (100.0%) | 0 (0.0%) |
| Total (Category) | 190 (90.5%) | 20 (9.5%) |
| Total (Overall) | 1,083 (47.2%) | 1,213 (52.8%) |
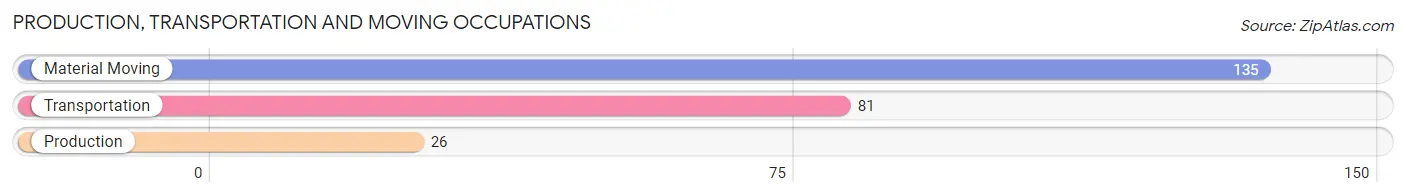
Production, Transportation and Moving Occupations
The most common Production, Transportation and Moving occupations in Todd County are Material Moving (135 | 5.9%), Transportation (81 | 3.5%), and Production (26 | 1.1%).
Production, Transportation and Moving Occupations by Sex
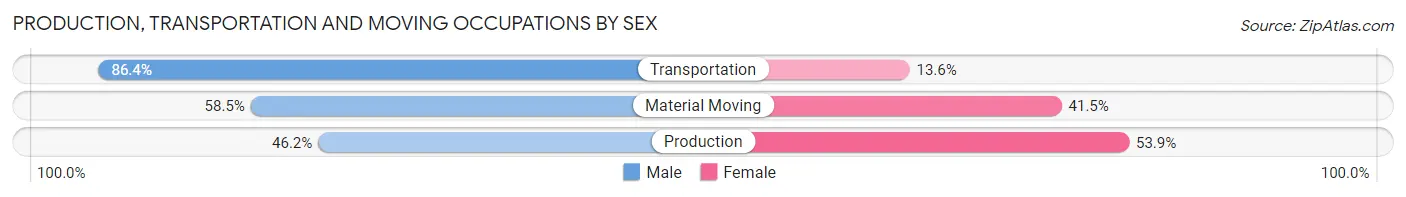
| Occupation | Male | Female |
| Production | 12 (46.2%) | 14 (53.8%) |
| Transportation | 70 (86.4%) | 11 (13.6%) |
| Material Moving | 79 (58.5%) | 56 (41.5%) |
| Total (Category) | 161 (66.5%) | 81 (33.5%) |
| Total (Overall) | 1,083 (47.2%) | 1,213 (52.8%) |
Employment Industries by Sex in Todd County
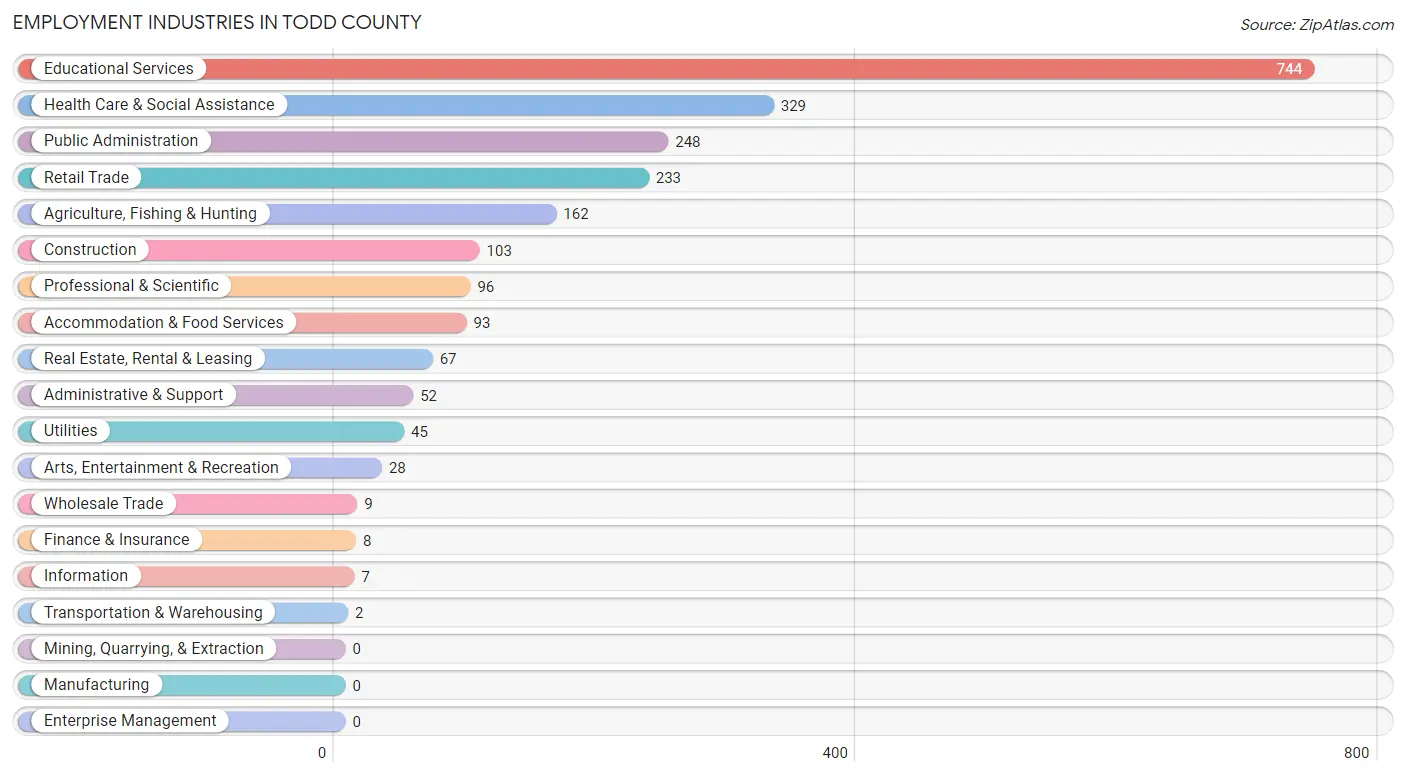
Employment Industries in Todd County
The major employment industries in Todd County include Educational Services (744 | 32.4%), Health Care & Social Assistance (329 | 14.3%), Public Administration (248 | 10.8%), Retail Trade (233 | 10.2%), and Agriculture, Fishing & Hunting (162 | 7.1%).
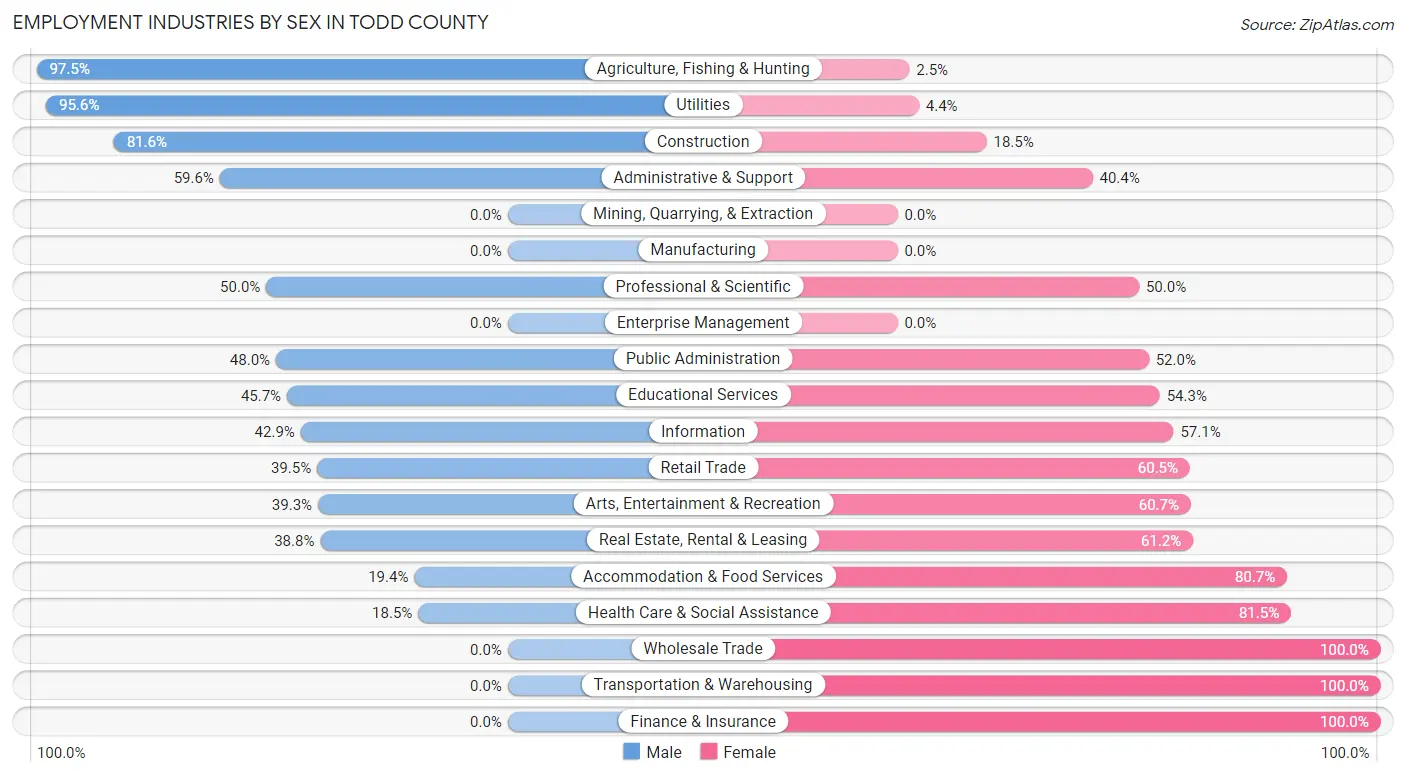
Employment Industries by Sex in Todd County
The Todd County industries that see more men than women are Agriculture, Fishing & Hunting (97.5%), Utilities (95.6%), and Construction (81.6%), whereas the industries that tend to have a higher number of women are Wholesale Trade (100.0%), Transportation & Warehousing (100.0%), and Finance & Insurance (100.0%).
| Industry | Male | Female |
| Agriculture, Fishing & Hunting | 158 (97.5%) | 4 (2.5%) |
| Mining, Quarrying, & Extraction | 0 (0.0%) | 0 (0.0%) |
| Construction | 84 (81.6%) | 19 (18.4%) |
| Manufacturing | 0 (0.0%) | 0 (0.0%) |
| Wholesale Trade | 0 (0.0%) | 9 (100.0%) |
| Retail Trade | 92 (39.5%) | 141 (60.5%) |
| Transportation & Warehousing | 0 (0.0%) | 2 (100.0%) |
| Utilities | 43 (95.6%) | 2 (4.4%) |
| Information | 3 (42.9%) | 4 (57.1%) |
| Finance & Insurance | 0 (0.0%) | 8 (100.0%) |
| Real Estate, Rental & Leasing | 26 (38.8%) | 41 (61.2%) |
| Professional & Scientific | 48 (50.0%) | 48 (50.0%) |
| Enterprise Management | 0 (0.0%) | 0 (0.0%) |
| Administrative & Support | 31 (59.6%) | 21 (40.4%) |
| Educational Services | 340 (45.7%) | 404 (54.3%) |
| Health Care & Social Assistance | 61 (18.5%) | 268 (81.5%) |
| Arts, Entertainment & Recreation | 11 (39.3%) | 17 (60.7%) |
| Accommodation & Food Services | 18 (19.4%) | 75 (80.6%) |
| Public Administration | 119 (48.0%) | 129 (52.0%) |
| Total | 1,083 (47.2%) | 1,213 (52.8%) |
Education in Todd County
School Enrollment in Todd County
The most common levels of schooling among the 3,020 students in Todd County are middle school (824 | 27.3%), elementary school (801 | 26.5%), and high school (717 | 23.7%).
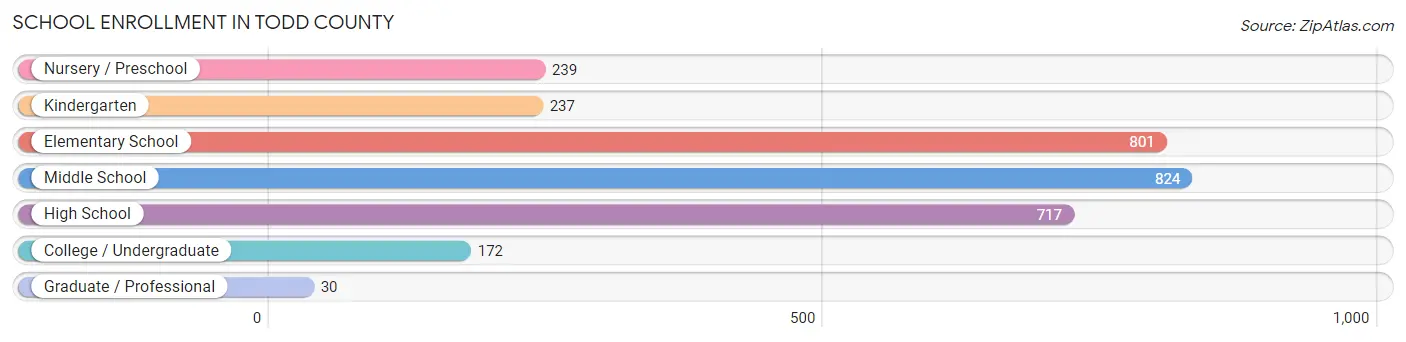
| School Level | # Students | % Students |
| Nursery / Preschool | 239 | 7.9% |
| Kindergarten | 237 | 7.9% |
| Elementary School | 801 | 26.5% |
| Middle School | 824 | 27.3% |
| High School | 717 | 23.7% |
| College / Undergraduate | 172 | 5.7% |
| Graduate / Professional | 30 | 1.0% |
| Total | 3,020 | 100.0% |
School Enrollment by Age by Funding Source in Todd County
Out of a total of 3,020 students who are enrolled in schools in Todd County, 223 (7.4%) attend a private institution, while the remaining 2,797 (92.6%) are enrolled in public schools. The age group of 25 to 34 year olds has the highest likelihood of being enrolled in private schools, with 23 (37.1% in the age bracket) enrolled. Conversely, the age group of 3 to 4 year olds has the lowest likelihood of being enrolled in a private school, with 166 (100.0% in the age bracket) attending a public institution.
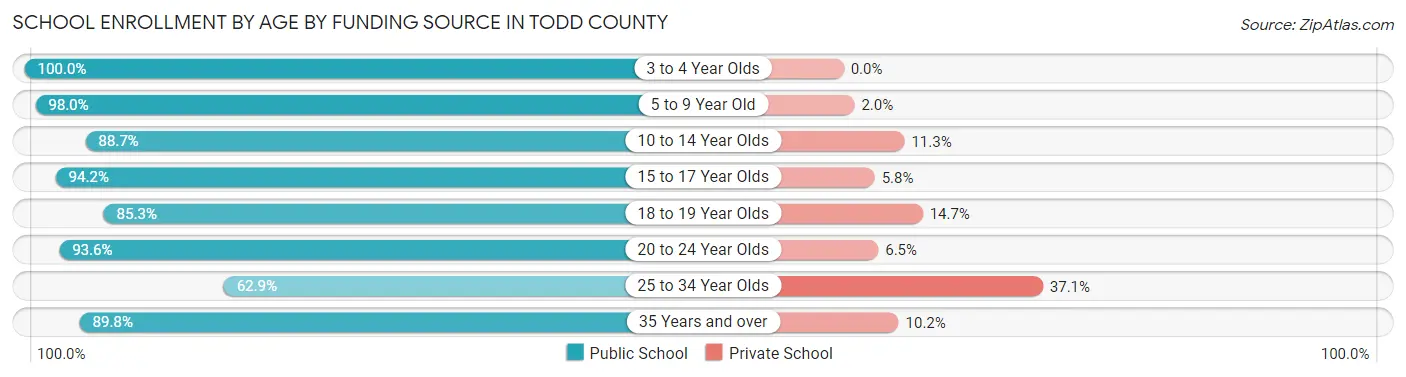
| Age Bracket | Public School | Private School |
| 3 to 4 Year Olds | 166 (100.0%) | 0 (0.0%) |
| 5 to 9 Year Old | 975 (98.0%) | 20 (2.0%) |
| 10 to 14 Year Olds | 853 (88.7%) | 109 (11.3%) |
| 15 to 17 Year Olds | 489 (94.2%) | 30 (5.8%) |
| 18 to 19 Year Olds | 168 (85.3%) | 29 (14.7%) |
| 20 to 24 Year Olds | 29 (93.5%) | 2 (6.5%) |
| 25 to 34 Year Olds | 39 (62.9%) | 23 (37.1%) |
| 35 Years and over | 79 (89.8%) | 9 (10.2%) |
| Total | 2,797 (92.6%) | 223 (7.4%) |
Educational Attainment by Field of Study in Todd County
Education (353 | 44.2%), science & technology (109 | 13.6%), business (101 | 12.6%), visual & performing arts (47 | 5.9%), and psychology (35 | 4.4%) are the most common fields of study among 799 individuals in Todd County who have obtained a bachelor's degree or higher.
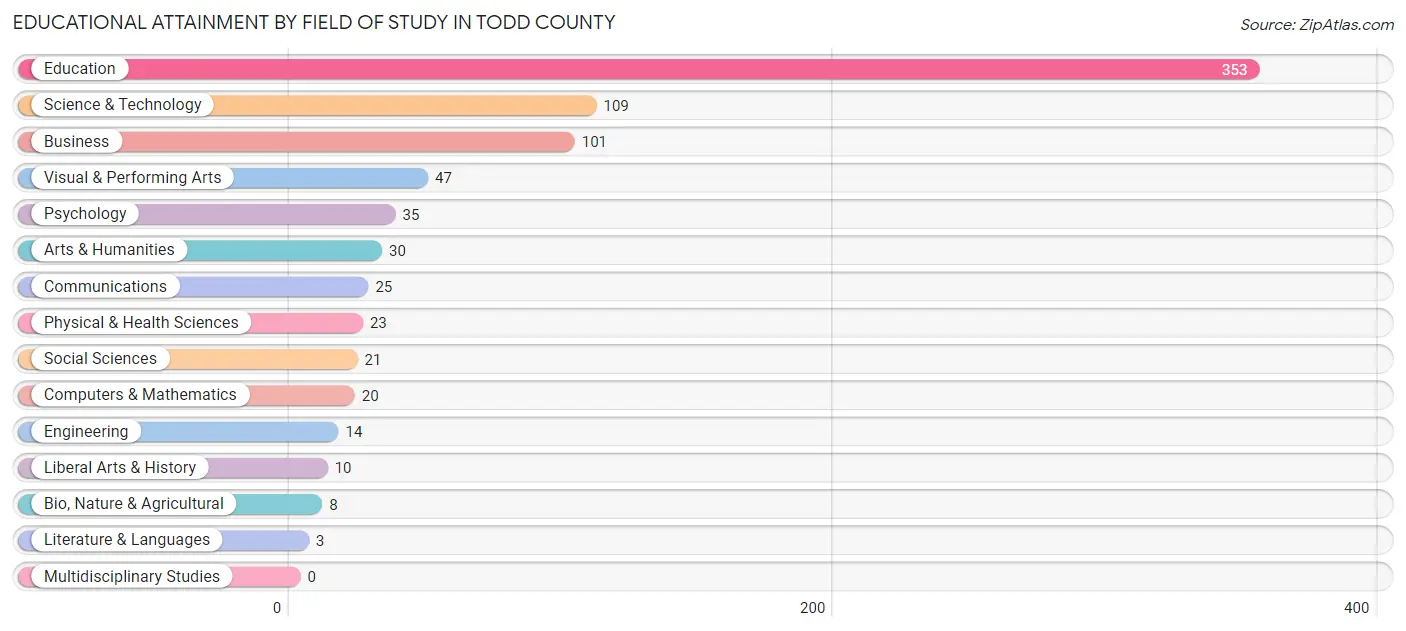
| Field of Study | # Graduates | % Graduates |
| Computers & Mathematics | 20 | 2.5% |
| Bio, Nature & Agricultural | 8 | 1.0% |
| Physical & Health Sciences | 23 | 2.9% |
| Psychology | 35 | 4.4% |
| Social Sciences | 21 | 2.6% |
| Engineering | 14 | 1.8% |
| Multidisciplinary Studies | 0 | 0.0% |
| Science & Technology | 109 | 13.6% |
| Business | 101 | 12.6% |
| Education | 353 | 44.2% |
| Literature & Languages | 3 | 0.4% |
| Liberal Arts & History | 10 | 1.3% |
| Visual & Performing Arts | 47 | 5.9% |
| Communications | 25 | 3.1% |
| Arts & Humanities | 30 | 3.7% |
| Total | 799 | 100.0% |
Transportation & Commute in Todd County
Vehicle Availability by Sex in Todd County
The most prevalent vehicle ownership categories in Todd County are males with 2 vehicles (365, accounting for 34.1%) and females with 2 vehicles (456, making up 30.5%).
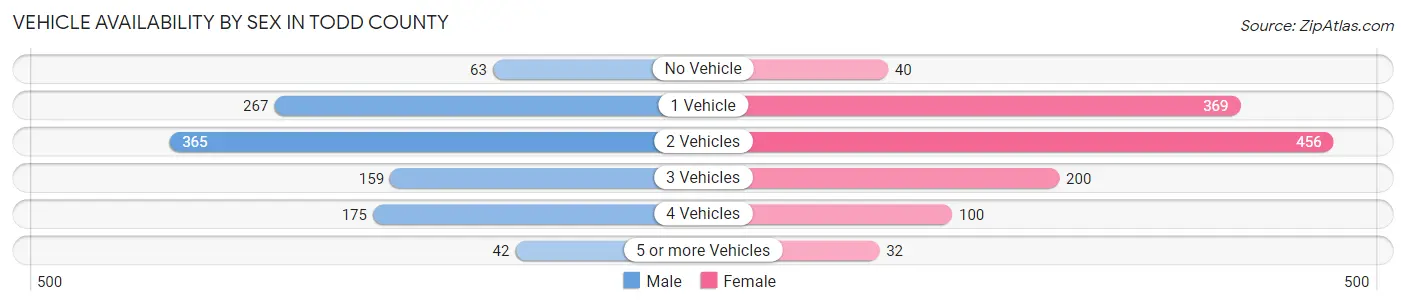
| Vehicles Available | Male | Female |
| No Vehicle | 63 (5.9%) | 40 (3.3%) |
| 1 Vehicle | 267 (24.9%) | 369 (30.8%) |
| 2 Vehicles | 365 (34.1%) | 456 (38.1%) |
| 3 Vehicles | 159 (14.8%) | 200 (16.7%) |
| 4 Vehicles | 175 (16.3%) | 100 (8.4%) |
| 5 or more Vehicles | 42 (3.9%) | 32 (2.7%) |
| Total | 1,071 (100.0%) | 1,197 (100.0%) |
Commute Time in Todd County
The most frequently occuring commute durations in Todd County are 5 to 9 minutes (469 commuters, 21.3%), 10 to 14 minutes (443 commuters, 20.1%), and 20 to 24 minutes (329 commuters, 14.9%).
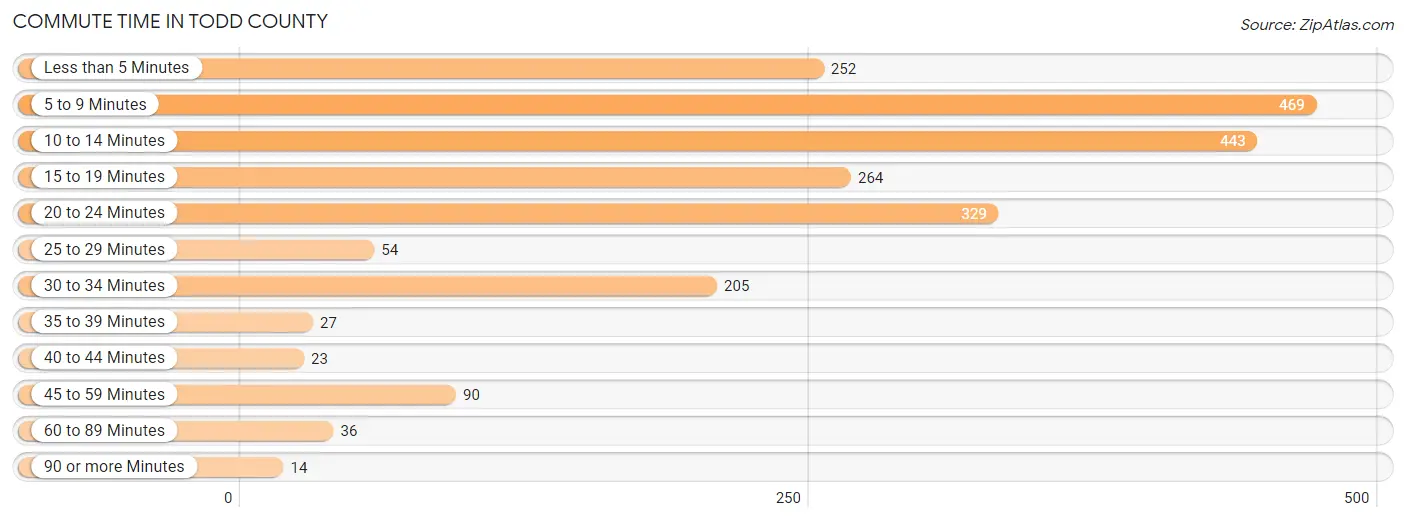
| Commute Time | # Commuters | % Commuters |
| Less than 5 Minutes | 252 | 11.4% |
| 5 to 9 Minutes | 469 | 21.3% |
| 10 to 14 Minutes | 443 | 20.1% |
| 15 to 19 Minutes | 264 | 12.0% |
| 20 to 24 Minutes | 329 | 14.9% |
| 25 to 29 Minutes | 54 | 2.5% |
| 30 to 34 Minutes | 205 | 9.3% |
| 35 to 39 Minutes | 27 | 1.2% |
| 40 to 44 Minutes | 23 | 1.0% |
| 45 to 59 Minutes | 90 | 4.1% |
| 60 to 89 Minutes | 36 | 1.6% |
| 90 or more Minutes | 14 | 0.6% |
Commute Time by Sex in Todd County
The most common commute times in Todd County are 5 to 9 minutes (217 commuters, 21.4%) for males and 10 to 14 minutes (308 commuters, 25.8%) for females.
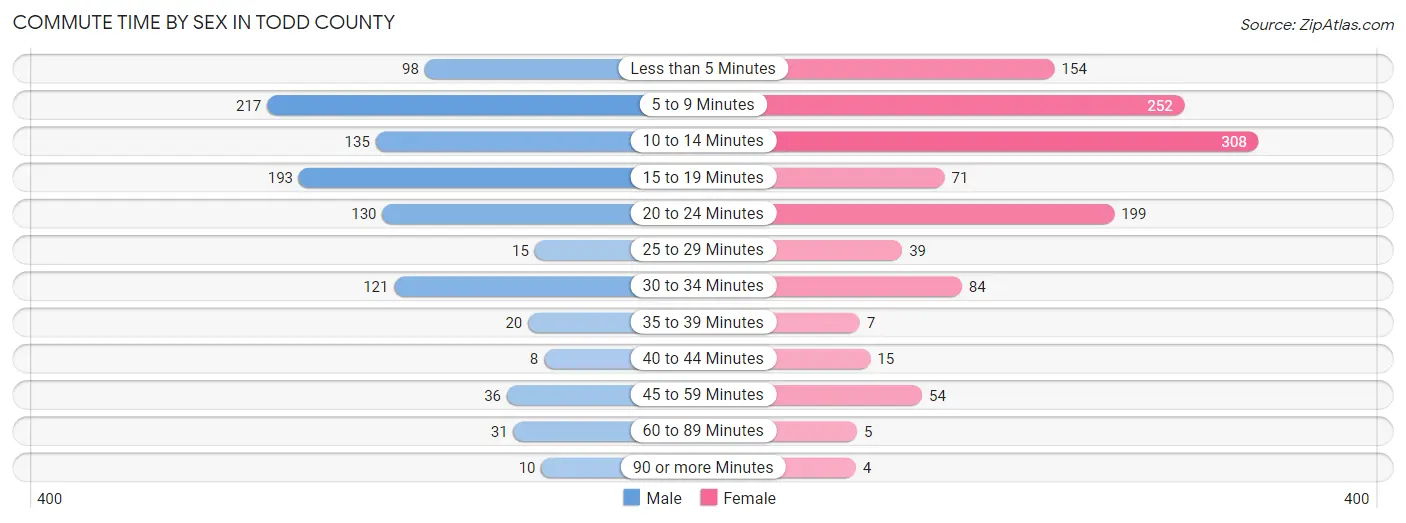
| Commute Time | Male | Female |
| Less than 5 Minutes | 98 (9.7%) | 154 (12.9%) |
| 5 to 9 Minutes | 217 (21.4%) | 252 (21.1%) |
| 10 to 14 Minutes | 135 (13.3%) | 308 (25.8%) |
| 15 to 19 Minutes | 193 (19.0%) | 71 (6.0%) |
| 20 to 24 Minutes | 130 (12.8%) | 199 (16.7%) |
| 25 to 29 Minutes | 15 (1.5%) | 39 (3.3%) |
| 30 to 34 Minutes | 121 (11.9%) | 84 (7.0%) |
| 35 to 39 Minutes | 20 (2.0%) | 7 (0.6%) |
| 40 to 44 Minutes | 8 (0.8%) | 15 (1.3%) |
| 45 to 59 Minutes | 36 (3.5%) | 54 (4.5%) |
| 60 to 89 Minutes | 31 (3.1%) | 5 (0.4%) |
| 90 or more Minutes | 10 (1.0%) | 4 (0.3%) |
Time of Departure to Work by Sex in Todd County
The most frequent times of departure to work in Todd County are 7:30 AM to 7:59 AM (410, 40.4%) for males and 7:30 AM to 7:59 AM (700, 58.7%) for females.
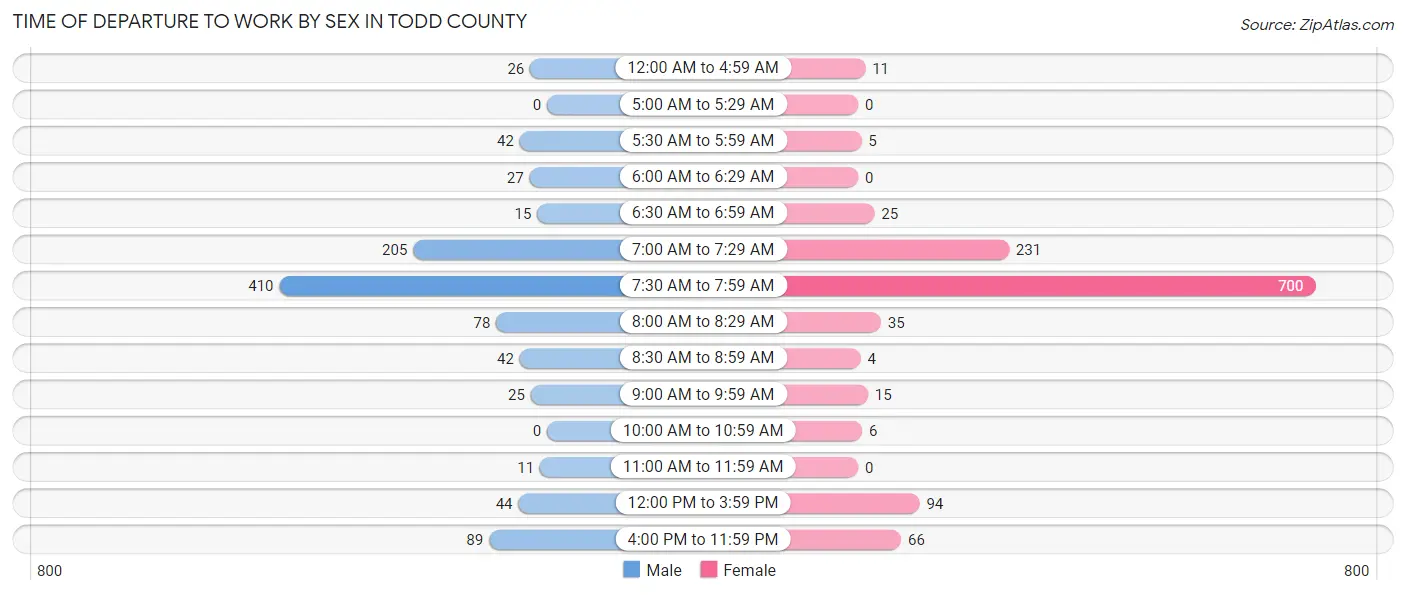
| Time of Departure | Male | Female |
| 12:00 AM to 4:59 AM | 26 (2.6%) | 11 (0.9%) |
| 5:00 AM to 5:29 AM | 0 (0.0%) | 0 (0.0%) |
| 5:30 AM to 5:59 AM | 42 (4.1%) | 5 (0.4%) |
| 6:00 AM to 6:29 AM | 27 (2.7%) | 0 (0.0%) |
| 6:30 AM to 6:59 AM | 15 (1.5%) | 25 (2.1%) |
| 7:00 AM to 7:29 AM | 205 (20.2%) | 231 (19.4%) |
| 7:30 AM to 7:59 AM | 410 (40.4%) | 700 (58.7%) |
| 8:00 AM to 8:29 AM | 78 (7.7%) | 35 (2.9%) |
| 8:30 AM to 8:59 AM | 42 (4.1%) | 4 (0.3%) |
| 9:00 AM to 9:59 AM | 25 (2.5%) | 15 (1.3%) |
| 10:00 AM to 10:59 AM | 0 (0.0%) | 6 (0.5%) |
| 11:00 AM to 11:59 AM | 11 (1.1%) | 0 (0.0%) |
| 12:00 PM to 3:59 PM | 44 (4.3%) | 94 (7.9%) |
| 4:00 PM to 11:59 PM | 89 (8.8%) | 66 (5.5%) |
| Total | 1,014 (100.0%) | 1,192 (100.0%) |
Housing Occupancy in Todd County
Occupancy by Ownership in Todd County
Of the total 2,407 dwellings in Todd County, owner-occupied units account for 1,034 (43.0%), while renter-occupied units make up 1,373 (57.0%).
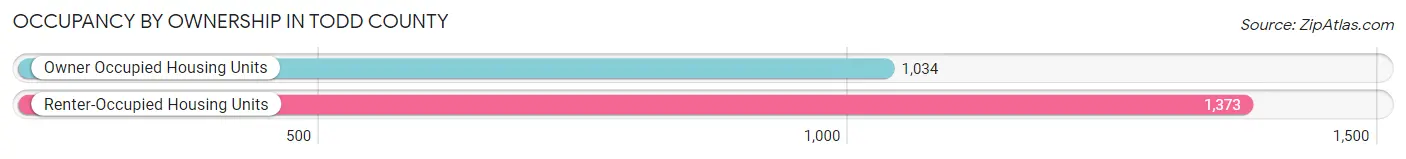
| Occupancy | # Housing Units | % Housing Units |
| Owner Occupied Housing Units | 1,034 | 43.0% |
| Renter-Occupied Housing Units | 1,373 | 57.0% |
| Total Occupied Housing Units | 2,407 | 100.0% |
Occupancy by Household Size in Todd County
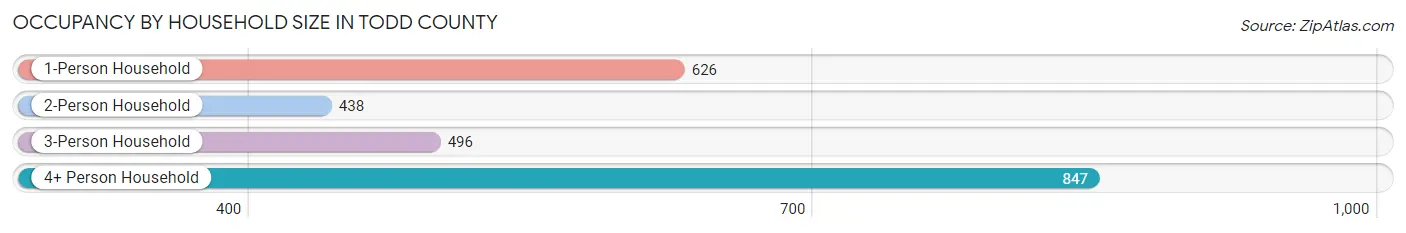
| Household Size | # Housing Units | % Housing Units |
| 1-Person Household | 626 | 26.0% |
| 2-Person Household | 438 | 18.2% |
| 3-Person Household | 496 | 20.6% |
| 4+ Person Household | 847 | 35.2% |
| Total Housing Units | 2,407 | 100.0% |
Occupancy by Ownership by Household Size in Todd County
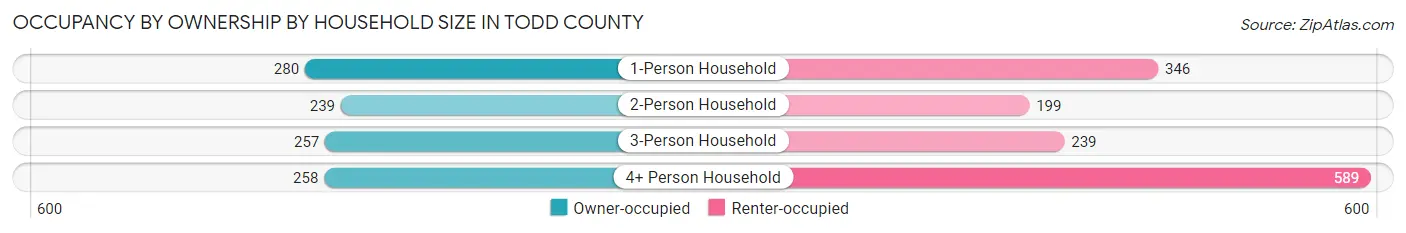
| Household Size | Owner-occupied | Renter-occupied |
| 1-Person Household | 280 (44.7%) | 346 (55.3%) |
| 2-Person Household | 239 (54.6%) | 199 (45.4%) |
| 3-Person Household | 257 (51.8%) | 239 (48.2%) |
| 4+ Person Household | 258 (30.5%) | 589 (69.5%) |
| Total Housing Units | 1,034 (43.0%) | 1,373 (57.0%) |
Occupancy by Educational Attainment in Todd County
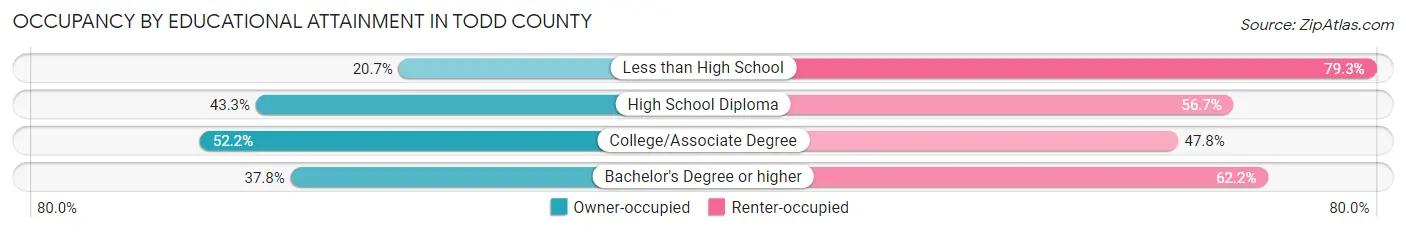
| Household Size | Owner-occupied | Renter-occupied |
| Less than High School | 69 (20.7%) | 265 (79.3%) |
| High School Diploma | 269 (43.3%) | 352 (56.7%) |
| College/Associate Degree | 533 (52.2%) | 488 (47.8%) |
| Bachelor's Degree or higher | 163 (37.8%) | 268 (62.2%) |
Occupancy by Age of Householder in Todd County
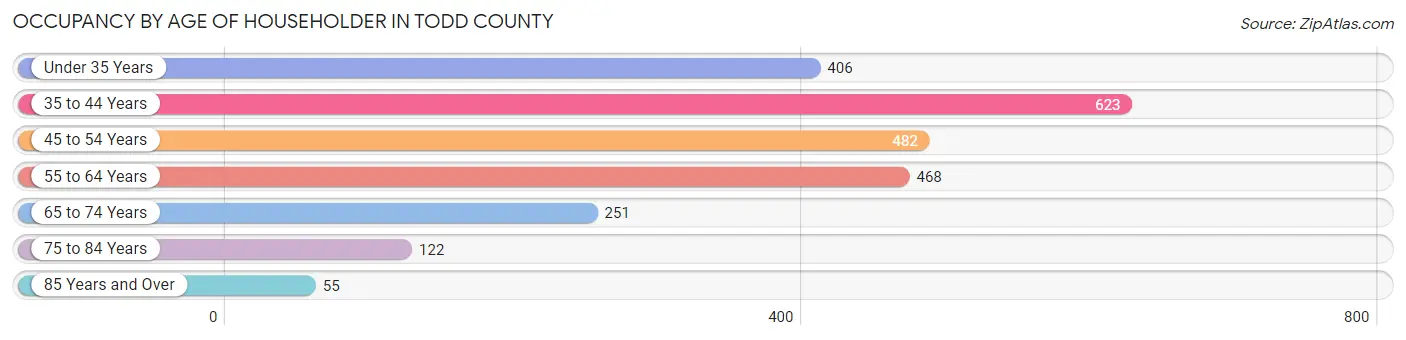
| Age Bracket | # Households | % Households |
| Under 35 Years | 406 | 16.9% |
| 35 to 44 Years | 623 | 25.9% |
| 45 to 54 Years | 482 | 20.0% |
| 55 to 64 Years | 468 | 19.4% |
| 65 to 74 Years | 251 | 10.4% |
| 75 to 84 Years | 122 | 5.1% |
| 85 Years and Over | 55 | 2.3% |
| Total | 2,407 | 100.0% |
Housing Finances in Todd County
Median Income by Occupancy in Todd County
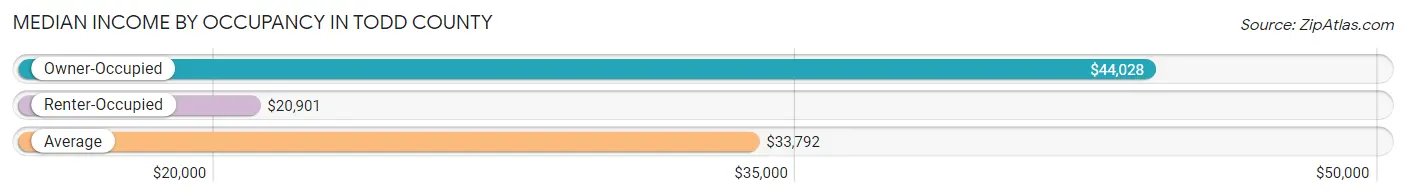
| Occupancy Type | # Households | Median Income |
| Owner-Occupied | 1,034 (43.0%) | $44,028 |
| Renter-Occupied | 1,373 (57.0%) | $20,901 |
| Average | 2,407 (100.0%) | $33,792 |
Occupancy by Householder Income Bracket in Todd County
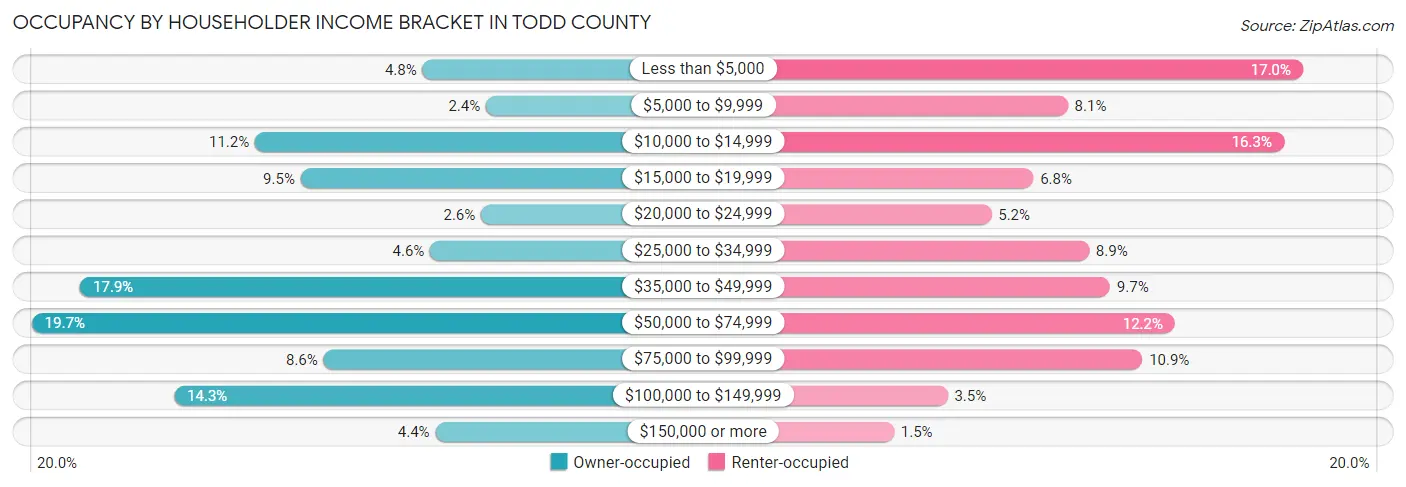
| Income Bracket | Owner-occupied | Renter-occupied |
| Less than $5,000 | 50 (4.8%) | 234 (17.0%) |
| $5,000 to $9,999 | 25 (2.4%) | 111 (8.1%) |
| $10,000 to $14,999 | 116 (11.2%) | 224 (16.3%) |
| $15,000 to $19,999 | 98 (9.5%) | 93 (6.8%) |
| $20,000 to $24,999 | 27 (2.6%) | 71 (5.2%) |
| $25,000 to $34,999 | 47 (4.5%) | 122 (8.9%) |
| $35,000 to $49,999 | 185 (17.9%) | 133 (9.7%) |
| $50,000 to $74,999 | 204 (19.7%) | 167 (12.2%) |
| $75,000 to $99,999 | 89 (8.6%) | 150 (10.9%) |
| $100,000 to $149,999 | 148 (14.3%) | 48 (3.5%) |
| $150,000 or more | 45 (4.3%) | 20 (1.5%) |
| Total | 1,034 (100.0%) | 1,373 (100.0%) |
Monthly Housing Cost Tiers in Todd County
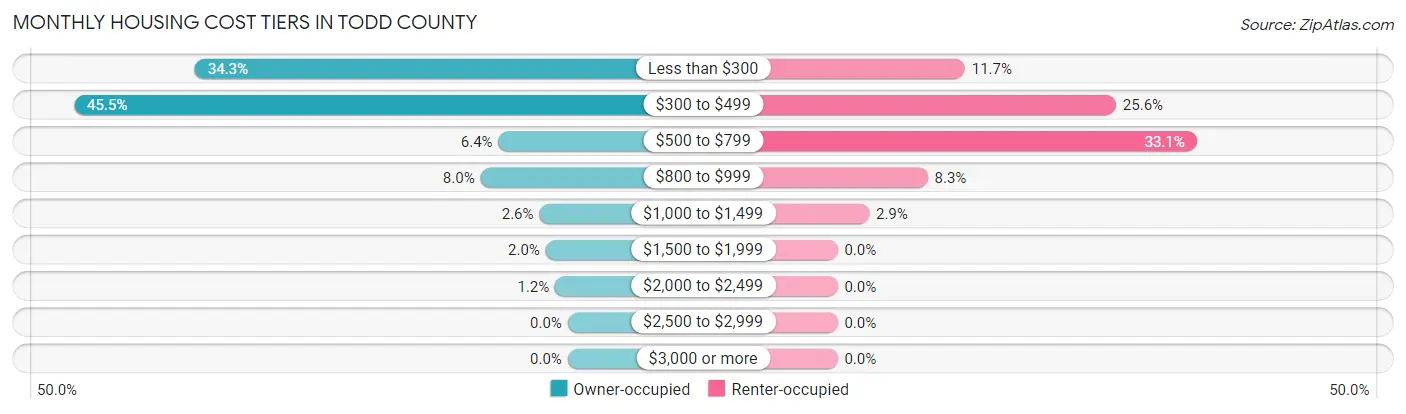
| Monthly Cost | Owner-occupied | Renter-occupied |
| Less than $300 | 355 (34.3%) | 161 (11.7%) |
| $300 to $499 | 470 (45.5%) | 352 (25.6%) |
| $500 to $799 | 66 (6.4%) | 454 (33.1%) |
| $800 to $999 | 83 (8.0%) | 114 (8.3%) |
| $1,000 to $1,499 | 27 (2.6%) | 40 (2.9%) |
| $1,500 to $1,999 | 21 (2.0%) | 0 (0.0%) |
| $2,000 to $2,499 | 12 (1.2%) | 0 (0.0%) |
| $2,500 to $2,999 | 0 (0.0%) | 0 (0.0%) |
| $3,000 or more | 0 (0.0%) | 0 (0.0%) |
| Total | 1,034 (100.0%) | 1,373 (100.0%) |
Physical Housing Characteristics in Todd County
Housing Structures in Todd County
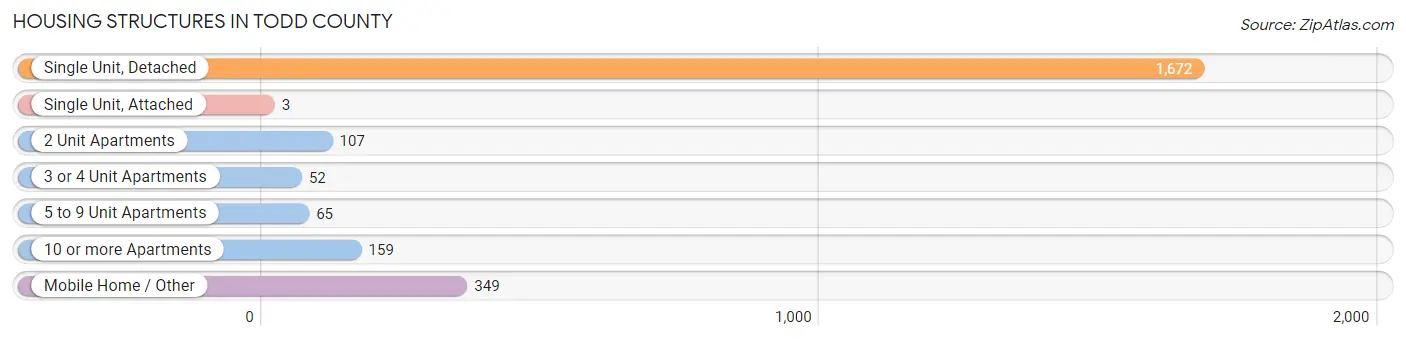
| Structure Type | # Housing Units | % Housing Units |
| Single Unit, Detached | 1,672 | 69.5% |
| Single Unit, Attached | 3 | 0.1% |
| 2 Unit Apartments | 107 | 4.4% |
| 3 or 4 Unit Apartments | 52 | 2.2% |
| 5 to 9 Unit Apartments | 65 | 2.7% |
| 10 or more Apartments | 159 | 6.6% |
| Mobile Home / Other | 349 | 14.5% |
| Total | 2,407 | 100.0% |
Housing Structures by Occupancy in Todd County
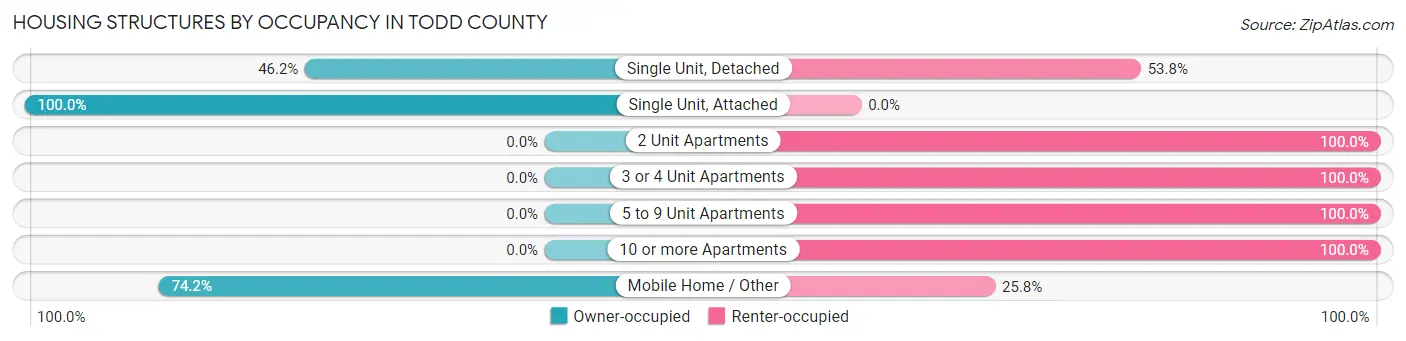
| Structure Type | Owner-occupied | Renter-occupied |
| Single Unit, Detached | 772 (46.2%) | 900 (53.8%) |
| Single Unit, Attached | 3 (100.0%) | 0 (0.0%) |
| 2 Unit Apartments | 0 (0.0%) | 107 (100.0%) |
| 3 or 4 Unit Apartments | 0 (0.0%) | 52 (100.0%) |
| 5 to 9 Unit Apartments | 0 (0.0%) | 65 (100.0%) |
| 10 or more Apartments | 0 (0.0%) | 159 (100.0%) |
| Mobile Home / Other | 259 (74.2%) | 90 (25.8%) |
| Total | 1,034 (43.0%) | 1,373 (57.0%) |
Housing Structures by Number of Rooms in Todd County
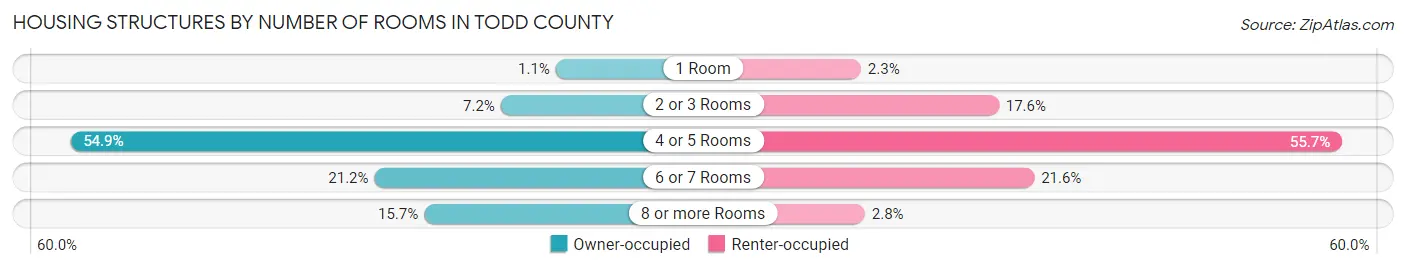
| Number of Rooms | Owner-occupied | Renter-occupied |
| 1 Room | 11 (1.1%) | 32 (2.3%) |
| 2 or 3 Rooms | 74 (7.2%) | 242 (17.6%) |
| 4 or 5 Rooms | 568 (54.9%) | 765 (55.7%) |
| 6 or 7 Rooms | 219 (21.2%) | 296 (21.6%) |
| 8 or more Rooms | 162 (15.7%) | 38 (2.8%) |
| Total | 1,034 (100.0%) | 1,373 (100.0%) |
Housing Structure by Heating Type in Todd County
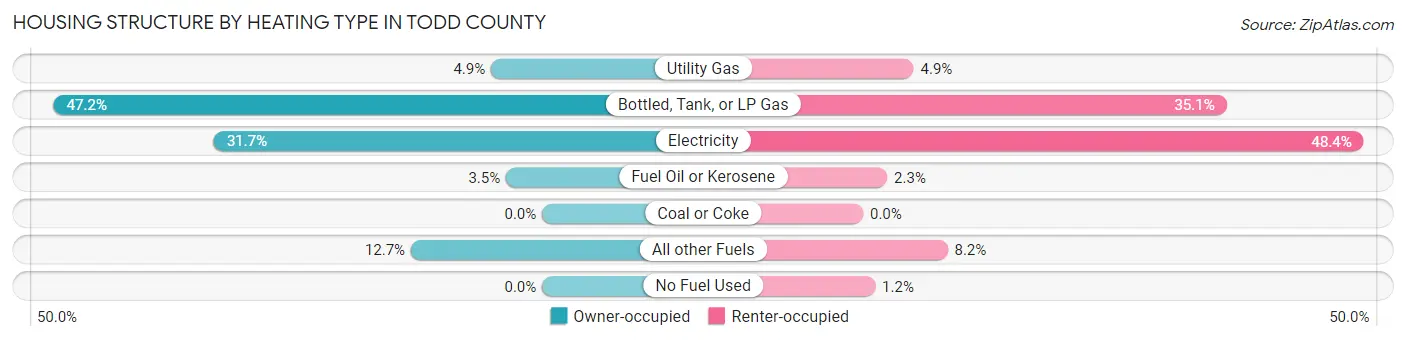
| Heating Type | Owner-occupied | Renter-occupied |
| Utility Gas | 51 (4.9%) | 67 (4.9%) |
| Bottled, Tank, or LP Gas | 488 (47.2%) | 482 (35.1%) |
| Electricity | 328 (31.7%) | 664 (48.4%) |
| Fuel Oil or Kerosene | 36 (3.5%) | 32 (2.3%) |
| Coal or Coke | 0 (0.0%) | 0 (0.0%) |
| All other Fuels | 131 (12.7%) | 112 (8.2%) |
| No Fuel Used | 0 (0.0%) | 16 (1.2%) |
| Total | 1,034 (100.0%) | 1,373 (100.0%) |
Household Vehicle Usage in Todd County
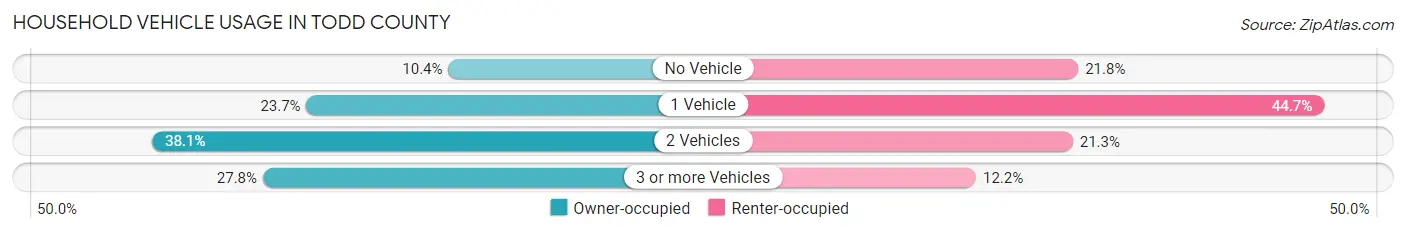
| Vehicles per Household | Owner-occupied | Renter-occupied |
| No Vehicle | 108 (10.4%) | 299 (21.8%) |
| 1 Vehicle | 245 (23.7%) | 614 (44.7%) |
| 2 Vehicles | 394 (38.1%) | 292 (21.3%) |
| 3 or more Vehicles | 287 (27.8%) | 168 (12.2%) |
| Total | 1,034 (100.0%) | 1,373 (100.0%) |
Real Estate & Mortgages in Todd County
Real Estate and Mortgage Overview in Todd County
| Characteristic | Without Mortgage | With Mortgage |
| Housing Units | 905 | 129 |
| Median Property Value | $34,200 | $51,800 |
| Median Household Income | $41,125 | $9 |
| Monthly Housing Costs | $332 | $0 |
| Real Estate Taxes | $948 | $46 |
Property Value by Mortgage Status in Todd County
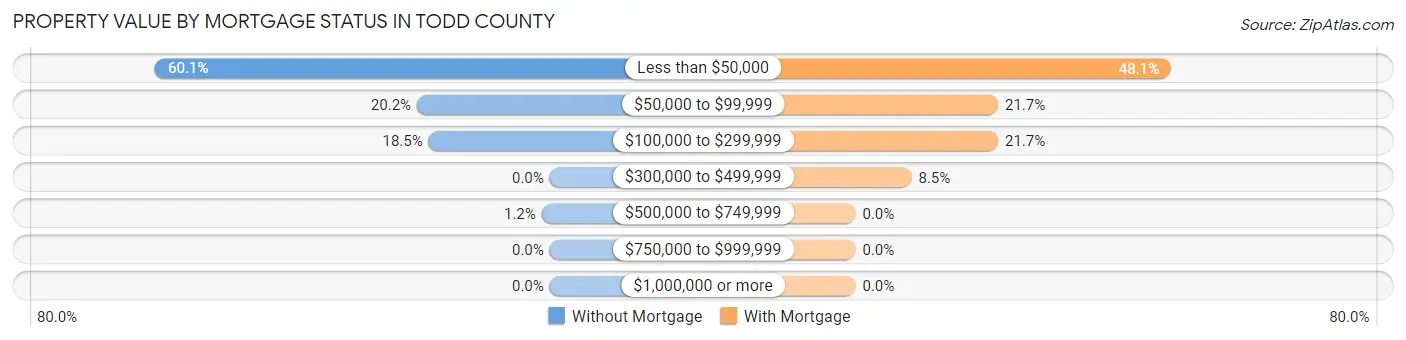
| Property Value | Without Mortgage | With Mortgage |
| Less than $50,000 | 544 (60.1%) | 62 (48.1%) |
| $50,000 to $99,999 | 183 (20.2%) | 28 (21.7%) |
| $100,000 to $299,999 | 167 (18.4%) | 28 (21.7%) |
| $300,000 to $499,999 | 0 (0.0%) | 11 (8.5%) |
| $500,000 to $749,999 | 11 (1.2%) | 0 (0.0%) |
| $750,000 to $999,999 | 0 (0.0%) | 0 (0.0%) |
| $1,000,000 or more | 0 (0.0%) | 0 (0.0%) |
| Total | 905 (100.0%) | 129 (100.0%) |
Household Income by Mortgage Status in Todd County
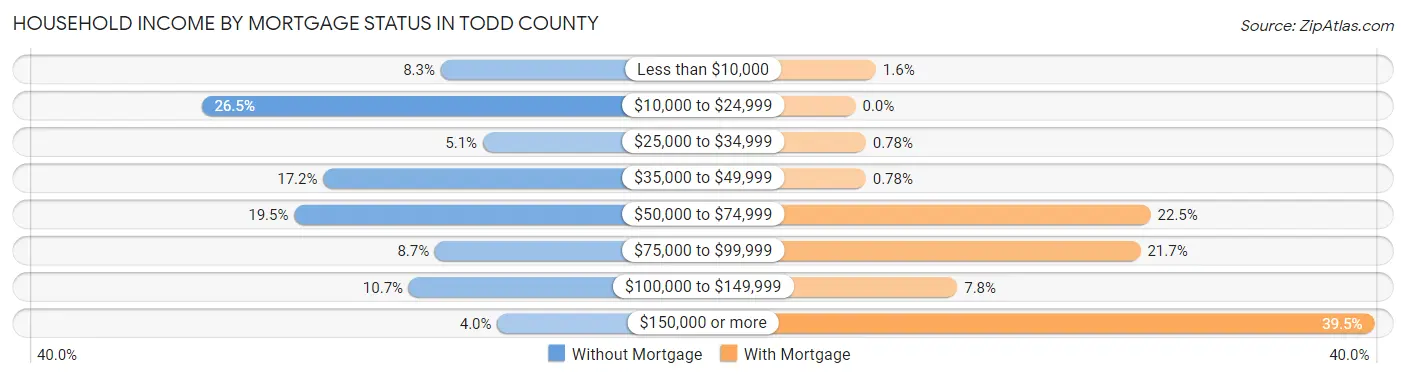
| Household Income | Without Mortgage | With Mortgage |
| Less than $10,000 | 75 (8.3%) | 2 (1.5%) |
| $10,000 to $24,999 | 240 (26.5%) | 0 (0.0%) |
| $25,000 to $34,999 | 46 (5.1%) | 1 (0.8%) |
| $35,000 to $49,999 | 156 (17.2%) | 1 (0.8%) |
| $50,000 to $74,999 | 176 (19.5%) | 29 (22.5%) |
| $75,000 to $99,999 | 79 (8.7%) | 28 (21.7%) |
| $100,000 to $149,999 | 97 (10.7%) | 10 (7.7%) |
| $150,000 or more | 36 (4.0%) | 51 (39.5%) |
| Total | 905 (100.0%) | 129 (100.0%) |
Property Value to Household Income Ratio in Todd County
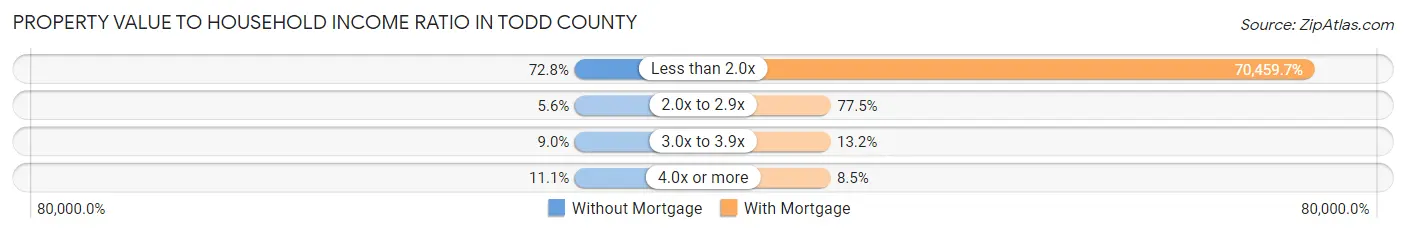
| Value-to-Income Ratio | Without Mortgage | With Mortgage |
| Less than 2.0x | 659 (72.8%) | 90,893 (70,459.7%) |
| 2.0x to 2.9x | 51 (5.6%) | 100 (77.5%) |
| 3.0x to 3.9x | 81 (8.9%) | 17 (13.2%) |
| 4.0x or more | 100 (11.1%) | 11 (8.5%) |
| Total | 905 (100.0%) | 129 (100.0%) |
Real Estate Taxes by Mortgage Status in Todd County
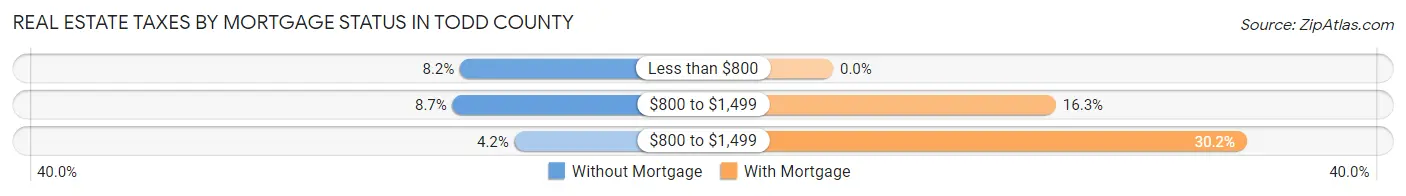
| Property Taxes | Without Mortgage | With Mortgage |
| Less than $800 | 74 (8.2%) | 0 (0.0%) |
| $800 to $1,499 | 79 (8.7%) | 21 (16.3%) |
| $800 to $1,499 | 38 (4.2%) | 39 (30.2%) |
| Total | 905 (100.0%) | 129 (100.0%) |
Health & Disability in Todd County
Health Insurance Coverage by Age in Todd County
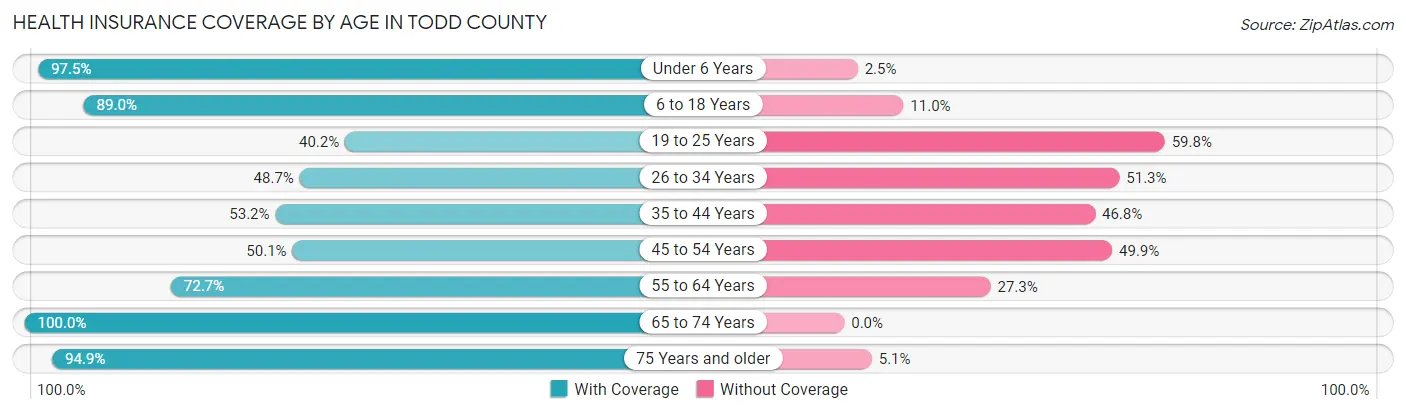
| Age Bracket | With Coverage | Without Coverage |
| Under 6 Years | 1,246 (97.5%) | 32 (2.5%) |
| 6 to 18 Years | 2,333 (89.0%) | 289 (11.0%) |
| 19 to 25 Years | 365 (40.2%) | 542 (59.8%) |
| 26 to 34 Years | 508 (48.7%) | 535 (51.3%) |
| 35 to 44 Years | 616 (53.2%) | 541 (46.8%) |
| 45 to 54 Years | 387 (50.1%) | 386 (49.9%) |
| 55 to 64 Years | 549 (72.7%) | 206 (27.3%) |
| 65 to 74 Years | 447 (100.0%) | 0 (0.0%) |
| 75 Years and older | 222 (94.9%) | 12 (5.1%) |
| Total | 6,673 (72.4%) | 2,543 (27.6%) |
Health Insurance Coverage by Citizenship Status in Todd County
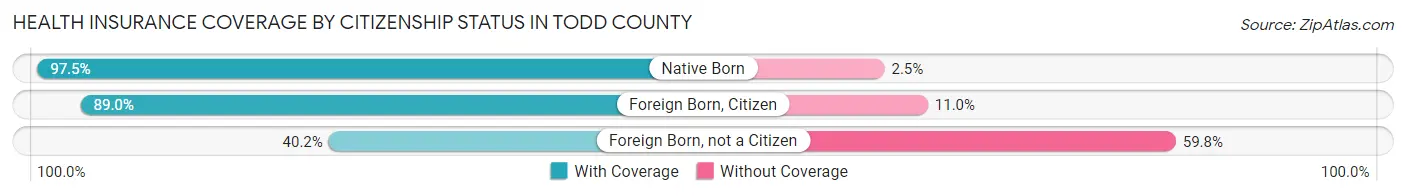
| Citizenship Status | With Coverage | Without Coverage |
| Native Born | 1,246 (97.5%) | 32 (2.5%) |
| Foreign Born, Citizen | 2,333 (89.0%) | 289 (11.0%) |
| Foreign Born, not a Citizen | 365 (40.2%) | 542 (59.8%) |
Health Insurance Coverage by Household Income in Todd County
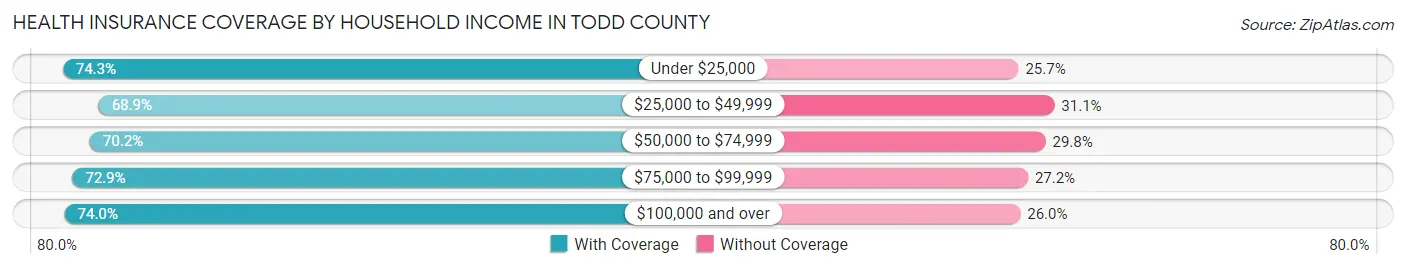
| Household Income | With Coverage | Without Coverage |
| Under $25,000 | 3,011 (74.3%) | 1,043 (25.7%) |
| $25,000 to $49,999 | 1,419 (68.9%) | 641 (31.1%) |
| $50,000 to $74,999 | 820 (70.2%) | 348 (29.8%) |
| $75,000 to $99,999 | 703 (72.9%) | 262 (27.2%) |
| $100,000 and over | 700 (74.0%) | 246 (26.0%) |
Public vs Private Health Insurance Coverage by Age in Todd County
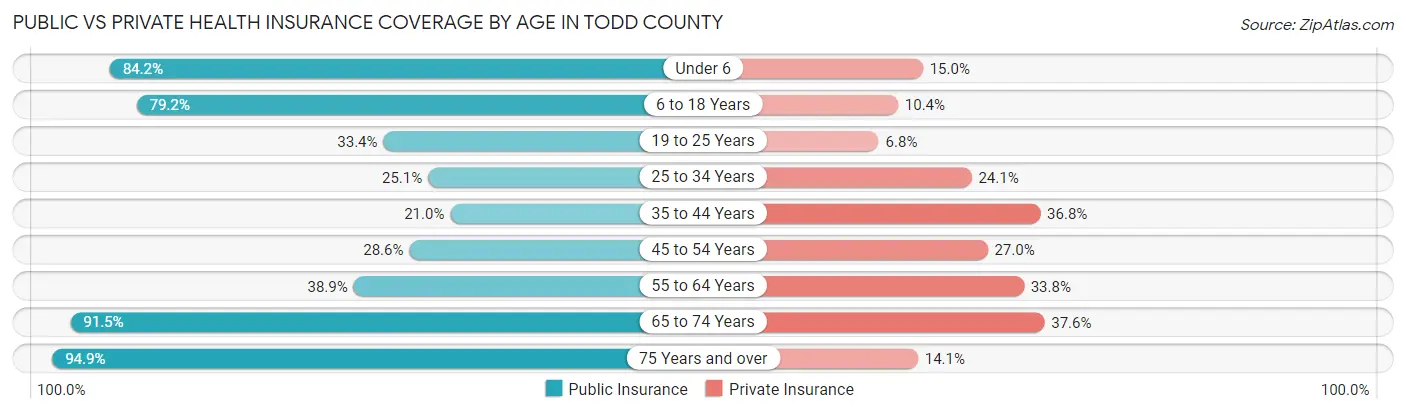
| Age Bracket | Public Insurance | Private Insurance |
| Under 6 | 1,076 (84.2%) | 192 (15.0%) |
| 6 to 18 Years | 2,077 (79.2%) | 273 (10.4%) |
| 19 to 25 Years | 303 (33.4%) | 62 (6.8%) |
| 25 to 34 Years | 262 (25.1%) | 251 (24.1%) |
| 35 to 44 Years | 243 (21.0%) | 426 (36.8%) |
| 45 to 54 Years | 221 (28.6%) | 209 (27.0%) |
| 55 to 64 Years | 294 (38.9%) | 255 (33.8%) |
| 65 to 74 Years | 409 (91.5%) | 168 (37.6%) |
| 75 Years and over | 222 (94.9%) | 33 (14.1%) |
| Total | 5,107 (55.4%) | 1,869 (20.3%) |
Disability Status by Sex by Age in Todd County
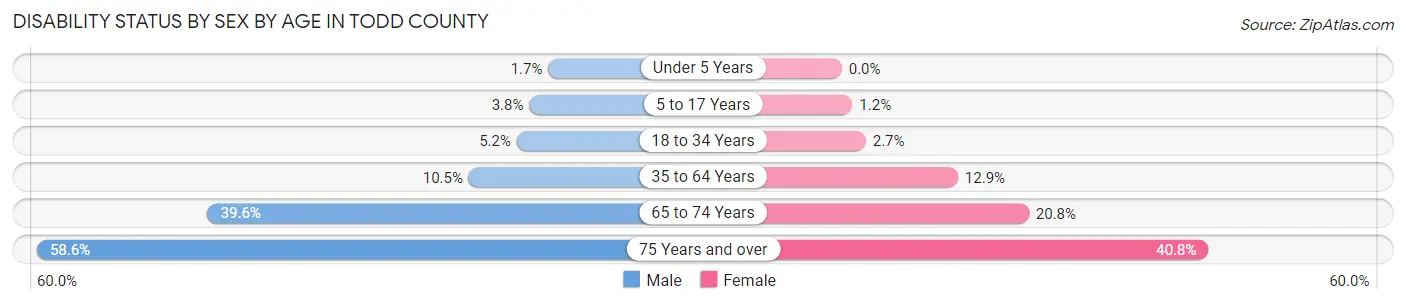
| Age Bracket | Male | Female |
| Under 5 Years | 10 (1.7%) | 0 (0.0%) |
| 5 to 17 Years | 51 (3.8%) | 15 (1.2%) |
| 18 to 34 Years | 54 (5.2%) | 30 (2.7%) |
| 35 to 64 Years | 128 (10.5%) | 190 (12.9%) |
| 65 to 74 Years | 82 (39.6%) | 50 (20.8%) |
| 75 Years and over | 51 (58.6%) | 60 (40.8%) |
Disability Class by Sex by Age in Todd County
Disability Class: Hearing Difficulty
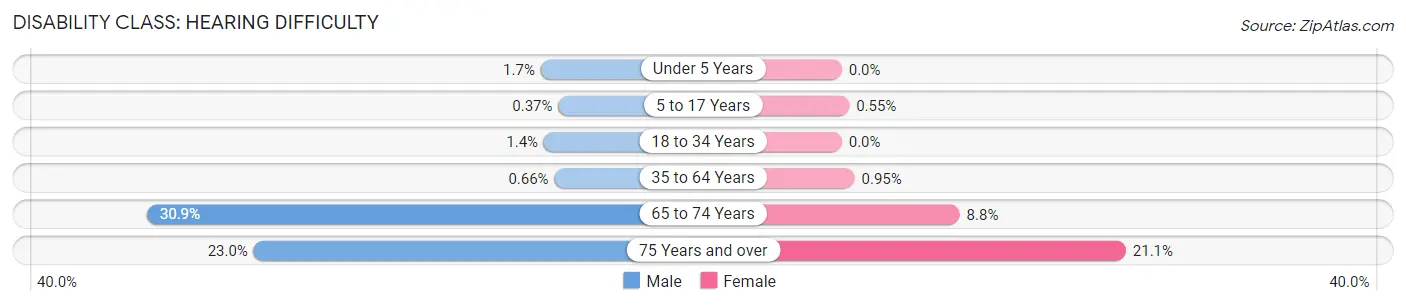
| Age Bracket | Male | Female |
| Under 5 Years | 10 (1.7%) | 0 (0.0%) |
| 5 to 17 Years | 5 (0.4%) | 7 (0.5%) |
| 18 to 34 Years | 15 (1.4%) | 0 (0.0%) |
| 35 to 64 Years | 8 (0.7%) | 14 (0.9%) |
| 65 to 74 Years | 64 (30.9%) | 21 (8.7%) |
| 75 Years and over | 20 (23.0%) | 31 (21.1%) |
Disability Class: Vision Difficulty
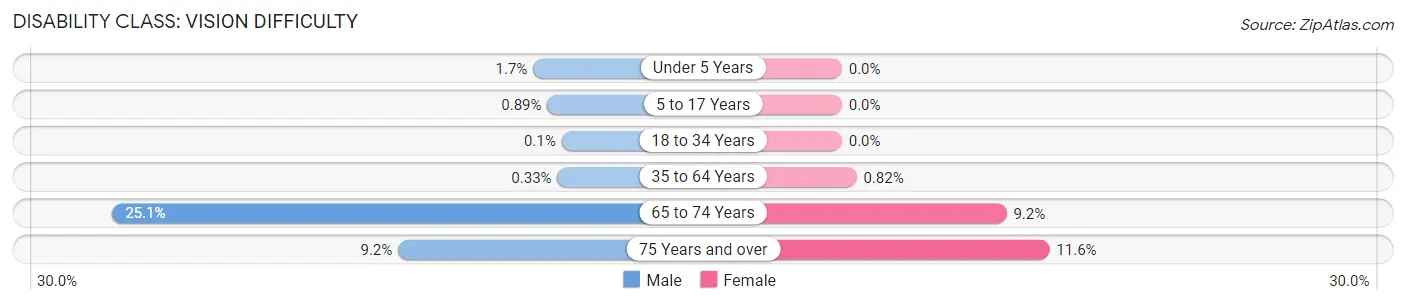
| Age Bracket | Male | Female |
| Under 5 Years | 10 (1.7%) | 0 (0.0%) |
| 5 to 17 Years | 12 (0.9%) | 0 (0.0%) |
| 18 to 34 Years | 1 (0.1%) | 0 (0.0%) |
| 35 to 64 Years | 4 (0.3%) | 12 (0.8%) |
| 65 to 74 Years | 52 (25.1%) | 22 (9.2%) |
| 75 Years and over | 8 (9.2%) | 17 (11.6%) |
Disability Class: Cognitive Difficulty
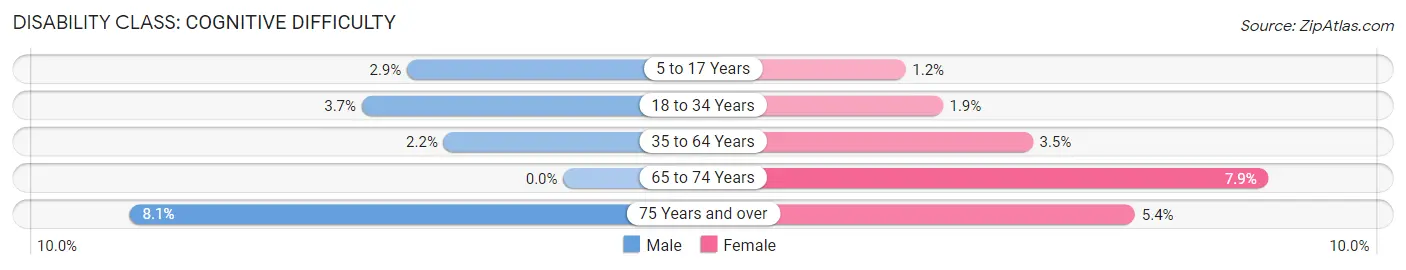
| Age Bracket | Male | Female |
| 5 to 17 Years | 39 (2.9%) | 15 (1.2%) |
| 18 to 34 Years | 39 (3.7%) | 21 (1.9%) |
| 35 to 64 Years | 27 (2.2%) | 52 (3.5%) |
| 65 to 74 Years | 0 (0.0%) | 19 (7.9%) |
| 75 Years and over | 7 (8.1%) | 8 (5.4%) |
Disability Class: Ambulatory Difficulty
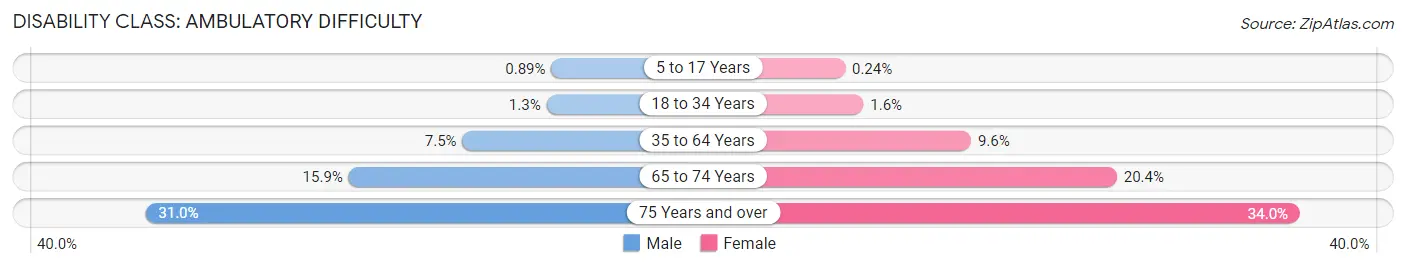
| Age Bracket | Male | Female |
| 5 to 17 Years | 12 (0.9%) | 3 (0.2%) |
| 18 to 34 Years | 13 (1.3%) | 18 (1.6%) |
| 35 to 64 Years | 91 (7.5%) | 141 (9.6%) |
| 65 to 74 Years | 33 (15.9%) | 49 (20.4%) |
| 75 Years and over | 27 (31.0%) | 50 (34.0%) |
Disability Class: Self-Care Difficulty
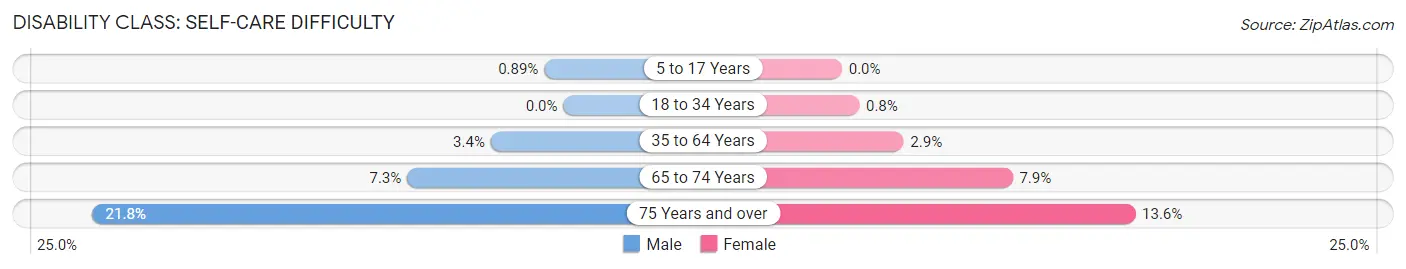
| Age Bracket | Male | Female |
| 5 to 17 Years | 12 (0.9%) | 0 (0.0%) |
| 18 to 34 Years | 0 (0.0%) | 9 (0.8%) |
| 35 to 64 Years | 41 (3.4%) | 42 (2.9%) |
| 65 to 74 Years | 15 (7.2%) | 19 (7.9%) |
| 75 Years and over | 19 (21.8%) | 20 (13.6%) |
Technology Access in Todd County
Computing Device Access in Todd County
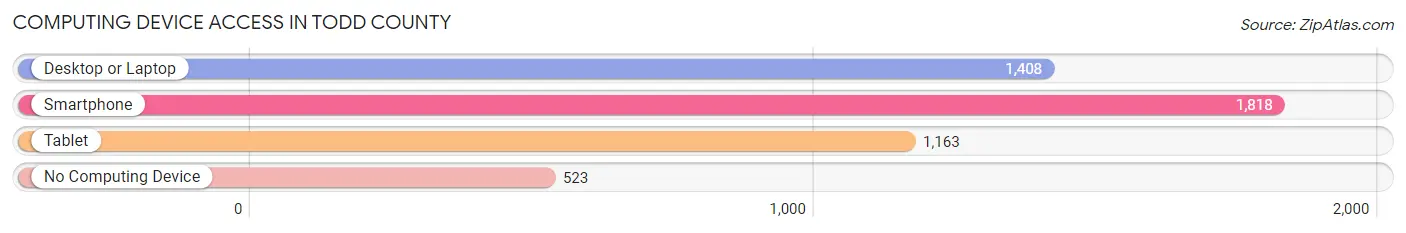
| Device Type | # Households | % Households |
| Desktop or Laptop | 1,408 | 58.5% |
| Smartphone | 1,818 | 75.5% |
| Tablet | 1,163 | 48.3% |
| No Computing Device | 523 | 21.7% |
| Total | 2,407 | 100.0% |
Internet Access in Todd County
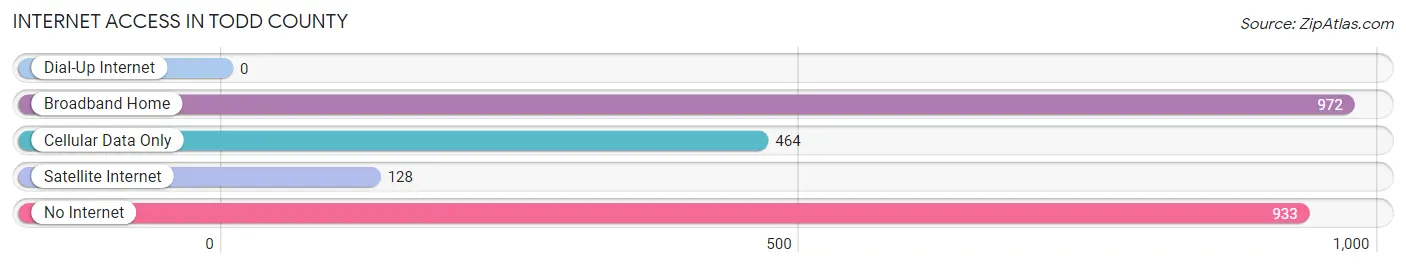
| Internet Type | # Households | % Households |
| Dial-Up Internet | 0 | 0.0% |
| Broadband Home | 972 | 40.4% |
| Cellular Data Only | 464 | 19.3% |
| Satellite Internet | 128 | 5.3% |
| No Internet | 933 | 38.8% |
| Total | 2,407 | 100.0% |
Todd County Summary
Todd County is located in the south-central region of South Dakota, and is bordered by the states of Nebraska and Iowa. It is the fifth-largest county in the state, with an area of 1,845 square miles. The county seat is Mission, and the largest city is Winner. As of the 2010 census, the population was 9,612.
History
The area that is now Todd County was first inhabited by the Sioux Indians, who were the dominant tribe in the region. The first white settlers arrived in the area in the late 1800s, and the county was officially established in 1909. The county was named after John Blair Smith Todd, a Civil War veteran and former governor of Dakota Territory.
Geography
Todd County is located in the south-central region of South Dakota, and is bordered by the states of Nebraska and Iowa. It is the fifth-largest county in the state, with an area of 1,845 square miles. The county is mostly rural, with rolling hills and prairies. The terrain is generally flat, with some areas of higher elevation in the western part of the county. The county is drained by the White River and its tributaries.
Economy
The economy of Todd County is largely based on agriculture. The county is home to a variety of crops, including corn, soybeans, wheat, and hay. Livestock production is also important, with cattle, hogs, and sheep being raised in the area. The county is also home to several manufacturing companies, including a furniture factory and a plastics plant.
Demographics
As of the 2010 census, the population of Todd County was 9,612. The population is predominantly white (94.3%), with small percentages of Native American (2.2%), African American (1.2%), and Asian (0.5%) residents. The median household income is $41,945, and the median age is 43.7 years.
Conclusion
Todd County is a rural county located in the south-central region of South Dakota. It is the fifth-largest county in the state, with an area of 1,845 square miles. The county is largely agricultural, with crops such as corn, soybeans, wheat, and hay being grown in the area. The population of Todd County is predominantly white, with a median household income of $41,945 and a median age of 43.7 years.
Common Questions
What is the Total Population of Todd County?
Total Population of Todd County is 9,353.
What is the Total Male Population of Todd County?
Total Male Population of Todd County is 4,616.
What is the Total Female Population of Todd County?
Total Female Population of Todd County is 4,737.
What is the Ratio of Males per 100 Females in Todd County?
There are 97.45 Males per 100 Females in Todd County.
What is the Ratio of Females per 100 Males in Todd County?
There are 102.62 Females per 100 Males in Todd County.
What is the Median Population Age in Todd County?
Median Population Age in Todd County is 25.1 Years.
What is the Average Family Size in Todd County
Average Family Size in Todd County is 4.8 People.
What is the Average Household Size in Todd County
Average Household Size in Todd County is 3.8 People.
What is Per Capita Income in Todd County?
Per Capita income in Todd County is $12,562.
What is the Median Family Income in Todd County?
Median Family Income in Todd County is $35,458.
What is the Median Household income in Todd County?
Median Household Income in Todd County is $33,792.
What is Income or Wage Gap in Todd County?
Income or Wage Gap in Todd County is 13.8%.
Women in Todd County earn 86.2 cents for every dollar earned by a man.
What is Family Income Deficit in Todd County?
Family Income Deficit in Todd County is $19,054.
Families that are below poverty line in Todd County earn $19,054 less on average than the poverty threshold level.
What is Inequality or Gini Index in Todd County?
Inequality or Gini Index in Todd County is 0.50.
How Large is the Labor Force in Todd County?
There are 2,716 People in the Labor Forcein in Todd County.
What is the Percentage of People in the Labor Force in Todd County?
45.2% of People are in the Labor Force in Todd County.
What is the Unemployment Rate in Todd County?
Unemployment Rate in Todd County is 15.1%.