Stanley County, SD
Stanley County Map

Stanley County Overview
2,979
TOTAL POPULATION
1,710
MALE POPULATION
1,269
FEMALE POPULATION
134.75
MALES / 100 FEMALES
74.21
FEMALES / 100 MALES
43.2
MEDIAN AGE
3.2
AVG FAMILY SIZE
2.4
AVG HOUSEHOLD SIZE
$46,652
PER CAPITA INCOME
$107,404
AVG FAMILY INCOME
$82,298
AVG HOUSEHOLD INCOME
33.1%
WAGE / INCOME GAP [ % ]
66.9¢/ $1
WAGE / INCOME GAP [ $ ]
0.43
INEQUALITY / GINI INDEX
1,733
LABOR FORCE [ PEOPLE ]
72.3%
PERCENT IN LABOR FORCE
0.2%
UNEMPLOYMENT RATE
Stanley County Area Codes
Race in Stanley County
The most populous races in Stanley County are White / Caucasian (2,769 | 92.9%), Hispanic or Latino (131 | 4.4%), and Native / Alaskan (100 | 3.4%).

| Race | # Population | % Population |
| Asian | 0 | 0.0% |
| Black / African American | 9 | 0.3% |
| Hawaiian / Pacific | 0 | 0.0% |
| Hispanic or Latino | 131 | 4.4% |
| Native / Alaskan | 100 | 3.4% |
| White / Caucasian | 2,769 | 92.9% |
| Two or more Races | 88 | 2.9% |
| Some other Race | 13 | 0.4% |
| Total | 2,979 | 100.0% |
Ancestry in Stanley County
The most populous ancestries reported in Stanley County are German (1,140 | 38.3%), Norwegian (426 | 14.3%), American (247 | 8.3%), Irish (214 | 7.2%), and English (209 | 7.0%), together accounting for 75.1% of all Stanley County residents.

| Ancestry | # Population | % Population |
| American | 247 | 8.3% |
| Basque | 63 | 2.1% |
| Belgian | 2 | 0.1% |
| British | 9 | 0.3% |
| Canadian | 17 | 0.6% |
| Cherokee | 10 | 0.3% |
| Croatian | 36 | 1.2% |
| Czech | 83 | 2.8% |
| Czechoslovakian | 4 | 0.1% |
| Danish | 35 | 1.2% |
| Dutch | 48 | 1.6% |
| English | 209 | 7.0% |
| European | 61 | 2.1% |
| French | 37 | 1.2% |
| French Canadian | 29 | 1.0% |
| German | 1,140 | 38.3% |
| Irish | 214 | 7.2% |
| Italian | 70 | 2.4% |
| Mexican | 117 | 3.9% |
| Norwegian | 426 | 14.3% |
| Polish | 25 | 0.8% |
| Russian | 24 | 0.8% |
| Scotch-Irish | 33 | 1.1% |
| Scottish | 37 | 1.2% |
| Sioux | 147 | 4.9% |
| Spanish | 5 | 0.2% |
| Swedish | 94 | 3.2% |
| Welsh | 24 | 0.8% | View All 28 Rows |
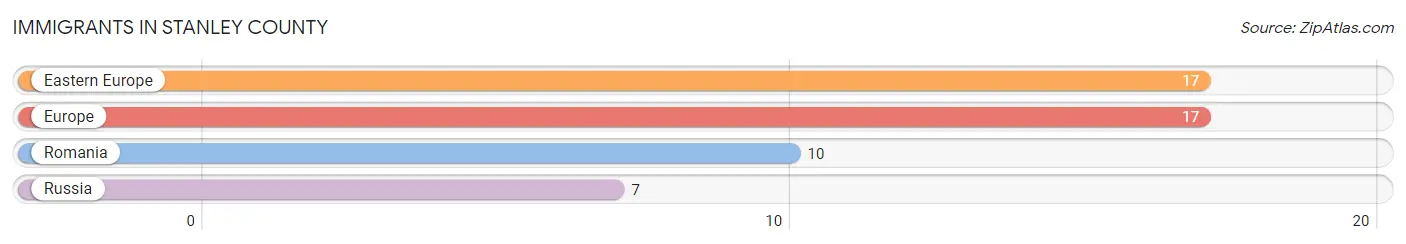
Immigrants in Stanley County
The most numerous immigrant groups reported in Stanley County came from Eastern Europe (17 | 0.6%), Europe (17 | 0.6%), Romania (10 | 0.3%), and Russia (7 | 0.2%), together accounting for 1.7% of all Stanley County residents.
| Immigration Origin | # Population | % Population |
| Eastern Europe | 17 | 0.6% |
| Europe | 17 | 0.6% |
| Romania | 10 | 0.3% |
| Russia | 7 | 0.2% | View All 4 Rows |
Sex and Age in Stanley County
Sex and Age in Stanley County
The most populous age groups in Stanley County are 65 to 69 Years (186 | 10.9%) for men and 35 to 39 Years (116 | 9.1%) for women.

| Age Bracket | Male | Female |
| Under 5 Years | 70 (4.1%) | 58 (4.6%) |
| 5 to 9 Years | 123 (7.2%) | 110 (8.7%) |
| 10 to 14 Years | 123 (7.2%) | 24 (1.9%) |
| 15 to 19 Years | 125 (7.3%) | 70 (5.5%) |
| 20 to 24 Years | 57 (3.3%) | 89 (7.0%) |
| 25 to 29 Years | 79 (4.6%) | 60 (4.7%) |
| 30 to 34 Years | 75 (4.4%) | 44 (3.5%) |
| 35 to 39 Years | 112 (6.6%) | 116 (9.1%) |
| 40 to 44 Years | 148 (8.6%) | 65 (5.1%) |
| 45 to 49 Years | 60 (3.5%) | 48 (3.8%) |
| 50 to 54 Years | 145 (8.5%) | 106 (8.4%) |
| 55 to 59 Years | 102 (6.0%) | 115 (9.1%) |
| 60 to 64 Years | 122 (7.1%) | 78 (6.1%) |
| 65 to 69 Years | 186 (10.9%) | 89 (7.0%) |
| 70 to 74 Years | 47 (2.8%) | 72 (5.7%) |
| 75 to 79 Years | 32 (1.9%) | 81 (6.4%) |
| 80 to 84 Years | 27 (1.6%) | 36 (2.8%) |
| 85 Years and over | 77 (4.5%) | 8 (0.6%) |
| Total | 1,710 (100.0%) | 1,269 (100.0%) |
Families and Households in Stanley County
Median Family Size in Stanley County
The median family size in Stanley County is 3.25 persons per family, with single male/father families (33 | 4.5%) accounting for the largest median family size of 4.27 persons per family. On the other hand, married-couple families (631 | 85.6%) represent the smallest median family size with 3.15 persons per family.

| Family Type | # Families | Family Size |
| Married-Couple | 631 (85.6%) | 3.15 |
| Single Male/Father | 33 (4.5%) | 4.27 |
| Single Female/Mother | 73 (9.9%) | 3.67 |
| Total Families | 737 (100.0%) | 3.25 |
Median Household Size in Stanley County
The median household size in Stanley County is 2.40 persons per household, with single male/father households (33 | 2.7%) accounting for the largest median household size of 4.76 persons per household. non-family households (502 | 40.5%) represent the smallest median household size with 1.07 persons per household.

| Household Type | # Households | Household Size |
| Married-Couple | 631 (50.9%) | 3.17 |
| Single Male/Father | 33 (2.7%) | 4.76 |
| Single Female/Mother | 73 (5.9%) | 3.93 |
| Non-family | 502 (40.5%) | 1.07 |
| Total Households | 1,239 (100.0%) | 2.40 |
Household Size by Marriage Status in Stanley County
Out of a total of 1,239 households in Stanley County, 737 (59.5%) are family households, while 502 (40.5%) are nonfamily households. The most numerous type of family households are 2-person households, comprising 415, and the most common type of nonfamily households are 1-person households, comprising 464.

| Household Size | Family Households | Nonfamily Households |
| 1-Person Households | - | 464 (37.4%) |
| 2-Person Households | 415 (33.5%) | 38 (3.1%) |
| 3-Person Households | 93 (7.5%) | 0 (0.0%) |
| 4-Person Households | 122 (9.9%) | 0 (0.0%) |
| 5-Person Households | 90 (7.3%) | 0 (0.0%) |
| 6-Person Households | 2 (0.2%) | 0 (0.0%) |
| 7+ Person Households | 15 (1.2%) | 0 (0.0%) |
| Total | 737 (59.5%) | 502 (40.5%) |
Female Fertility in Stanley County
Fertility by Age in Stanley County

| Age Bracket | Women with Births | Births / 1,000 Women |
| 15 to 19 years | 0 (0.0%) | 0.0 |
| 20 to 34 years | 0 (0.0%) | 0.0 |
| 35 to 50 years | 0 (0.0%) | 0.0 |
| Total | 0 (0.0%) | 0.0 |
Fertility by Age by Marriage Status in Stanley County

| Age Bracket | Married | Unmarried |
| 15 to 19 years | 0 (0.0%) | 0 (0.0%) |
| 20 to 34 years | 0 (0.0%) | 0 (0.0%) |
| 35 to 50 years | 0 (0.0%) | 0 (0.0%) |
| Total | 0 (0.0%) | 0 (0.0%) |
Fertility by Education in Stanley County

| Educational Attainment | Women with Births | Births / 1,000 Women |
| Less than High School | 0 (0.0%) | 0.0 |
| High School Diploma | 0 (0.0%) | 0.0 |
| College or Associate's Degree | 0 (0.0%) | 0.0 |
| Bachelor's Degree | 0 (0.0%) | 0.0 |
| Graduate Degree | 0 (0.0%) | 0.0 |
| Total | 0 (0.0%) | 0.0 |
Fertility by Education by Marriage Status in Stanley County
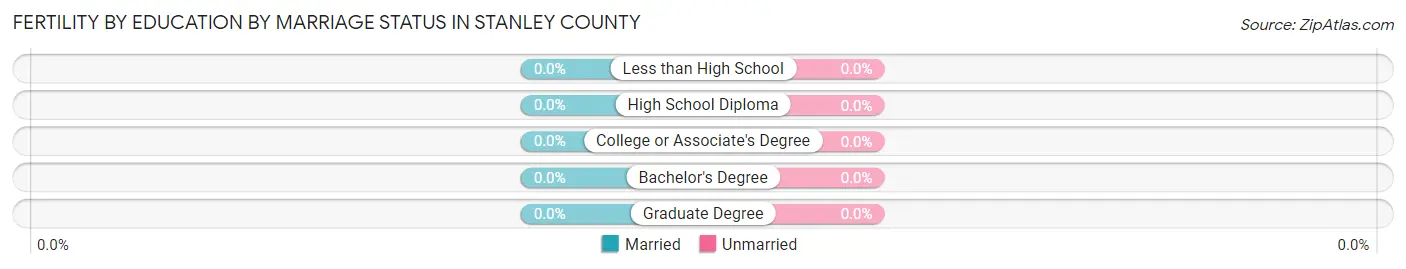
| Educational Attainment | Married | Unmarried |
| Less than High School | 0 (0.0%) | 0 (0.0%) |
| High School Diploma | 0 (0.0%) | 0 (0.0%) |
| College or Associate's Degree | 0 (0.0%) | 0 (0.0%) |
| Bachelor's Degree | 0 (0.0%) | 0 (0.0%) |
| Graduate Degree | 0 (0.0%) | 0 (0.0%) |
| Total | 0 (0.0%) | 0 (0.0%) |
Income in Stanley County
Income Overview in Stanley County
Per Capita Income in Stanley County is $46,652, while median incomes of families and households are $107,404 and $82,298 respectively.
| Characteristic | Number | Measure |
| Per Capita Income | 2,979 | $46,652 |
| Median Family Income | 737 | $107,404 |
| Mean Family Income | 737 | $141,070 |
| Median Household Income | 1,239 | $82,298 |
| Mean Household Income | 1,239 | $106,276 |
| Income Deficit | 737 | $0 |
| Wage / Income Gap (%) | 2,979 | 33.09% |
| Wage / Income Gap ($) | 2,979 | 66.91¢ per $1 |
| Gini / Inequality Index | 2,979 | 0.43 |
Earnings by Sex in Stanley County
Average Earnings in Stanley County are $44,141, $55,156 for men and $36,905 for women, a difference of 33.1%.

| Sex | Number | Average Earnings |
| Male | 1,029 (57.7%) | $55,156 |
| Female | 756 (42.3%) | $36,905 |
| Total | 1,785 (100.0%) | $44,141 |
Earnings by Sex by Income Bracket in Stanley County
The most common earnings brackets in Stanley County are $100,000+ for men (184 | 17.9%) and $40,000 to $44,999 for women (118 | 15.6%).

| Income | Male | Female |
| $2,499 or less | 25 (2.4%) | 16 (2.1%) |
| $2,500 to $4,999 | 22 (2.1%) | 13 (1.7%) |
| $5,000 to $7,499 | 9 (0.9%) | 30 (4.0%) |
| $7,500 to $9,999 | 11 (1.1%) | 8 (1.1%) |
| $10,000 to $12,499 | 3 (0.3%) | 9 (1.2%) |
| $12,500 to $14,999 | 27 (2.6%) | 21 (2.8%) |
| $15,000 to $17,499 | 28 (2.7%) | 9 (1.2%) |
| $17,500 to $19,999 | 12 (1.2%) | 21 (2.8%) |
| $20,000 to $22,499 | 10 (1.0%) | 27 (3.6%) |
| $22,500 to $24,999 | 11 (1.1%) | 23 (3.0%) |
| $25,000 to $29,999 | 72 (7.0%) | 53 (7.0%) |
| $30,000 to $34,999 | 110 (10.7%) | 116 (15.3%) |
| $35,000 to $39,999 | 32 (3.1%) | 53 (7.0%) |
| $40,000 to $44,999 | 31 (3.0%) | 118 (15.6%) |
| $45,000 to $49,999 | 38 (3.7%) | 8 (1.1%) |
| $50,000 to $54,999 | 72 (7.0%) | 64 (8.5%) |
| $55,000 to $64,999 | 101 (9.8%) | 36 (4.8%) |
| $65,000 to $74,999 | 67 (6.5%) | 44 (5.8%) |
| $75,000 to $99,999 | 164 (15.9%) | 58 (7.7%) |
| $100,000+ | 184 (17.9%) | 29 (3.8%) |
| Total | 1,029 (100.0%) | 756 (100.0%) |
Earnings by Sex by Educational Attainment in Stanley County
Average earnings in Stanley County are $61,359 for men and $40,287 for women, a difference of 34.3%. Men with an educational attainment of less than high school enjoy the highest average annual earnings of $68,750, while those with college or associate's degree education earn the least with $34,738. Women with an educational attainment of graduate degree earn the most with the average annual earnings of $80,304, while those with less than high school education have the smallest earnings of $23,750.

| Educational Attainment | Male Income | Female Income |
| Less than High School | $68,750 | $23,750 |
| High School Diploma | $60,326 | $40,972 |
| College or Associate's Degree | $34,738 | $35,811 |
| Bachelor's Degree | $64,896 | $41,833 |
| Graduate Degree | - | - |
| Total | $61,359 | $40,287 |
Family Income in Stanley County
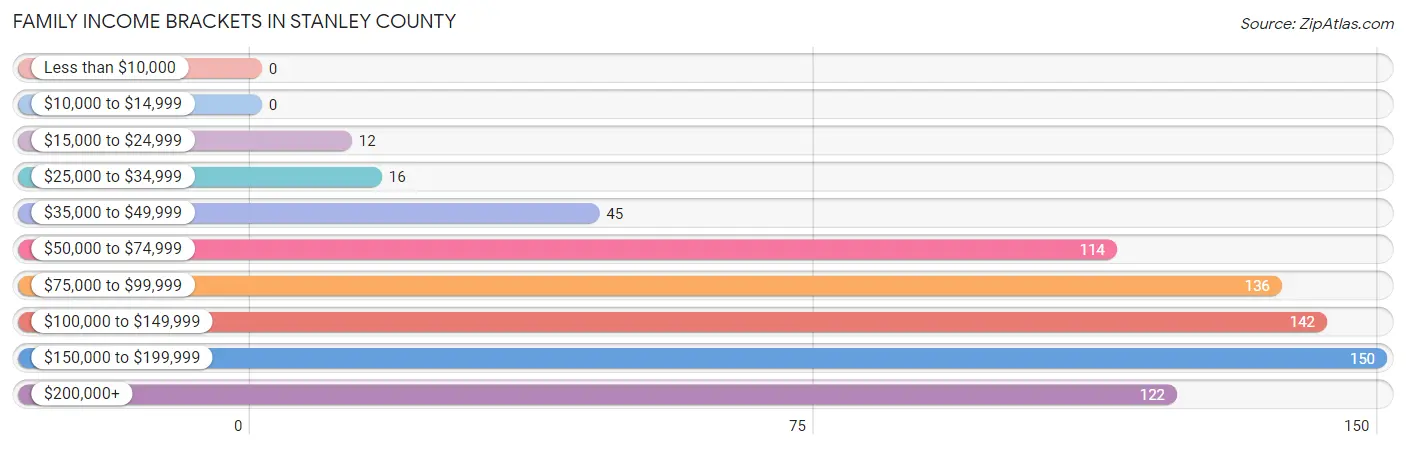
Family Income Brackets in Stanley County
According to the Stanley County family income data, there are 150 families falling into the $150,000 to $199,999 income range, which is the most common income bracket and makes up 20.3% of all families.
| Income Bracket | # Families | % Families |
| Less than $10,000 | 0 | 0.0% |
| $10,000 to $14,999 | 0 | 0.0% |
| $15,000 to $24,999 | 12 | 1.6% |
| $25,000 to $34,999 | 16 | 2.2% |
| $35,000 to $49,999 | 45 | 6.1% |
| $50,000 to $74,999 | 114 | 15.5% |
| $75,000 to $99,999 | 136 | 18.5% |
| $100,000 to $149,999 | 142 | 19.3% |
| $150,000 to $199,999 | 150 | 20.4% |
| $200,000+ | 122 | 16.6% |
Family Income by Famaliy Size in Stanley County
5-person families (81 | 11.0%) account for the highest median family income in Stanley County with $238,750 per family, while 3-person families (87 | 11.8%) have the highest median income of $50,540 per family member.

| Income Bracket | # Families | Median Income |
| 2-Person Families | 428 (58.1%) | $86,923 |
| 3-Person Families | 87 (11.8%) | $151,620 |
| 4-Person Families | 124 (16.8%) | $103,182 |
| 5-Person Families | 81 (11.0%) | $238,750 |
| 6-Person Families | 4 (0.5%) | $0 |
| 7+ Person Families | 13 (1.8%) | $0 |
| Total | 737 (100.0%) | $107,404 |
Family Income by Number of Earners in Stanley County
The median family income in Stanley County is $107,404, with families comprising 3+ earners (76) having the highest median family income of $178,750, while families with no earners (149) have the lowest median family income of $69,013, accounting for 10.3% and 20.2% of families, respectively.

| Number of Earners | # Families | Median Income |
| No Earners | 149 (20.2%) | $69,013 |
| 1 Earner | 176 (23.9%) | $119,000 |
| 2 Earners | 336 (45.6%) | $126,250 |
| 3+ Earners | 76 (10.3%) | $178,750 |
| Total | 737 (100.0%) | $107,404 |
Household Income in Stanley County
Household Income Brackets in Stanley County
With 225 households falling in the category, the $50,000 to $74,999 income range is the most frequent in Stanley County, accounting for 18.2% of all households. In contrast, only 2 households (0.2%) fall into the less than $10,000 income bracket, making it the least populous group.

| Income Bracket | # Households | % Households |
| Less than $10,000 | 2 | 0.2% |
| $10,000 to $14,999 | 38 | 3.1% |
| $15,000 to $24,999 | 62 | 5.0% |
| $25,000 to $34,999 | 152 | 12.3% |
| $35,000 to $49,999 | 82 | 6.6% |
| $50,000 to $74,999 | 225 | 18.2% |
| $75,000 to $99,999 | 209 | 16.9% |
| $100,000 to $149,999 | 190 | 15.3% |
| $150,000 to $199,999 | 150 | 12.1% |
| $200,000+ | 125 | 10.1% |
Household Income by Householder Age in Stanley County
The median household income in Stanley County is $82,298, with the highest median household income of $108,068 found in the 45 to 64 years age bracket for the primary householder. A total of 393 households (31.7%) fall into this category. Meanwhile, the 15 to 24 years age bracket for the primary householder has the lowest median household income of $0, with 75 households (6.0%) in this group.

| Income Bracket | # Households | Median Income |
| 15 to 24 Years | 75 (6.0%) | $0 |
| 25 to 44 Years | 365 (29.5%) | $95,225 |
| 45 to 64 Years | 393 (31.7%) | $108,068 |
| 65+ Years | 406 (32.8%) | $67,981 |
| Total | 1,239 (100.0%) | $82,298 |
Poverty in Stanley County
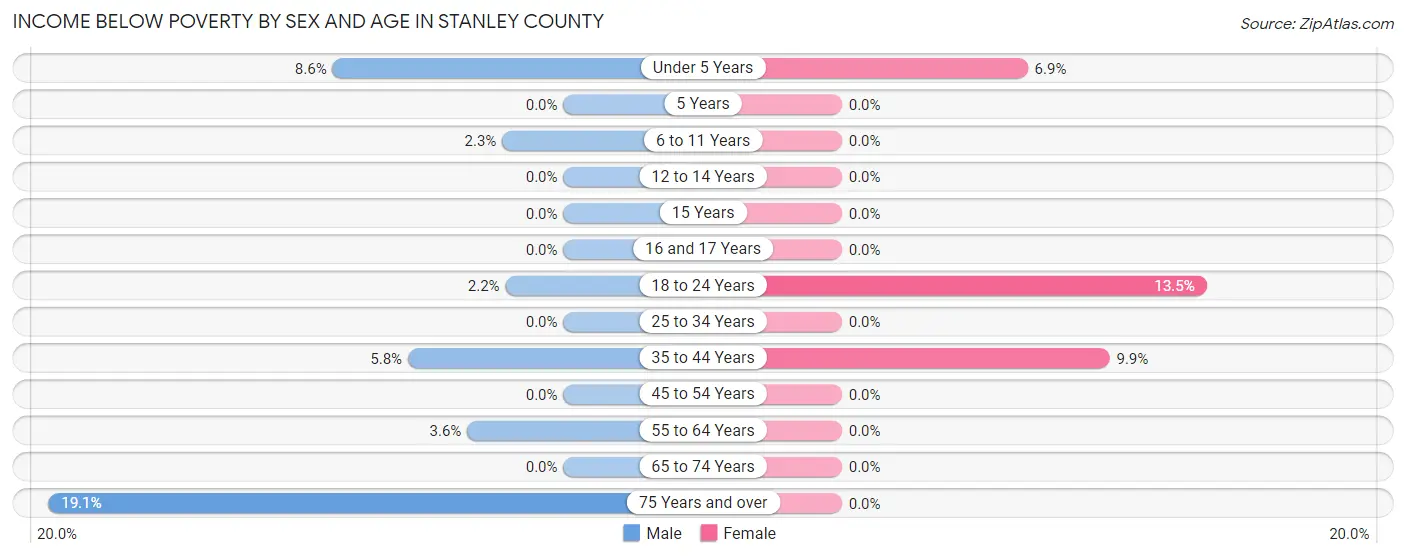
Income Below Poverty by Sex and Age in Stanley County
With 3.6% poverty level for males and 2.8% for females among the residents of Stanley County, 75 year old and over males and 18 to 24 year old females are the most vulnerable to poverty, with 26 males (19.1%) and 13 females (13.5%) in their respective age groups living below the poverty level.
| Age Bracket | Male | Female |
| Under 5 Years | 6 (8.6%) | 4 (6.9%) |
| 5 Years | 0 (0.0%) | 0 (0.0%) |
| 6 to 11 Years | 4 (2.3%) | 0 (0.0%) |
| 12 to 14 Years | 0 (0.0%) | 0 (0.0%) |
| 15 Years | 0 (0.0%) | 0 (0.0%) |
| 16 and 17 Years | 0 (0.0%) | 0 (0.0%) |
| 18 to 24 Years | 2 (2.1%) | 13 (13.5%) |
| 25 to 34 Years | 0 (0.0%) | 0 (0.0%) |
| 35 to 44 Years | 15 (5.8%) | 18 (9.9%) |
| 45 to 54 Years | 0 (0.0%) | 0 (0.0%) |
| 55 to 64 Years | 8 (3.6%) | 0 (0.0%) |
| 65 to 74 Years | 0 (0.0%) | 0 (0.0%) |
| 75 Years and over | 26 (19.1%) | 0 (0.0%) |
| Total | 61 (3.6%) | 35 (2.8%) |
Income Above Poverty by Sex and Age in Stanley County
According to the poverty statistics in Stanley County, males aged 5 years and females aged 5 years are the age groups that are most secure financially, with 100.0% of males and 100.0% of females in these age groups living above the poverty line.
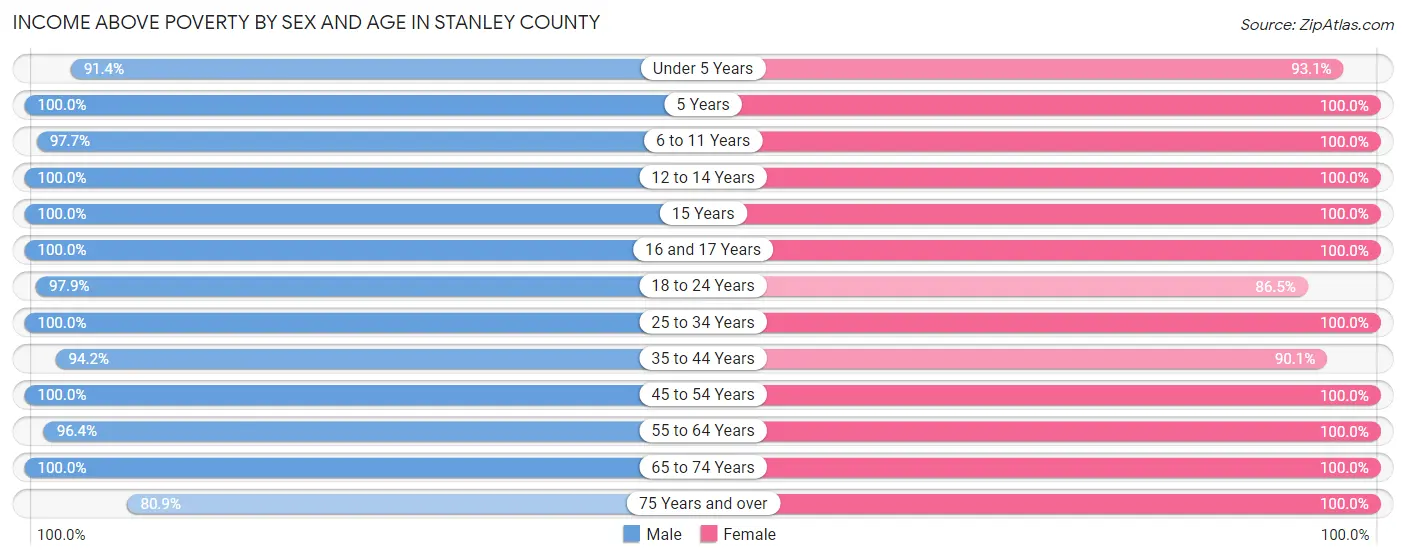
| Age Bracket | Male | Female |
| Under 5 Years | 64 (91.4%) | 54 (93.1%) |
| 5 Years | 34 (100.0%) | 26 (100.0%) |
| 6 to 11 Years | 172 (97.7%) | 90 (100.0%) |
| 12 to 14 Years | 36 (100.0%) | 18 (100.0%) |
| 15 Years | 63 (100.0%) | 11 (100.0%) |
| 16 and 17 Years | 26 (100.0%) | 52 (100.0%) |
| 18 to 24 Years | 91 (97.9%) | 83 (86.5%) |
| 25 to 34 Years | 154 (100.0%) | 104 (100.0%) |
| 35 to 44 Years | 245 (94.2%) | 163 (90.1%) |
| 45 to 54 Years | 205 (100.0%) | 154 (100.0%) |
| 55 to 64 Years | 216 (96.4%) | 193 (100.0%) |
| 65 to 74 Years | 233 (100.0%) | 161 (100.0%) |
| 75 Years and over | 110 (80.9%) | 125 (100.0%) |
| Total | 1,649 (96.4%) | 1,234 (97.2%) |
Income Below Poverty Among Married-Couple Families in Stanley County
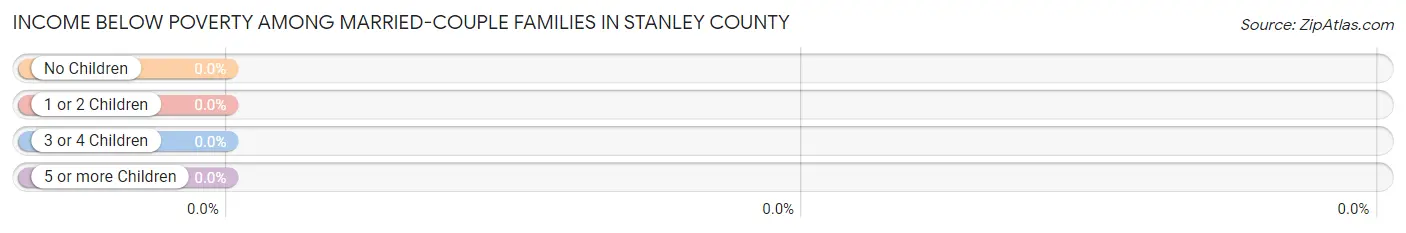
| Children | Above Poverty | Below Poverty |
| No Children | 384 (100.0%) | 0 (0.0%) |
| 1 or 2 Children | 186 (100.0%) | 0 (0.0%) |
| 3 or 4 Children | 61 (100.0%) | 0 (0.0%) |
| 5 or more Children | 0 (0.0%) | 0 (0.0%) |
| Total | 631 (100.0%) | 0 (0.0%) |
Income Below Poverty Among Single-Parent Households in Stanley County

| Children | Single Father | Single Mother |
| No Children | 0 (0.0%) | 0 (0.0%) |
| 1 or 2 Children | 0 (0.0%) | 0 (0.0%) |
| 3 or 4 Children | 0 (0.0%) | 2 (16.7%) |
| 5 or more Children | 0 (0.0%) | 0 (0.0%) |
| Total | 0 (0.0%) | 2 (2.7%) |
Income Below Poverty Among Married-Couple vs Single-Parent Households in Stanley County

| Children | Married-Couple Families | Single-Parent Households |
| No Children | 0 (0.0%) | 0 (0.0%) |
| 1 or 2 Children | 0 (0.0%) | 0 (0.0%) |
| 3 or 4 Children | 0 (0.0%) | 2 (16.7%) |
| 5 or more Children | 0 (0.0%) | 0 (0.0%) |
| Total | 0 (0.0%) | 2 (1.9%) |
Employment Characteristics in Stanley County
Employment by Class of Employer in Stanley County
Among the 1,714 employed individuals in Stanley County, private company employees (807 | 47.1%), state government employees (303 | 17.7%), and local government employees (246 | 14.3%) make up the most common classes of employment.

| Employer Class | # Employees | % Employees |
| Private Company Employees | 807 | 47.1% |
| Self-Employed (Incorporated) | 67 | 3.9% |
| Self-Employed (Not Incorporated) | 119 | 6.9% |
| Not-for-profit Organizations | 112 | 6.5% |
| Local Government Employees | 246 | 14.3% |
| State Government Employees | 303 | 17.7% |
| Federal Government Employees | 60 | 3.5% |
| Unpaid Family Workers | 0 | 0.0% |
| Total | 1,714 | 100.0% |
Employment Status by Age in Stanley County
According to the labor force statistics for Stanley County, out of the total population over 16 years of age (2,397), 72.3% or 1,733 individuals are in the labor force, with 0.2% or 3 of them unemployed. The age group with the highest labor force participation rate is 30 to 34 years, with 100.0% or 119 individuals in the labor force. Within the labor force, the 20 to 24 years age range has the highest percentage of unemployed individuals, with 2.6% or 3 of them being unemployed.

| Age Bracket | In Labor Force | Unemployed |
| 16 to 19 Years | 71 (58.7%) | 0 (0.0%) |
| 20 to 24 Years | 114 (78.1%) | 3 (2.6%) |
| 25 to 29 Years | 124 (89.2%) | 0 (0.0%) |
| 30 to 34 Years | 119 (100.0%) | 0 (0.0%) |
| 35 to 44 Years | 358 (81.2%) | 0 (0.0%) |
| 45 to 54 Years | 347 (96.7%) | 0 (0.0%) |
| 55 to 59 Years | 196 (90.3%) | 0 (0.0%) |
| 60 to 64 Years | 157 (78.5%) | 0 (0.0%) |
| 65 to 74 Years | 175 (44.4%) | 0 (0.0%) |
| 75 Years and over | 72 (27.6%) | 0 (0.0%) |
| Total | 1,733 (72.3%) | 3 (0.2%) |
Employment Status by Educational Attainment in Stanley County

| Educational Attainment | In Labor Force | Unemployed |
| Less than High School | 41 (54.7%) | 0 (0.0%) |
| High School Diploma | 504 (91.8%) | 0 (0.0%) |
| College / Associate Degree | 472 (91.7%) | 0 (0.0%) |
| Bachelor's Degree or higher | 284 (84.5%) | 0 (0.0%) |
| Total | 1,301 (88.2%) | 0 (0.0%) |
Employment Occupations by Sex in Stanley County
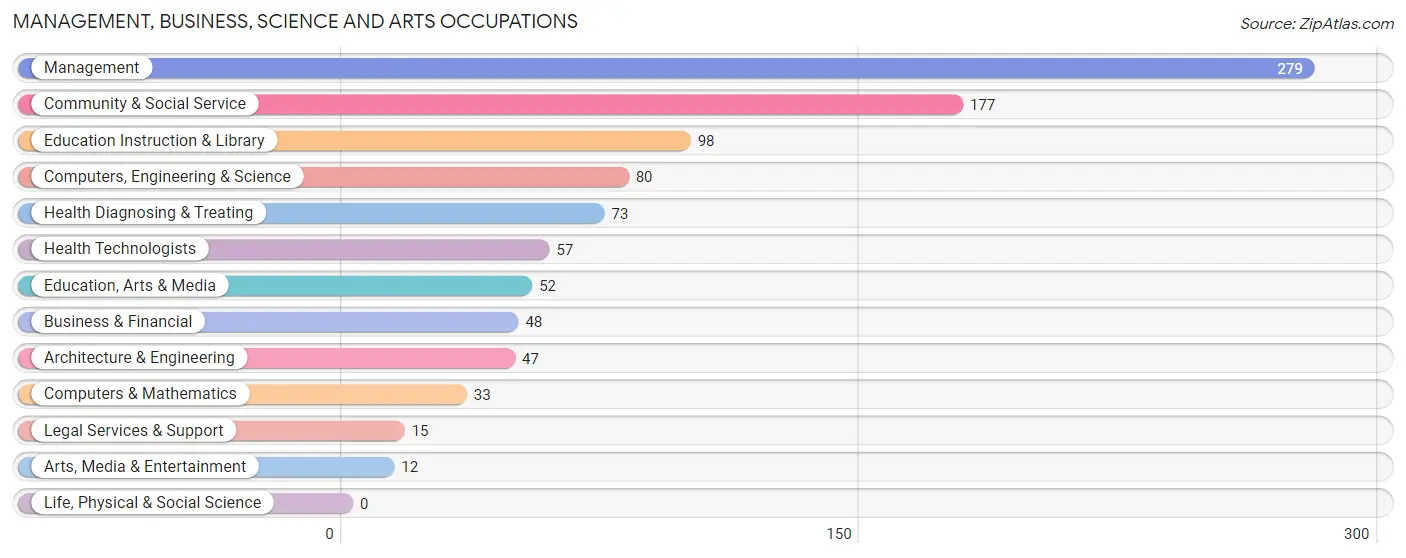
Management, Business, Science and Arts Occupations
The most common Management, Business, Science and Arts occupations in Stanley County are Management (279 | 16.3%), Community & Social Service (177 | 10.3%), Education Instruction & Library (98 | 5.7%), Computers, Engineering & Science (80 | 4.7%), and Health Diagnosing & Treating (73 | 4.3%).
Management, Business, Science and Arts Occupations by Sex
Within the Management, Business, Science and Arts occupations in Stanley County, the most male-oriented occupations are Architecture & Engineering (100.0%), Arts, Media & Entertainment (100.0%), and Computers, Engineering & Science (80.0%), while the most female-oriented occupations are Education, Arts & Media (100.0%), Community & Social Service (73.5%), and Health Diagnosing & Treating (71.2%).

| Occupation | Male | Female |
| Management | 174 (62.4%) | 105 (37.6%) |
| Business & Financial | 17 (35.4%) | 31 (64.6%) |
| Computers, Engineering & Science | 64 (80.0%) | 16 (20.0%) |
| Computers & Mathematics | 17 (51.5%) | 16 (48.5%) |
| Architecture & Engineering | 47 (100.0%) | 0 (0.0%) |
| Life, Physical & Social Science | 0 (0.0%) | 0 (0.0%) |
| Community & Social Service | 47 (26.6%) | 130 (73.5%) |
| Education, Arts & Media | 0 (0.0%) | 52 (100.0%) |
| Legal Services & Support | 6 (40.0%) | 9 (60.0%) |
| Education Instruction & Library | 29 (29.6%) | 69 (70.4%) |
| Arts, Media & Entertainment | 12 (100.0%) | 0 (0.0%) |
| Health Diagnosing & Treating | 21 (28.8%) | 52 (71.2%) |
| Health Technologists | 21 (36.8%) | 36 (63.2%) |
| Total (Category) | 323 (49.2%) | 334 (50.8%) |
| Total (Overall) | 969 (56.5%) | 745 (43.5%) |
Services Occupations
The most common Services occupations in Stanley County are Food Preparation & Serving (63 | 3.7%), Security & Protection (55 | 3.2%), Personal Care & Service (51 | 3.0%), Law Enforcement (48 | 2.8%), and Cleaning & Maintenance (26 | 1.5%).

Services Occupations by Sex
Within the Services occupations in Stanley County, the most male-oriented occupations are Cleaning & Maintenance (100.0%), Law Enforcement (35.4%), and Security & Protection (30.9%), while the most female-oriented occupations are Firefighting & Prevention (100.0%), Food Preparation & Serving (85.7%), and Personal Care & Service (80.4%).

| Occupation | Male | Female |
| Healthcare Support | 0 (0.0%) | 0 (0.0%) |
| Security & Protection | 17 (30.9%) | 38 (69.1%) |
| Firefighting & Prevention | 0 (0.0%) | 7 (100.0%) |
| Law Enforcement | 17 (35.4%) | 31 (64.6%) |
| Food Preparation & Serving | 9 (14.3%) | 54 (85.7%) |
| Cleaning & Maintenance | 26 (100.0%) | 0 (0.0%) |
| Personal Care & Service | 10 (19.6%) | 41 (80.4%) |
| Total (Category) | 62 (31.8%) | 133 (68.2%) |
| Total (Overall) | 969 (56.5%) | 745 (43.5%) |
Sales and Office Occupations
The most common Sales and Office occupations in Stanley County are Office & Administration (260 | 15.2%), and Sales & Related (141 | 8.2%).

Sales and Office Occupations by Sex

| Occupation | Male | Female |
| Sales & Related | 98 (69.5%) | 43 (30.5%) |
| Office & Administration | 68 (26.2%) | 192 (73.9%) |
| Total (Category) | 166 (41.4%) | 235 (58.6%) |
| Total (Overall) | 969 (56.5%) | 745 (43.5%) |
Natural Resources, Construction and Maintenance Occupations
The most common Natural Resources, Construction and Maintenance occupations in Stanley County are Construction & Extraction (166 | 9.7%), and Installation, Maintenance & Repair (30 | 1.8%).

Natural Resources, Construction and Maintenance Occupations by Sex

| Occupation | Male | Female |
| Farming, Fishing & Forestry | 0 (0.0%) | 0 (0.0%) |
| Construction & Extraction | 166 (100.0%) | 0 (0.0%) |
| Installation, Maintenance & Repair | 23 (76.7%) | 7 (23.3%) |
| Total (Category) | 189 (96.4%) | 7 (3.6%) |
| Total (Overall) | 969 (56.5%) | 745 (43.5%) |
Production, Transportation and Moving Occupations
The most common Production, Transportation and Moving occupations in Stanley County are Transportation (115 | 6.7%), Production (113 | 6.6%), and Material Moving (37 | 2.2%).

Production, Transportation and Moving Occupations by Sex
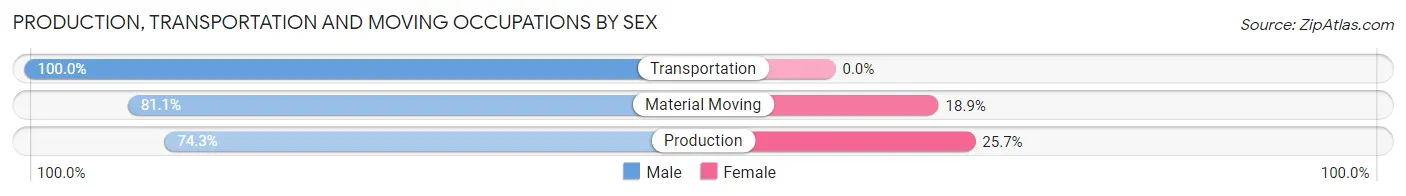
| Occupation | Male | Female |
| Production | 84 (74.3%) | 29 (25.7%) |
| Transportation | 115 (100.0%) | 0 (0.0%) |
| Material Moving | 30 (81.1%) | 7 (18.9%) |
| Total (Category) | 229 (86.4%) | 36 (13.6%) |
| Total (Overall) | 969 (56.5%) | 745 (43.5%) |
Employment Industries by Sex in Stanley County
Employment Industries in Stanley County
The major employment industries in Stanley County include Public Administration (319 | 18.6%), Construction (249 | 14.5%), Health Care & Social Assistance (185 | 10.8%), Retail Trade (176 | 10.3%), and Agriculture, Fishing & Hunting (142 | 8.3%).

Employment Industries by Sex in Stanley County
The Stanley County industries that see more men than women are Administrative & Support (100.0%), Arts, Entertainment & Recreation (100.0%), and Construction (96.8%), whereas the industries that tend to have a higher number of women are Real Estate, Rental & Leasing (100.0%), Accommodation & Food Services (85.5%), and Health Care & Social Assistance (82.2%).

| Industry | Male | Female |
| Agriculture, Fishing & Hunting | 108 (76.1%) | 34 (23.9%) |
| Mining, Quarrying, & Extraction | 0 (0.0%) | 0 (0.0%) |
| Construction | 241 (96.8%) | 8 (3.2%) |
| Manufacturing | 67 (83.8%) | 13 (16.3%) |
| Wholesale Trade | 24 (88.9%) | 3 (11.1%) |
| Retail Trade | 123 (69.9%) | 53 (30.1%) |
| Transportation & Warehousing | 38 (86.4%) | 6 (13.6%) |
| Utilities | 10 (40.0%) | 15 (60.0%) |
| Information | 9 (56.2%) | 7 (43.8%) |
| Finance & Insurance | 37 (29.6%) | 88 (70.4%) |
| Real Estate, Rental & Leasing | 0 (0.0%) | 25 (100.0%) |
| Professional & Scientific | 26 (68.4%) | 12 (31.6%) |
| Enterprise Management | 0 (0.0%) | 0 (0.0%) |
| Administrative & Support | 34 (100.0%) | 0 (0.0%) |
| Educational Services | 34 (26.6%) | 94 (73.4%) |
| Health Care & Social Assistance | 33 (17.8%) | 152 (82.2%) |
| Arts, Entertainment & Recreation | 8 (100.0%) | 0 (0.0%) |
| Accommodation & Food Services | 9 (14.5%) | 53 (85.5%) |
| Public Administration | 157 (49.2%) | 162 (50.8%) |
| Total | 969 (56.5%) | 745 (43.5%) |
Education in Stanley County
School Enrollment in Stanley County
The most common levels of schooling among the 628 students in Stanley County are high school (194 | 30.9%), elementary school (185 | 29.5%), and nursery / preschool (94 | 15.0%).

| School Level | # Students | % Students |
| Nursery / Preschool | 94 | 15.0% |
| Kindergarten | 65 | 10.3% |
| Elementary School | 185 | 29.5% |
| Middle School | 52 | 8.3% |
| High School | 194 | 30.9% |
| College / Undergraduate | 28 | 4.5% |
| Graduate / Professional | 10 | 1.6% |
| Total | 628 | 100.0% |
School Enrollment by Age by Funding Source in Stanley County
Out of a total of 628 students who are enrolled in schools in Stanley County, 87 (13.9%) attend a private institution, while the remaining 541 (86.1%) are enrolled in public schools. The age group of 3 to 4 year olds has the highest likelihood of being enrolled in private schools, with 45 (72.6% in the age bracket) enrolled. Conversely, the age group of 15 to 17 year olds has the lowest likelihood of being enrolled in a private school, with 152 (100.0% in the age bracket) attending a public institution.

| Age Bracket | Public School | Private School |
| 3 to 4 Year Olds | 17 (27.4%) | 45 (72.6%) |
| 5 to 9 Year Old | 190 (89.6%) | 22 (10.4%) |
| 10 to 14 Year Olds | 133 (90.5%) | 14 (9.5%) |
| 15 to 17 Year Olds | 152 (100.0%) | 0 (0.0%) |
| 18 to 19 Year Olds | 12 (100.0%) | 0 (0.0%) |
| 20 to 24 Year Olds | 0 (0.0%) | 0 (0.0%) |
| 25 to 34 Year Olds | 5 (100.0%) | 0 (0.0%) |
| 35 Years and over | 32 (84.2%) | 6 (15.8%) |
| Total | 541 (86.1%) | 87 (13.9%) |
Educational Attainment by Field of Study in Stanley County
Education (176 | 27.9%), business (104 | 16.5%), arts & humanities (63 | 10.0%), psychology (51 | 8.1%), and bio, nature & agricultural (40 | 6.3%) are the most common fields of study among 632 individuals in Stanley County who have obtained a bachelor's degree or higher.

| Field of Study | # Graduates | % Graduates |
| Computers & Mathematics | 11 | 1.7% |
| Bio, Nature & Agricultural | 40 | 6.3% |
| Physical & Health Sciences | 29 | 4.6% |
| Psychology | 51 | 8.1% |
| Social Sciences | 37 | 5.9% |
| Engineering | 38 | 6.0% |
| Multidisciplinary Studies | 0 | 0.0% |
| Science & Technology | 27 | 4.3% |
| Business | 104 | 16.5% |
| Education | 176 | 27.9% |
| Literature & Languages | 10 | 1.6% |
| Liberal Arts & History | 26 | 4.1% |
| Visual & Performing Arts | 4 | 0.6% |
| Communications | 16 | 2.5% |
| Arts & Humanities | 63 | 10.0% |
| Total | 632 | 100.0% |
Transportation & Commute in Stanley County
Vehicle Availability by Sex in Stanley County
The most prevalent vehicle ownership categories in Stanley County are males with 2 vehicles (489, accounting for 49.8%) and females with 2 vehicles (295, making up 66.8%).

| Vehicles Available | Male | Female |
| No Vehicle | 18 (1.8%) | 48 (6.6%) |
| 1 Vehicle | 143 (14.6%) | 127 (17.3%) |
| 2 Vehicles | 489 (49.8%) | 295 (40.3%) |
| 3 Vehicles | 210 (21.4%) | 180 (24.6%) |
| 4 Vehicles | 86 (8.8%) | 75 (10.2%) |
| 5 or more Vehicles | 36 (3.7%) | 7 (1.0%) |
| Total | 982 (100.0%) | 732 (100.0%) |
Commute Time in Stanley County
The most frequently occuring commute durations in Stanley County are 15 to 19 minutes (471 commuters, 29.3%), 10 to 14 minutes (406 commuters, 25.3%), and 5 to 9 minutes (364 commuters, 22.7%).

| Commute Time | # Commuters | % Commuters |
| Less than 5 Minutes | 100 | 6.2% |
| 5 to 9 Minutes | 364 | 22.7% |
| 10 to 14 Minutes | 406 | 25.3% |
| 15 to 19 Minutes | 471 | 29.3% |
| 20 to 24 Minutes | 96 | 6.0% |
| 25 to 29 Minutes | 0 | 0.0% |
| 30 to 34 Minutes | 11 | 0.7% |
| 35 to 39 Minutes | 17 | 1.1% |
| 40 to 44 Minutes | 36 | 2.2% |
| 45 to 59 Minutes | 55 | 3.4% |
| 60 to 89 Minutes | 38 | 2.4% |
| 90 or more Minutes | 12 | 0.7% |
Commute Time by Sex in Stanley County
The most common commute times in Stanley County are 15 to 19 minutes (264 commuters, 28.7%) for males and 15 to 19 minutes (207 commuters, 30.1%) for females.

| Commute Time | Male | Female |
| Less than 5 Minutes | 46 (5.0%) | 54 (7.9%) |
| 5 to 9 Minutes | 220 (23.9%) | 144 (21.0%) |
| 10 to 14 Minutes | 231 (25.1%) | 175 (25.5%) |
| 15 to 19 Minutes | 264 (28.7%) | 207 (30.1%) |
| 20 to 24 Minutes | 39 (4.2%) | 57 (8.3%) |
| 25 to 29 Minutes | 0 (0.0%) | 0 (0.0%) |
| 30 to 34 Minutes | 11 (1.2%) | 0 (0.0%) |
| 35 to 39 Minutes | 0 (0.0%) | 17 (2.5%) |
| 40 to 44 Minutes | 36 (3.9%) | 0 (0.0%) |
| 45 to 59 Minutes | 50 (5.4%) | 5 (0.7%) |
| 60 to 89 Minutes | 22 (2.4%) | 16 (2.3%) |
| 90 or more Minutes | 0 (0.0%) | 12 (1.8%) |
Time of Departure to Work by Sex in Stanley County
The most frequent times of departure to work in Stanley County are 7:30 AM to 7:59 AM (292, 31.8%) for males and 7:30 AM to 7:59 AM (380, 55.3%) for females.

| Time of Departure | Male | Female |
| 12:00 AM to 4:59 AM | 34 (3.7%) | 10 (1.5%) |
| 5:00 AM to 5:29 AM | 2 (0.2%) | 0 (0.0%) |
| 5:30 AM to 5:59 AM | 9 (1.0%) | 21 (3.1%) |
| 6:00 AM to 6:29 AM | 38 (4.1%) | 7 (1.0%) |
| 6:30 AM to 6:59 AM | 148 (16.1%) | 6 (0.9%) |
| 7:00 AM to 7:29 AM | 123 (13.4%) | 109 (15.9%) |
| 7:30 AM to 7:59 AM | 292 (31.8%) | 380 (55.3%) |
| 8:00 AM to 8:29 AM | 56 (6.1%) | 37 (5.4%) |
| 8:30 AM to 8:59 AM | 36 (3.9%) | 28 (4.1%) |
| 9:00 AM to 9:59 AM | 13 (1.4%) | 8 (1.2%) |
| 10:00 AM to 10:59 AM | 0 (0.0%) | 0 (0.0%) |
| 11:00 AM to 11:59 AM | 0 (0.0%) | 0 (0.0%) |
| 12:00 PM to 3:59 PM | 92 (10.0%) | 69 (10.0%) |
| 4:00 PM to 11:59 PM | 76 (8.3%) | 12 (1.8%) |
| Total | 919 (100.0%) | 687 (100.0%) |
Housing Occupancy in Stanley County
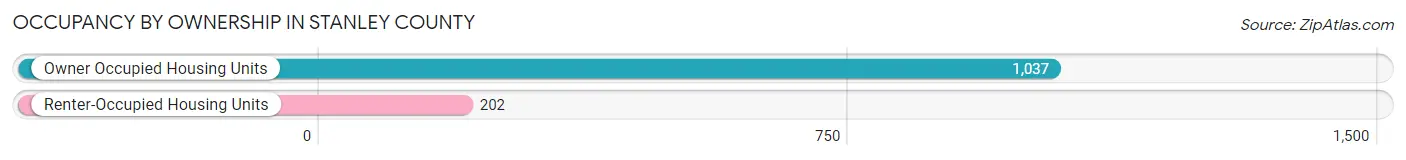
Occupancy by Ownership in Stanley County
Of the total 1,239 dwellings in Stanley County, owner-occupied units account for 1,037 (83.7%), while renter-occupied units make up 202 (16.3%).
| Occupancy | # Housing Units | % Housing Units |
| Owner Occupied Housing Units | 1,037 | 83.7% |
| Renter-Occupied Housing Units | 202 | 16.3% |
| Total Occupied Housing Units | 1,239 | 100.0% |
Occupancy by Household Size in Stanley County

| Household Size | # Housing Units | % Housing Units |
| 1-Person Household | 464 | 37.4% |
| 2-Person Household | 453 | 36.6% |
| 3-Person Household | 93 | 7.5% |
| 4+ Person Household | 229 | 18.5% |
| Total Housing Units | 1,239 | 100.0% |
Occupancy by Ownership by Household Size in Stanley County

| Household Size | Owner-occupied | Renter-occupied |
| 1-Person Household | 367 (79.1%) | 97 (20.9%) |
| 2-Person Household | 365 (80.6%) | 88 (19.4%) |
| 3-Person Household | 86 (92.5%) | 7 (7.5%) |
| 4+ Person Household | 219 (95.6%) | 10 (4.4%) |
| Total Housing Units | 1,037 (83.7%) | 202 (16.3%) |
Occupancy by Educational Attainment in Stanley County

| Household Size | Owner-occupied | Renter-occupied |
| Less than High School | 54 (69.2%) | 24 (30.8%) |
| High School Diploma | 395 (88.4%) | 52 (11.6%) |
| College/Associate Degree | 281 (80.1%) | 70 (19.9%) |
| Bachelor's Degree or higher | 307 (84.6%) | 56 (15.4%) |
Occupancy by Age of Householder in Stanley County

| Age Bracket | # Households | % Households |
| Under 35 Years | 221 | 17.8% |
| 35 to 44 Years | 219 | 17.7% |
| 45 to 54 Years | 130 | 10.5% |
| 55 to 64 Years | 263 | 21.2% |
| 65 to 74 Years | 233 | 18.8% |
| 75 to 84 Years | 98 | 7.9% |
| 85 Years and Over | 75 | 6.0% |
| Total | 1,239 | 100.0% |
Housing Finances in Stanley County
Median Income by Occupancy in Stanley County

| Occupancy Type | # Households | Median Income |
| Owner-Occupied | 1,037 (83.7%) | $88,188 |
| Renter-Occupied | 202 (16.3%) | $54,250 |
| Average | 1,239 (100.0%) | $82,298 |
Occupancy by Householder Income Bracket in Stanley County

| Income Bracket | Owner-occupied | Renter-occupied |
| Less than $5,000 | 3 (0.3%) | 0 (0.0%) |
| $5,000 to $9,999 | 0 (0.0%) | 0 (0.0%) |
| $10,000 to $14,999 | 26 (2.5%) | 13 (6.4%) |
| $15,000 to $19,999 | 26 (2.5%) | 12 (5.9%) |
| $20,000 to $24,999 | 15 (1.5%) | 9 (4.5%) |
| $25,000 to $34,999 | 121 (11.7%) | 31 (15.3%) |
| $35,000 to $49,999 | 53 (5.1%) | 29 (14.4%) |
| $50,000 to $74,999 | 176 (17.0%) | 50 (24.7%) |
| $75,000 to $99,999 | 199 (19.2%) | 11 (5.4%) |
| $100,000 to $149,999 | 162 (15.6%) | 28 (13.9%) |
| $150,000 or more | 256 (24.7%) | 19 (9.4%) |
| Total | 1,037 (100.0%) | 202 (100.0%) |
Monthly Housing Cost Tiers in Stanley County

| Monthly Cost | Owner-occupied | Renter-occupied |
| Less than $300 | 40 (3.9%) | 0 (0.0%) |
| $300 to $499 | 83 (8.0%) | 0 (0.0%) |
| $500 to $799 | 278 (26.8%) | 46 (22.8%) |
| $800 to $999 | 128 (12.3%) | 96 (47.5%) |
| $1,000 to $1,499 | 253 (24.4%) | 41 (20.3%) |
| $1,500 to $1,999 | 83 (8.0%) | 10 (5.0%) |
| $2,000 to $2,499 | 78 (7.5%) | 0 (0.0%) |
| $2,500 to $2,999 | 16 (1.5%) | 0 (0.0%) |
| $3,000 or more | 78 (7.5%) | 0 (0.0%) |
| Total | 1,037 (100.0%) | 202 (100.0%) |
Physical Housing Characteristics in Stanley County
Housing Structures in Stanley County

| Structure Type | # Housing Units | % Housing Units |
| Single Unit, Detached | 790 | 63.8% |
| Single Unit, Attached | 14 | 1.1% |
| 2 Unit Apartments | 0 | 0.0% |
| 3 or 4 Unit Apartments | 39 | 3.2% |
| 5 to 9 Unit Apartments | 0 | 0.0% |
| 10 or more Apartments | 91 | 7.3% |
| Mobile Home / Other | 305 | 24.6% |
| Total | 1,239 | 100.0% |
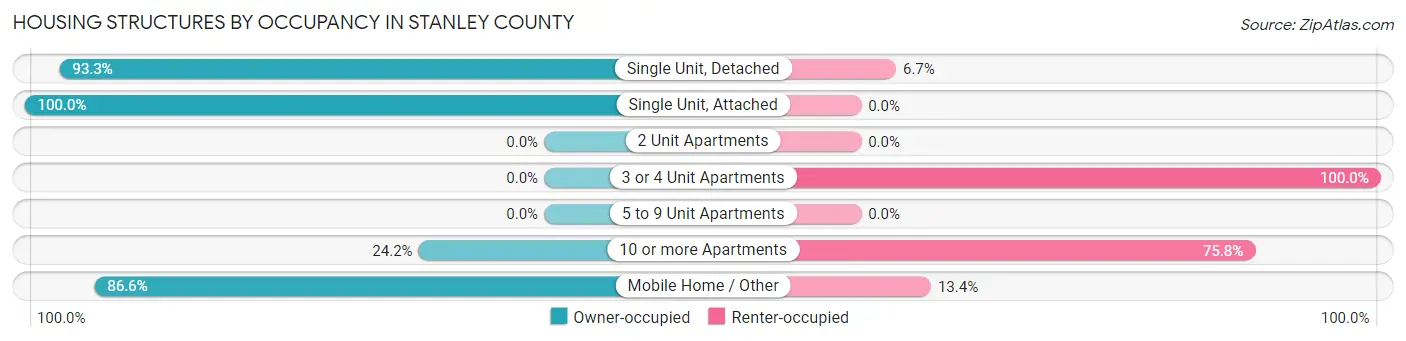
Housing Structures by Occupancy in Stanley County
| Structure Type | Owner-occupied | Renter-occupied |
| Single Unit, Detached | 737 (93.3%) | 53 (6.7%) |
| Single Unit, Attached | 14 (100.0%) | 0 (0.0%) |
| 2 Unit Apartments | 0 (0.0%) | 0 (0.0%) |
| 3 or 4 Unit Apartments | 0 (0.0%) | 39 (100.0%) |
| 5 to 9 Unit Apartments | 0 (0.0%) | 0 (0.0%) |
| 10 or more Apartments | 22 (24.2%) | 69 (75.8%) |
| Mobile Home / Other | 264 (86.6%) | 41 (13.4%) |
| Total | 1,037 (83.7%) | 202 (16.3%) |
Housing Structures by Number of Rooms in Stanley County

| Number of Rooms | Owner-occupied | Renter-occupied |
| 1 Room | 0 (0.0%) | 0 (0.0%) |
| 2 or 3 Rooms | 89 (8.6%) | 51 (25.3%) |
| 4 or 5 Rooms | 371 (35.8%) | 120 (59.4%) |
| 6 or 7 Rooms | 259 (25.0%) | 9 (4.5%) |
| 8 or more Rooms | 318 (30.7%) | 22 (10.9%) |
| Total | 1,037 (100.0%) | 202 (100.0%) |
Housing Structure by Heating Type in Stanley County

| Heating Type | Owner-occupied | Renter-occupied |
| Utility Gas | 609 (58.7%) | 104 (51.5%) |
| Bottled, Tank, or LP Gas | 150 (14.5%) | 23 (11.4%) |
| Electricity | 219 (21.1%) | 62 (30.7%) |
| Fuel Oil or Kerosene | 47 (4.5%) | 4 (2.0%) |
| Coal or Coke | 0 (0.0%) | 0 (0.0%) |
| All other Fuels | 2 (0.2%) | 0 (0.0%) |
| No Fuel Used | 10 (1.0%) | 9 (4.5%) |
| Total | 1,037 (100.0%) | 202 (100.0%) |
Household Vehicle Usage in Stanley County

| Vehicles per Household | Owner-occupied | Renter-occupied |
| No Vehicle | 27 (2.6%) | 9 (4.5%) |
| 1 Vehicle | 223 (21.5%) | 104 (51.5%) |
| 2 Vehicles | 473 (45.6%) | 78 (38.6%) |
| 3 or more Vehicles | 314 (30.3%) | 11 (5.4%) |
| Total | 1,037 (100.0%) | 202 (100.0%) |
Real Estate & Mortgages in Stanley County
Real Estate and Mortgage Overview in Stanley County
| Characteristic | Without Mortgage | With Mortgage |
| Housing Units | 471 | 566 |
| Median Property Value | $157,100 | $187,800 |
| Median Household Income | $58,750 | $166 |
| Monthly Housing Costs | $616 | $78 |
| Real Estate Taxes | $2,145 | $37 |
Property Value by Mortgage Status in Stanley County

| Property Value | Without Mortgage | With Mortgage |
| Less than $50,000 | 150 (31.9%) | 54 (9.5%) |
| $50,000 to $99,999 | 7 (1.5%) | 77 (13.6%) |
| $100,000 to $299,999 | 229 (48.6%) | 222 (39.2%) |
| $300,000 to $499,999 | 69 (14.6%) | 153 (27.0%) |
| $500,000 to $749,999 | 7 (1.5%) | 29 (5.1%) |
| $750,000 to $999,999 | 6 (1.3%) | 3 (0.5%) |
| $1,000,000 or more | 3 (0.6%) | 28 (5.0%) |
| Total | 471 (100.0%) | 566 (100.0%) |
Household Income by Mortgage Status in Stanley County

| Household Income | Without Mortgage | With Mortgage |
| Less than $10,000 | 3 (0.6%) | 0 (0.0%) |
| $10,000 to $24,999 | 50 (10.6%) | 0 (0.0%) |
| $25,000 to $34,999 | 88 (18.7%) | 17 (3.0%) |
| $35,000 to $49,999 | 37 (7.9%) | 33 (5.8%) |
| $50,000 to $74,999 | 99 (21.0%) | 16 (2.8%) |
| $75,000 to $99,999 | 52 (11.0%) | 77 (13.6%) |
| $100,000 to $149,999 | 52 (11.0%) | 147 (26.0%) |
| $150,000 or more | 90 (19.1%) | 110 (19.4%) |
| Total | 471 (100.0%) | 566 (100.0%) |
Property Value to Household Income Ratio in Stanley County

| Value-to-Income Ratio | Without Mortgage | With Mortgage |
| Less than 2.0x | 211 (44.8%) | 97,111 (17,157.4%) |
| 2.0x to 2.9x | 166 (35.2%) | 284 (50.2%) |
| 3.0x to 3.9x | 11 (2.3%) | 107 (18.9%) |
| 4.0x or more | 83 (17.6%) | 107 (18.9%) |
| Total | 471 (100.0%) | 566 (100.0%) |
Real Estate Taxes by Mortgage Status in Stanley County

| Property Taxes | Without Mortgage | With Mortgage |
| Less than $800 | 84 (17.8%) | 0 (0.0%) |
| $800 to $1,499 | 57 (12.1%) | 55 (9.7%) |
| $800 to $1,499 | 282 (59.9%) | 106 (18.7%) |
| Total | 471 (100.0%) | 566 (100.0%) |
Health & Disability in Stanley County
Health Insurance Coverage by Age in Stanley County

| Age Bracket | With Coverage | Without Coverage |
| Under 6 Years | 188 (100.0%) | 0 (0.0%) |
| 6 to 18 Years | 500 (100.0%) | 0 (0.0%) |
| 19 to 25 Years | 197 (100.0%) | 0 (0.0%) |
| 26 to 34 Years | 161 (72.5%) | 61 (27.5%) |
| 35 to 44 Years | 391 (88.7%) | 50 (11.3%) |
| 45 to 54 Years | 300 (87.5%) | 43 (12.5%) |
| 55 to 64 Years | 399 (95.7%) | 18 (4.3%) |
| 65 to 74 Years | 394 (100.0%) | 0 (0.0%) |
| 75 Years and older | 251 (96.2%) | 10 (3.8%) |
| Total | 2,781 (93.9%) | 182 (6.1%) |
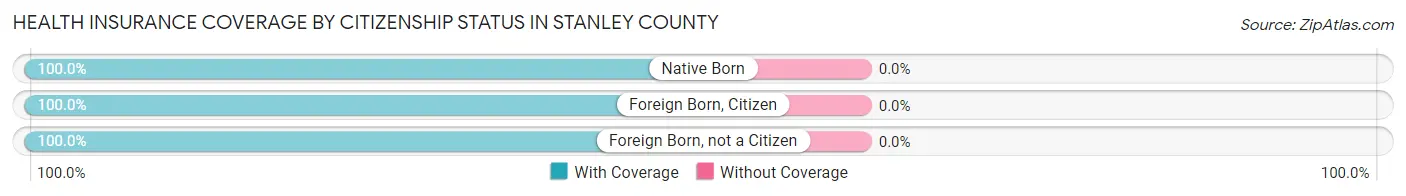
Health Insurance Coverage by Citizenship Status in Stanley County
| Citizenship Status | With Coverage | Without Coverage |
| Native Born | 188 (100.0%) | 0 (0.0%) |
| Foreign Born, Citizen | 500 (100.0%) | 0 (0.0%) |
| Foreign Born, not a Citizen | 197 (100.0%) | 0 (0.0%) |
Health Insurance Coverage by Household Income in Stanley County

| Household Income | With Coverage | Without Coverage |
| Under $25,000 | 115 (98.3%) | 2 (1.7%) |
| $25,000 to $49,999 | 245 (75.1%) | 81 (24.8%) |
| $50,000 to $74,999 | 438 (96.3%) | 17 (3.7%) |
| $75,000 to $99,999 | 431 (85.7%) | 72 (14.3%) |
| $100,000 and over | 1,552 (99.4%) | 10 (0.6%) |
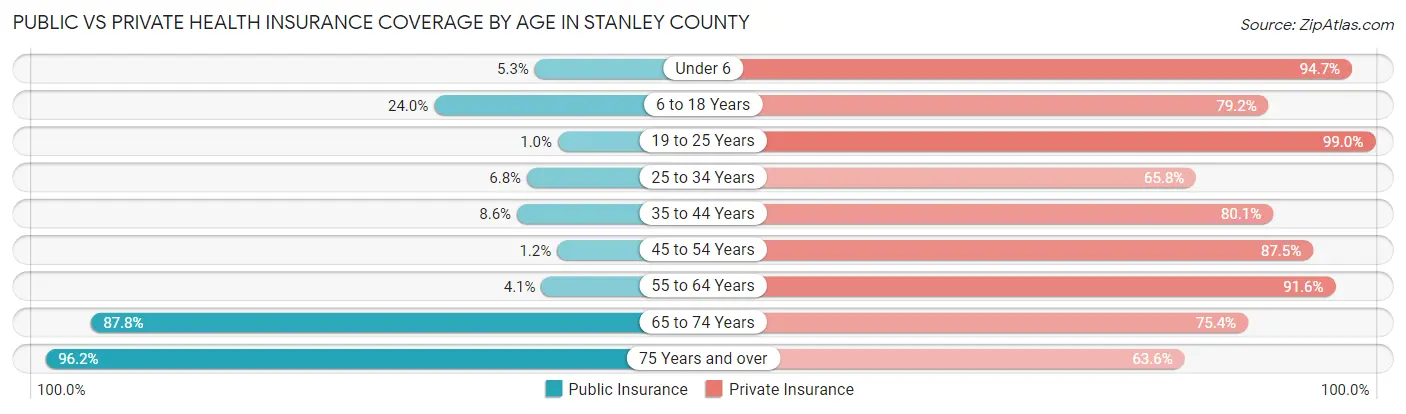
Public vs Private Health Insurance Coverage by Age in Stanley County
| Age Bracket | Public Insurance | Private Insurance |
| Under 6 | 10 (5.3%) | 178 (94.7%) |
| 6 to 18 Years | 120 (24.0%) | 396 (79.2%) |
| 19 to 25 Years | 2 (1.0%) | 195 (99.0%) |
| 25 to 34 Years | 15 (6.8%) | 146 (65.8%) |
| 35 to 44 Years | 38 (8.6%) | 353 (80.0%) |
| 45 to 54 Years | 4 (1.2%) | 300 (87.5%) |
| 55 to 64 Years | 17 (4.1%) | 382 (91.6%) |
| 65 to 74 Years | 346 (87.8%) | 297 (75.4%) |
| 75 Years and over | 251 (96.2%) | 166 (63.6%) |
| Total | 803 (27.1%) | 2,413 (81.4%) |
Disability Status by Sex by Age in Stanley County

| Age Bracket | Male | Female |
| Under 5 Years | 0 (0.0%) | 0 (0.0%) |
| 5 to 17 Years | 16 (4.8%) | 0 (0.0%) |
| 18 to 34 Years | 38 (15.4%) | 16 (8.0%) |
| 35 to 64 Years | 69 (10.2%) | 69 (13.1%) |
| 65 to 74 Years | 52 (22.3%) | 25 (15.5%) |
| 75 Years and over | 101 (74.3%) | 21 (16.8%) |
Disability Class by Sex by Age in Stanley County
Disability Class: Hearing Difficulty

| Age Bracket | Male | Female |
| Under 5 Years | 0 (0.0%) | 0 (0.0%) |
| 5 to 17 Years | 0 (0.0%) | 0 (0.0%) |
| 18 to 34 Years | 0 (0.0%) | 0 (0.0%) |
| 35 to 64 Years | 52 (7.7%) | 12 (2.3%) |
| 65 to 74 Years | 20 (8.6%) | 0 (0.0%) |
| 75 Years and over | 63 (46.3%) | 9 (7.2%) |
Disability Class: Vision Difficulty

| Age Bracket | Male | Female |
| Under 5 Years | 0 (0.0%) | 0 (0.0%) |
| 5 to 17 Years | 0 (0.0%) | 0 (0.0%) |
| 18 to 34 Years | 0 (0.0%) | 0 (0.0%) |
| 35 to 64 Years | 13 (1.9%) | 0 (0.0%) |
| 65 to 74 Years | 0 (0.0%) | 0 (0.0%) |
| 75 Years and over | 0 (0.0%) | 9 (7.2%) |
Disability Class: Cognitive Difficulty

| Age Bracket | Male | Female |
| 5 to 17 Years | 16 (4.8%) | 0 (0.0%) |
| 18 to 34 Years | 15 (6.1%) | 16 (8.0%) |
| 35 to 64 Years | 0 (0.0%) | 41 (7.8%) |
| 65 to 74 Years | 0 (0.0%) | 13 (8.1%) |
| 75 Years and over | 12 (8.8%) | 9 (7.2%) |
Disability Class: Ambulatory Difficulty
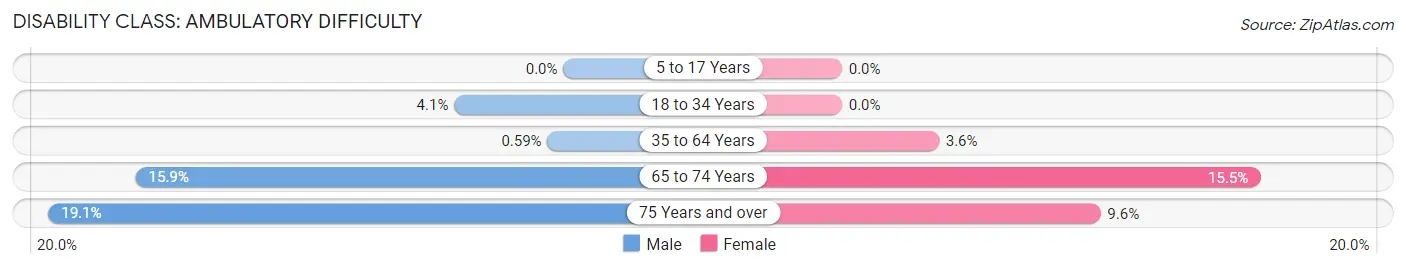
| Age Bracket | Male | Female |
| 5 to 17 Years | 0 (0.0%) | 0 (0.0%) |
| 18 to 34 Years | 10 (4.1%) | 0 (0.0%) |
| 35 to 64 Years | 4 (0.6%) | 19 (3.6%) |
| 65 to 74 Years | 37 (15.9%) | 25 (15.5%) |
| 75 Years and over | 26 (19.1%) | 12 (9.6%) |
Disability Class: Self-Care Difficulty

| Age Bracket | Male | Female |
| 5 to 17 Years | 0 (0.0%) | 0 (0.0%) |
| 18 to 34 Years | 15 (6.1%) | 0 (0.0%) |
| 35 to 64 Years | 9 (1.3%) | 0 (0.0%) |
| 65 to 74 Years | 0 (0.0%) | 13 (8.1%) |
| 75 Years and over | 0 (0.0%) | 0 (0.0%) |
Technology Access in Stanley County
Computing Device Access in Stanley County

| Device Type | # Households | % Households |
| Desktop or Laptop | 957 | 77.2% |
| Smartphone | 1,007 | 81.3% |
| Tablet | 829 | 66.9% |
| No Computing Device | 106 | 8.6% |
| Total | 1,239 | 100.0% |
Internet Access in Stanley County

| Internet Type | # Households | % Households |
| Dial-Up Internet | 19 | 1.5% |
| Broadband Home | 875 | 70.6% |
| Cellular Data Only | 135 | 10.9% |
| Satellite Internet | 45 | 3.6% |
| No Internet | 170 | 13.7% |
| Total | 1,239 | 100.0% |
Stanley County Summary
Stanley County is located in the central part of South Dakota, in the Missouri River Valley. It is bordered by Hughes County to the north, Lyman County to the east, Haakon County to the south, and Meade County to the west. The county seat is Fort Pierre, which is also the state capital.
The county was established in 1873 and named after David Stanley, a Civil War general. The county has a total area of 1,845 square miles, of which 1,843 square miles is land and 2 square miles is water.
The geography of Stanley County is mostly flat, with rolling hills in the east and south. The county is drained by the Missouri River, which forms its western boundary. The county is also home to several lakes, including Lake Oahe, Lake Sharpe, and Lake Francis Case.
The economy of Stanley County is largely based on agriculture. The county is home to several large farms, which produce corn, soybeans, wheat, and other crops. The county also has a large cattle industry, with many ranches located in the area.
The county also has a strong tourism industry, with many visitors coming to the area to enjoy the natural beauty of the Missouri River Valley. The county is home to several state parks, including the Fort Pierre National Grassland, which offers camping, fishing, and other outdoor activities.
The population of Stanley County was estimated at 8,845 in 2020. The population is largely white, with a small percentage of Native Americans and African Americans. The median household income in the county is $50,845, and the median home value is $150,000.
The county is served by several school districts, including the Stanley County School District, which serves the majority of the county. The county also has several private schools, including the Pierre Indian Learning Center, which serves Native American students.
Stanley County is a rural area with a strong agricultural and tourism industry. The county is home to several state parks and other outdoor attractions, making it a popular destination for visitors. The county also has a strong economy, with a median household income of $50,845 and a median home value of $150,000.
Common Questions
What is the Total Population of Stanley County?
Total Population of Stanley County is 2,979.
What is the Total Male Population of Stanley County?
Total Male Population of Stanley County is 1,710.
What is the Total Female Population of Stanley County?
Total Female Population of Stanley County is 1,269.
What is the Ratio of Males per 100 Females in Stanley County?
There are 134.75 Males per 100 Females in Stanley County.
What is the Ratio of Females per 100 Males in Stanley County?
There are 74.21 Females per 100 Males in Stanley County.
What is the Median Population Age in Stanley County?
Median Population Age in Stanley County is 43.2 Years.
What is the Average Family Size in Stanley County
Average Family Size in Stanley County is 3.2 People.
What is the Average Household Size in Stanley County
Average Household Size in Stanley County is 2.4 People.
What is Per Capita Income in Stanley County?
Per Capita income in Stanley County is $46,652.
What is the Median Family Income in Stanley County?
Median Family Income in Stanley County is $107,404.
What is the Median Household income in Stanley County?
Median Household Income in Stanley County is $82,298.
What is Income or Wage Gap in Stanley County?
Income or Wage Gap in Stanley County is 33.1%.
Women in Stanley County earn 66.9 cents for every dollar earned by a man.
What is Inequality or Gini Index in Stanley County?
Inequality or Gini Index in Stanley County is 0.43.
How Large is the Labor Force in Stanley County?
There are 1,733 People in the Labor Forcein in Stanley County.
What is the Percentage of People in the Labor Force in Stanley County?
72.3% of People are in the Labor Force in Stanley County.
What is the Unemployment Rate in Stanley County?
Unemployment Rate in Stanley County is 0.2%.