Spink County, SD
Spink County Map
Spink County Overview
6,355
TOTAL POPULATION
3,231
MALE POPULATION
3,124
FEMALE POPULATION
103.43
MALES / 100 FEMALES
96.69
FEMALES / 100 MALES
45.0
MEDIAN AGE
3.2
AVG FAMILY SIZE
2.4
AVG HOUSEHOLD SIZE
$37,138
PER CAPITA INCOME
$89,952
AVG FAMILY INCOME
$65,795
AVG HOUSEHOLD INCOME
29.4%
WAGE / INCOME GAP [ % ]
70.6¢/ $1
WAGE / INCOME GAP [ $ ]
$11,768
FAMILY INCOME DEFICIT
0.46
INEQUALITY / GINI INDEX
3,045
LABOR FORCE [ PEOPLE ]
59.1%
PERCENT IN LABOR FORCE
1.6%
UNEMPLOYMENT RATE
Spink County Area Codes
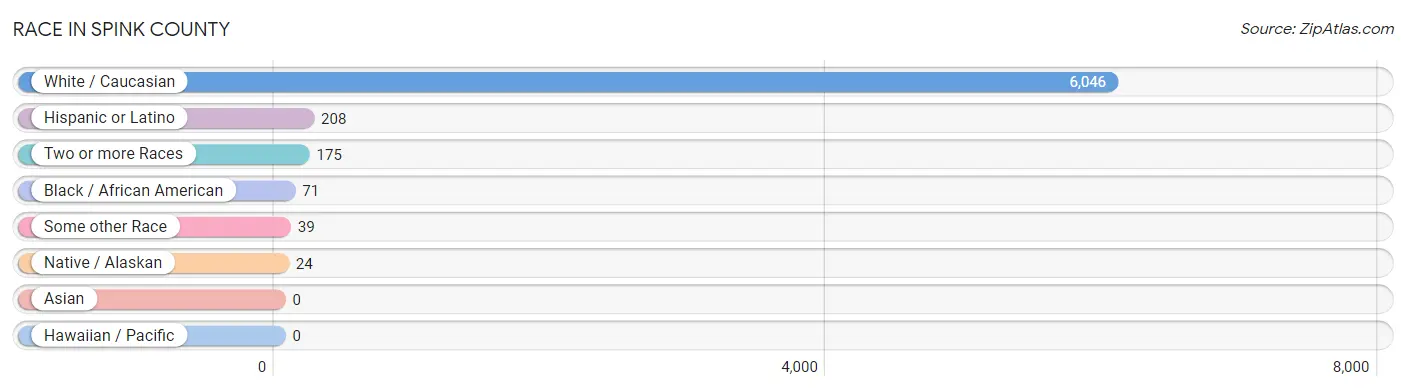
Race in Spink County
The most populous races in Spink County are White / Caucasian (6,046 | 95.1%), Hispanic or Latino (208 | 3.3%), and Two or more Races (175 | 2.8%).
| Race | # Population | % Population |
| Asian | 0 | 0.0% |
| Black / African American | 71 | 1.1% |
| Hawaiian / Pacific | 0 | 0.0% |
| Hispanic or Latino | 208 | 3.3% |
| Native / Alaskan | 24 | 0.4% |
| White / Caucasian | 6,046 | 95.1% |
| Two or more Races | 175 | 2.8% |
| Some other Race | 39 | 0.6% |
| Total | 6,355 | 100.0% |
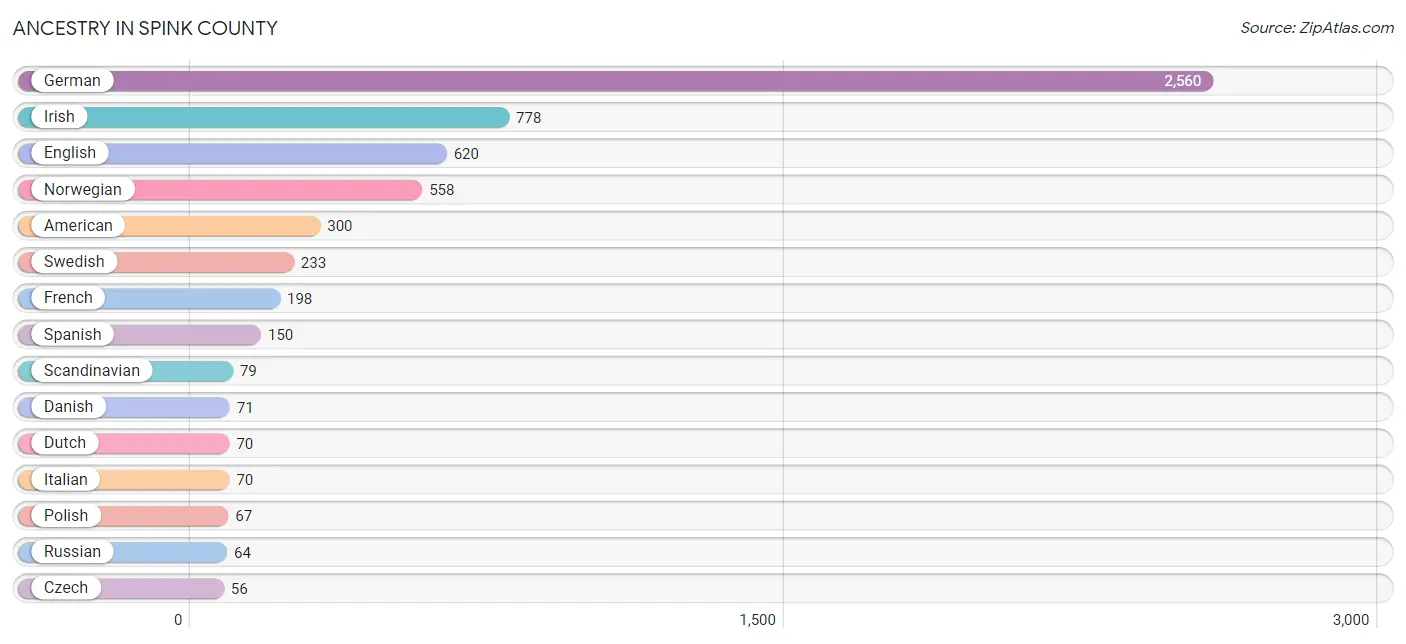
Ancestry in Spink County
The most populous ancestries reported in Spink County are German (2,560 | 40.3%), Irish (778 | 12.2%), English (620 | 9.8%), Norwegian (558 | 8.8%), and American (300 | 4.7%), together accounting for 75.8% of all Spink County residents.
| Ancestry | # Population | % Population |
| American | 300 | 4.7% |
| Arab | 7 | 0.1% |
| Austrian | 47 | 0.7% |
| Belgian | 1 | 0.0% |
| Brazilian | 16 | 0.3% |
| British | 33 | 0.5% |
| Canadian | 3 | 0.1% |
| Cherokee | 6 | 0.1% |
| Chilean | 2 | 0.0% |
| Czech | 56 | 0.9% |
| Danish | 71 | 1.1% |
| Dutch | 70 | 1.1% |
| English | 620 | 9.8% |
| European | 41 | 0.6% |
| Finnish | 2 | 0.0% |
| French | 198 | 3.1% |
| French Canadian | 7 | 0.1% |
| German | 2,560 | 40.3% |
| German Russian | 2 | 0.0% |
| Hungarian | 11 | 0.2% |
| Irish | 778 | 12.2% |
| Italian | 70 | 1.1% |
| Jamaican | 1 | 0.0% |
| Korean | 4 | 0.1% |
| Lithuanian | 2 | 0.0% |
| Mexican | 56 | 0.9% |
| Northern European | 8 | 0.1% |
| Norwegian | 558 | 8.8% |
| Polish | 67 | 1.1% |
| Portuguese | 46 | 0.7% |
| Russian | 64 | 1.0% |
| Scandinavian | 79 | 1.2% |
| Scotch-Irish | 9 | 0.1% |
| Scottish | 20 | 0.3% |
| Sioux | 26 | 0.4% |
| South African | 9 | 0.1% |
| South American | 2 | 0.0% |
| Spanish | 150 | 2.4% |
| Subsaharan African | 9 | 0.1% |
| Swedish | 233 | 3.7% |
| Swiss | 31 | 0.5% |
| Syrian | 7 | 0.1% |
| Ukrainian | 24 | 0.4% |
| Welsh | 29 | 0.5% | View All 44 Rows |
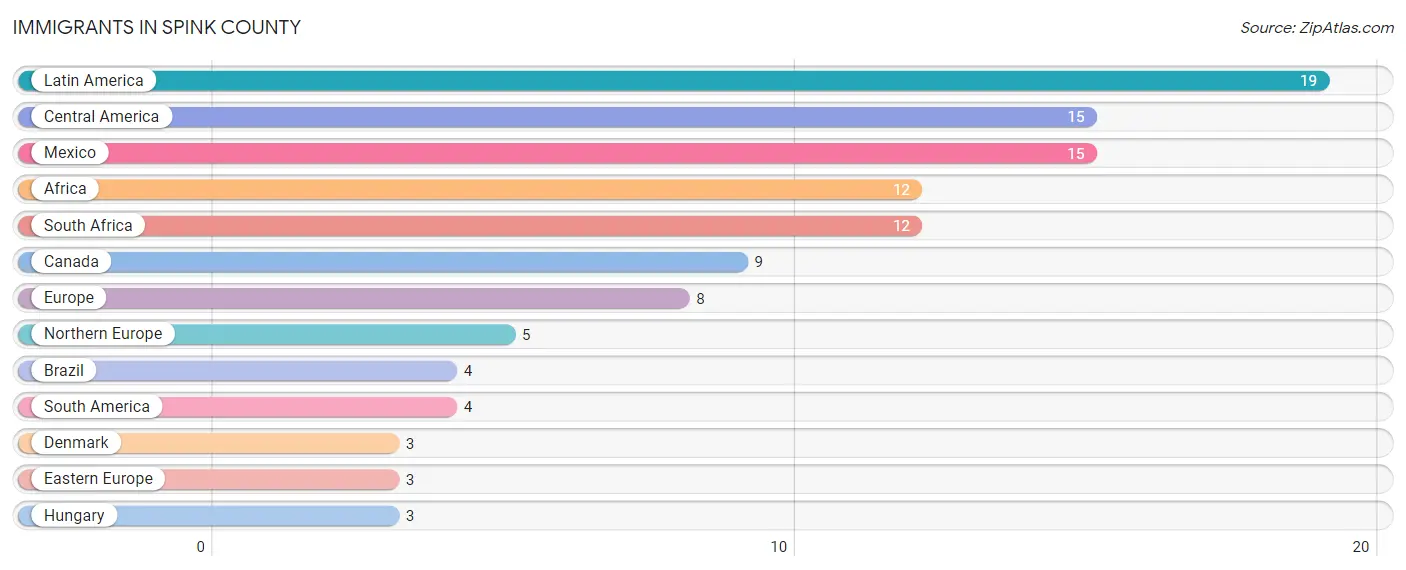
Immigrants in Spink County
The most numerous immigrant groups reported in Spink County came from Latin America (19 | 0.3%), Central America (15 | 0.2%), Mexico (15 | 0.2%), Africa (12 | 0.2%), and South Africa (12 | 0.2%), together accounting for 1.2% of all Spink County residents.
| Immigration Origin | # Population | % Population |
| Africa | 12 | 0.2% |
| Brazil | 4 | 0.1% |
| Canada | 9 | 0.1% |
| Central America | 15 | 0.2% |
| Denmark | 3 | 0.1% |
| Eastern Europe | 3 | 0.1% |
| Europe | 8 | 0.1% |
| Hungary | 3 | 0.1% |
| Latin America | 19 | 0.3% |
| Mexico | 15 | 0.2% |
| Northern Europe | 5 | 0.1% |
| South Africa | 12 | 0.2% |
| South America | 4 | 0.1% | View All 13 Rows |
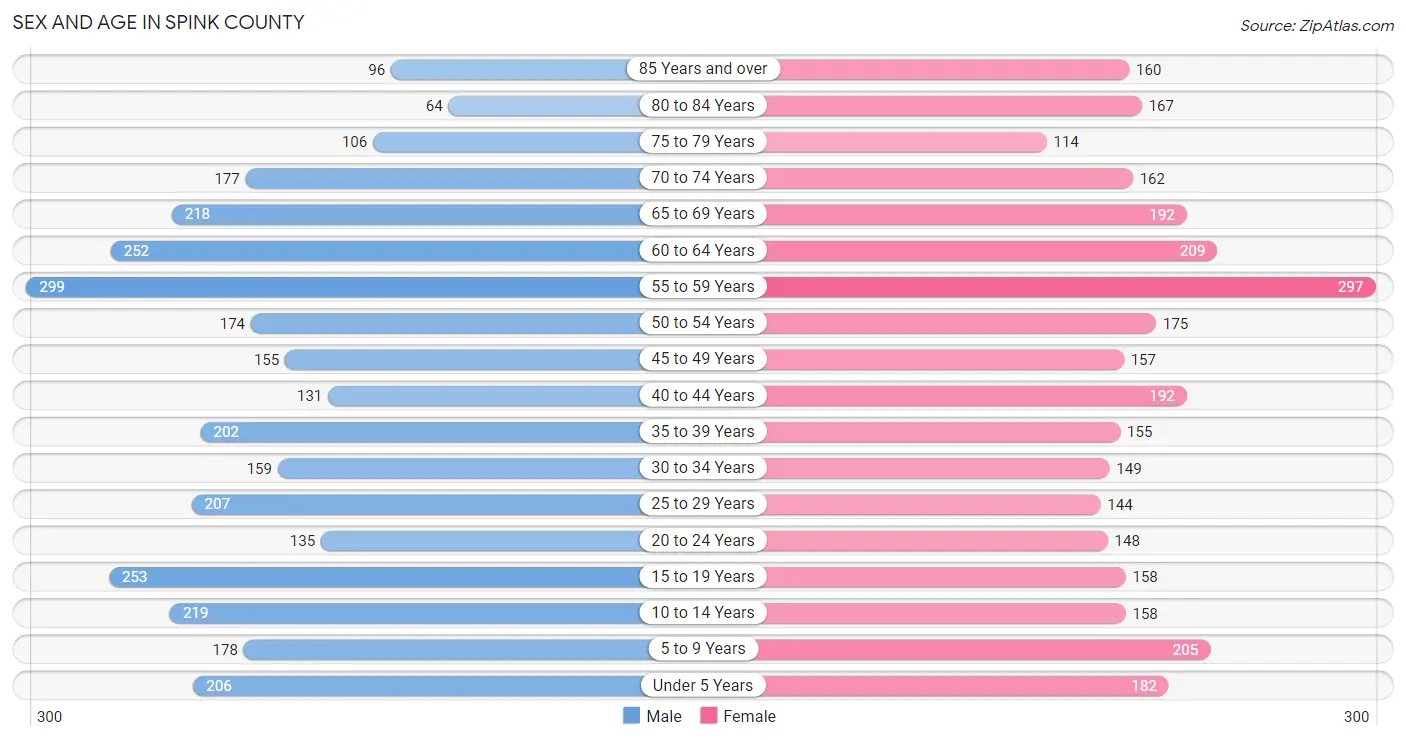
Sex and Age in Spink County
Sex and Age in Spink County
The most populous age groups in Spink County are 55 to 59 Years (299 | 9.2%) for men and 55 to 59 Years (297 | 9.5%) for women.
| Age Bracket | Male | Female |
| Under 5 Years | 206 (6.4%) | 182 (5.8%) |
| 5 to 9 Years | 178 (5.5%) | 205 (6.6%) |
| 10 to 14 Years | 219 (6.8%) | 158 (5.1%) |
| 15 to 19 Years | 253 (7.8%) | 158 (5.1%) |
| 20 to 24 Years | 135 (4.2%) | 148 (4.7%) |
| 25 to 29 Years | 207 (6.4%) | 144 (4.6%) |
| 30 to 34 Years | 159 (4.9%) | 149 (4.8%) |
| 35 to 39 Years | 202 (6.2%) | 155 (5.0%) |
| 40 to 44 Years | 131 (4.1%) | 192 (6.1%) |
| 45 to 49 Years | 155 (4.8%) | 157 (5.0%) |
| 50 to 54 Years | 174 (5.4%) | 175 (5.6%) |
| 55 to 59 Years | 299 (9.2%) | 297 (9.5%) |
| 60 to 64 Years | 252 (7.8%) | 209 (6.7%) |
| 65 to 69 Years | 218 (6.8%) | 192 (6.1%) |
| 70 to 74 Years | 177 (5.5%) | 162 (5.2%) |
| 75 to 79 Years | 106 (3.3%) | 114 (3.6%) |
| 80 to 84 Years | 64 (2.0%) | 167 (5.3%) |
| 85 Years and over | 96 (3.0%) | 160 (5.1%) |
| Total | 3,231 (100.0%) | 3,124 (100.0%) |
Families and Households in Spink County
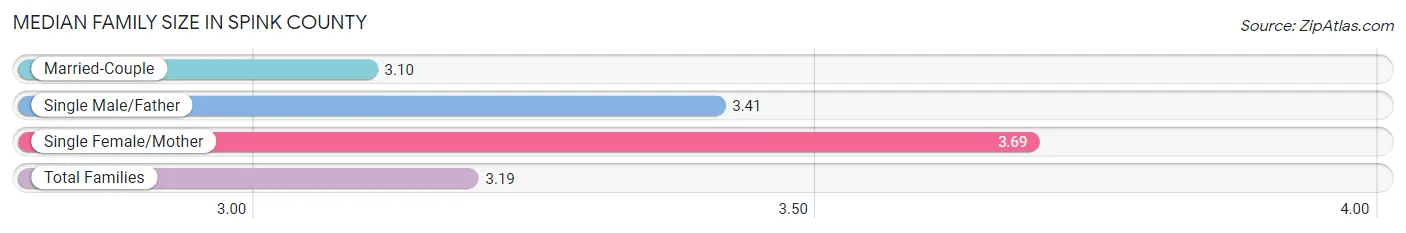
Median Family Size in Spink County
The median family size in Spink County is 3.19 persons per family, with single female/mother families (181 | 11.5%) accounting for the largest median family size of 3.69 persons per family. On the other hand, married-couple families (1,317 | 83.9%) represent the smallest median family size with 3.10 persons per family.
| Family Type | # Families | Family Size |
| Married-Couple | 1,317 (83.9%) | 3.10 |
| Single Male/Father | 71 (4.5%) | 3.41 |
| Single Female/Mother | 181 (11.5%) | 3.69 |
| Total Families | 1,569 (100.0%) | 3.19 |
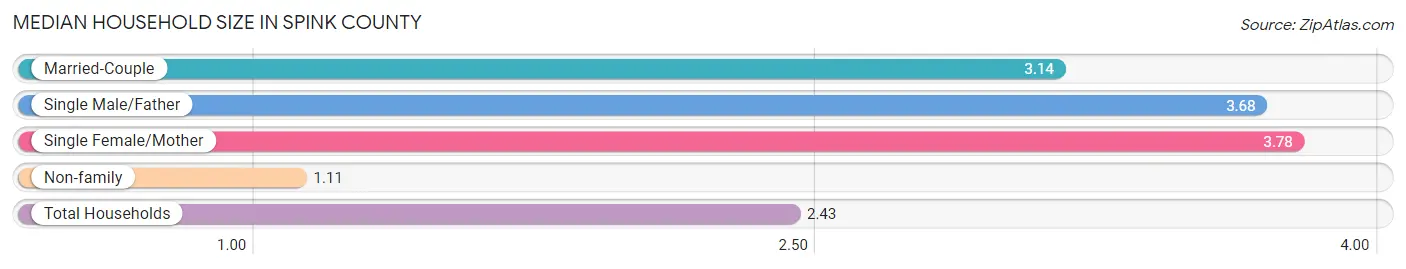
Median Household Size in Spink County
The median household size in Spink County is 2.43 persons per household, with single female/mother households (181 | 7.2%) accounting for the largest median household size of 3.78 persons per household. non-family households (957 | 37.9%) represent the smallest median household size with 1.11 persons per household.
| Household Type | # Households | Household Size |
| Married-Couple | 1,317 (52.1%) | 3.14 |
| Single Male/Father | 71 (2.8%) | 3.68 |
| Single Female/Mother | 181 (7.2%) | 3.78 |
| Non-family | 957 (37.9%) | 1.11 |
| Total Households | 2,526 (100.0%) | 2.43 |
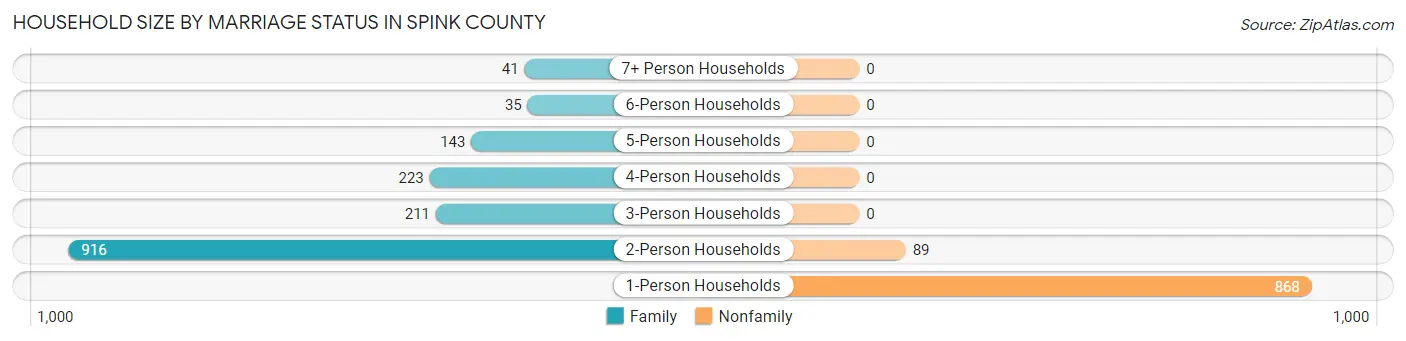
Household Size by Marriage Status in Spink County
Out of a total of 2,526 households in Spink County, 1,569 (62.1%) are family households, while 957 (37.9%) are nonfamily households. The most numerous type of family households are 2-person households, comprising 916, and the most common type of nonfamily households are 1-person households, comprising 868.
| Household Size | Family Households | Nonfamily Households |
| 1-Person Households | - | 868 (34.4%) |
| 2-Person Households | 916 (36.3%) | 89 (3.5%) |
| 3-Person Households | 211 (8.4%) | 0 (0.0%) |
| 4-Person Households | 223 (8.8%) | 0 (0.0%) |
| 5-Person Households | 143 (5.7%) | 0 (0.0%) |
| 6-Person Households | 35 (1.4%) | 0 (0.0%) |
| 7+ Person Households | 41 (1.6%) | 0 (0.0%) |
| Total | 1,569 (62.1%) | 957 (37.9%) |
Female Fertility in Spink County
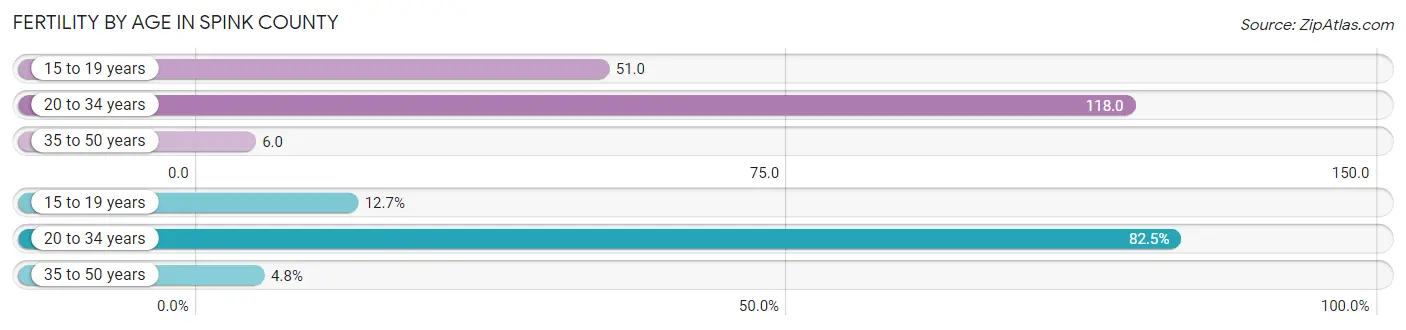
Fertility by Age in Spink County
Average fertility rate in Spink County is 56.0 births per 1,000 women. Women in the age bracket of 20 to 34 years have the highest fertility rate with 118.0 births per 1,000 women. Women in the age bracket of 20 to 34 years acount for 82.5% of all women with births.
| Age Bracket | Women with Births | Births / 1,000 Women |
| 15 to 19 years | 8 (12.7%) | 51.0 |
| 20 to 34 years | 52 (82.5%) | 118.0 |
| 35 to 50 years | 3 (4.8%) | 6.0 |
| Total | 63 (100.0%) | 56.0 |
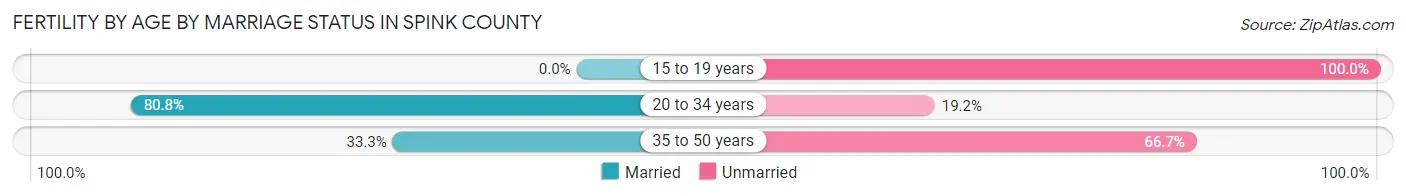
Fertility by Age by Marriage Status in Spink County
68.3% of women with births (63) in Spink County are married. The highest percentage of unmarried women with births falls into 15 to 19 years age bracket with 100.0% of them unmarried at the time of birth, while the lowest percentage of unmarried women with births belong to 20 to 34 years age bracket with 19.2% of them unmarried.
| Age Bracket | Married | Unmarried |
| 15 to 19 years | 0 (0.0%) | 8 (100.0%) |
| 20 to 34 years | 42 (80.8%) | 10 (19.2%) |
| 35 to 50 years | 1 (33.3%) | 2 (66.7%) |
| Total | 43 (68.2%) | 20 (31.8%) |
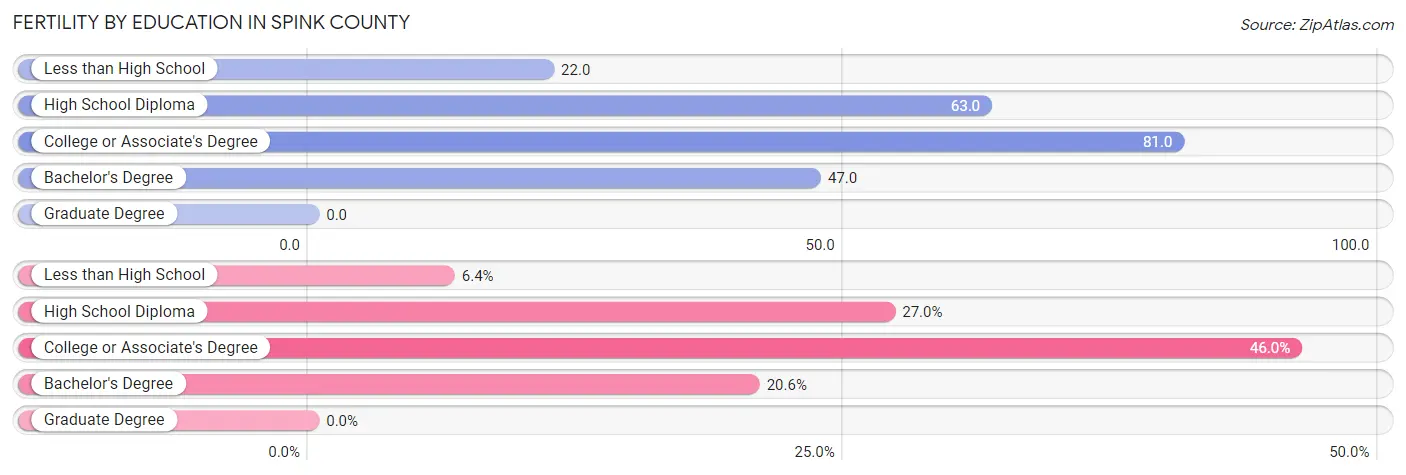
Fertility by Education in Spink County
| Educational Attainment | Women with Births | Births / 1,000 Women |
| Less than High School | 4 (6.4%) | 22.0 |
| High School Diploma | 17 (27.0%) | 63.0 |
| College or Associate's Degree | 29 (46.0%) | 81.0 |
| Bachelor's Degree | 13 (20.6%) | 47.0 |
| Graduate Degree | 0 (0.0%) | 0.0 |
| Total | 63 (100.0%) | 56.0 |
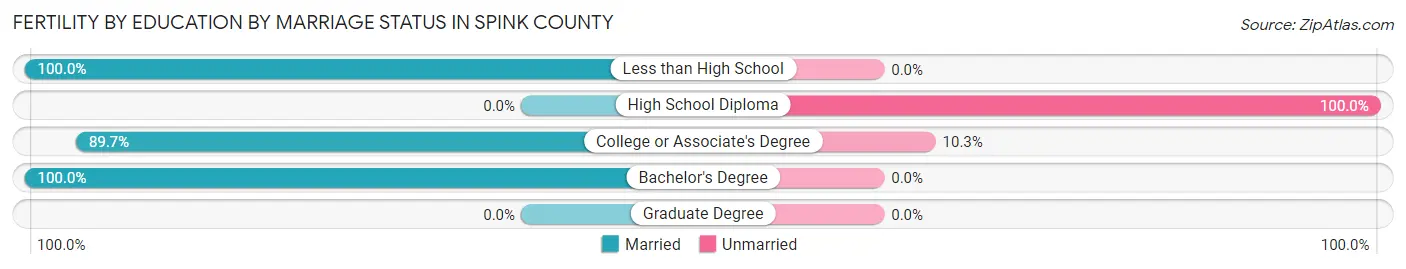
Fertility by Education by Marriage Status in Spink County
31.8% of women with births in Spink County are unmarried. Women with the educational attainment of less than high school are most likely to be married with 100.0% of them married at childbirth, while women with the educational attainment of high school diploma are least likely to be married with 100.0% of them unmarried at childbirth.
| Educational Attainment | Married | Unmarried |
| Less than High School | 4 (100.0%) | 0 (0.0%) |
| High School Diploma | 0 (0.0%) | 17 (100.0%) |
| College or Associate's Degree | 26 (89.7%) | 3 (10.3%) |
| Bachelor's Degree | 13 (100.0%) | 0 (0.0%) |
| Graduate Degree | 0 (0.0%) | 0 (0.0%) |
| Total | 43 (68.2%) | 20 (31.8%) |
Income in Spink County
Income Overview in Spink County
Per Capita Income in Spink County is $37,138, while median incomes of families and households are $89,952 and $65,795 respectively.
| Characteristic | Number | Measure |
| Per Capita Income | 6,355 | $37,138 |
| Median Family Income | 1,569 | $89,952 |
| Mean Family Income | 1,569 | $112,508 |
| Median Household Income | 2,526 | $65,795 |
| Mean Household Income | 2,526 | $90,232 |
| Income Deficit | 1,569 | $11,768 |
| Wage / Income Gap (%) | 6,355 | 29.41% |
| Wage / Income Gap ($) | 6,355 | 70.59¢ per $1 |
| Gini / Inequality Index | 6,355 | 0.46 |
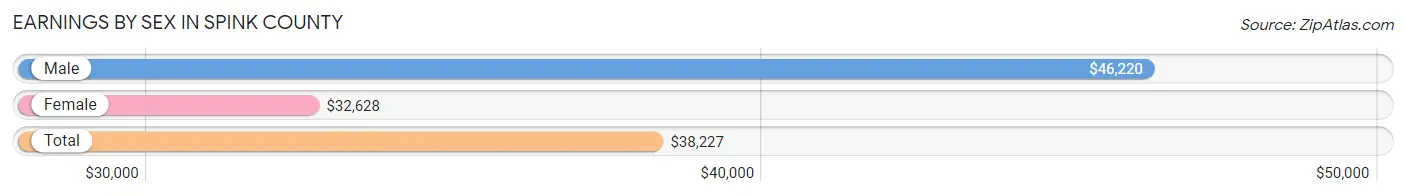
Earnings by Sex in Spink County
Average Earnings in Spink County are $38,227, $46,220 for men and $32,628 for women, a difference of 29.4%.
| Sex | Number | Average Earnings |
| Male | 1,825 (53.3%) | $46,220 |
| Female | 1,601 (46.7%) | $32,628 |
| Total | 3,426 (100.0%) | $38,227 |
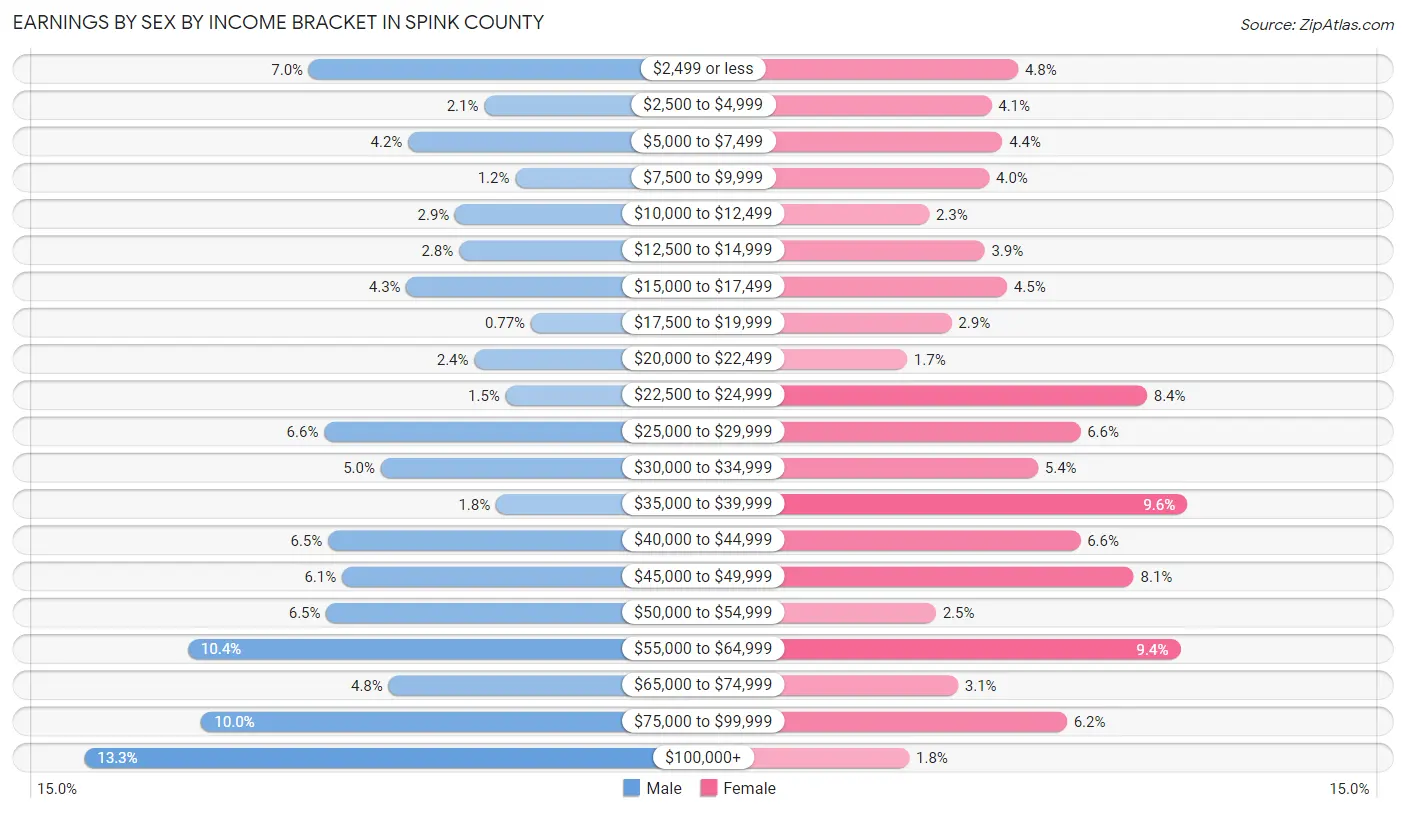
Earnings by Sex by Income Bracket in Spink County
The most common earnings brackets in Spink County are $100,000+ for men (243 | 13.3%) and $35,000 to $39,999 for women (153 | 9.6%).
| Income | Male | Female |
| $2,499 or less | 128 (7.0%) | 77 (4.8%) |
| $2,500 to $4,999 | 38 (2.1%) | 65 (4.1%) |
| $5,000 to $7,499 | 77 (4.2%) | 70 (4.4%) |
| $7,500 to $9,999 | 22 (1.2%) | 64 (4.0%) |
| $10,000 to $12,499 | 53 (2.9%) | 37 (2.3%) |
| $12,500 to $14,999 | 51 (2.8%) | 62 (3.9%) |
| $15,000 to $17,499 | 78 (4.3%) | 72 (4.5%) |
| $17,500 to $19,999 | 14 (0.8%) | 47 (2.9%) |
| $20,000 to $22,499 | 43 (2.4%) | 27 (1.7%) |
| $22,500 to $24,999 | 27 (1.5%) | 135 (8.4%) |
| $25,000 to $29,999 | 120 (6.6%) | 105 (6.6%) |
| $30,000 to $34,999 | 91 (5.0%) | 86 (5.4%) |
| $35,000 to $39,999 | 32 (1.8%) | 153 (9.6%) |
| $40,000 to $44,999 | 118 (6.5%) | 105 (6.6%) |
| $45,000 to $49,999 | 111 (6.1%) | 129 (8.1%) |
| $50,000 to $54,999 | 119 (6.5%) | 40 (2.5%) |
| $55,000 to $64,999 | 190 (10.4%) | 150 (9.4%) |
| $65,000 to $74,999 | 87 (4.8%) | 50 (3.1%) |
| $75,000 to $99,999 | 183 (10.0%) | 99 (6.2%) |
| $100,000+ | 243 (13.3%) | 28 (1.8%) |
| Total | 1,825 (100.0%) | 1,601 (100.0%) |
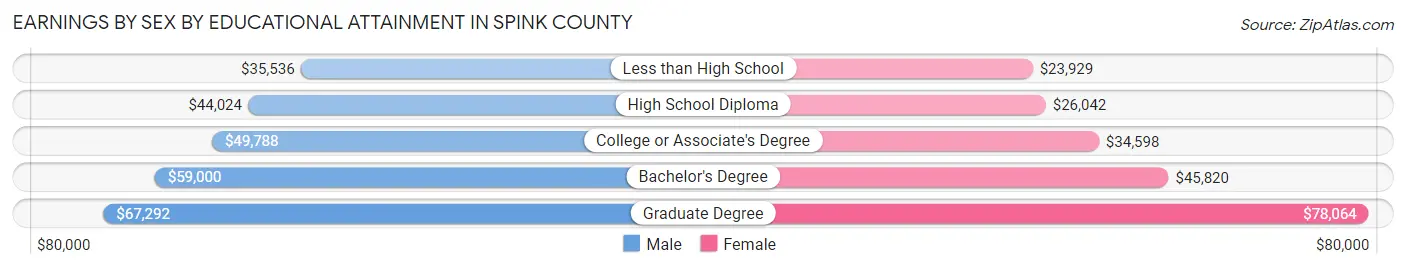
Earnings by Sex by Educational Attainment in Spink County
Average earnings in Spink County are $50,827 for men and $35,530 for women, a difference of 30.1%. Men with an educational attainment of graduate degree enjoy the highest average annual earnings of $67,292, while those with less than high school education earn the least with $35,536. Women with an educational attainment of graduate degree earn the most with the average annual earnings of $78,064, while those with less than high school education have the smallest earnings of $23,929.
| Educational Attainment | Male Income | Female Income |
| Less than High School | $35,536 | $23,929 |
| High School Diploma | $44,024 | $26,042 |
| College or Associate's Degree | $49,788 | $34,598 |
| Bachelor's Degree | $59,000 | $45,820 |
| Graduate Degree | $67,292 | $78,064 |
| Total | $50,827 | $35,530 |
Family Income in Spink County
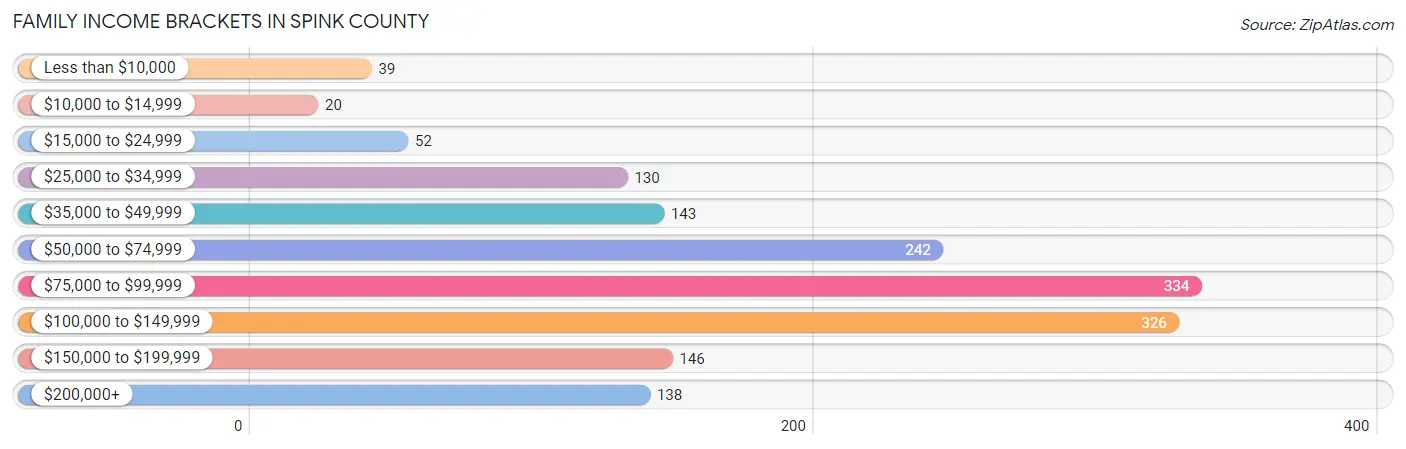
Family Income Brackets in Spink County
According to the Spink County family income data, there are 334 families falling into the $75,000 to $99,999 income range, which is the most common income bracket and makes up 21.3% of all families. Conversely, the $10,000 to $14,999 income bracket is the least frequent group with only 20 families (1.3%) belonging to this category.
| Income Bracket | # Families | % Families |
| Less than $10,000 | 39 | 2.5% |
| $10,000 to $14,999 | 20 | 1.3% |
| $15,000 to $24,999 | 52 | 3.3% |
| $25,000 to $34,999 | 130 | 8.3% |
| $35,000 to $49,999 | 143 | 9.1% |
| $50,000 to $74,999 | 242 | 15.4% |
| $75,000 to $99,999 | 334 | 21.3% |
| $100,000 to $149,999 | 326 | 20.8% |
| $150,000 to $199,999 | 146 | 9.3% |
| $200,000+ | 138 | 8.8% |
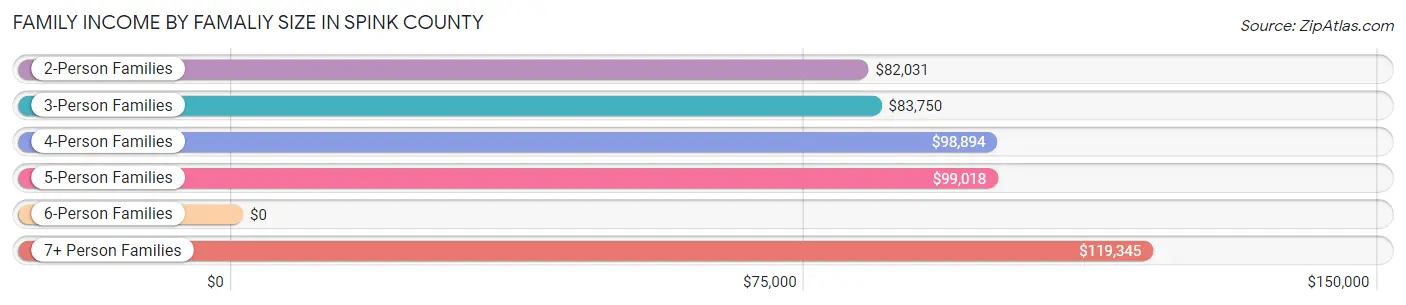
Family Income by Famaliy Size in Spink County
7+ person families (41 | 2.6%) account for the highest median family income in Spink County with $119,345 per family, while 2-person families (938 | 59.8%) have the highest median income of $41,016 per family member.
| Income Bracket | # Families | Median Income |
| 2-Person Families | 938 (59.8%) | $82,031 |
| 3-Person Families | 201 (12.8%) | $83,750 |
| 4-Person Families | 221 (14.1%) | $98,894 |
| 5-Person Families | 133 (8.5%) | $99,018 |
| 6-Person Families | 35 (2.2%) | $0 |
| 7+ Person Families | 41 (2.6%) | $119,345 |
| Total | 1,569 (100.0%) | $89,952 |
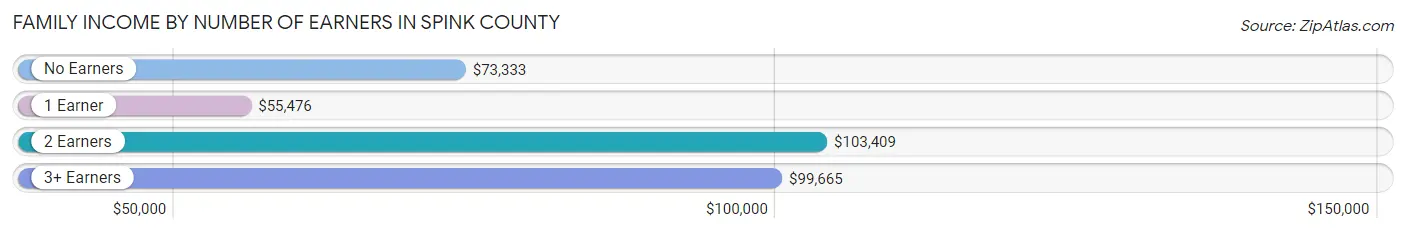
Family Income by Number of Earners in Spink County
The median family income in Spink County is $89,952, with families comprising 2 earners (740) having the highest median family income of $103,409, while families with 1 earner (372) have the lowest median family income of $55,476, accounting for 47.2% and 23.7% of families, respectively.
| Number of Earners | # Families | Median Income |
| No Earners | 258 (16.4%) | $73,333 |
| 1 Earner | 372 (23.7%) | $55,476 |
| 2 Earners | 740 (47.2%) | $103,409 |
| 3+ Earners | 199 (12.7%) | $99,665 |
| Total | 1,569 (100.0%) | $89,952 |
Household Income in Spink County
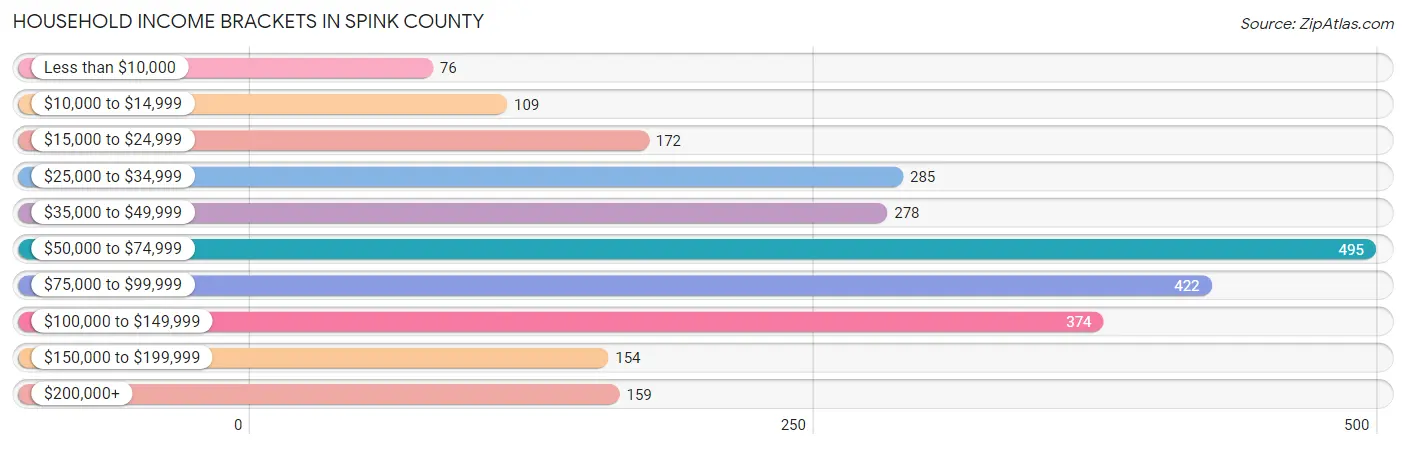
Household Income Brackets in Spink County
With 495 households falling in the category, the $50,000 to $74,999 income range is the most frequent in Spink County, accounting for 19.6% of all households. In contrast, only 76 households (3.0%) fall into the less than $10,000 income bracket, making it the least populous group.
| Income Bracket | # Households | % Households |
| Less than $10,000 | 76 | 3.0% |
| $10,000 to $14,999 | 109 | 4.3% |
| $15,000 to $24,999 | 172 | 6.8% |
| $25,000 to $34,999 | 285 | 11.3% |
| $35,000 to $49,999 | 278 | 11.0% |
| $50,000 to $74,999 | 495 | 19.6% |
| $75,000 to $99,999 | 422 | 16.7% |
| $100,000 to $149,999 | 374 | 14.8% |
| $150,000 to $199,999 | 154 | 6.1% |
| $200,000+ | 159 | 6.3% |
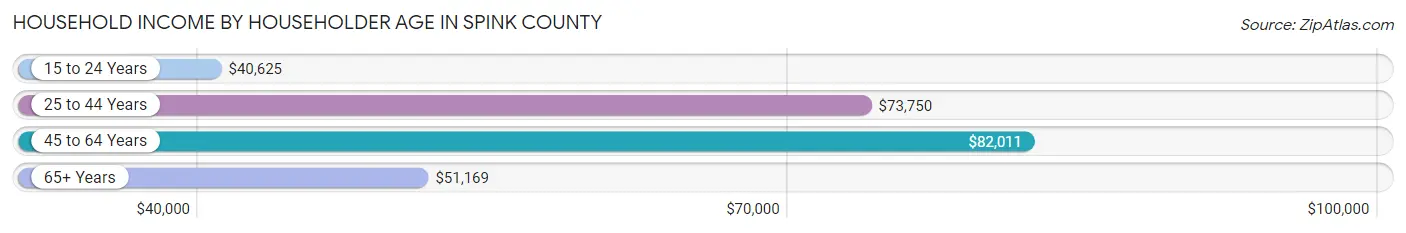
Household Income by Householder Age in Spink County
The median household income in Spink County is $65,795, with the highest median household income of $82,011 found in the 45 to 64 years age bracket for the primary householder. A total of 953 households (37.7%) fall into this category. Meanwhile, the 15 to 24 years age bracket for the primary householder has the lowest median household income of $40,625, with 58 households (2.3%) in this group.
| Income Bracket | # Households | Median Income |
| 15 to 24 Years | 58 (2.3%) | $40,625 |
| 25 to 44 Years | 618 (24.5%) | $73,750 |
| 45 to 64 Years | 953 (37.7%) | $82,011 |
| 65+ Years | 897 (35.5%) | $51,169 |
| Total | 2,526 (100.0%) | $65,795 |
Poverty in Spink County
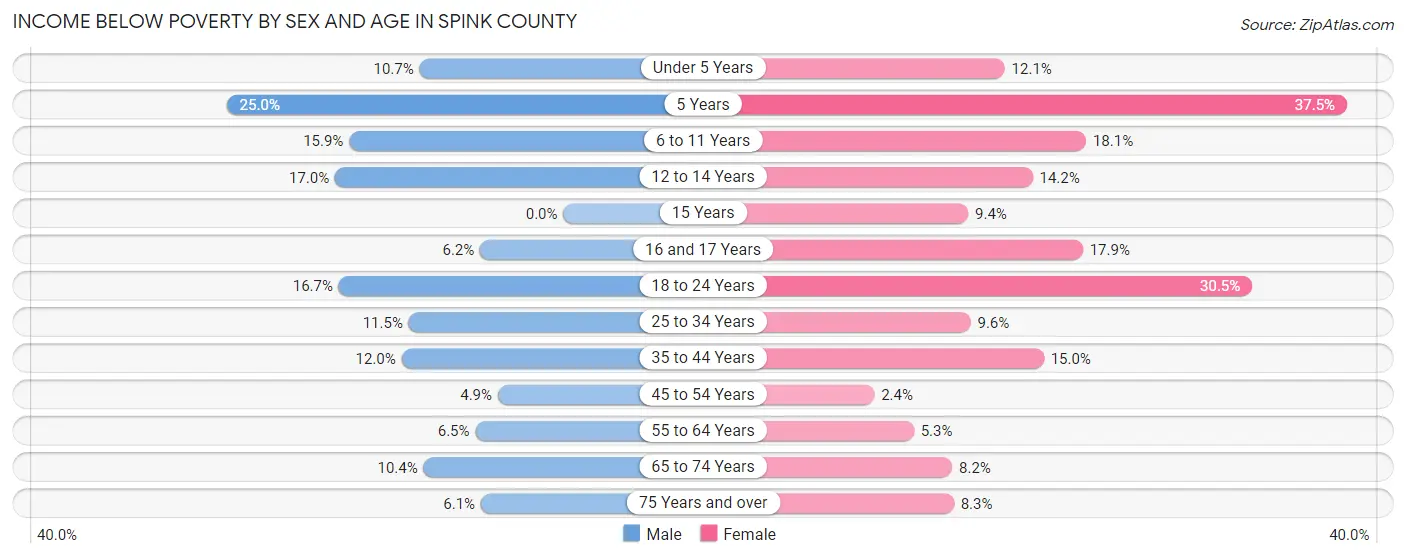
Income Below Poverty by Sex and Age in Spink County
With 10.1% poverty level for males and 11.2% for females among the residents of Spink County, 5 year old males and 5 year old females are the most vulnerable to poverty, with 8 males (25.0%) and 24 females (37.5%) in their respective age groups living below the poverty level.
| Age Bracket | Male | Female |
| Under 5 Years | 22 (10.7%) | 22 (12.1%) |
| 5 Years | 8 (25.0%) | 24 (37.5%) |
| 6 to 11 Years | 38 (15.9%) | 33 (18.1%) |
| 12 to 14 Years | 20 (17.0%) | 16 (14.2%) |
| 15 Years | 0 (0.0%) | 3 (9.4%) |
| 16 and 17 Years | 11 (6.2%) | 17 (17.9%) |
| 18 to 24 Years | 31 (16.7%) | 53 (30.5%) |
| 25 to 34 Years | 42 (11.5%) | 28 (9.6%) |
| 35 to 44 Years | 40 (12.0%) | 52 (15.0%) |
| 45 to 54 Years | 16 (4.9%) | 8 (2.4%) |
| 55 to 64 Years | 36 (6.5%) | 27 (5.3%) |
| 65 to 74 Years | 41 (10.4%) | 29 (8.2%) |
| 75 Years and over | 12 (6.1%) | 34 (8.3%) |
| Total | 317 (10.1%) | 346 (11.2%) |
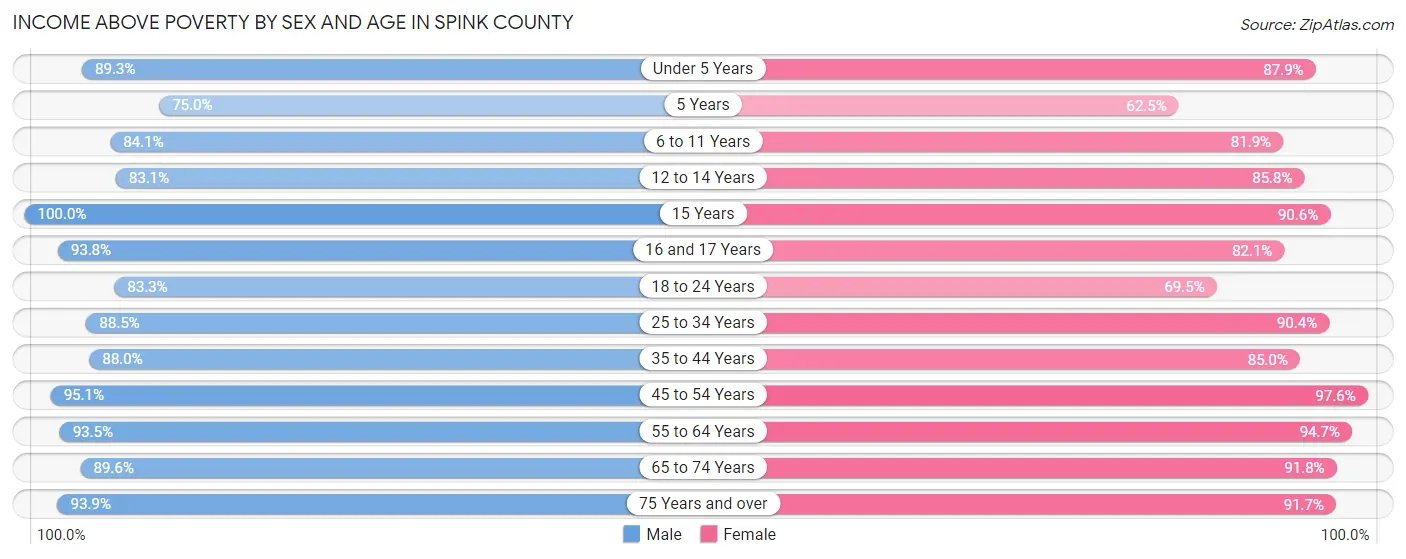
Income Above Poverty by Sex and Age in Spink County
According to the poverty statistics in Spink County, males aged 15 years and females aged 45 to 54 years are the age groups that are most secure financially, with 100.0% of males and 97.6% of females in these age groups living above the poverty line.
| Age Bracket | Male | Female |
| Under 5 Years | 184 (89.3%) | 160 (87.9%) |
| 5 Years | 24 (75.0%) | 40 (62.5%) |
| 6 to 11 Years | 201 (84.1%) | 149 (81.9%) |
| 12 to 14 Years | 98 (83.1%) | 97 (85.8%) |
| 15 Years | 23 (100.0%) | 29 (90.6%) |
| 16 and 17 Years | 167 (93.8%) | 78 (82.1%) |
| 18 to 24 Years | 155 (83.3%) | 121 (69.5%) |
| 25 to 34 Years | 324 (88.5%) | 265 (90.4%) |
| 35 to 44 Years | 293 (88.0%) | 295 (85.0%) |
| 45 to 54 Years | 313 (95.1%) | 324 (97.6%) |
| 55 to 64 Years | 515 (93.5%) | 479 (94.7%) |
| 65 to 74 Years | 354 (89.6%) | 325 (91.8%) |
| 75 Years and over | 184 (93.9%) | 375 (91.7%) |
| Total | 2,835 (89.9%) | 2,737 (88.8%) |
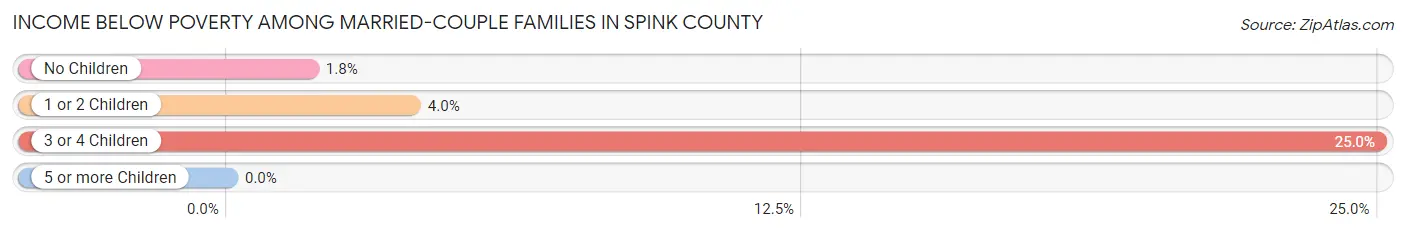
Income Below Poverty Among Married-Couple Families in Spink County
The poverty statistics for married-couple families in Spink County show that 4.3% or 56 of the total 1,317 families live below the poverty line. Families with 3 or 4 children have the highest poverty rate of 25.0%, comprising of 28 families. On the other hand, families with 5 or more children have the lowest poverty rate of 0.0%, which includes 0 families.
| Children | Above Poverty | Below Poverty |
| No Children | 837 (98.2%) | 15 (1.8%) |
| 1 or 2 Children | 314 (96.0%) | 13 (4.0%) |
| 3 or 4 Children | 84 (75.0%) | 28 (25.0%) |
| 5 or more Children | 26 (100.0%) | 0 (0.0%) |
| Total | 1,261 (95.8%) | 56 (4.3%) |
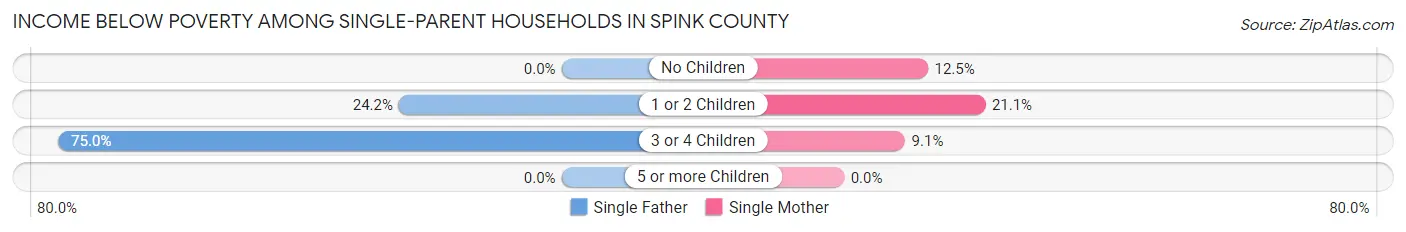
Income Below Poverty Among Single-Parent Households in Spink County
According to the poverty data in Spink County, 15.5% or 11 single-father households and 17.7% or 32 single-mother households are living below the poverty line. Among single-father households, those with 3 or 4 children have the highest poverty rate, with 3 households (75.0%) experiencing poverty. Likewise, among single-mother households, those with 1 or 2 children have the highest poverty rate, with 24 households (21.0%) falling below the poverty line.
| Children | Single Father | Single Mother |
| No Children | 0 (0.0%) | 7 (12.5%) |
| 1 or 2 Children | 8 (24.2%) | 24 (21.0%) |
| 3 or 4 Children | 3 (75.0%) | 1 (9.1%) |
| 5 or more Children | 0 (0.0%) | 0 (0.0%) |
| Total | 11 (15.5%) | 32 (17.7%) |
Income Below Poverty Among Married-Couple vs Single-Parent Households in Spink County
The poverty data for Spink County shows that 56 of the married-couple family households (4.3%) and 43 of the single-parent households (17.1%) are living below the poverty level. Within the married-couple family households, those with 3 or 4 children have the highest poverty rate, with 28 households (25.0%) falling below the poverty line. Among the single-parent households, those with 3 or 4 children have the highest poverty rate, with 4 household (26.7%) living below poverty.
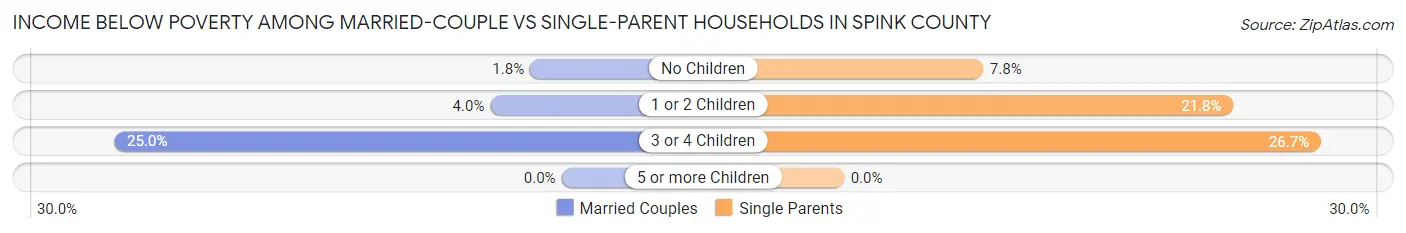
| Children | Married-Couple Families | Single-Parent Households |
| No Children | 15 (1.8%) | 7 (7.8%) |
| 1 or 2 Children | 13 (4.0%) | 32 (21.8%) |
| 3 or 4 Children | 28 (25.0%) | 4 (26.7%) |
| 5 or more Children | 0 (0.0%) | 0 (0.0%) |
| Total | 56 (4.3%) | 43 (17.1%) |
Employment Characteristics in Spink County
Employment by Class of Employer in Spink County
Among the 2,939 employed individuals in Spink County, private company employees (1,380 | 46.9%), self-employed (not incorporated) (424 | 14.4%), and local government employees (309 | 10.5%) make up the most common classes of employment.
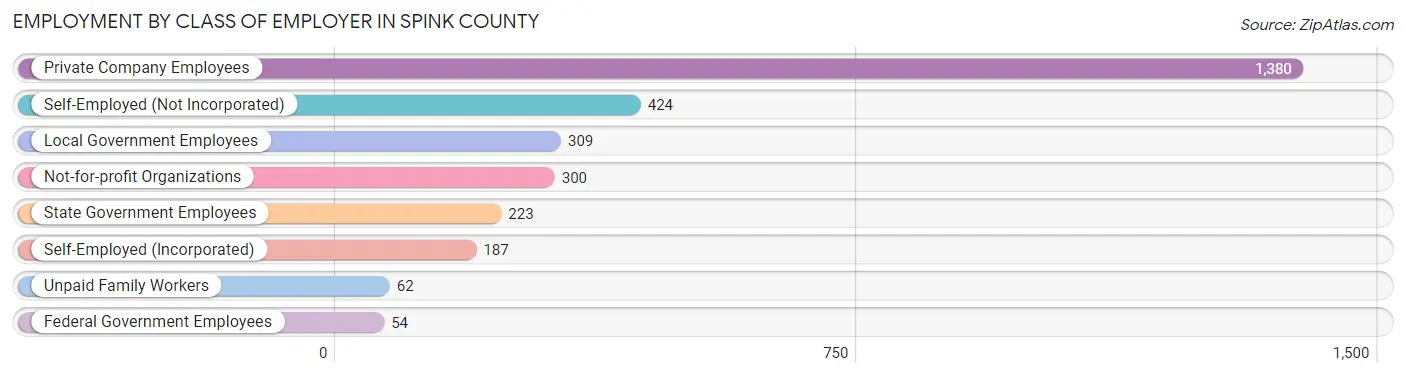
| Employer Class | # Employees | % Employees |
| Private Company Employees | 1,380 | 46.9% |
| Self-Employed (Incorporated) | 187 | 6.4% |
| Self-Employed (Not Incorporated) | 424 | 14.4% |
| Not-for-profit Organizations | 300 | 10.2% |
| Local Government Employees | 309 | 10.5% |
| State Government Employees | 223 | 7.6% |
| Federal Government Employees | 54 | 1.8% |
| Unpaid Family Workers | 62 | 2.1% |
| Total | 2,939 | 100.0% |
Employment Status by Age in Spink County
According to the labor force statistics for Spink County, out of the total population over 16 years of age (5,152), 59.1% or 3,045 individuals are in the labor force, with 1.6% or 49 of them unemployed. The age group with the highest labor force participation rate is 45 to 54 years, with 90.0% or 595 individuals in the labor force. Within the labor force, the 16 to 19 years age range has the highest percentage of unemployed individuals, with 11.6% or 13 of them being unemployed.
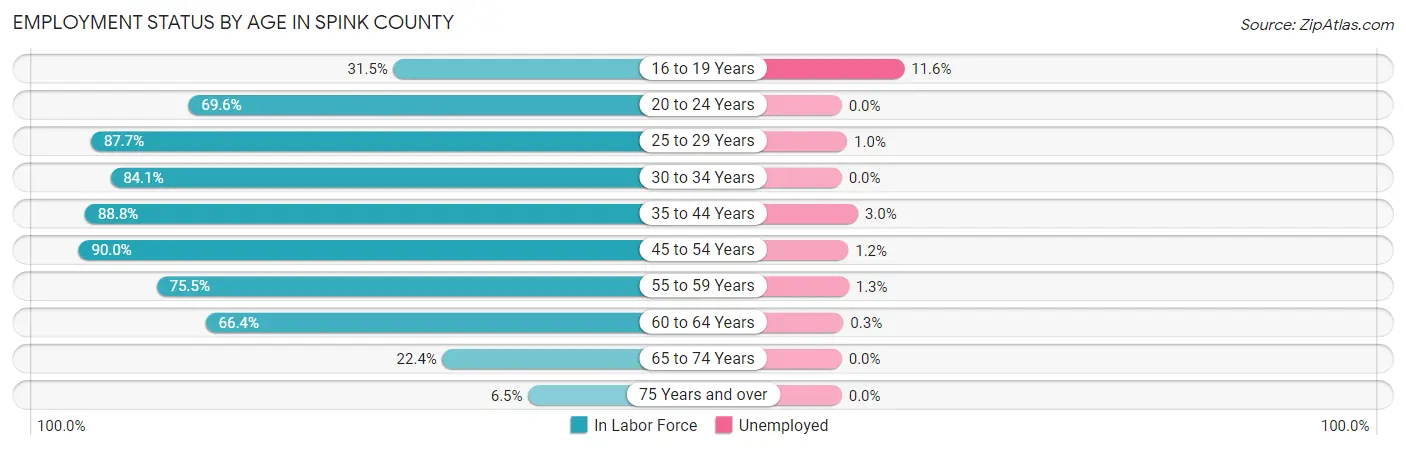
| Age Bracket | In Labor Force | Unemployed |
| 16 to 19 Years | 112 (31.5%) | 13 (11.6%) |
| 20 to 24 Years | 197 (69.6%) | 0 (0.0%) |
| 25 to 29 Years | 308 (87.7%) | 3 (1.0%) |
| 30 to 34 Years | 259 (84.1%) | 0 (0.0%) |
| 35 to 44 Years | 604 (88.8%) | 18 (3.0%) |
| 45 to 54 Years | 595 (90.0%) | 7 (1.2%) |
| 55 to 59 Years | 450 (75.5%) | 6 (1.3%) |
| 60 to 64 Years | 306 (66.4%) | 1 (0.3%) |
| 65 to 74 Years | 168 (22.4%) | 0 (0.0%) |
| 75 Years and over | 46 (6.5%) | 0 (0.0%) |
| Total | 3,045 (59.1%) | 49 (1.6%) |
Employment Status by Educational Attainment in Spink County
According to labor force statistics for Spink County, 82.5% of individuals (2,522) out of the total population between 25 and 64 years of age (3,057) are in the labor force, with 1.4% or 35 of them being unemployed. The group with the highest labor force participation rate are those with the educational attainment of bachelor's degree or higher, with 84.6% or 733 individuals in the labor force. Within the labor force, individuals with high school diploma education have the highest percentage of unemployment, with 3.8% or 29 of them being unemployed.
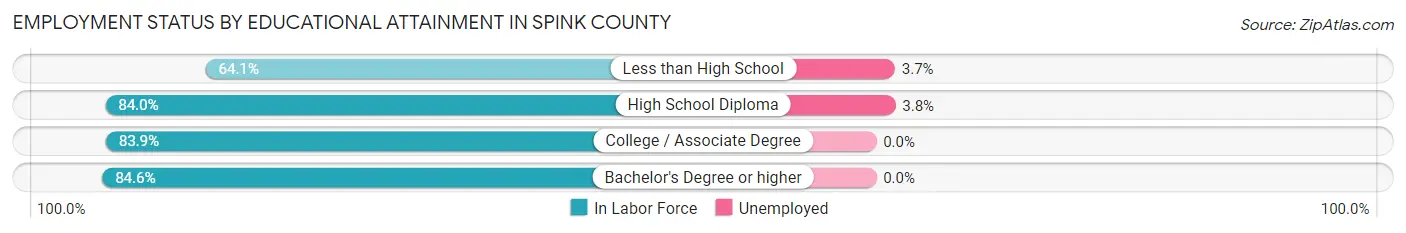
| Educational Attainment | In Labor Force | Unemployed |
| Less than High School | 161 (64.1%) | 9 (3.7%) |
| High School Diploma | 760 (84.0%) | 34 (3.8%) |
| College / Associate Degree | 868 (83.9%) | 0 (0.0%) |
| Bachelor's Degree or higher | 733 (84.6%) | 0 (0.0%) |
| Total | 2,522 (82.5%) | 43 (1.4%) |
Employment Occupations by Sex in Spink County
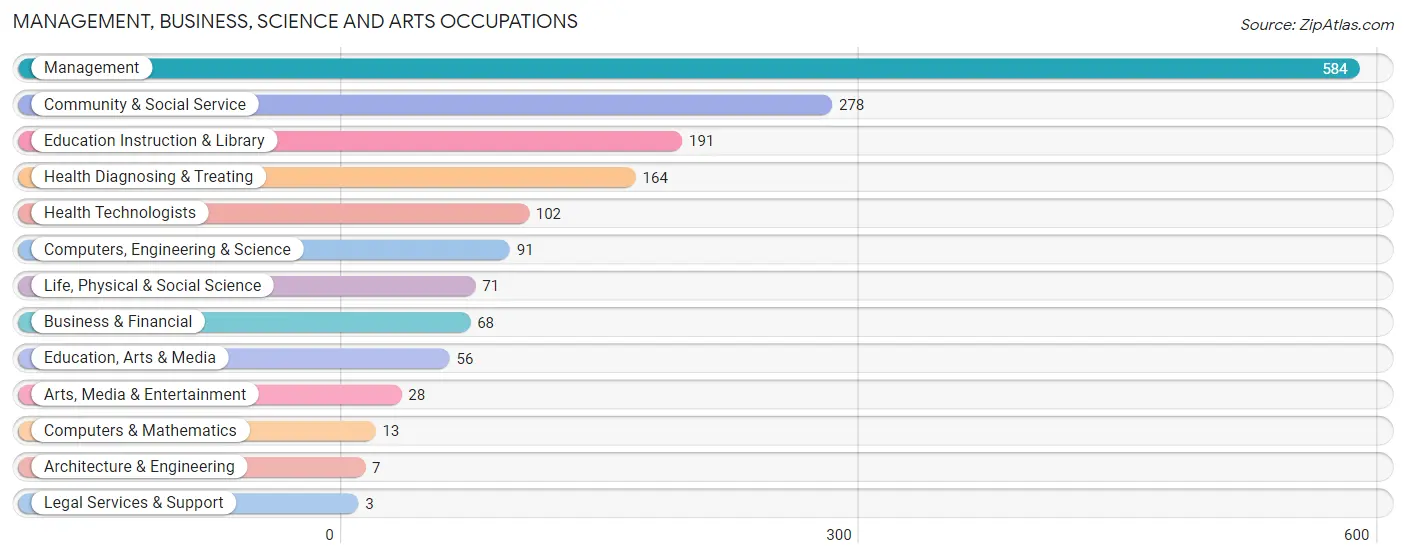
Management, Business, Science and Arts Occupations
The most common Management, Business, Science and Arts occupations in Spink County are Management (584 | 19.5%), Community & Social Service (278 | 9.3%), Education Instruction & Library (191 | 6.4%), Health Diagnosing & Treating (164 | 5.5%), and Health Technologists (102 | 3.4%).
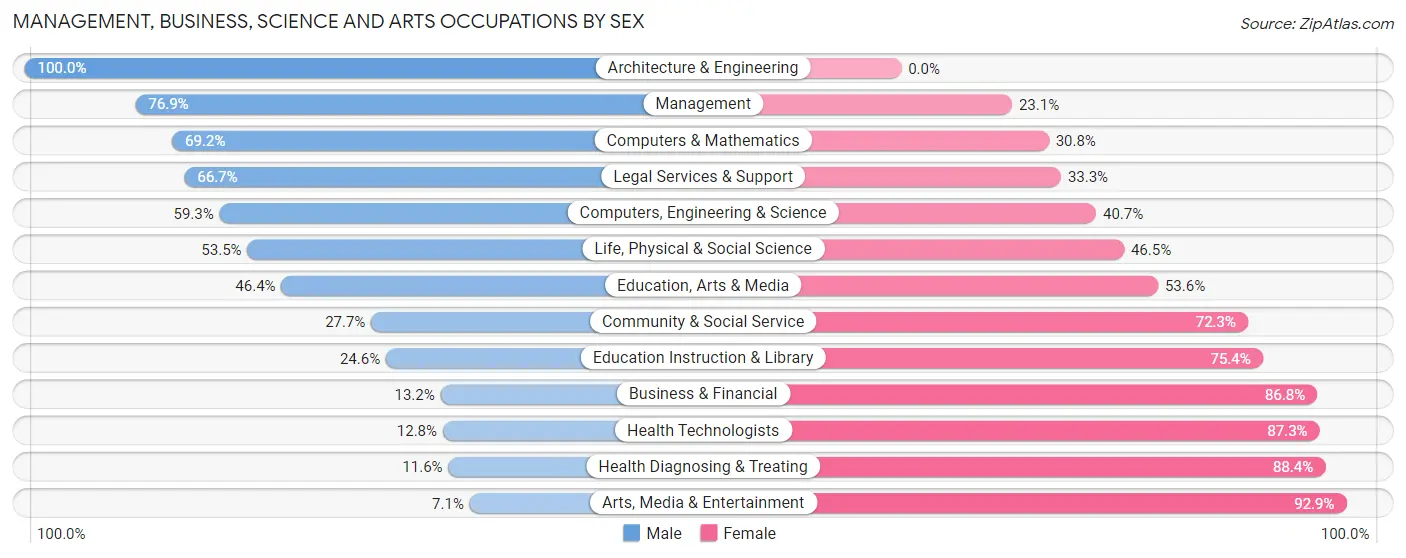
Management, Business, Science and Arts Occupations by Sex
Within the Management, Business, Science and Arts occupations in Spink County, the most male-oriented occupations are Architecture & Engineering (100.0%), Management (76.9%), and Computers & Mathematics (69.2%), while the most female-oriented occupations are Arts, Media & Entertainment (92.9%), Health Diagnosing & Treating (88.4%), and Health Technologists (87.3%).
| Occupation | Male | Female |
| Management | 449 (76.9%) | 135 (23.1%) |
| Business & Financial | 9 (13.2%) | 59 (86.8%) |
| Computers, Engineering & Science | 54 (59.3%) | 37 (40.7%) |
| Computers & Mathematics | 9 (69.2%) | 4 (30.8%) |
| Architecture & Engineering | 7 (100.0%) | 0 (0.0%) |
| Life, Physical & Social Science | 38 (53.5%) | 33 (46.5%) |
| Community & Social Service | 77 (27.7%) | 201 (72.3%) |
| Education, Arts & Media | 26 (46.4%) | 30 (53.6%) |
| Legal Services & Support | 2 (66.7%) | 1 (33.3%) |
| Education Instruction & Library | 47 (24.6%) | 144 (75.4%) |
| Arts, Media & Entertainment | 2 (7.1%) | 26 (92.9%) |
| Health Diagnosing & Treating | 19 (11.6%) | 145 (88.4%) |
| Health Technologists | 13 (12.8%) | 89 (87.3%) |
| Total (Category) | 608 (51.3%) | 577 (48.7%) |
| Total (Overall) | 1,579 (52.7%) | 1,418 (47.3%) |
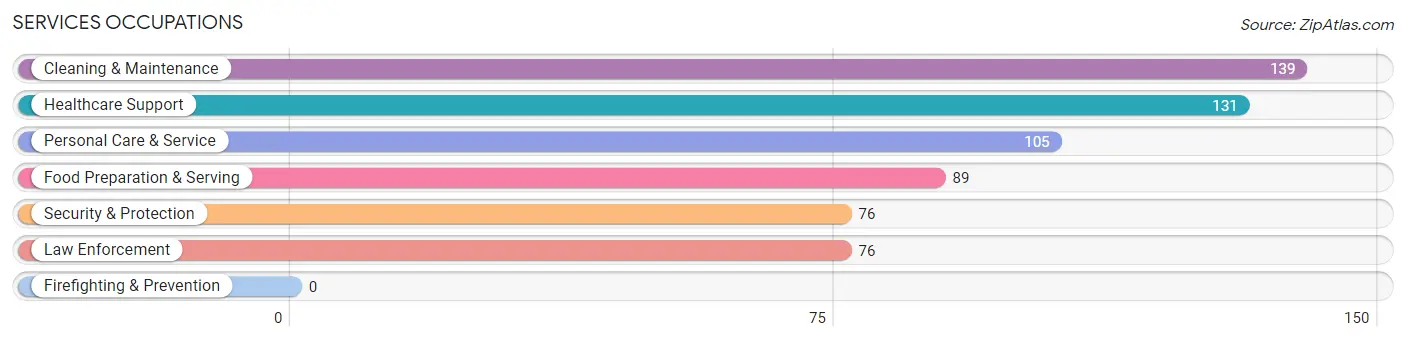
Services Occupations
The most common Services occupations in Spink County are Cleaning & Maintenance (139 | 4.6%), Healthcare Support (131 | 4.4%), Personal Care & Service (105 | 3.5%), Food Preparation & Serving (89 | 3.0%), and Security & Protection (76 | 2.5%).
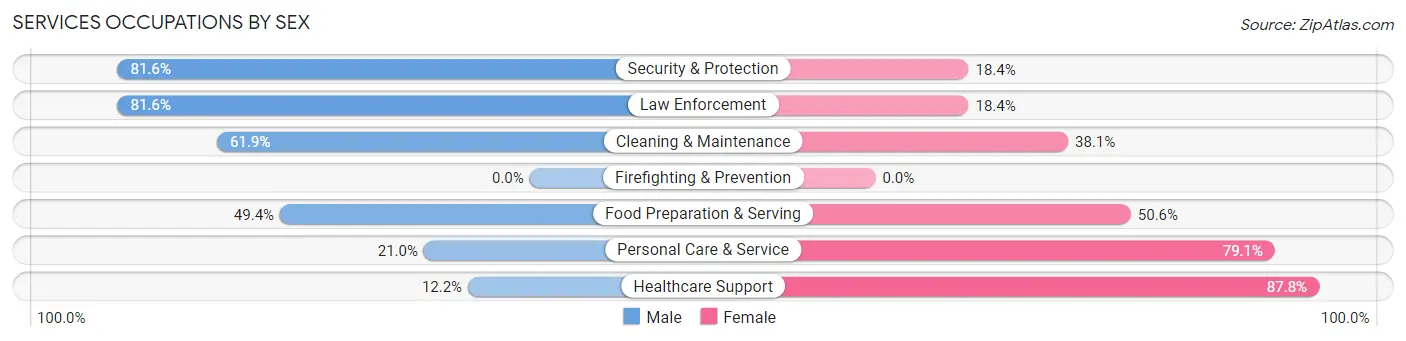
Services Occupations by Sex
Within the Services occupations in Spink County, the most male-oriented occupations are Security & Protection (81.6%), Law Enforcement (81.6%), and Cleaning & Maintenance (61.9%), while the most female-oriented occupations are Healthcare Support (87.8%), Personal Care & Service (79.0%), and Food Preparation & Serving (50.6%).
| Occupation | Male | Female |
| Healthcare Support | 16 (12.2%) | 115 (87.8%) |
| Security & Protection | 62 (81.6%) | 14 (18.4%) |
| Firefighting & Prevention | 0 (0.0%) | 0 (0.0%) |
| Law Enforcement | 62 (81.6%) | 14 (18.4%) |
| Food Preparation & Serving | 44 (49.4%) | 45 (50.6%) |
| Cleaning & Maintenance | 86 (61.9%) | 53 (38.1%) |
| Personal Care & Service | 22 (20.9%) | 83 (79.0%) |
| Total (Category) | 230 (42.6%) | 310 (57.4%) |
| Total (Overall) | 1,579 (52.7%) | 1,418 (47.3%) |
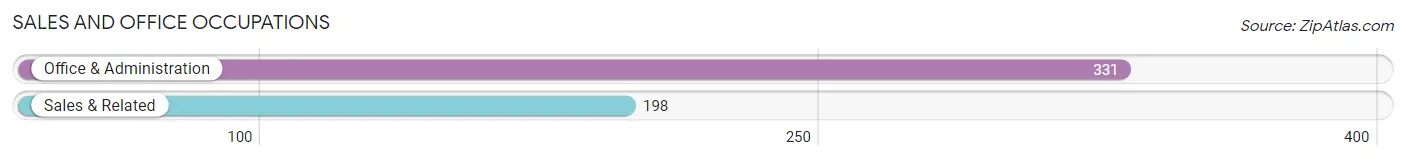
Sales and Office Occupations
The most common Sales and Office occupations in Spink County are Office & Administration (331 | 11.0%), and Sales & Related (198 | 6.6%).
Sales and Office Occupations by Sex
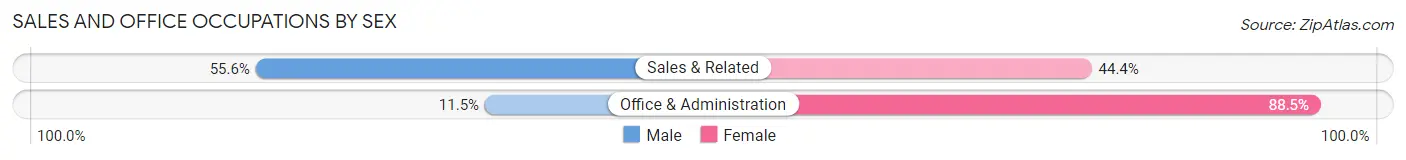
| Occupation | Male | Female |
| Sales & Related | 110 (55.6%) | 88 (44.4%) |
| Office & Administration | 38 (11.5%) | 293 (88.5%) |
| Total (Category) | 148 (28.0%) | 381 (72.0%) |
| Total (Overall) | 1,579 (52.7%) | 1,418 (47.3%) |
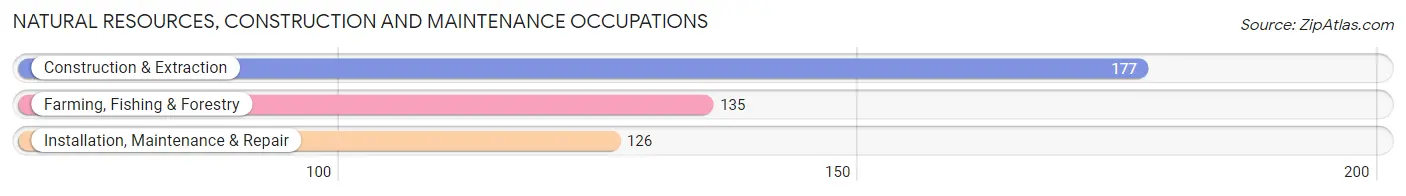
Natural Resources, Construction and Maintenance Occupations
The most common Natural Resources, Construction and Maintenance occupations in Spink County are Construction & Extraction (177 | 5.9%), Farming, Fishing & Forestry (135 | 4.5%), and Installation, Maintenance & Repair (126 | 4.2%).
Natural Resources, Construction and Maintenance Occupations by Sex
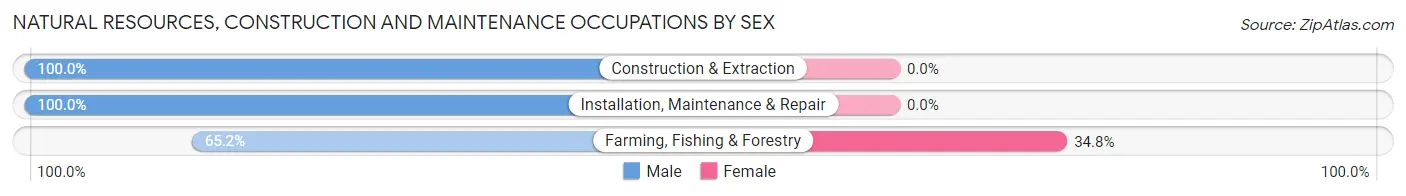
| Occupation | Male | Female |
| Farming, Fishing & Forestry | 88 (65.2%) | 47 (34.8%) |
| Construction & Extraction | 177 (100.0%) | 0 (0.0%) |
| Installation, Maintenance & Repair | 126 (100.0%) | 0 (0.0%) |
| Total (Category) | 391 (89.3%) | 47 (10.7%) |
| Total (Overall) | 1,579 (52.7%) | 1,418 (47.3%) |
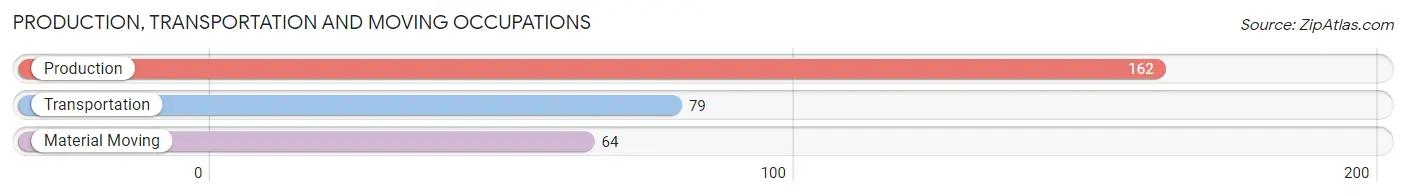
Production, Transportation and Moving Occupations
The most common Production, Transportation and Moving occupations in Spink County are Production (162 | 5.4%), Transportation (79 | 2.6%), and Material Moving (64 | 2.1%).
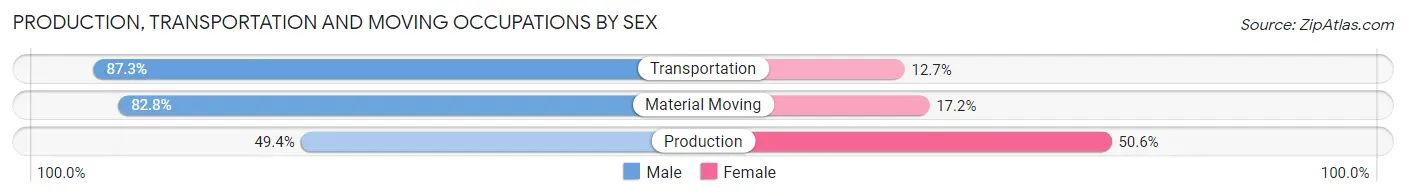
Production, Transportation and Moving Occupations by Sex
| Occupation | Male | Female |
| Production | 80 (49.4%) | 82 (50.6%) |
| Transportation | 69 (87.3%) | 10 (12.7%) |
| Material Moving | 53 (82.8%) | 11 (17.2%) |
| Total (Category) | 202 (66.2%) | 103 (33.8%) |
| Total (Overall) | 1,579 (52.7%) | 1,418 (47.3%) |
Employment Industries by Sex in Spink County
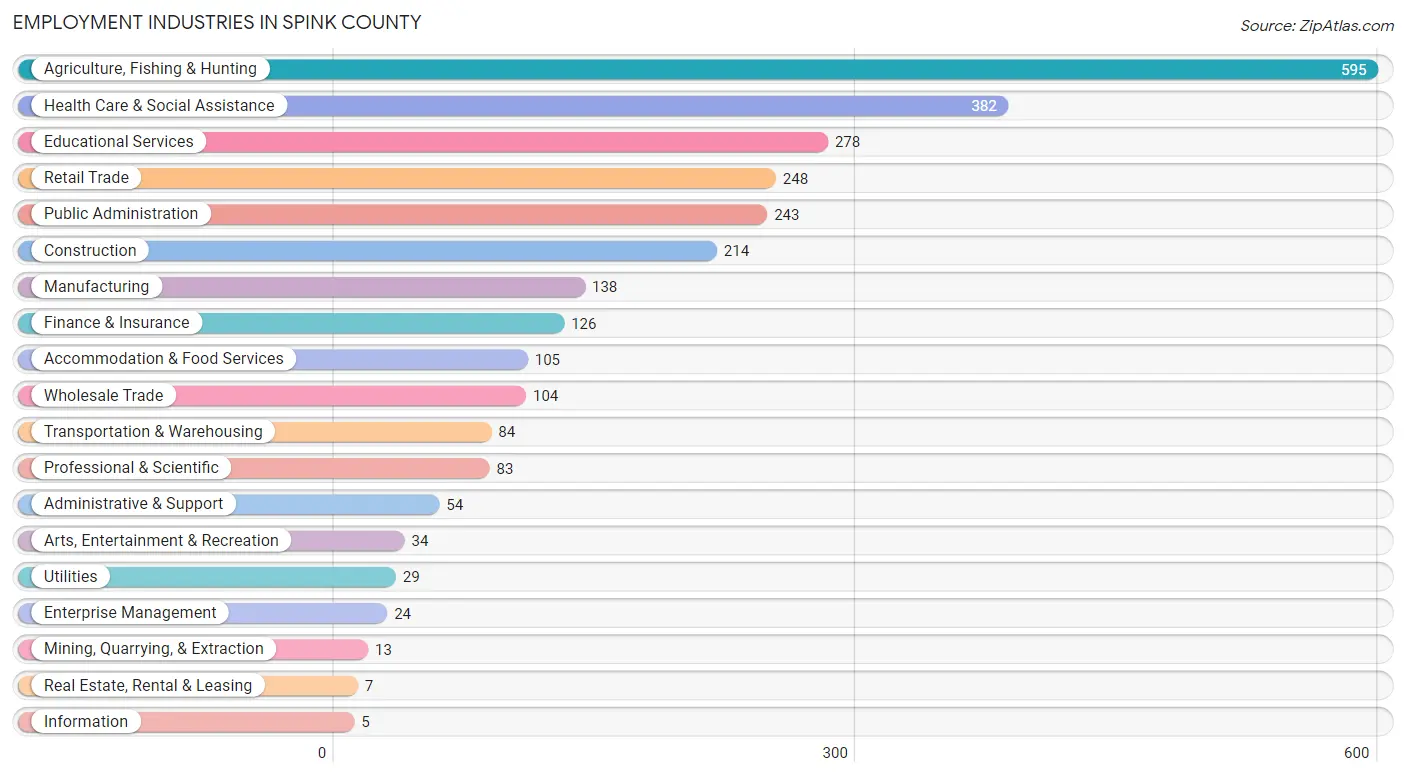
Employment Industries in Spink County
The major employment industries in Spink County include Agriculture, Fishing & Hunting (595 | 19.9%), Health Care & Social Assistance (382 | 12.8%), Educational Services (278 | 9.3%), Retail Trade (248 | 8.3%), and Public Administration (243 | 8.1%).
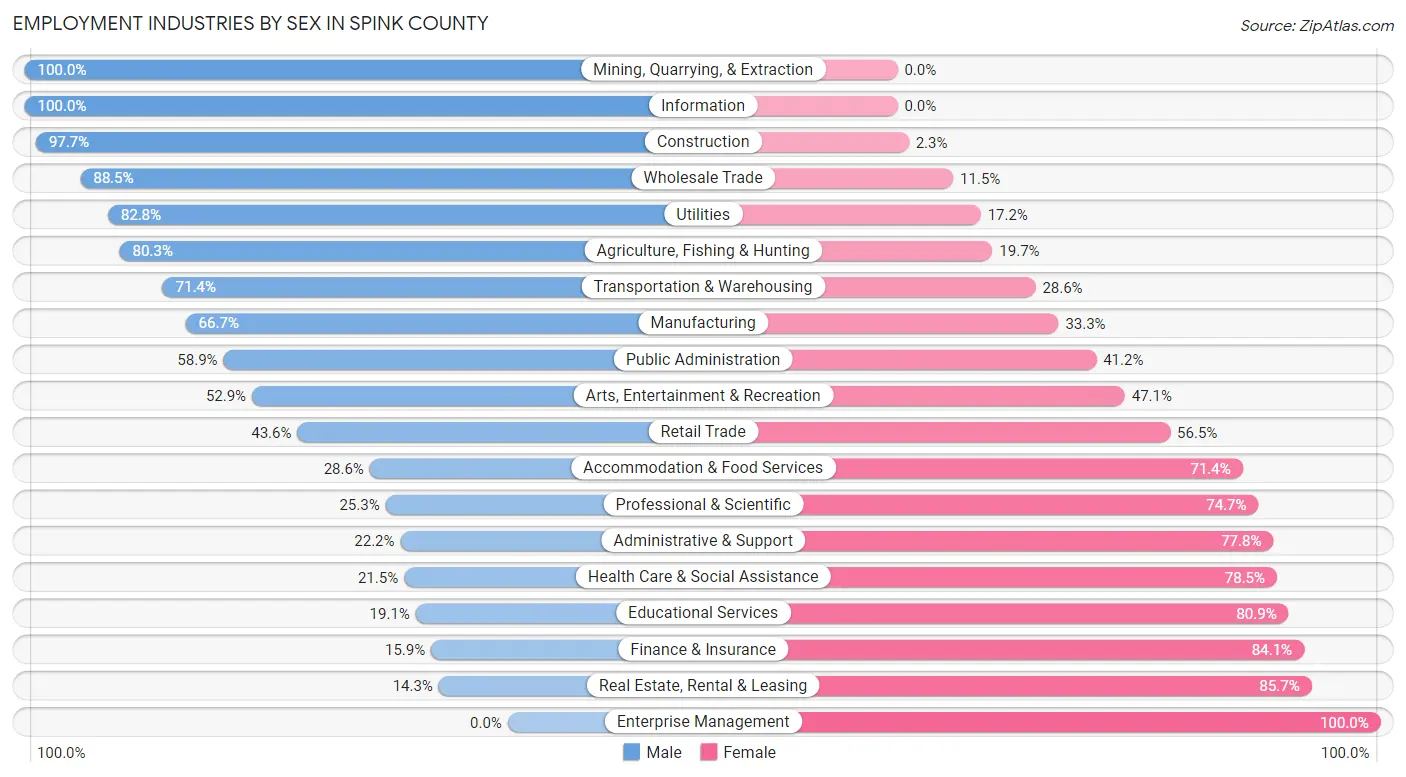
Employment Industries by Sex in Spink County
The Spink County industries that see more men than women are Mining, Quarrying, & Extraction (100.0%), Information (100.0%), and Construction (97.7%), whereas the industries that tend to have a higher number of women are Enterprise Management (100.0%), Real Estate, Rental & Leasing (85.7%), and Finance & Insurance (84.1%).
| Industry | Male | Female |
| Agriculture, Fishing & Hunting | 478 (80.3%) | 117 (19.7%) |
| Mining, Quarrying, & Extraction | 13 (100.0%) | 0 (0.0%) |
| Construction | 209 (97.7%) | 5 (2.3%) |
| Manufacturing | 92 (66.7%) | 46 (33.3%) |
| Wholesale Trade | 92 (88.5%) | 12 (11.5%) |
| Retail Trade | 108 (43.5%) | 140 (56.5%) |
| Transportation & Warehousing | 60 (71.4%) | 24 (28.6%) |
| Utilities | 24 (82.8%) | 5 (17.2%) |
| Information | 5 (100.0%) | 0 (0.0%) |
| Finance & Insurance | 20 (15.9%) | 106 (84.1%) |
| Real Estate, Rental & Leasing | 1 (14.3%) | 6 (85.7%) |
| Professional & Scientific | 21 (25.3%) | 62 (74.7%) |
| Enterprise Management | 0 (0.0%) | 24 (100.0%) |
| Administrative & Support | 12 (22.2%) | 42 (77.8%) |
| Educational Services | 53 (19.1%) | 225 (80.9%) |
| Health Care & Social Assistance | 82 (21.5%) | 300 (78.5%) |
| Arts, Entertainment & Recreation | 18 (52.9%) | 16 (47.1%) |
| Accommodation & Food Services | 30 (28.6%) | 75 (71.4%) |
| Public Administration | 143 (58.9%) | 100 (41.1%) |
| Total | 1,579 (52.7%) | 1,418 (47.3%) |
Education in Spink County
School Enrollment in Spink County
The most common levels of schooling among the 1,399 students in Spink County are high school (384 | 27.5%), middle school (304 | 21.7%), and elementary school (274 | 19.6%).
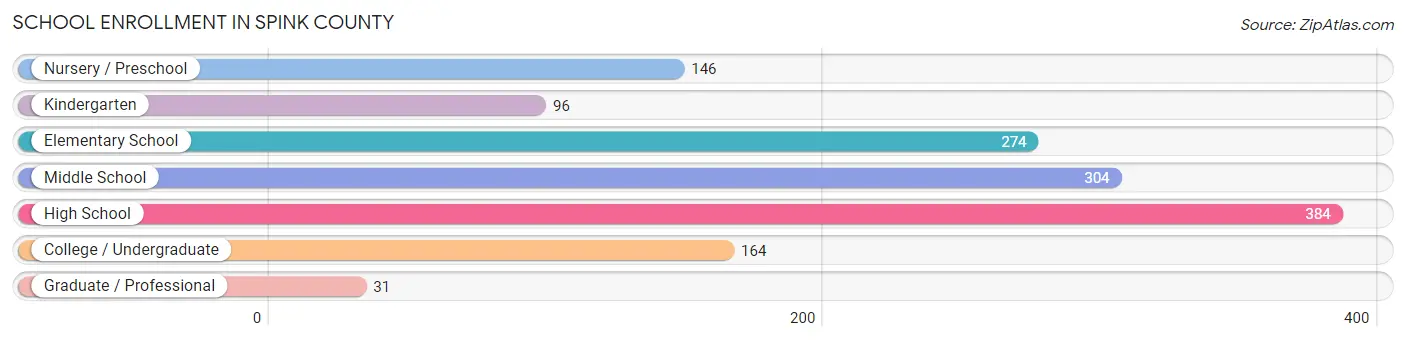
| School Level | # Students | % Students |
| Nursery / Preschool | 146 | 10.4% |
| Kindergarten | 96 | 6.9% |
| Elementary School | 274 | 19.6% |
| Middle School | 304 | 21.7% |
| High School | 384 | 27.5% |
| College / Undergraduate | 164 | 11.7% |
| Graduate / Professional | 31 | 2.2% |
| Total | 1,399 | 100.0% |
School Enrollment by Age by Funding Source in Spink County
Out of a total of 1,399 students who are enrolled in schools in Spink County, 182 (13.0%) attend a private institution, while the remaining 1,217 (87.0%) are enrolled in public schools. The age group of 35 years and over has the highest likelihood of being enrolled in private schools, with 19 (30.6% in the age bracket) enrolled. Conversely, the age group of 18 to 19 year olds has the lowest likelihood of being enrolled in a private school, with 54 (98.2% in the age bracket) attending a public institution.
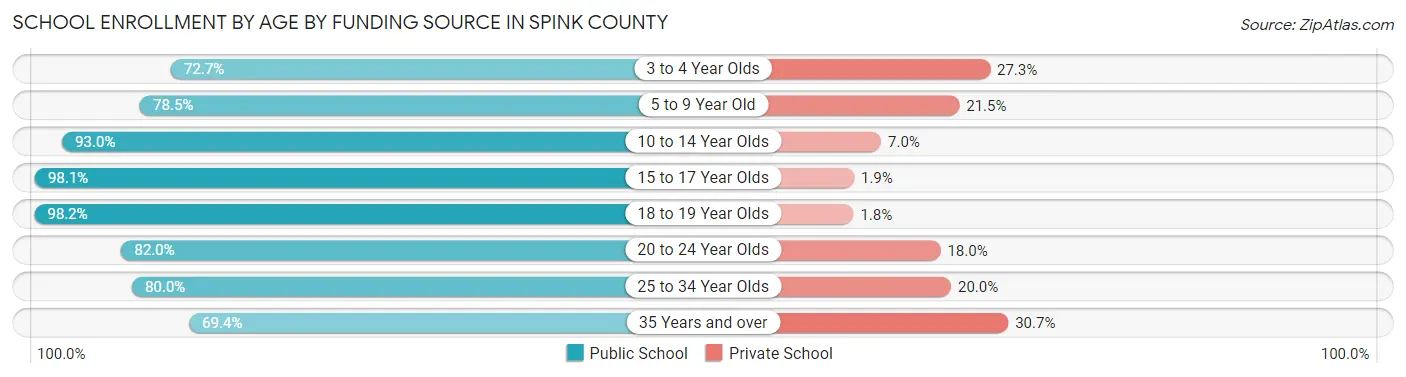
| Age Bracket | Public School | Private School |
| 3 to 4 Year Olds | 72 (72.7%) | 27 (27.3%) |
| 5 to 9 Year Old | 288 (78.5%) | 79 (21.5%) |
| 10 to 14 Year Olds | 347 (93.0%) | 26 (7.0%) |
| 15 to 17 Year Olds | 305 (98.1%) | 6 (1.9%) |
| 18 to 19 Year Olds | 54 (98.2%) | 1 (1.8%) |
| 20 to 24 Year Olds | 100 (82.0%) | 22 (18.0%) |
| 25 to 34 Year Olds | 8 (80.0%) | 2 (20.0%) |
| 35 Years and over | 43 (69.4%) | 19 (30.6%) |
| Total | 1,217 (87.0%) | 182 (13.0%) |
Educational Attainment by Field of Study in Spink County
Education (395 | 32.4%), bio, nature & agricultural (203 | 16.6%), science & technology (153 | 12.5%), business (136 | 11.2%), and arts & humanities (103 | 8.4%) are the most common fields of study among 1,220 individuals in Spink County who have obtained a bachelor's degree or higher.
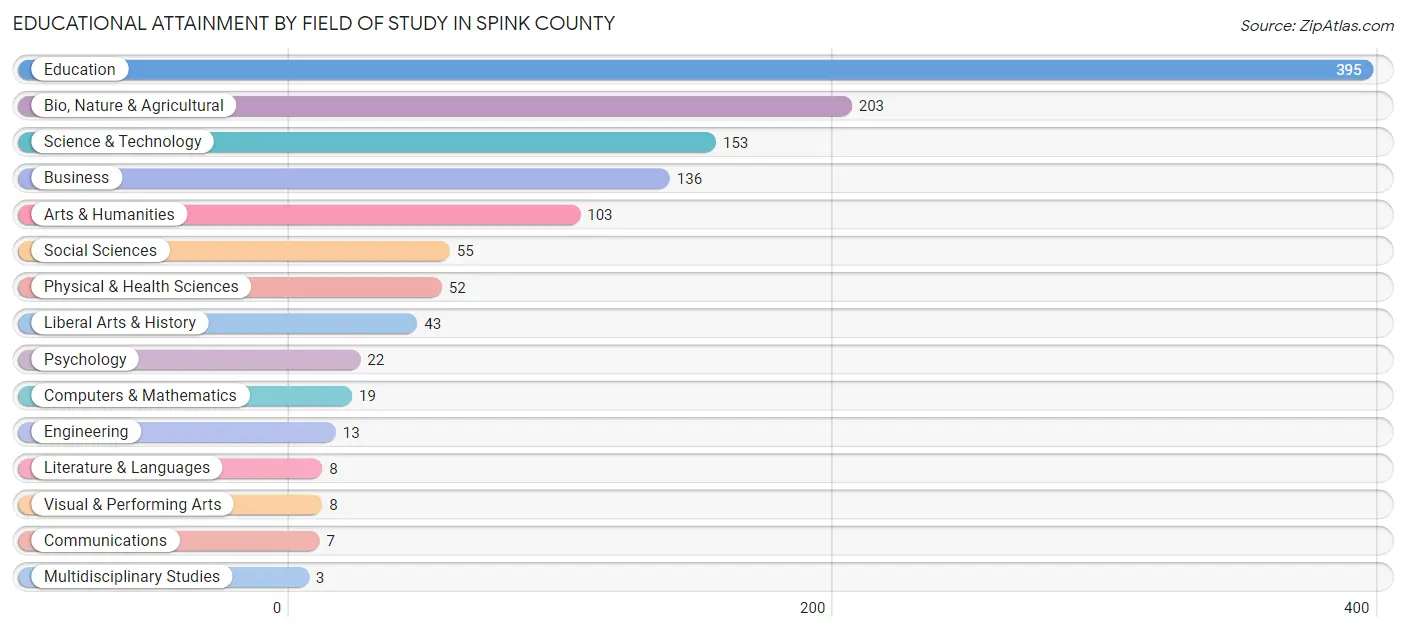
| Field of Study | # Graduates | % Graduates |
| Computers & Mathematics | 19 | 1.6% |
| Bio, Nature & Agricultural | 203 | 16.6% |
| Physical & Health Sciences | 52 | 4.3% |
| Psychology | 22 | 1.8% |
| Social Sciences | 55 | 4.5% |
| Engineering | 13 | 1.1% |
| Multidisciplinary Studies | 3 | 0.3% |
| Science & Technology | 153 | 12.5% |
| Business | 136 | 11.2% |
| Education | 395 | 32.4% |
| Literature & Languages | 8 | 0.7% |
| Liberal Arts & History | 43 | 3.5% |
| Visual & Performing Arts | 8 | 0.7% |
| Communications | 7 | 0.6% |
| Arts & Humanities | 103 | 8.4% |
| Total | 1,220 | 100.0% |
Transportation & Commute in Spink County
Vehicle Availability by Sex in Spink County
The most prevalent vehicle ownership categories in Spink County are males with 3 vehicles (522, accounting for 33.9%) and females with 3 vehicles (418, making up 39.2%).
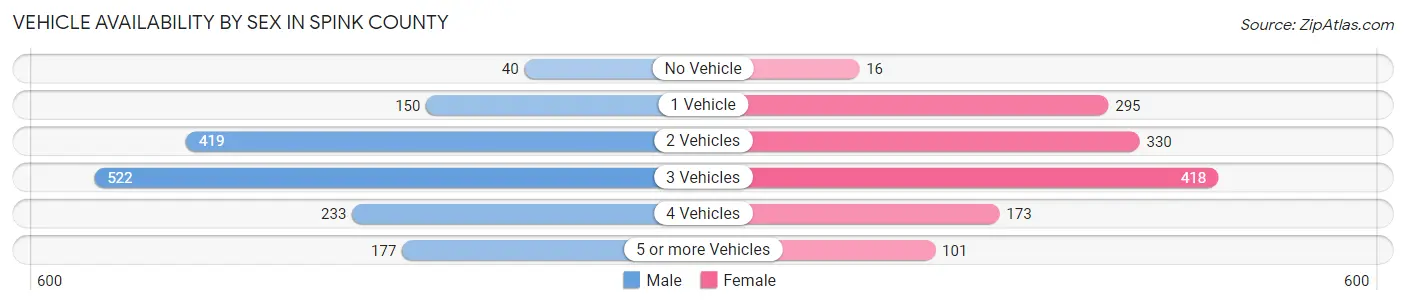
| Vehicles Available | Male | Female |
| No Vehicle | 40 (2.6%) | 16 (1.2%) |
| 1 Vehicle | 150 (9.7%) | 295 (22.1%) |
| 2 Vehicles | 419 (27.2%) | 330 (24.8%) |
| 3 Vehicles | 522 (33.9%) | 418 (31.4%) |
| 4 Vehicles | 233 (15.1%) | 173 (13.0%) |
| 5 or more Vehicles | 177 (11.5%) | 101 (7.6%) |
| Total | 1,541 (100.0%) | 1,333 (100.0%) |
Commute Time in Spink County
The most frequently occuring commute durations in Spink County are 5 to 9 minutes (616 commuters, 24.3%), less than 5 minutes (593 commuters, 23.4%), and 10 to 14 minutes (306 commuters, 12.1%).
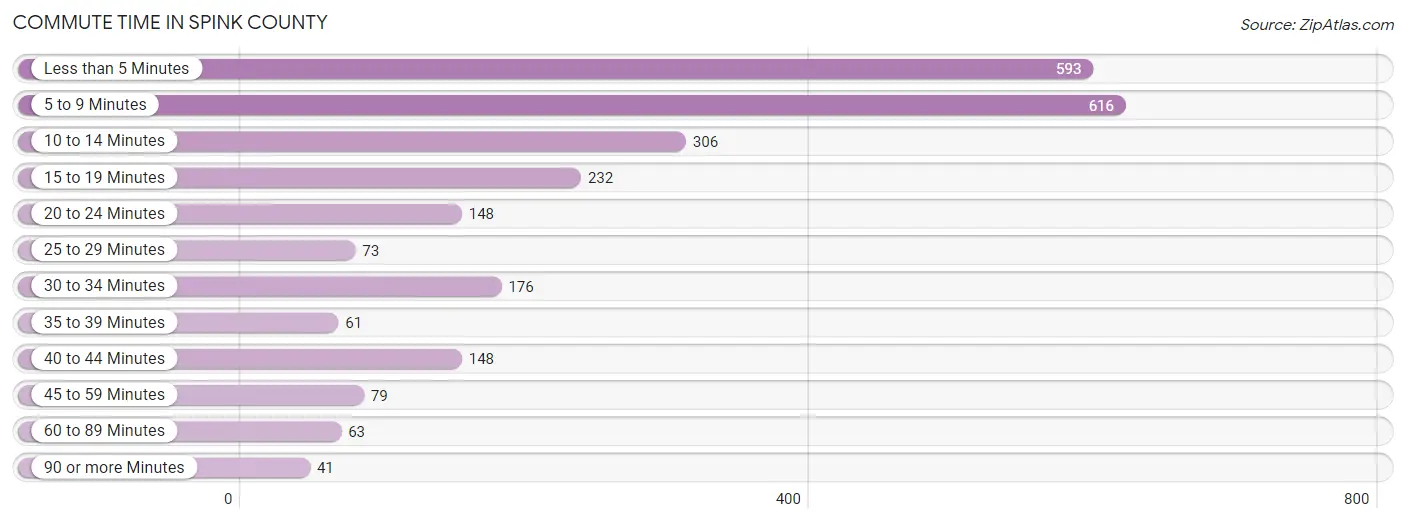
| Commute Time | # Commuters | % Commuters |
| Less than 5 Minutes | 593 | 23.4% |
| 5 to 9 Minutes | 616 | 24.3% |
| 10 to 14 Minutes | 306 | 12.1% |
| 15 to 19 Minutes | 232 | 9.1% |
| 20 to 24 Minutes | 148 | 5.8% |
| 25 to 29 Minutes | 73 | 2.9% |
| 30 to 34 Minutes | 176 | 6.9% |
| 35 to 39 Minutes | 61 | 2.4% |
| 40 to 44 Minutes | 148 | 5.8% |
| 45 to 59 Minutes | 79 | 3.1% |
| 60 to 89 Minutes | 63 | 2.5% |
| 90 or more Minutes | 41 | 1.6% |
Commute Time by Sex in Spink County
The most common commute times in Spink County are less than 5 minutes (442 commuters, 32.7%) for males and 5 to 9 minutes (283 commuters, 23.9%) for females.
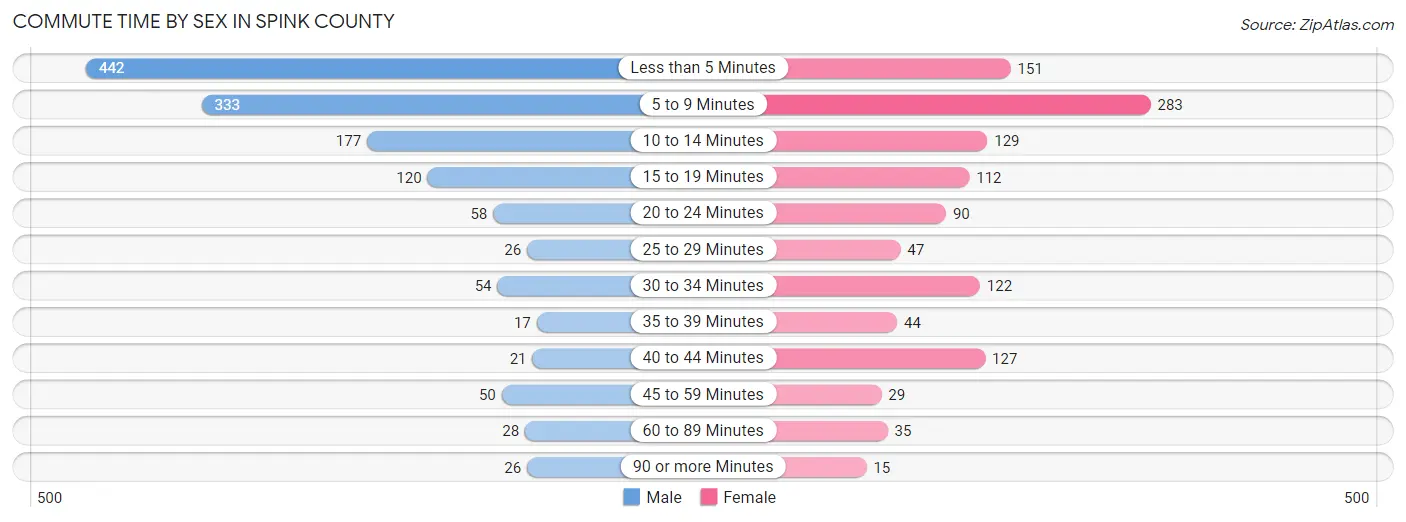
| Commute Time | Male | Female |
| Less than 5 Minutes | 442 (32.7%) | 151 (12.8%) |
| 5 to 9 Minutes | 333 (24.6%) | 283 (23.9%) |
| 10 to 14 Minutes | 177 (13.1%) | 129 (10.9%) |
| 15 to 19 Minutes | 120 (8.9%) | 112 (9.5%) |
| 20 to 24 Minutes | 58 (4.3%) | 90 (7.6%) |
| 25 to 29 Minutes | 26 (1.9%) | 47 (4.0%) |
| 30 to 34 Minutes | 54 (4.0%) | 122 (10.3%) |
| 35 to 39 Minutes | 17 (1.3%) | 44 (3.7%) |
| 40 to 44 Minutes | 21 (1.5%) | 127 (10.7%) |
| 45 to 59 Minutes | 50 (3.7%) | 29 (2.5%) |
| 60 to 89 Minutes | 28 (2.1%) | 35 (3.0%) |
| 90 or more Minutes | 26 (1.9%) | 15 (1.3%) |
Time of Departure to Work by Sex in Spink County
The most frequent times of departure to work in Spink County are 7:30 AM to 7:59 AM (352, 26.0%) for males and 7:30 AM to 7:59 AM (296, 25.0%) for females.
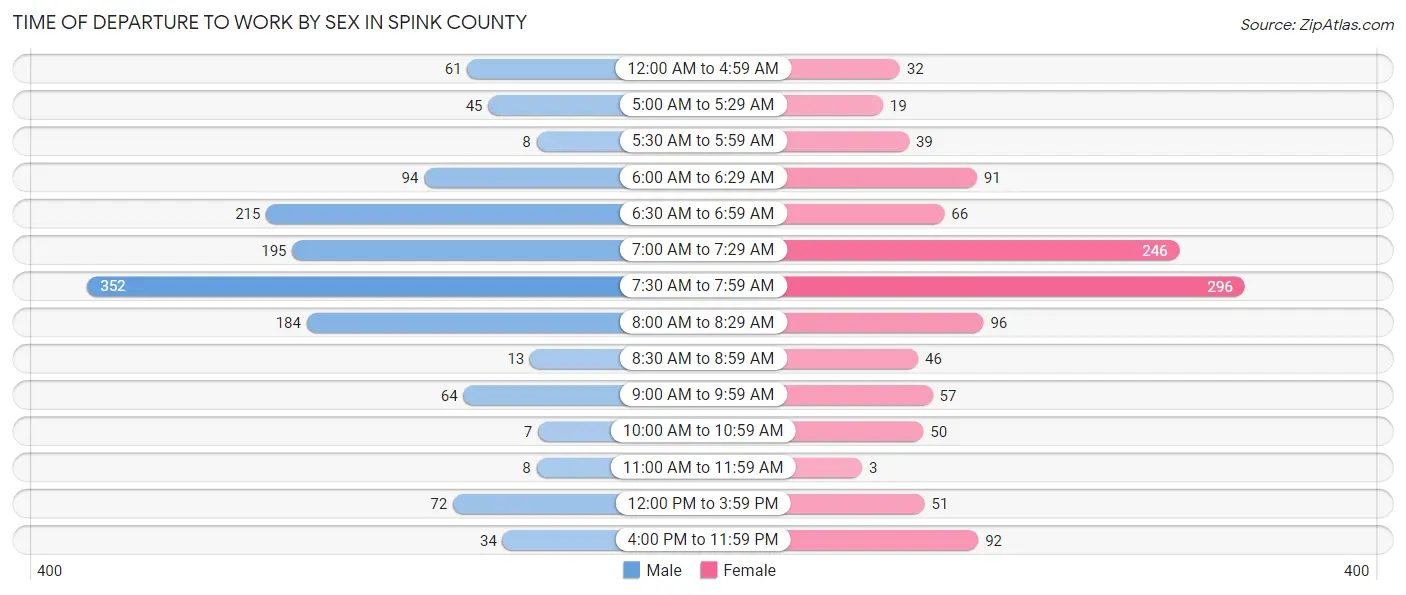
| Time of Departure | Male | Female |
| 12:00 AM to 4:59 AM | 61 (4.5%) | 32 (2.7%) |
| 5:00 AM to 5:29 AM | 45 (3.3%) | 19 (1.6%) |
| 5:30 AM to 5:59 AM | 8 (0.6%) | 39 (3.3%) |
| 6:00 AM to 6:29 AM | 94 (7.0%) | 91 (7.7%) |
| 6:30 AM to 6:59 AM | 215 (15.9%) | 66 (5.6%) |
| 7:00 AM to 7:29 AM | 195 (14.4%) | 246 (20.8%) |
| 7:30 AM to 7:59 AM | 352 (26.0%) | 296 (25.0%) |
| 8:00 AM to 8:29 AM | 184 (13.6%) | 96 (8.1%) |
| 8:30 AM to 8:59 AM | 13 (1.0%) | 46 (3.9%) |
| 9:00 AM to 9:59 AM | 64 (4.7%) | 57 (4.8%) |
| 10:00 AM to 10:59 AM | 7 (0.5%) | 50 (4.2%) |
| 11:00 AM to 11:59 AM | 8 (0.6%) | 3 (0.3%) |
| 12:00 PM to 3:59 PM | 72 (5.3%) | 51 (4.3%) |
| 4:00 PM to 11:59 PM | 34 (2.5%) | 92 (7.8%) |
| Total | 1,352 (100.0%) | 1,184 (100.0%) |
Housing Occupancy in Spink County
Occupancy by Ownership in Spink County
Of the total 2,526 dwellings in Spink County, owner-occupied units account for 1,869 (74.0%), while renter-occupied units make up 657 (26.0%).
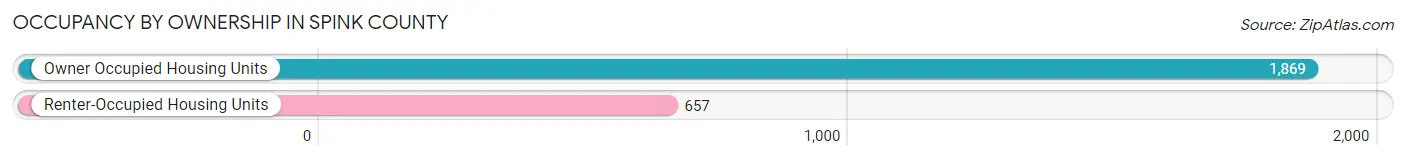
| Occupancy | # Housing Units | % Housing Units |
| Owner Occupied Housing Units | 1,869 | 74.0% |
| Renter-Occupied Housing Units | 657 | 26.0% |
| Total Occupied Housing Units | 2,526 | 100.0% |
Occupancy by Household Size in Spink County
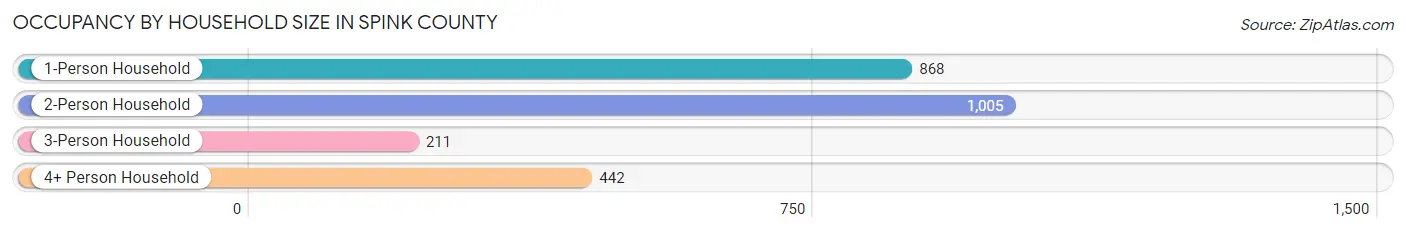
| Household Size | # Housing Units | % Housing Units |
| 1-Person Household | 868 | 34.4% |
| 2-Person Household | 1,005 | 39.8% |
| 3-Person Household | 211 | 8.4% |
| 4+ Person Household | 442 | 17.5% |
| Total Housing Units | 2,526 | 100.0% |
Occupancy by Ownership by Household Size in Spink County
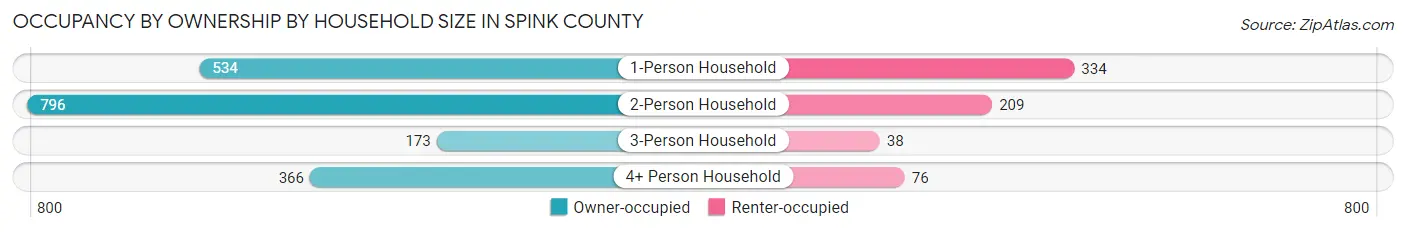
| Household Size | Owner-occupied | Renter-occupied |
| 1-Person Household | 534 (61.5%) | 334 (38.5%) |
| 2-Person Household | 796 (79.2%) | 209 (20.8%) |
| 3-Person Household | 173 (82.0%) | 38 (18.0%) |
| 4+ Person Household | 366 (82.8%) | 76 (17.2%) |
| Total Housing Units | 1,869 (74.0%) | 657 (26.0%) |
Occupancy by Educational Attainment in Spink County
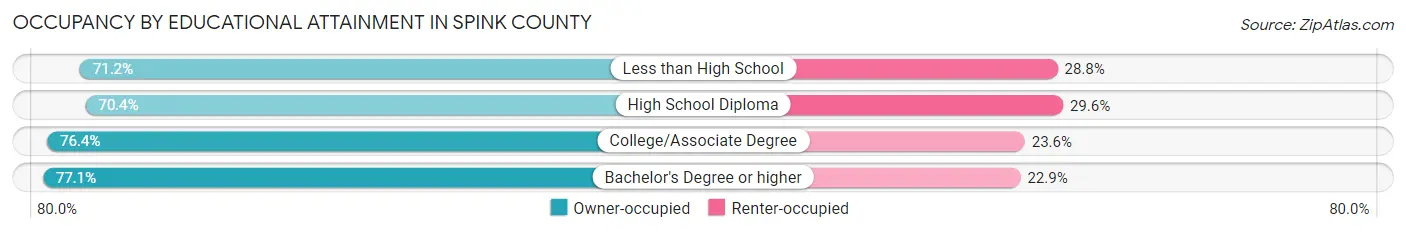
| Household Size | Owner-occupied | Renter-occupied |
| Less than High School | 104 (71.2%) | 42 (28.8%) |
| High School Diploma | 677 (70.4%) | 285 (29.6%) |
| College/Associate Degree | 613 (76.4%) | 189 (23.6%) |
| Bachelor's Degree or higher | 475 (77.1%) | 141 (22.9%) |
Occupancy by Age of Householder in Spink County
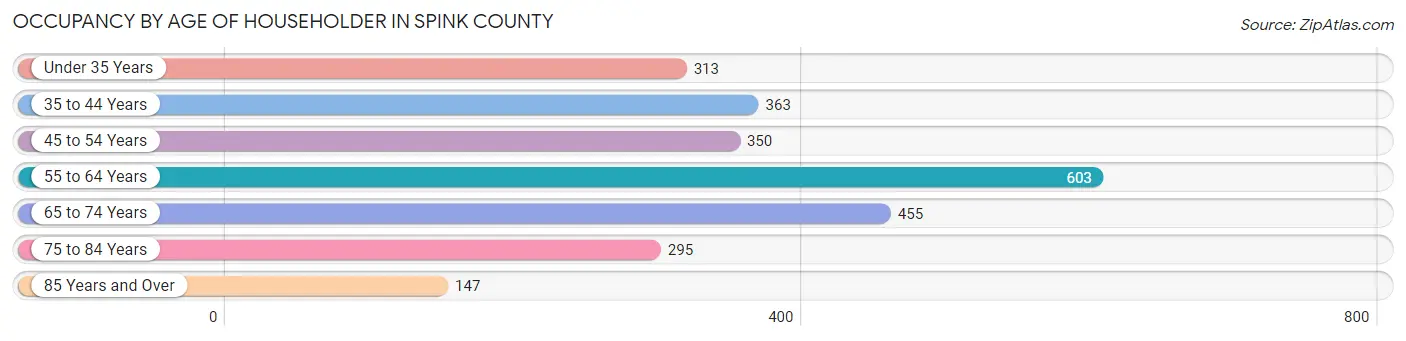
| Age Bracket | # Households | % Households |
| Under 35 Years | 313 | 12.4% |
| 35 to 44 Years | 363 | 14.4% |
| 45 to 54 Years | 350 | 13.9% |
| 55 to 64 Years | 603 | 23.9% |
| 65 to 74 Years | 455 | 18.0% |
| 75 to 84 Years | 295 | 11.7% |
| 85 Years and Over | 147 | 5.8% |
| Total | 2,526 | 100.0% |
Housing Finances in Spink County
Median Income by Occupancy in Spink County
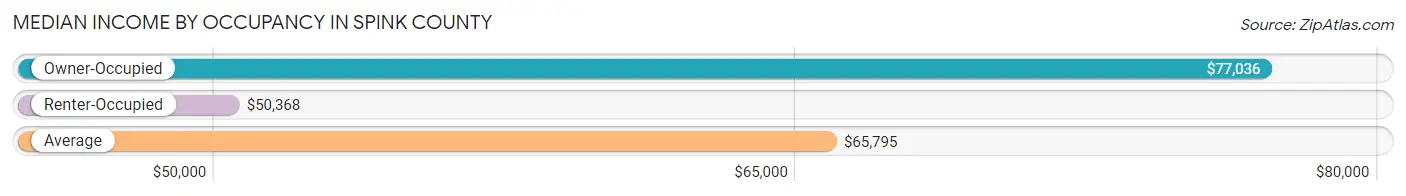
| Occupancy Type | # Households | Median Income |
| Owner-Occupied | 1,869 (74.0%) | $77,036 |
| Renter-Occupied | 657 (26.0%) | $50,368 |
| Average | 2,526 (100.0%) | $65,795 |
Occupancy by Householder Income Bracket in Spink County
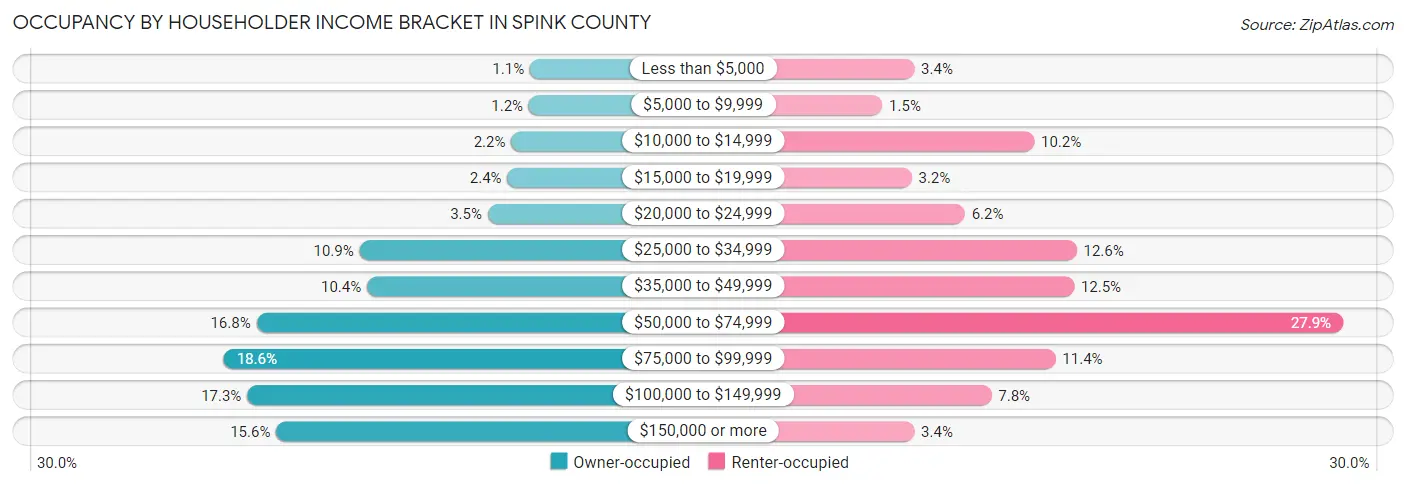
| Income Bracket | Owner-occupied | Renter-occupied |
| Less than $5,000 | 21 (1.1%) | 22 (3.4%) |
| $5,000 to $9,999 | 22 (1.2%) | 10 (1.5%) |
| $10,000 to $14,999 | 41 (2.2%) | 67 (10.2%) |
| $15,000 to $19,999 | 45 (2.4%) | 21 (3.2%) |
| $20,000 to $24,999 | 66 (3.5%) | 41 (6.2%) |
| $25,000 to $34,999 | 203 (10.9%) | 83 (12.6%) |
| $35,000 to $49,999 | 195 (10.4%) | 82 (12.5%) |
| $50,000 to $74,999 | 313 (16.8%) | 183 (27.9%) |
| $75,000 to $99,999 | 348 (18.6%) | 75 (11.4%) |
| $100,000 to $149,999 | 323 (17.3%) | 51 (7.8%) |
| $150,000 or more | 292 (15.6%) | 22 (3.4%) |
| Total | 1,869 (100.0%) | 657 (100.0%) |
Monthly Housing Cost Tiers in Spink County
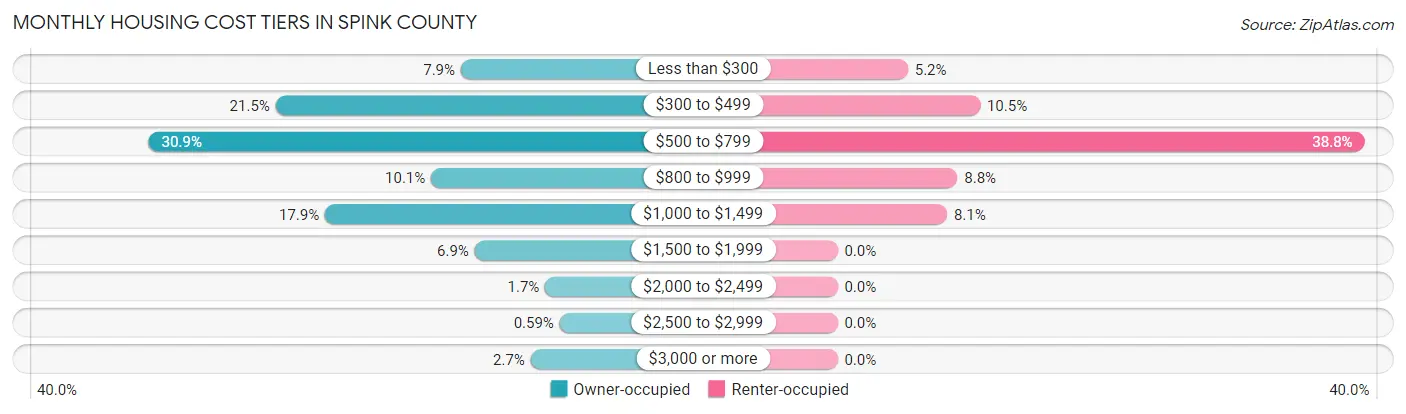
| Monthly Cost | Owner-occupied | Renter-occupied |
| Less than $300 | 147 (7.9%) | 34 (5.2%) |
| $300 to $499 | 402 (21.5%) | 69 (10.5%) |
| $500 to $799 | 577 (30.9%) | 255 (38.8%) |
| $800 to $999 | 188 (10.1%) | 58 (8.8%) |
| $1,000 to $1,499 | 334 (17.9%) | 53 (8.1%) |
| $1,500 to $1,999 | 128 (6.9%) | 0 (0.0%) |
| $2,000 to $2,499 | 31 (1.7%) | 0 (0.0%) |
| $2,500 to $2,999 | 11 (0.6%) | 0 (0.0%) |
| $3,000 or more | 51 (2.7%) | 0 (0.0%) |
| Total | 1,869 (100.0%) | 657 (100.0%) |
Physical Housing Characteristics in Spink County
Housing Structures in Spink County
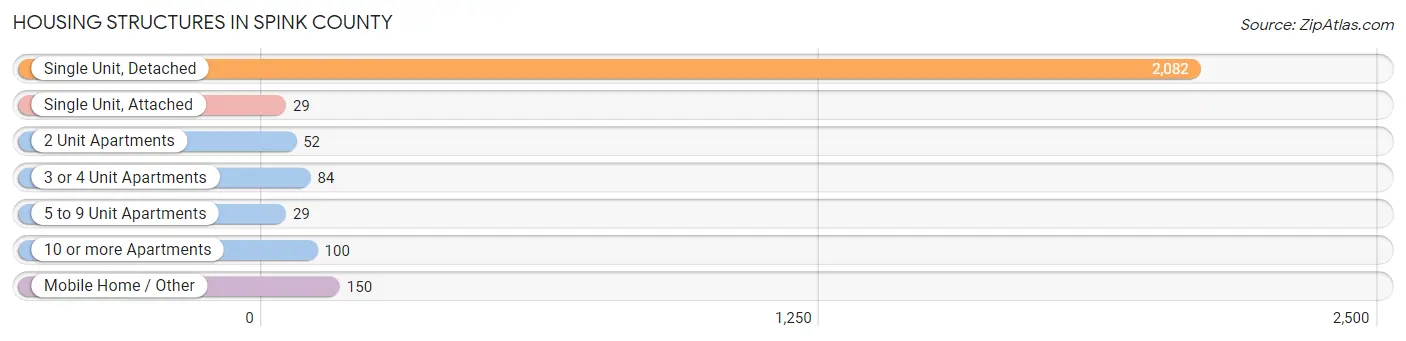
| Structure Type | # Housing Units | % Housing Units |
| Single Unit, Detached | 2,082 | 82.4% |
| Single Unit, Attached | 29 | 1.1% |
| 2 Unit Apartments | 52 | 2.1% |
| 3 or 4 Unit Apartments | 84 | 3.3% |
| 5 to 9 Unit Apartments | 29 | 1.1% |
| 10 or more Apartments | 100 | 4.0% |
| Mobile Home / Other | 150 | 5.9% |
| Total | 2,526 | 100.0% |
Housing Structures by Occupancy in Spink County
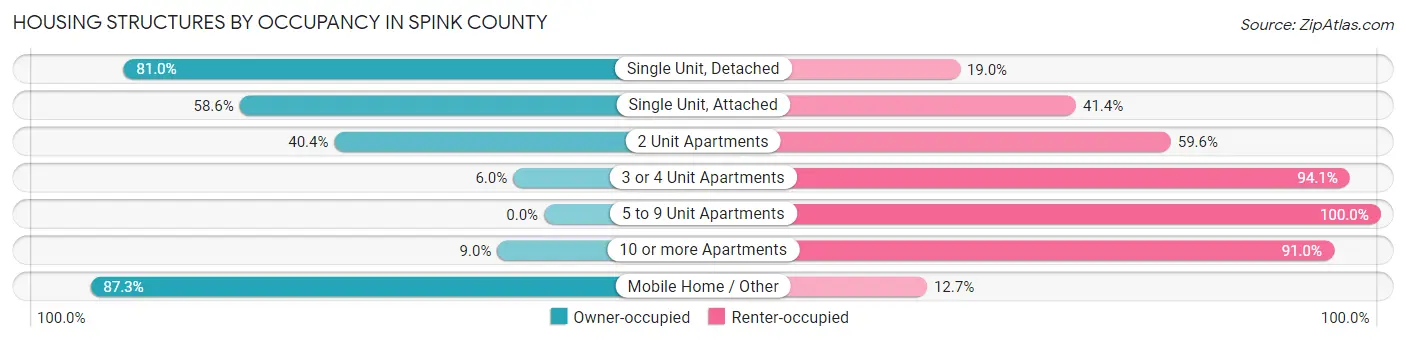
| Structure Type | Owner-occupied | Renter-occupied |
| Single Unit, Detached | 1,686 (81.0%) | 396 (19.0%) |
| Single Unit, Attached | 17 (58.6%) | 12 (41.4%) |
| 2 Unit Apartments | 21 (40.4%) | 31 (59.6%) |
| 3 or 4 Unit Apartments | 5 (5.9%) | 79 (94.1%) |
| 5 to 9 Unit Apartments | 0 (0.0%) | 29 (100.0%) |
| 10 or more Apartments | 9 (9.0%) | 91 (91.0%) |
| Mobile Home / Other | 131 (87.3%) | 19 (12.7%) |
| Total | 1,869 (74.0%) | 657 (26.0%) |
Housing Structures by Number of Rooms in Spink County
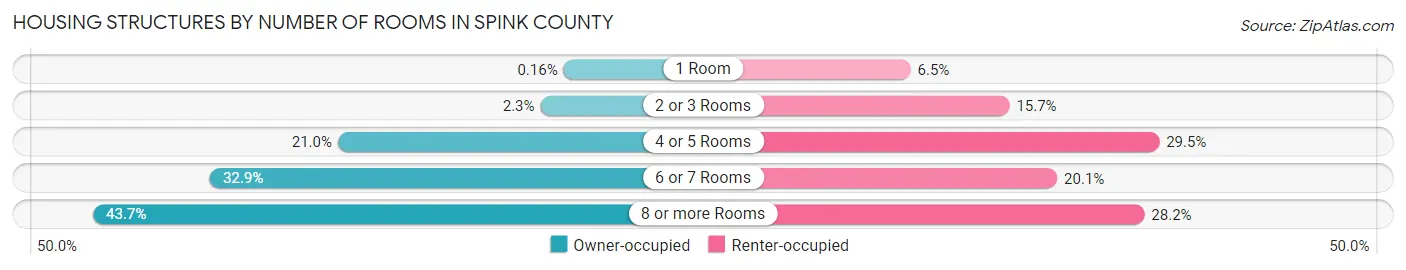
| Number of Rooms | Owner-occupied | Renter-occupied |
| 1 Room | 3 (0.2%) | 43 (6.5%) |
| 2 or 3 Rooms | 43 (2.3%) | 103 (15.7%) |
| 4 or 5 Rooms | 393 (21.0%) | 194 (29.5%) |
| 6 or 7 Rooms | 614 (32.9%) | 132 (20.1%) |
| 8 or more Rooms | 816 (43.7%) | 185 (28.2%) |
| Total | 1,869 (100.0%) | 657 (100.0%) |
Housing Structure by Heating Type in Spink County
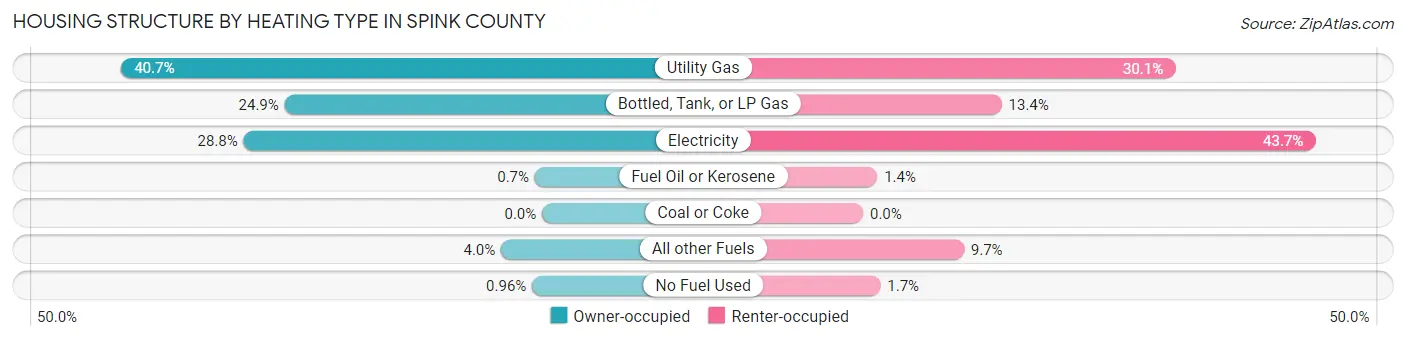
| Heating Type | Owner-occupied | Renter-occupied |
| Utility Gas | 760 (40.7%) | 198 (30.1%) |
| Bottled, Tank, or LP Gas | 465 (24.9%) | 88 (13.4%) |
| Electricity | 539 (28.8%) | 287 (43.7%) |
| Fuel Oil or Kerosene | 13 (0.7%) | 9 (1.4%) |
| Coal or Coke | 0 (0.0%) | 0 (0.0%) |
| All other Fuels | 74 (4.0%) | 64 (9.7%) |
| No Fuel Used | 18 (1.0%) | 11 (1.7%) |
| Total | 1,869 (100.0%) | 657 (100.0%) |
Household Vehicle Usage in Spink County
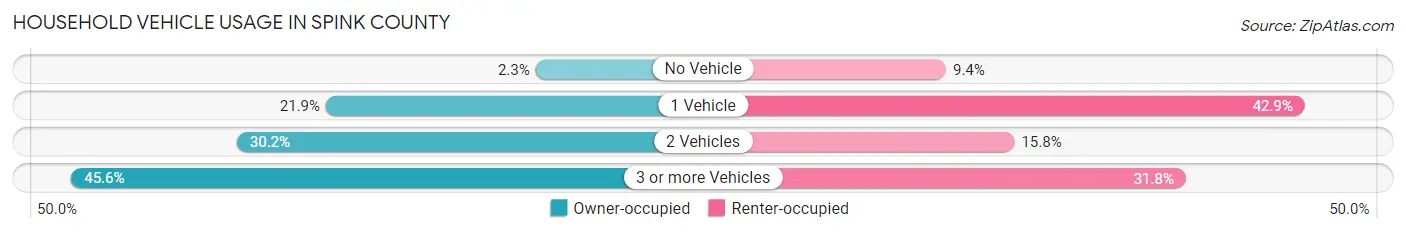
| Vehicles per Household | Owner-occupied | Renter-occupied |
| No Vehicle | 43 (2.3%) | 62 (9.4%) |
| 1 Vehicle | 409 (21.9%) | 282 (42.9%) |
| 2 Vehicles | 564 (30.2%) | 104 (15.8%) |
| 3 or more Vehicles | 853 (45.6%) | 209 (31.8%) |
| Total | 1,869 (100.0%) | 657 (100.0%) |
Real Estate & Mortgages in Spink County
Real Estate and Mortgage Overview in Spink County
| Characteristic | Without Mortgage | With Mortgage |
| Housing Units | 1,173 | 696 |
| Median Property Value | $89,900 | $123,600 |
| Median Household Income | $64,028 | $105 |
| Monthly Housing Costs | $524 | $47 |
| Real Estate Taxes | $1,177 | $25 |
Property Value by Mortgage Status in Spink County
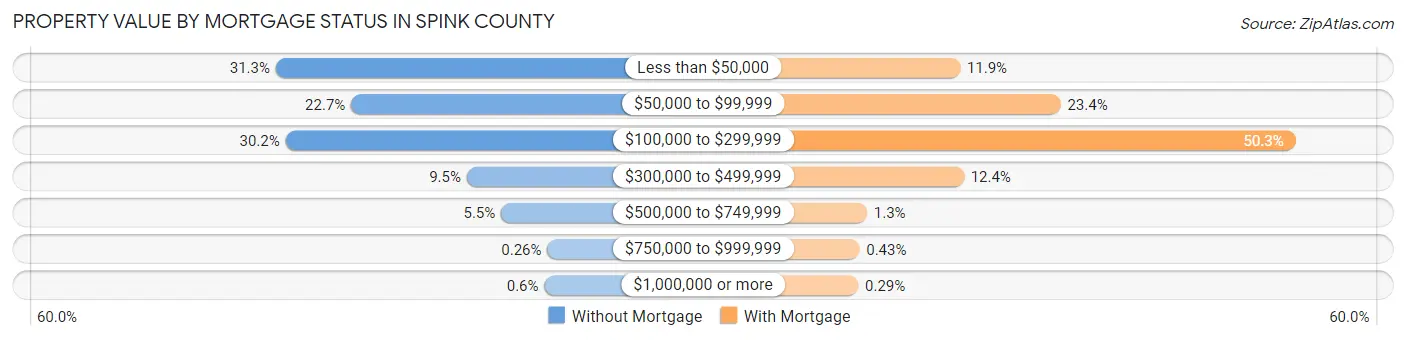
| Property Value | Without Mortgage | With Mortgage |
| Less than $50,000 | 367 (31.3%) | 83 (11.9%) |
| $50,000 to $99,999 | 266 (22.7%) | 163 (23.4%) |
| $100,000 to $299,999 | 354 (30.2%) | 350 (50.3%) |
| $300,000 to $499,999 | 111 (9.5%) | 86 (12.4%) |
| $500,000 to $749,999 | 65 (5.5%) | 9 (1.3%) |
| $750,000 to $999,999 | 3 (0.3%) | 3 (0.4%) |
| $1,000,000 or more | 7 (0.6%) | 2 (0.3%) |
| Total | 1,173 (100.0%) | 696 (100.0%) |
Household Income by Mortgage Status in Spink County
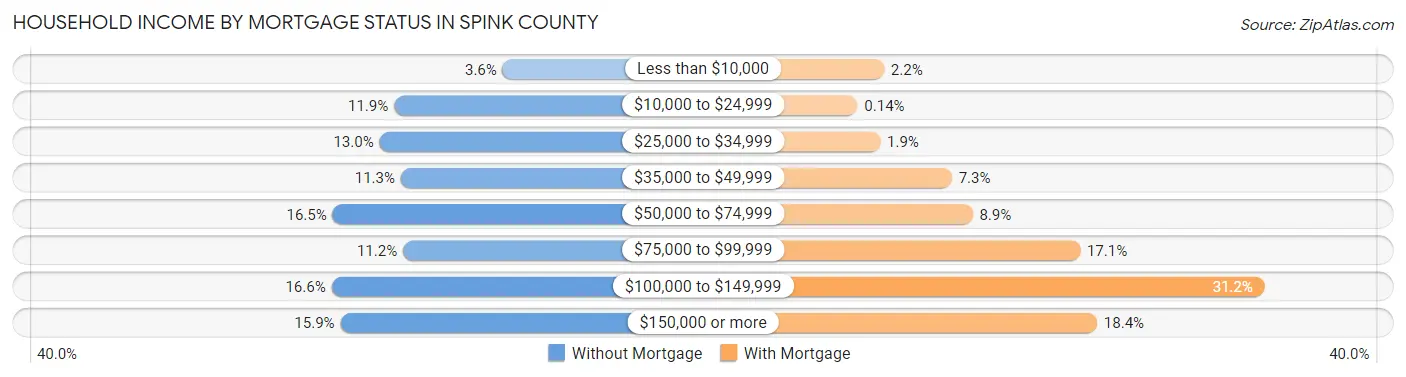
| Household Income | Without Mortgage | With Mortgage |
| Less than $10,000 | 42 (3.6%) | 15 (2.2%) |
| $10,000 to $24,999 | 139 (11.8%) | 1 (0.1%) |
| $25,000 to $34,999 | 152 (13.0%) | 13 (1.9%) |
| $35,000 to $49,999 | 133 (11.3%) | 51 (7.3%) |
| $50,000 to $74,999 | 194 (16.5%) | 62 (8.9%) |
| $75,000 to $99,999 | 131 (11.2%) | 119 (17.1%) |
| $100,000 to $149,999 | 195 (16.6%) | 217 (31.2%) |
| $150,000 or more | 187 (15.9%) | 128 (18.4%) |
| Total | 1,173 (100.0%) | 696 (100.0%) |
Property Value to Household Income Ratio in Spink County
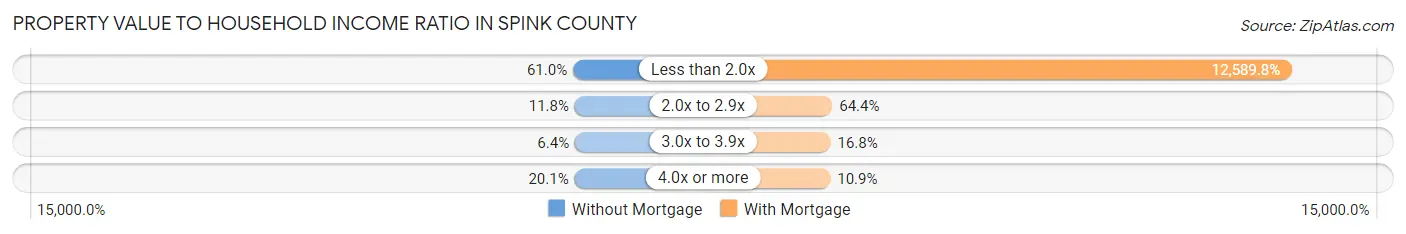
| Value-to-Income Ratio | Without Mortgage | With Mortgage |
| Less than 2.0x | 716 (61.0%) | 87,625 (12,589.8%) |
| 2.0x to 2.9x | 138 (11.8%) | 448 (64.4%) |
| 3.0x to 3.9x | 75 (6.4%) | 117 (16.8%) |
| 4.0x or more | 236 (20.1%) | 76 (10.9%) |
| Total | 1,173 (100.0%) | 696 (100.0%) |
Real Estate Taxes by Mortgage Status in Spink County
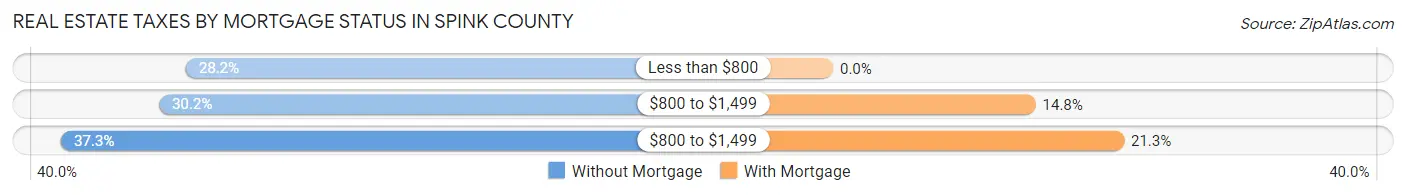
| Property Taxes | Without Mortgage | With Mortgage |
| Less than $800 | 331 (28.2%) | 0 (0.0%) |
| $800 to $1,499 | 354 (30.2%) | 103 (14.8%) |
| $800 to $1,499 | 438 (37.3%) | 148 (21.3%) |
| Total | 1,173 (100.0%) | 696 (100.0%) |
Health & Disability in Spink County
Health Insurance Coverage by Age in Spink County
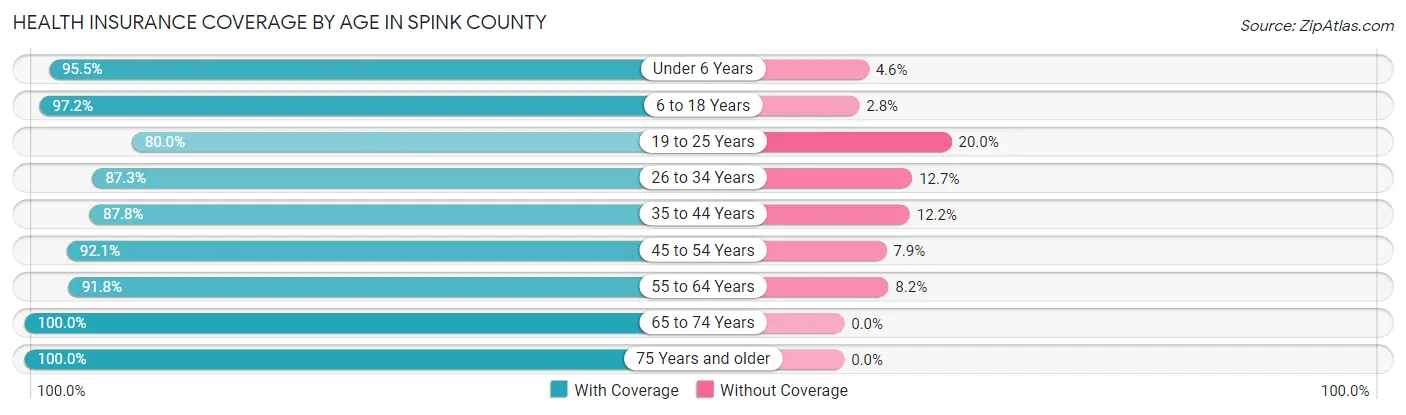
| Age Bracket | With Coverage | Without Coverage |
| Under 6 Years | 462 (95.5%) | 22 (4.5%) |
| 6 to 18 Years | 1,004 (97.2%) | 29 (2.8%) |
| 19 to 25 Years | 320 (80.0%) | 80 (20.0%) |
| 26 to 34 Years | 503 (87.3%) | 73 (12.7%) |
| 35 to 44 Years | 597 (87.8%) | 83 (12.2%) |
| 45 to 54 Years | 609 (92.1%) | 52 (7.9%) |
| 55 to 64 Years | 970 (91.8%) | 87 (8.2%) |
| 65 to 74 Years | 749 (100.0%) | 0 (0.0%) |
| 75 Years and older | 605 (100.0%) | 0 (0.0%) |
| Total | 5,819 (93.2%) | 426 (6.8%) |
Health Insurance Coverage by Citizenship Status in Spink County
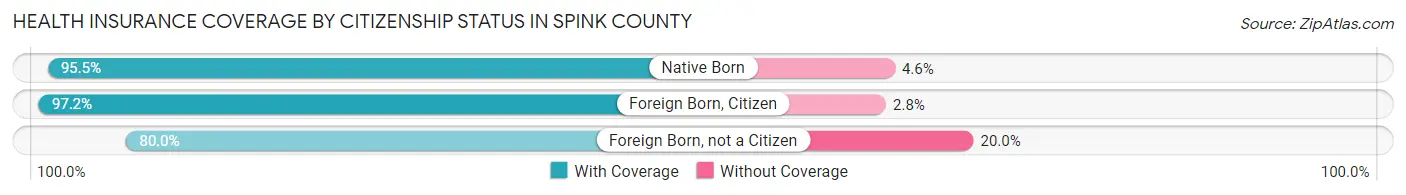
| Citizenship Status | With Coverage | Without Coverage |
| Native Born | 462 (95.5%) | 22 (4.5%) |
| Foreign Born, Citizen | 1,004 (97.2%) | 29 (2.8%) |
| Foreign Born, not a Citizen | 320 (80.0%) | 80 (20.0%) |
Health Insurance Coverage by Household Income in Spink County
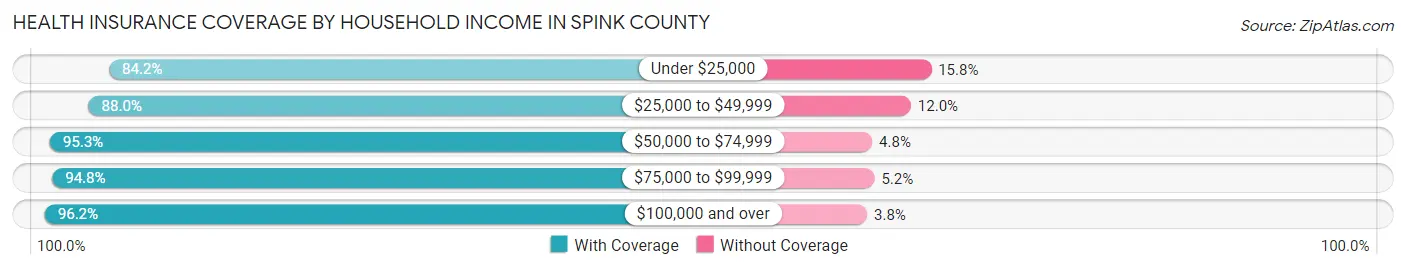
| Household Income | With Coverage | Without Coverage |
| Under $25,000 | 511 (84.2%) | 96 (15.8%) |
| $25,000 to $49,999 | 989 (88.0%) | 135 (12.0%) |
| $50,000 to $74,999 | 1,003 (95.3%) | 50 (4.8%) |
| $75,000 to $99,999 | 1,041 (94.8%) | 57 (5.2%) |
| $100,000 and over | 2,179 (96.2%) | 86 (3.8%) |
Public vs Private Health Insurance Coverage by Age in Spink County
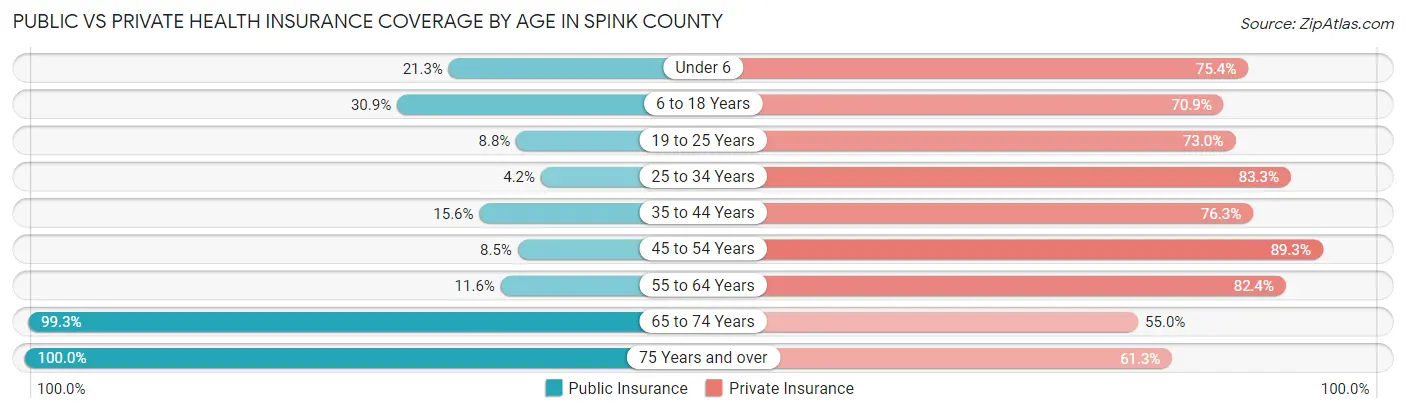
| Age Bracket | Public Insurance | Private Insurance |
| Under 6 | 103 (21.3%) | 365 (75.4%) |
| 6 to 18 Years | 319 (30.9%) | 732 (70.9%) |
| 19 to 25 Years | 35 (8.7%) | 292 (73.0%) |
| 25 to 34 Years | 24 (4.2%) | 480 (83.3%) |
| 35 to 44 Years | 106 (15.6%) | 519 (76.3%) |
| 45 to 54 Years | 56 (8.5%) | 590 (89.3%) |
| 55 to 64 Years | 123 (11.6%) | 871 (82.4%) |
| 65 to 74 Years | 744 (99.3%) | 412 (55.0%) |
| 75 Years and over | 605 (100.0%) | 371 (61.3%) |
| Total | 2,115 (33.9%) | 4,632 (74.2%) |
Disability Status by Sex by Age in Spink County
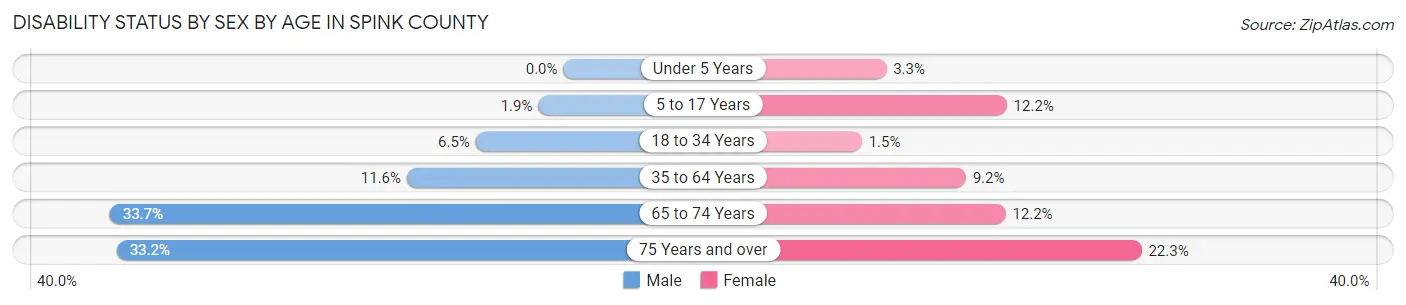
| Age Bracket | Male | Female |
| Under 5 Years | 0 (0.0%) | 6 (3.3%) |
| 5 to 17 Years | 11 (1.9%) | 60 (12.2%) |
| 18 to 34 Years | 36 (6.5%) | 7 (1.5%) |
| 35 to 64 Years | 141 (11.6%) | 109 (9.2%) |
| 65 to 74 Years | 133 (33.7%) | 43 (12.1%) |
| 75 Years and over | 65 (33.2%) | 91 (22.3%) |
Disability Class by Sex by Age in Spink County
Disability Class: Hearing Difficulty
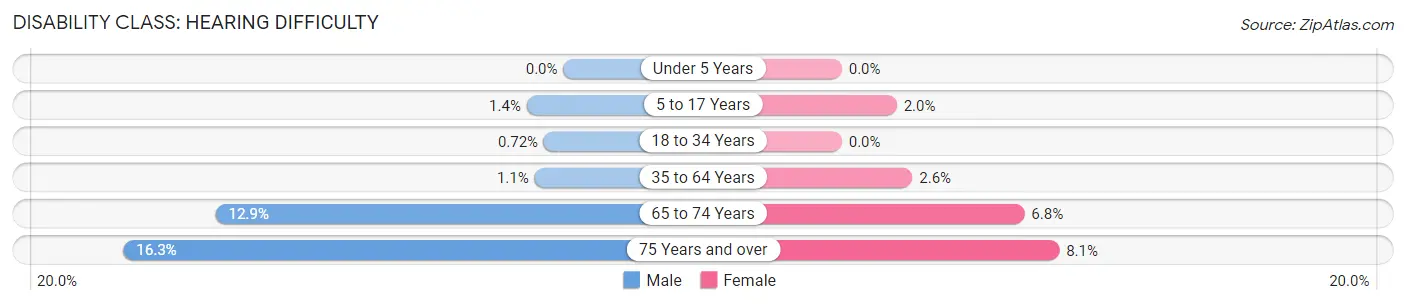
| Age Bracket | Male | Female |
| Under 5 Years | 0 (0.0%) | 0 (0.0%) |
| 5 to 17 Years | 8 (1.4%) | 10 (2.0%) |
| 18 to 34 Years | 4 (0.7%) | 0 (0.0%) |
| 35 to 64 Years | 13 (1.1%) | 31 (2.6%) |
| 65 to 74 Years | 51 (12.9%) | 24 (6.8%) |
| 75 Years and over | 32 (16.3%) | 33 (8.1%) |
Disability Class: Vision Difficulty
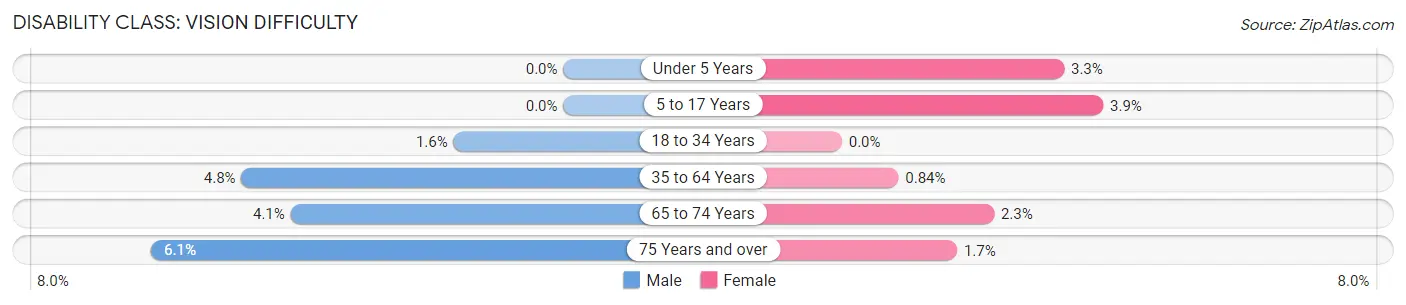
| Age Bracket | Male | Female |
| Under 5 Years | 0 (0.0%) | 6 (3.3%) |
| 5 to 17 Years | 0 (0.0%) | 19 (3.9%) |
| 18 to 34 Years | 9 (1.6%) | 0 (0.0%) |
| 35 to 64 Years | 58 (4.8%) | 10 (0.8%) |
| 65 to 74 Years | 16 (4.1%) | 8 (2.3%) |
| 75 Years and over | 12 (6.1%) | 7 (1.7%) |
Disability Class: Cognitive Difficulty
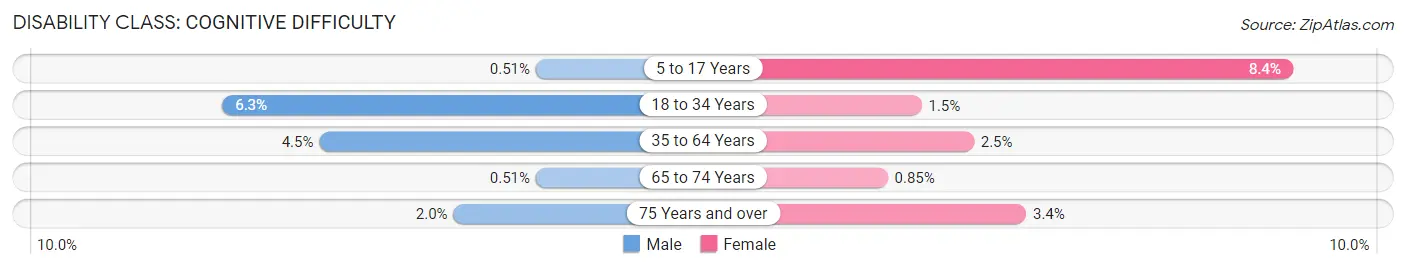
| Age Bracket | Male | Female |
| 5 to 17 Years | 3 (0.5%) | 41 (8.4%) |
| 18 to 34 Years | 35 (6.3%) | 7 (1.5%) |
| 35 to 64 Years | 55 (4.5%) | 29 (2.5%) |
| 65 to 74 Years | 2 (0.5%) | 3 (0.9%) |
| 75 Years and over | 4 (2.0%) | 14 (3.4%) |
Disability Class: Ambulatory Difficulty
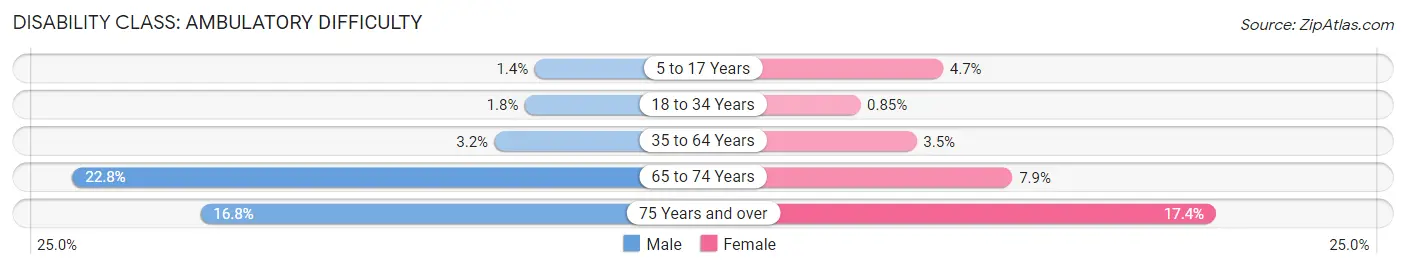
| Age Bracket | Male | Female |
| 5 to 17 Years | 8 (1.4%) | 23 (4.7%) |
| 18 to 34 Years | 10 (1.8%) | 4 (0.9%) |
| 35 to 64 Years | 39 (3.2%) | 41 (3.5%) |
| 65 to 74 Years | 90 (22.8%) | 28 (7.9%) |
| 75 Years and over | 33 (16.8%) | 71 (17.4%) |
Disability Class: Self-Care Difficulty
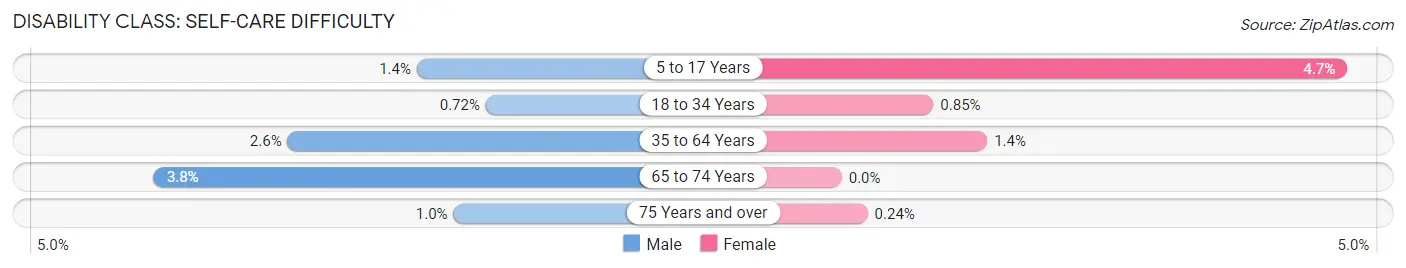
| Age Bracket | Male | Female |
| 5 to 17 Years | 8 (1.4%) | 23 (4.7%) |
| 18 to 34 Years | 4 (0.7%) | 4 (0.9%) |
| 35 to 64 Years | 31 (2.6%) | 16 (1.3%) |
| 65 to 74 Years | 15 (3.8%) | 0 (0.0%) |
| 75 Years and over | 2 (1.0%) | 1 (0.2%) |
Technology Access in Spink County
Computing Device Access in Spink County
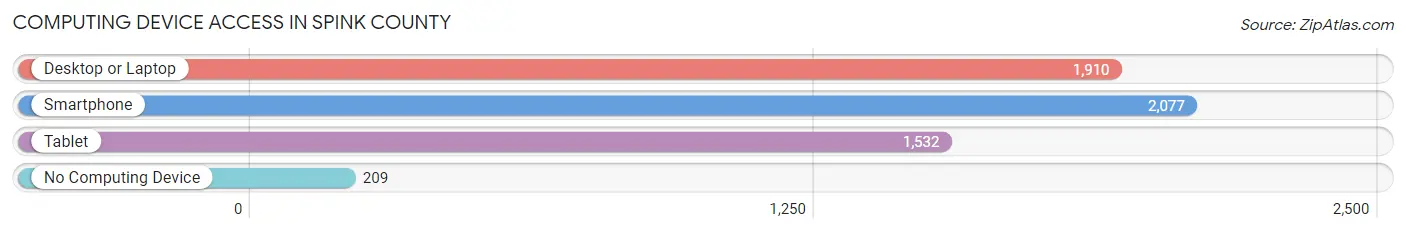
| Device Type | # Households | % Households |
| Desktop or Laptop | 1,910 | 75.6% |
| Smartphone | 2,077 | 82.2% |
| Tablet | 1,532 | 60.7% |
| No Computing Device | 209 | 8.3% |
| Total | 2,526 | 100.0% |
Internet Access in Spink County
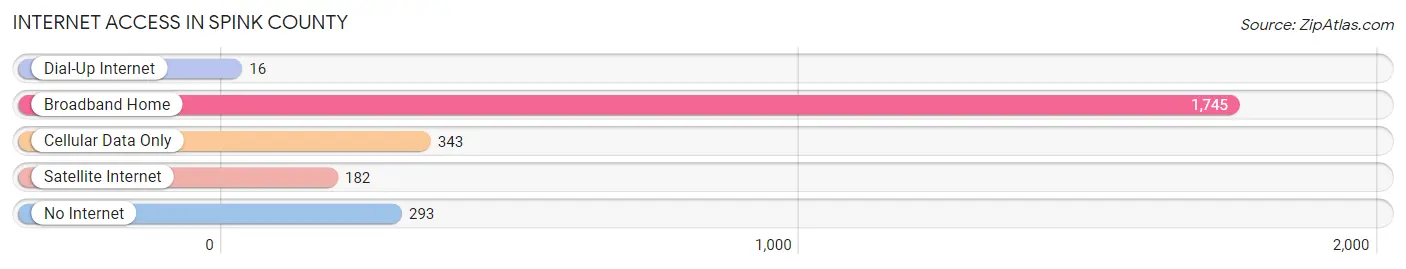
| Internet Type | # Households | % Households |
| Dial-Up Internet | 16 | 0.6% |
| Broadband Home | 1,745 | 69.1% |
| Cellular Data Only | 343 | 13.6% |
| Satellite Internet | 182 | 7.2% |
| No Internet | 293 | 11.6% |
| Total | 2,526 | 100.0% |
Spink County Summary
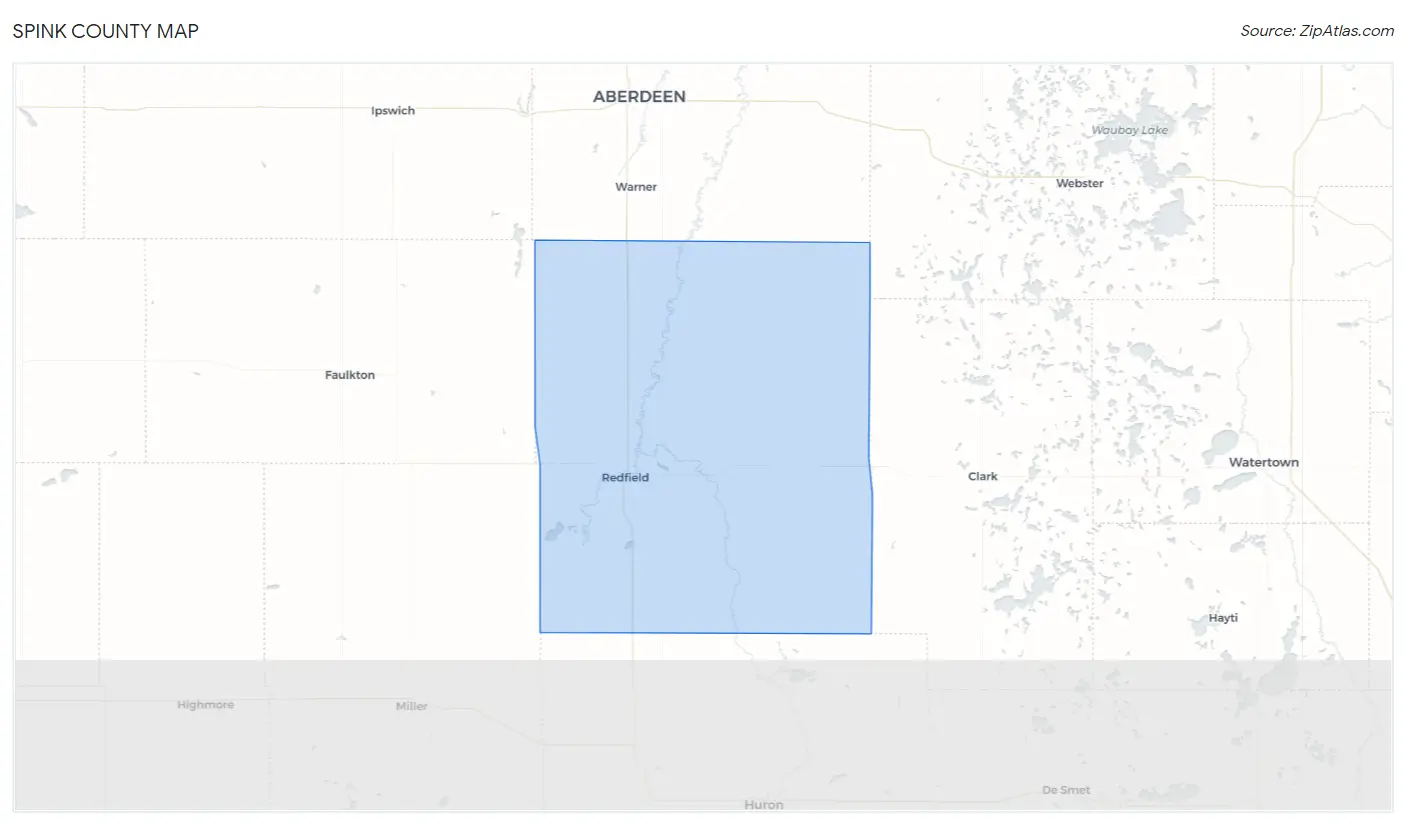
Spink County is located in the northeastern corner of South Dakota, and is bordered by Brown County to the north, Marshall County to the east, Faulk County to the south, and Edmunds County to the west. The county seat is Redfield, and the county was named after John Spink, a prominent early settler.
History
Spink County was established in 1873, and was originally part of Brown County. The county was named after John Spink, a prominent early settler who had arrived in the area in 1872. The first settlers in the county were mostly of German and Scandinavian descent, and the county was largely agricultural.
The county was officially organized in 1883, and the first county courthouse was built in Redfield in 1884. The county continued to grow throughout the late 19th and early 20th centuries, and by 1910, the population had reached 8,845.
Geography
Spink County covers an area of 1,072 square miles, and is located in the northeastern corner of South Dakota. The county is bordered by Brown County to the north, Marshall County to the east, Faulk County to the south, and Edmunds County to the west.
The county is mostly flat, with some rolling hills in the western part of the county. The James River flows through the county, and there are several small lakes and ponds scattered throughout the area. The county is mostly rural, with the majority of the population living in small towns and villages.
Economy
The economy of Spink County is largely based on agriculture. The county is home to several large farms, and the main crops grown in the area are corn, soybeans, wheat, and alfalfa. The county also has a strong livestock industry, with cattle, hogs, and sheep being raised in the area.
In addition to agriculture, the county also has a strong manufacturing sector. The county is home to several factories that produce a variety of products, including furniture, clothing, and food products.
Demographics
As of the 2010 census, the population of Spink County was 8,902. The population is largely white (97.2%), with small percentages of Native American (1.2%), African American (0.4%), and Asian (0.2%) residents. The median household income in the county is $45,945, and the median age is 43.
The county is served by several school districts, including Redfield School District, Doland School District, and Tulare School District. The county is also home to several higher education institutions, including South Dakota State University, Northern State University, and Presentation College.
Common Questions
What is the Total Population of Spink County?
Total Population of Spink County is 6,355.
What is the Total Male Population of Spink County?
Total Male Population of Spink County is 3,231.
What is the Total Female Population of Spink County?
Total Female Population of Spink County is 3,124.
What is the Ratio of Males per 100 Females in Spink County?
There are 103.43 Males per 100 Females in Spink County.
What is the Ratio of Females per 100 Males in Spink County?
There are 96.69 Females per 100 Males in Spink County.
What is the Median Population Age in Spink County?
Median Population Age in Spink County is 45.0 Years.
What is the Average Family Size in Spink County
Average Family Size in Spink County is 3.2 People.
What is the Average Household Size in Spink County
Average Household Size in Spink County is 2.4 People.
What is Per Capita Income in Spink County?
Per Capita income in Spink County is $37,138.
What is the Median Family Income in Spink County?
Median Family Income in Spink County is $89,952.
What is the Median Household income in Spink County?
Median Household Income in Spink County is $65,795.
What is Income or Wage Gap in Spink County?
Income or Wage Gap in Spink County is 29.4%.
Women in Spink County earn 70.6 cents for every dollar earned by a man.
What is Family Income Deficit in Spink County?
Family Income Deficit in Spink County is $11,768.
Families that are below poverty line in Spink County earn $11,768 less on average than the poverty threshold level.
What is Inequality or Gini Index in Spink County?
Inequality or Gini Index in Spink County is 0.46.
How Large is the Labor Force in Spink County?
There are 3,045 People in the Labor Forcein in Spink County.
What is the Percentage of People in the Labor Force in Spink County?
59.1% of People are in the Labor Force in Spink County.
What is the Unemployment Rate in Spink County?
Unemployment Rate in Spink County is 1.6%.