Sanborn County, SD
Sanborn County Overview
2,373
TOTAL POPULATION
1,188
MALE POPULATION
1,185
FEMALE POPULATION
100.25
MALES / 100 FEMALES
99.75
FEMALES / 100 MALES
39.3
MEDIAN AGE
3.2
AVG FAMILY SIZE
2.5
AVG HOUSEHOLD SIZE
$35,468
PER CAPITA INCOME
$83,750
AVG FAMILY INCOME
$65,806
AVG HOUSEHOLD INCOME
30.4%
WAGE / INCOME GAP [ % ]
69.6¢/ $1
WAGE / INCOME GAP [ $ ]
0.46
INEQUALITY / GINI INDEX
1,276
LABOR FORCE [ PEOPLE ]
71.8%
PERCENT IN LABOR FORCE
1.1%
UNEMPLOYMENT RATE
Sanborn County Area Codes
Race in Sanborn County
The most populous races in Sanborn County are White / Caucasian (2,240 | 94.4%), Hispanic or Latino (91 | 3.8%), and Two or more Races (87 | 3.7%).

| Race | # Population | % Population |
| Asian | 0 | 0.0% |
| Black / African American | 0 | 0.0% |
| Hawaiian / Pacific | 0 | 0.0% |
| Hispanic or Latino | 91 | 3.8% |
| Native / Alaskan | 5 | 0.2% |
| White / Caucasian | 2,240 | 94.4% |
| Two or more Races | 87 | 3.7% |
| Some other Race | 41 | 1.7% |
| Total | 2,373 | 100.0% |
Ancestry in Sanborn County
The most populous ancestries reported in Sanborn County are German (1,079 | 45.5%), Norwegian (314 | 13.2%), American (278 | 11.7%), Irish (214 | 9.0%), and English (179 | 7.5%), together accounting for 87.0% of all Sanborn County residents.

| Ancestry | # Population | % Population |
| African | 3 | 0.1% |
| American | 278 | 11.7% |
| Belgian | 24 | 1.0% |
| Cherokee | 2 | 0.1% |
| Czech | 45 | 1.9% |
| Danish | 37 | 1.6% |
| Dutch | 102 | 4.3% |
| English | 179 | 7.5% |
| European | 6 | 0.3% |
| French | 48 | 2.0% |
| French Canadian | 12 | 0.5% |
| German | 1,079 | 45.5% |
| Irish | 214 | 9.0% |
| Luxembourger | 2 | 0.1% |
| Mexican | 52 | 2.2% |
| Norwegian | 314 | 13.2% |
| Polish | 43 | 1.8% |
| Puerto Rican | 32 | 1.3% |
| Scandinavian | 21 | 0.9% |
| Scotch-Irish | 5 | 0.2% |
| Scottish | 29 | 1.2% |
| Sioux | 37 | 1.6% |
| Slovak | 1 | 0.0% |
| South American Indian | 22 | 0.9% |
| Spanish | 3 | 0.1% |
| Subsaharan African | 5 | 0.2% |
| Swedish | 108 | 4.5% |
| Swiss | 47 | 2.0% |
| Welsh | 14 | 0.6% | View All 29 Rows |
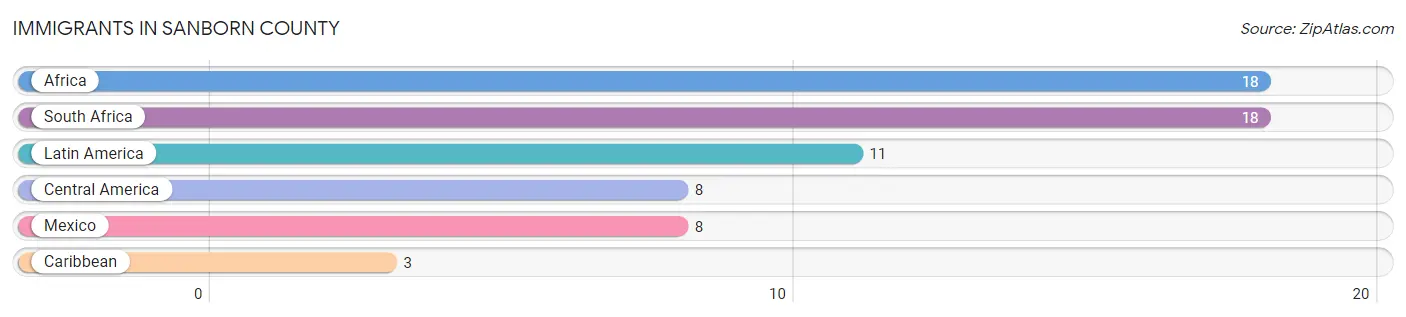
Immigrants in Sanborn County
The most numerous immigrant groups reported in Sanborn County came from Africa (18 | 0.8%), South Africa (18 | 0.8%), Latin America (11 | 0.5%), Central America (8 | 0.3%), and Mexico (8 | 0.3%), together accounting for 2.7% of all Sanborn County residents.
| Immigration Origin | # Population | % Population |
| Africa | 18 | 0.8% |
| Caribbean | 3 | 0.1% |
| Central America | 8 | 0.3% |
| Latin America | 11 | 0.5% |
| Mexico | 8 | 0.3% |
| South Africa | 18 | 0.8% | View All 6 Rows |
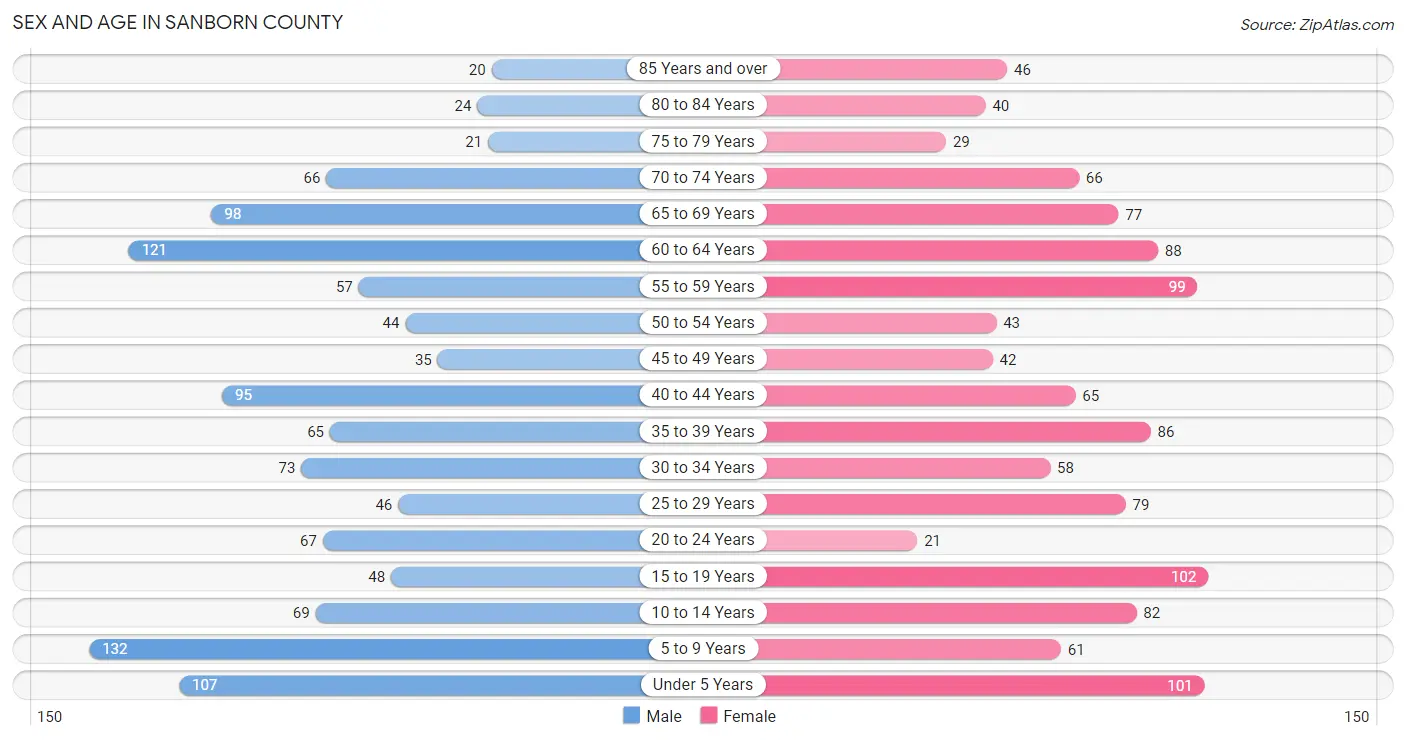
Sex and Age in Sanborn County
Sex and Age in Sanborn County
The most populous age groups in Sanborn County are 5 to 9 Years (132 | 11.1%) for men and 15 to 19 Years (102 | 8.6%) for women.
| Age Bracket | Male | Female |
| Under 5 Years | 107 (9.0%) | 101 (8.5%) |
| 5 to 9 Years | 132 (11.1%) | 61 (5.1%) |
| 10 to 14 Years | 69 (5.8%) | 82 (6.9%) |
| 15 to 19 Years | 48 (4.0%) | 102 (8.6%) |
| 20 to 24 Years | 67 (5.6%) | 21 (1.8%) |
| 25 to 29 Years | 46 (3.9%) | 79 (6.7%) |
| 30 to 34 Years | 73 (6.1%) | 58 (4.9%) |
| 35 to 39 Years | 65 (5.5%) | 86 (7.3%) |
| 40 to 44 Years | 95 (8.0%) | 65 (5.5%) |
| 45 to 49 Years | 35 (2.9%) | 42 (3.5%) |
| 50 to 54 Years | 44 (3.7%) | 43 (3.6%) |
| 55 to 59 Years | 57 (4.8%) | 99 (8.4%) |
| 60 to 64 Years | 121 (10.2%) | 88 (7.4%) |
| 65 to 69 Years | 98 (8.3%) | 77 (6.5%) |
| 70 to 74 Years | 66 (5.6%) | 66 (5.6%) |
| 75 to 79 Years | 21 (1.8%) | 29 (2.5%) |
| 80 to 84 Years | 24 (2.0%) | 40 (3.4%) |
| 85 Years and over | 20 (1.7%) | 46 (3.9%) |
| Total | 1,188 (100.0%) | 1,185 (100.0%) |
Families and Households in Sanborn County
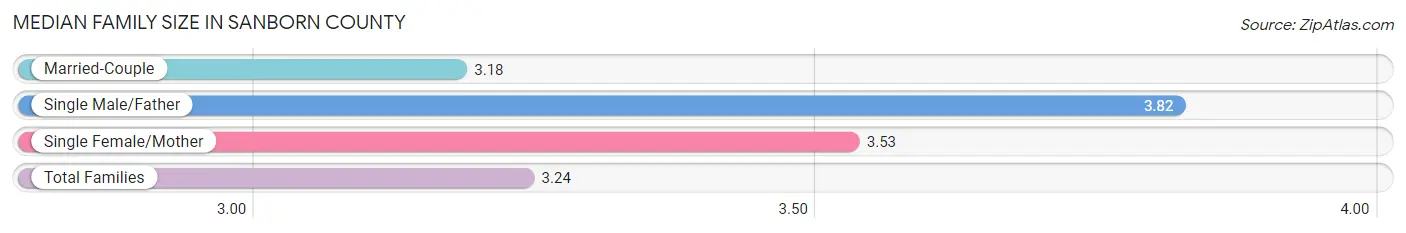
Median Family Size in Sanborn County
The median family size in Sanborn County is 3.24 persons per family, with single male/father families (17 | 3.0%) accounting for the largest median family size of 3.82 persons per family. On the other hand, married-couple families (484 | 85.1%) represent the smallest median family size with 3.18 persons per family.
| Family Type | # Families | Family Size |
| Married-Couple | 484 (85.1%) | 3.18 |
| Single Male/Father | 17 (3.0%) | 3.82 |
| Single Female/Mother | 68 (11.9%) | 3.53 |
| Total Families | 569 (100.0%) | 3.24 |
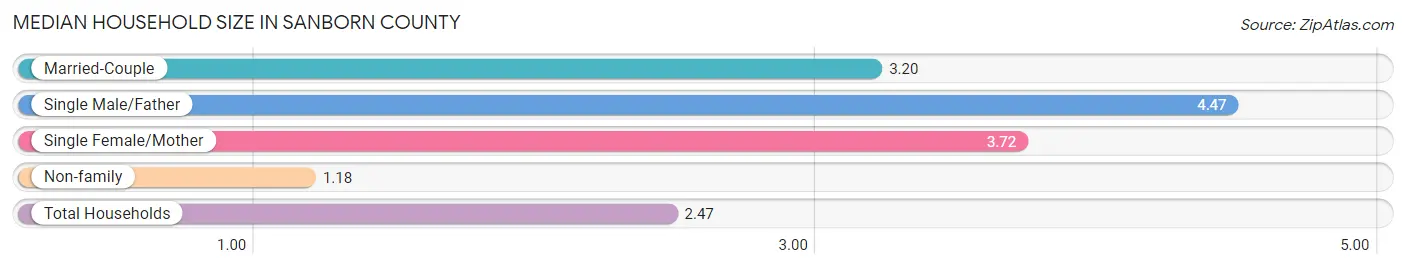
Median Household Size in Sanborn County
The median household size in Sanborn County is 2.47 persons per household, with single male/father households (17 | 1.8%) accounting for the largest median household size of 4.47 persons per household. non-family households (370 | 39.4%) represent the smallest median household size with 1.18 persons per household.
| Household Type | # Households | Household Size |
| Married-Couple | 484 (51.5%) | 3.20 |
| Single Male/Father | 17 (1.8%) | 4.47 |
| Single Female/Mother | 68 (7.2%) | 3.72 |
| Non-family | 370 (39.4%) | 1.18 |
| Total Households | 939 (100.0%) | 2.47 |
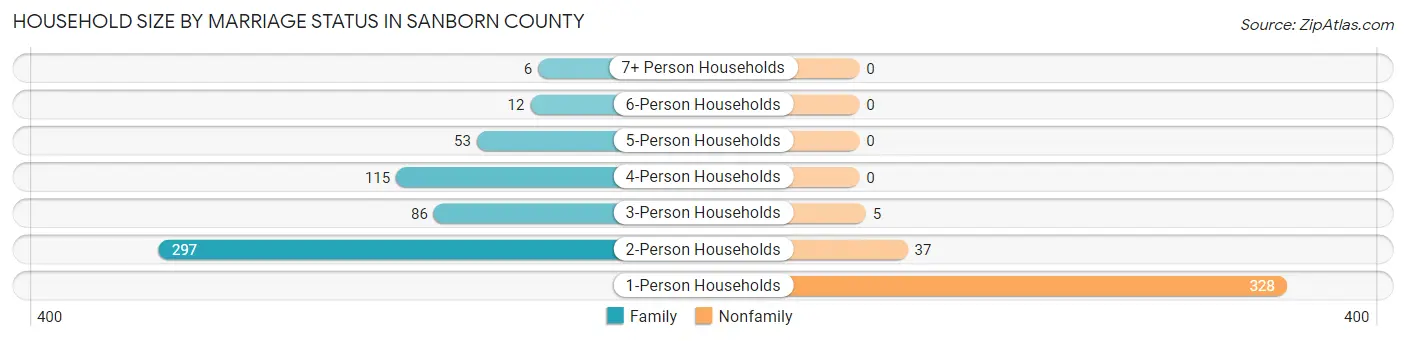
Household Size by Marriage Status in Sanborn County
Out of a total of 939 households in Sanborn County, 569 (60.6%) are family households, while 370 (39.4%) are nonfamily households. The most numerous type of family households are 2-person households, comprising 297, and the most common type of nonfamily households are 1-person households, comprising 328.
| Household Size | Family Households | Nonfamily Households |
| 1-Person Households | - | 328 (34.9%) |
| 2-Person Households | 297 (31.6%) | 37 (3.9%) |
| 3-Person Households | 86 (9.2%) | 5 (0.5%) |
| 4-Person Households | 115 (12.2%) | 0 (0.0%) |
| 5-Person Households | 53 (5.6%) | 0 (0.0%) |
| 6-Person Households | 12 (1.3%) | 0 (0.0%) |
| 7+ Person Households | 6 (0.6%) | 0 (0.0%) |
| Total | 569 (60.6%) | 370 (39.4%) |
Female Fertility in Sanborn County
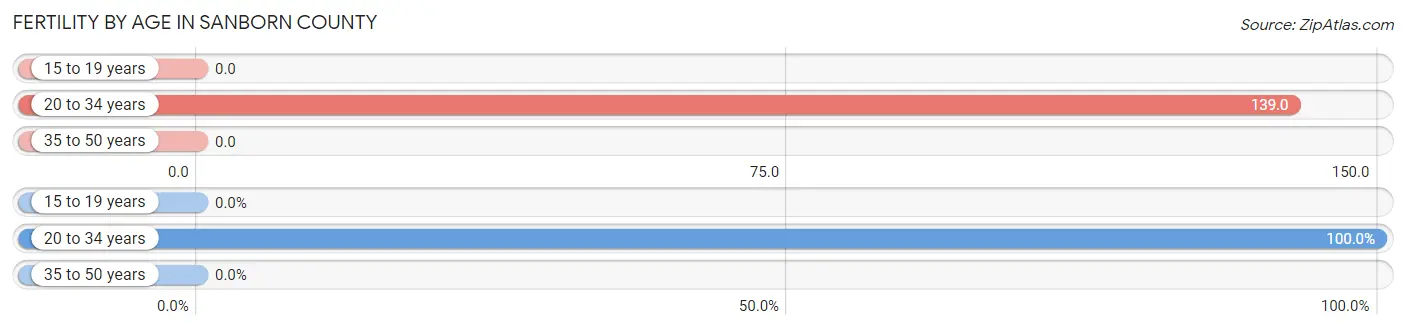
Fertility by Age in Sanborn County
Average fertility rate in Sanborn County is 48.0 births per 1,000 women. Women in the age bracket of 20 to 34 years have the highest fertility rate with 139.0 births per 1,000 women. Women in the age bracket of 20 to 34 years acount for 100.0% of all women with births.
| Age Bracket | Women with Births | Births / 1,000 Women |
| 15 to 19 years | 0 (0.0%) | 0.0 |
| 20 to 34 years | 22 (100.0%) | 139.0 |
| 35 to 50 years | 0 (0.0%) | 0.0 |
| Total | 22 (100.0%) | 48.0 |
Fertility by Age by Marriage Status in Sanborn County
63.6% of women with births (22) in Sanborn County are married. The highest percentage of unmarried women with births falls into 20 to 34 years age bracket with 36.4% of them unmarried at the time of birth, while the lowest percentage of unmarried women with births belong to 20 to 34 years age bracket with 36.4% of them unmarried.

| Age Bracket | Married | Unmarried |
| 15 to 19 years | 0 (0.0%) | 0 (0.0%) |
| 20 to 34 years | 14 (63.6%) | 8 (36.4%) |
| 35 to 50 years | 0 (0.0%) | 0 (0.0%) |
| Total | 14 (63.6%) | 8 (36.4%) |
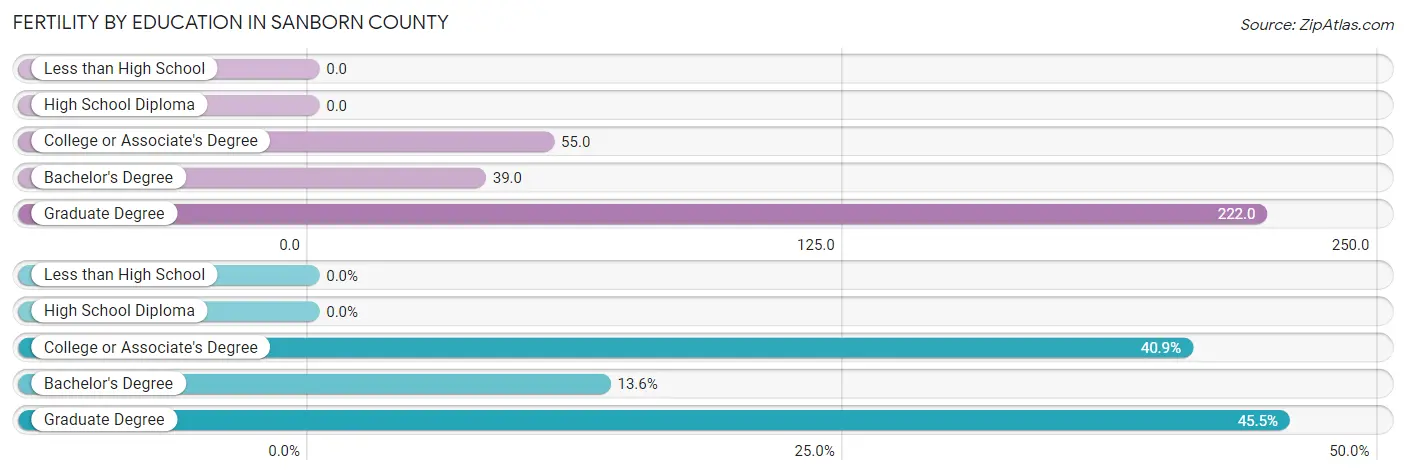
Fertility by Education in Sanborn County
| Educational Attainment | Women with Births | Births / 1,000 Women |
| Less than High School | 0 (0.0%) | 0.0 |
| High School Diploma | 0 (0.0%) | 0.0 |
| College or Associate's Degree | 9 (40.9%) | 55.0 |
| Bachelor's Degree | 3 (13.6%) | 39.0 |
| Graduate Degree | 10 (45.5%) | 222.0 |
| Total | 22 (100.0%) | 48.0 |
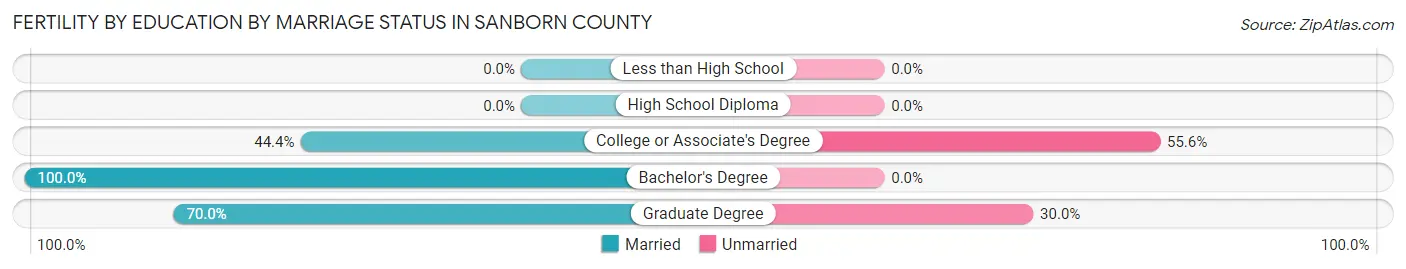
Fertility by Education by Marriage Status in Sanborn County
36.4% of women with births in Sanborn County are unmarried. Women with the educational attainment of bachelor's degree are most likely to be married with 100.0% of them married at childbirth, while women with the educational attainment of college or associate's degree are least likely to be married with 55.6% of them unmarried at childbirth.
| Educational Attainment | Married | Unmarried |
| Less than High School | 0 (0.0%) | 0 (0.0%) |
| High School Diploma | 0 (0.0%) | 0 (0.0%) |
| College or Associate's Degree | 4 (44.4%) | 5 (55.6%) |
| Bachelor's Degree | 3 (100.0%) | 0 (0.0%) |
| Graduate Degree | 7 (70.0%) | 3 (30.0%) |
| Total | 14 (63.6%) | 8 (36.4%) |
Income in Sanborn County
Income Overview in Sanborn County
Per Capita Income in Sanborn County is $35,468, while median incomes of families and households are $83,750 and $65,806 respectively.
| Characteristic | Number | Measure |
| Per Capita Income | 2,373 | $35,468 |
| Median Family Income | 569 | $83,750 |
| Mean Family Income | 569 | $110,275 |
| Median Household Income | 939 | $65,806 |
| Mean Household Income | 939 | $85,580 |
| Income Deficit | 569 | $0 |
| Wage / Income Gap (%) | 2,373 | 30.43% |
| Wage / Income Gap ($) | 2,373 | 69.57¢ per $1 |
| Gini / Inequality Index | 2,373 | 0.46 |
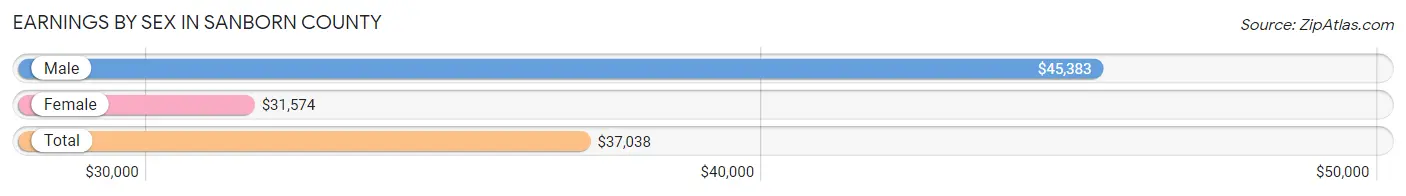
Earnings by Sex in Sanborn County
Average Earnings in Sanborn County are $37,038, $45,383 for men and $31,574 for women, a difference of 30.4%.
| Sex | Number | Average Earnings |
| Male | 665 (49.9%) | $45,383 |
| Female | 668 (50.1%) | $31,574 |
| Total | 1,333 (100.0%) | $37,038 |
Earnings by Sex by Income Bracket in Sanborn County
The most common earnings brackets in Sanborn County are $45,000 to $49,999 for men (104 | 15.6%) and $35,000 to $39,999 for women (70 | 10.5%).

| Income | Male | Female |
| $2,499 or less | 18 (2.7%) | 20 (3.0%) |
| $2,500 to $4,999 | 18 (2.7%) | 28 (4.2%) |
| $5,000 to $7,499 | 18 (2.7%) | 37 (5.5%) |
| $7,500 to $9,999 | 10 (1.5%) | 48 (7.2%) |
| $10,000 to $12,499 | 40 (6.0%) | 36 (5.4%) |
| $12,500 to $14,999 | 9 (1.3%) | 16 (2.4%) |
| $15,000 to $17,499 | 42 (6.3%) | 16 (2.4%) |
| $17,500 to $19,999 | 11 (1.7%) | 12 (1.8%) |
| $20,000 to $22,499 | 4 (0.6%) | 55 (8.2%) |
| $22,500 to $24,999 | 2 (0.3%) | 13 (1.9%) |
| $25,000 to $29,999 | 31 (4.7%) | 36 (5.4%) |
| $30,000 to $34,999 | 50 (7.5%) | 59 (8.8%) |
| $35,000 to $39,999 | 28 (4.2%) | 70 (10.5%) |
| $40,000 to $44,999 | 40 (6.0%) | 43 (6.4%) |
| $45,000 to $49,999 | 104 (15.6%) | 56 (8.4%) |
| $50,000 to $54,999 | 14 (2.1%) | 27 (4.0%) |
| $55,000 to $64,999 | 43 (6.5%) | 55 (8.2%) |
| $65,000 to $74,999 | 47 (7.1%) | 25 (3.7%) |
| $75,000 to $99,999 | 50 (7.5%) | 8 (1.2%) |
| $100,000+ | 86 (12.9%) | 8 (1.2%) |
| Total | 665 (100.0%) | 668 (100.0%) |
Earnings by Sex by Educational Attainment in Sanborn County
Average earnings in Sanborn County are $46,650 for men and $34,737 for women, a difference of 25.5%. Men with an educational attainment of graduate degree enjoy the highest average annual earnings of $58,125, while those with less than high school education earn the least with $43,333. Women with an educational attainment of graduate degree earn the most with the average annual earnings of $49,688, while those with high school diploma education have the smallest earnings of $26,250.

| Educational Attainment | Male Income | Female Income |
| Less than High School | $43,333 | $0 |
| High School Diploma | $46,550 | $26,250 |
| College or Associate's Degree | $53,125 | $41,544 |
| Bachelor's Degree | $47,917 | $34,750 |
| Graduate Degree | $58,125 | $49,688 |
| Total | $46,650 | $34,737 |
Family Income in Sanborn County
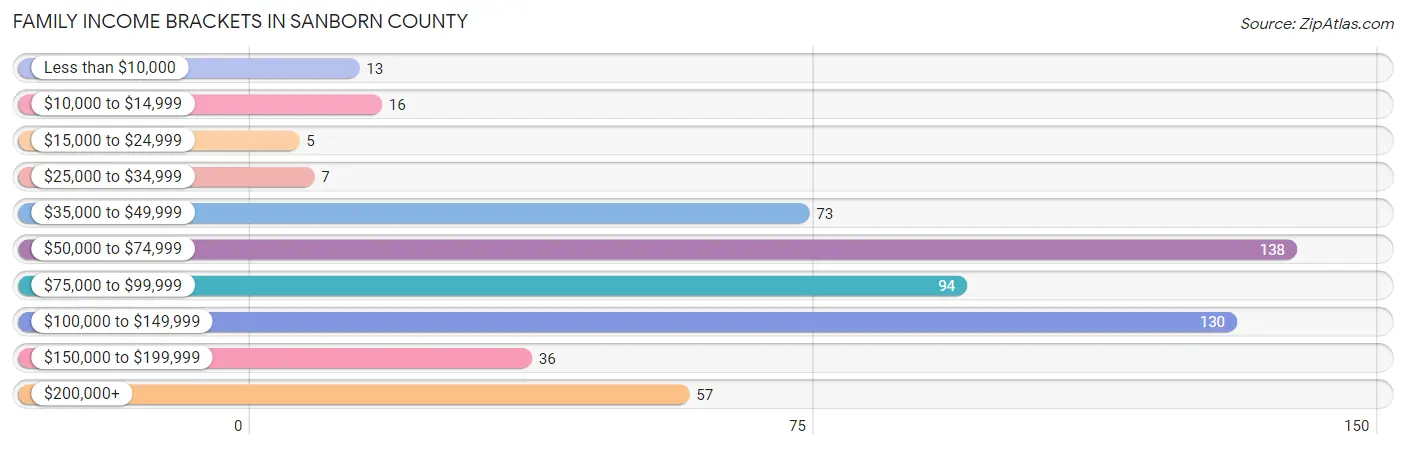
Family Income Brackets in Sanborn County
According to the Sanborn County family income data, there are 138 families falling into the $50,000 to $74,999 income range, which is the most common income bracket and makes up 24.2% of all families. Conversely, the $15,000 to $24,999 income bracket is the least frequent group with only 5 families (0.9%) belonging to this category.
| Income Bracket | # Families | % Families |
| Less than $10,000 | 13 | 2.3% |
| $10,000 to $14,999 | 16 | 2.8% |
| $15,000 to $24,999 | 5 | 0.9% |
| $25,000 to $34,999 | 7 | 1.2% |
| $35,000 to $49,999 | 73 | 12.8% |
| $50,000 to $74,999 | 138 | 24.3% |
| $75,000 to $99,999 | 94 | 16.5% |
| $100,000 to $149,999 | 130 | 22.8% |
| $150,000 to $199,999 | 36 | 6.3% |
| $200,000+ | 57 | 10.0% |
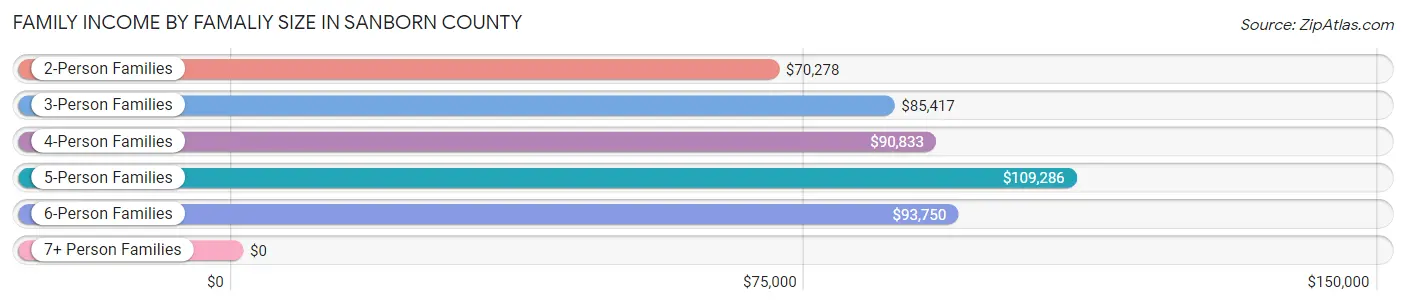
Family Income by Famaliy Size in Sanborn County
5-person families (52 | 9.1%) account for the highest median family income in Sanborn County with $109,286 per family, while 2-person families (310 | 54.5%) have the highest median income of $35,139 per family member.
| Income Bracket | # Families | Median Income |
| 2-Person Families | 310 (54.5%) | $70,278 |
| 3-Person Families | 85 (14.9%) | $85,417 |
| 4-Person Families | 104 (18.3%) | $90,833 |
| 5-Person Families | 52 (9.1%) | $109,286 |
| 6-Person Families | 12 (2.1%) | $93,750 |
| 7+ Person Families | 6 (1.1%) | $0 |
| Total | 569 (100.0%) | $83,750 |
Family Income by Number of Earners in Sanborn County
The median family income in Sanborn County is $83,750, with families comprising 2 earners (347) having the highest median family income of $98,203, while families with no earners (65) have the lowest median family income of $50,417, accounting for 61.0% and 11.4% of families, respectively.

| Number of Earners | # Families | Median Income |
| No Earners | 65 (11.4%) | $50,417 |
| 1 Earner | 116 (20.4%) | $66,333 |
| 2 Earners | 347 (61.0%) | $98,203 |
| 3+ Earners | 41 (7.2%) | $86,250 |
| Total | 569 (100.0%) | $83,750 |
Household Income in Sanborn County
Household Income Brackets in Sanborn County
With 180 households falling in the category, the $50,000 to $74,999 income range is the most frequent in Sanborn County, accounting for 19.2% of all households. In contrast, only 35 households (3.7%) fall into the less than $10,000 income bracket, making it the least populous group.

| Income Bracket | # Households | % Households |
| Less than $10,000 | 35 | 3.7% |
| $10,000 to $14,999 | 75 | 8.0% |
| $15,000 to $24,999 | 66 | 7.0% |
| $25,000 to $34,999 | 62 | 6.6% |
| $35,000 to $49,999 | 124 | 13.2% |
| $50,000 to $74,999 | 180 | 19.2% |
| $75,000 to $99,999 | 136 | 14.5% |
| $100,000 to $149,999 | 157 | 16.7% |
| $150,000 to $199,999 | 47 | 5.0% |
| $200,000+ | 57 | 6.1% |
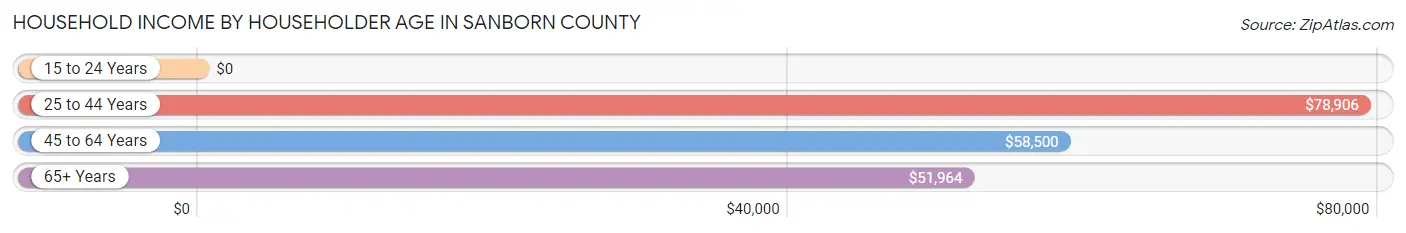
Household Income by Householder Age in Sanborn County
The median household income in Sanborn County is $65,806, with the highest median household income of $78,906 found in the 25 to 44 years age bracket for the primary householder. A total of 289 households (30.8%) fall into this category. Meanwhile, the 15 to 24 years age bracket for the primary householder has the lowest median household income of $0, with 41 households (4.4%) in this group.
| Income Bracket | # Households | Median Income |
| 15 to 24 Years | 41 (4.4%) | $0 |
| 25 to 44 Years | 289 (30.8%) | $78,906 |
| 45 to 64 Years | 302 (32.2%) | $58,500 |
| 65+ Years | 307 (32.7%) | $51,964 |
| Total | 939 (100.0%) | $65,806 |
Poverty in Sanborn County
Income Below Poverty by Sex and Age in Sanborn County
With 6.9% poverty level for males and 10.5% for females among the residents of Sanborn County, 55 to 64 year old males and 12 to 14 year old females are the most vulnerable to poverty, with 33 males (18.5%) and 16 females (36.4%) in their respective age groups living below the poverty level.
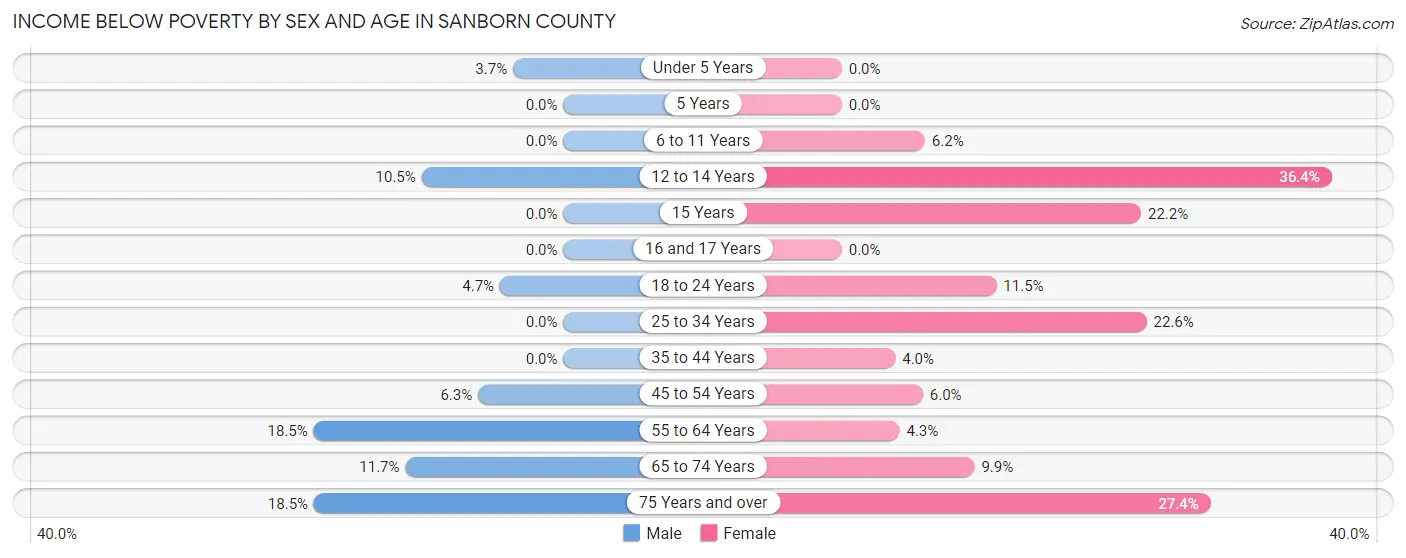
| Age Bracket | Male | Female |
| Under 5 Years | 4 (3.7%) | 0 (0.0%) |
| 5 Years | 0 (0.0%) | 0 (0.0%) |
| 6 to 11 Years | 0 (0.0%) | 5 (6.2%) |
| 12 to 14 Years | 6 (10.5%) | 16 (36.4%) |
| 15 Years | 0 (0.0%) | 6 (22.2%) |
| 16 and 17 Years | 0 (0.0%) | 0 (0.0%) |
| 18 to 24 Years | 4 (4.7%) | 7 (11.5%) |
| 25 to 34 Years | 0 (0.0%) | 31 (22.6%) |
| 35 to 44 Years | 0 (0.0%) | 6 (4.0%) |
| 45 to 54 Years | 5 (6.3%) | 5 (6.0%) |
| 55 to 64 Years | 33 (18.5%) | 8 (4.3%) |
| 65 to 74 Years | 19 (11.7%) | 13 (9.9%) |
| 75 Years and over | 10 (18.5%) | 23 (27.4%) |
| Total | 81 (6.9%) | 120 (10.5%) |
Income Above Poverty by Sex and Age in Sanborn County
According to the poverty statistics in Sanborn County, males aged 5 years and females aged under 5 years are the age groups that are most secure financially, with 100.0% of males and 100.0% of females in these age groups living above the poverty line.
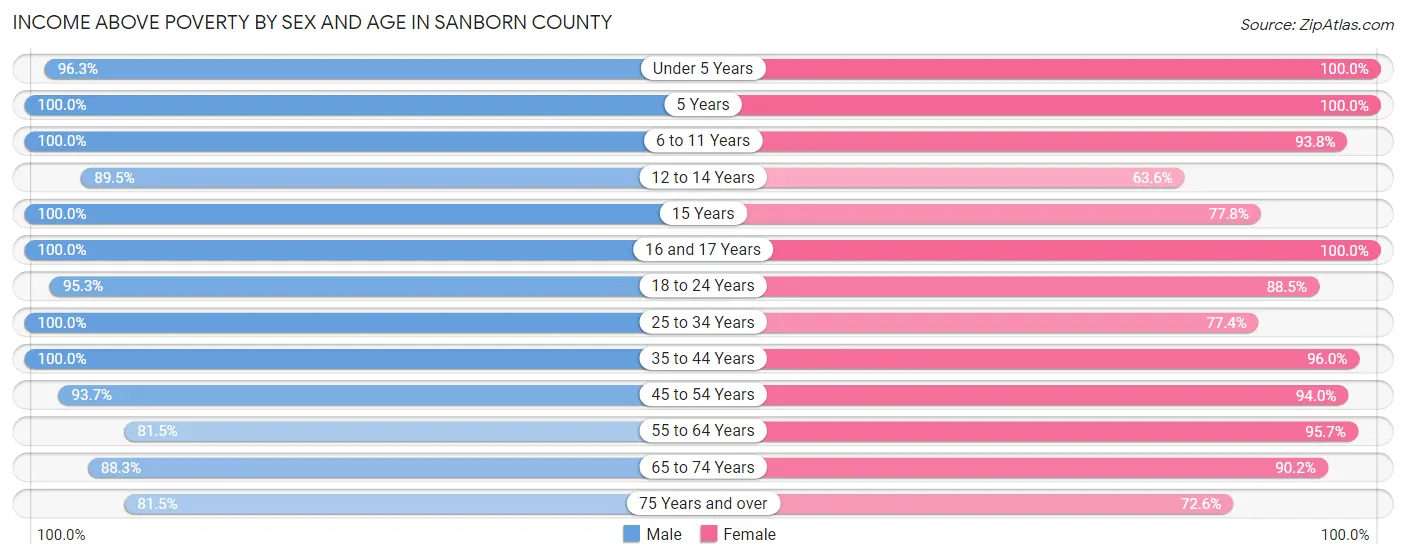
| Age Bracket | Male | Female |
| Under 5 Years | 103 (96.3%) | 101 (100.0%) |
| 5 Years | 21 (100.0%) | 15 (100.0%) |
| 6 to 11 Years | 117 (100.0%) | 76 (93.8%) |
| 12 to 14 Years | 51 (89.5%) | 28 (63.6%) |
| 15 Years | 17 (100.0%) | 21 (77.8%) |
| 16 and 17 Years | 13 (100.0%) | 35 (100.0%) |
| 18 to 24 Years | 81 (95.3%) | 54 (88.5%) |
| 25 to 34 Years | 119 (100.0%) | 106 (77.4%) |
| 35 to 44 Years | 160 (100.0%) | 145 (96.0%) |
| 45 to 54 Years | 74 (93.7%) | 78 (94.0%) |
| 55 to 64 Years | 145 (81.5%) | 179 (95.7%) |
| 65 to 74 Years | 143 (88.3%) | 119 (90.1%) |
| 75 Years and over | 44 (81.5%) | 61 (72.6%) |
| Total | 1,088 (93.1%) | 1,018 (89.5%) |
Income Below Poverty Among Married-Couple Families in Sanborn County
The poverty statistics for married-couple families in Sanborn County show that 3.9% or 19 of the total 484 families live below the poverty line. Families with no children have the highest poverty rate of 5.8%, comprising of 17 families. On the other hand, families with 1 or 2 children have the lowest poverty rate of 0.0%, which includes 0 families.
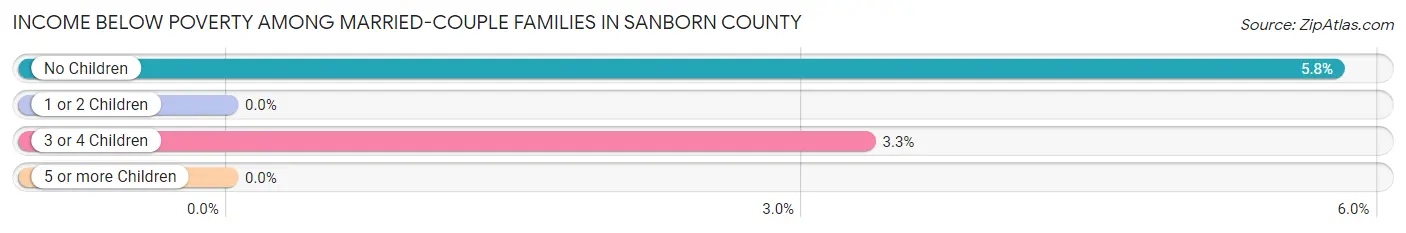
| Children | Above Poverty | Below Poverty |
| No Children | 277 (94.2%) | 17 (5.8%) |
| 1 or 2 Children | 124 (100.0%) | 0 (0.0%) |
| 3 or 4 Children | 58 (96.7%) | 2 (3.3%) |
| 5 or more Children | 6 (100.0%) | 0 (0.0%) |
| Total | 465 (96.1%) | 19 (3.9%) |
Income Below Poverty Among Single-Parent Households in Sanborn County
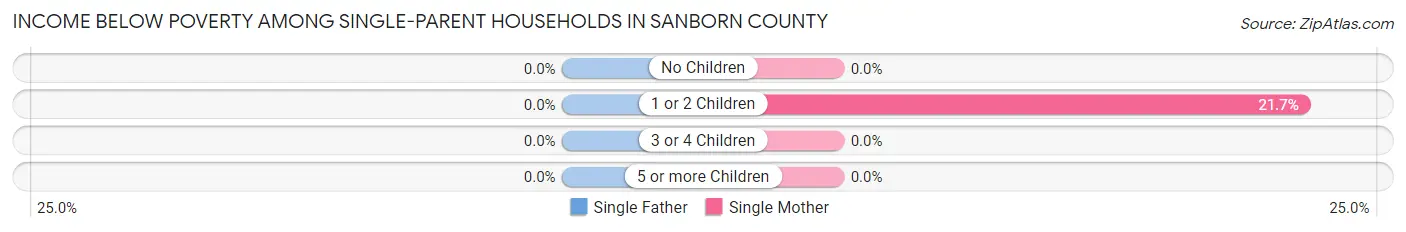
| Children | Single Father | Single Mother |
| No Children | 0 (0.0%) | 0 (0.0%) |
| 1 or 2 Children | 0 (0.0%) | 10 (21.7%) |
| 3 or 4 Children | 0 (0.0%) | 0 (0.0%) |
| 5 or more Children | 0 (0.0%) | 0 (0.0%) |
| Total | 0 (0.0%) | 10 (14.7%) |
Income Below Poverty Among Married-Couple vs Single-Parent Households in Sanborn County
The poverty data for Sanborn County shows that 19 of the married-couple family households (3.9%) and 10 of the single-parent households (11.8%) are living below the poverty level. Within the married-couple family households, those with no children have the highest poverty rate, with 17 households (5.8%) falling below the poverty line. Among the single-parent households, those with 1 or 2 children have the highest poverty rate, with 10 household (17.2%) living below poverty.
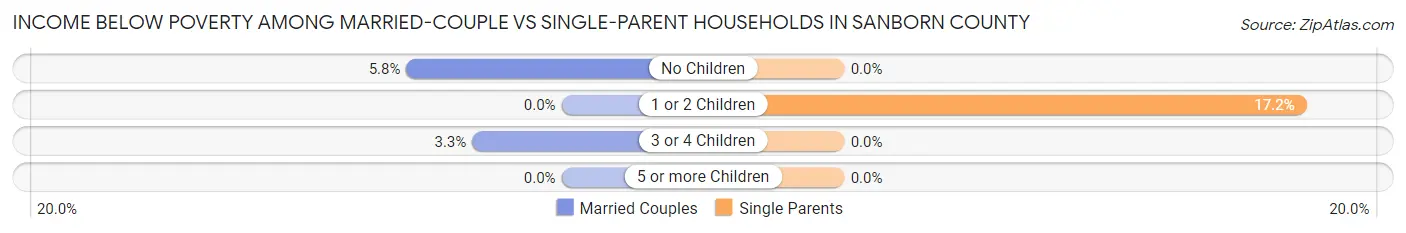
| Children | Married-Couple Families | Single-Parent Households |
| No Children | 17 (5.8%) | 0 (0.0%) |
| 1 or 2 Children | 0 (0.0%) | 10 (17.2%) |
| 3 or 4 Children | 2 (3.3%) | 0 (0.0%) |
| 5 or more Children | 0 (0.0%) | 0 (0.0%) |
| Total | 19 (3.9%) | 10 (11.8%) |
Employment Characteristics in Sanborn County
Employment by Class of Employer in Sanborn County
Among the 1,225 employed individuals in Sanborn County, private company employees (636 | 51.9%), self-employed (not incorporated) (236 | 19.3%), and local government employees (134 | 10.9%) make up the most common classes of employment.

| Employer Class | # Employees | % Employees |
| Private Company Employees | 636 | 51.9% |
| Self-Employed (Incorporated) | 78 | 6.4% |
| Self-Employed (Not Incorporated) | 236 | 19.3% |
| Not-for-profit Organizations | 71 | 5.8% |
| Local Government Employees | 134 | 10.9% |
| State Government Employees | 30 | 2.5% |
| Federal Government Employees | 25 | 2.0% |
| Unpaid Family Workers | 15 | 1.2% |
| Total | 1,225 | 100.0% |
Employment Status by Age in Sanborn County
According to the labor force statistics for Sanborn County, out of the total population over 16 years of age (1,777), 71.8% or 1,276 individuals are in the labor force, with 1.1% or 14 of them unemployed. The age group with the highest labor force participation rate is 20 to 24 years, with 100.0% or 88 individuals in the labor force. Within the labor force, the 30 to 34 years age range has the highest percentage of unemployed individuals, with 4.7% or 6 of them being unemployed.
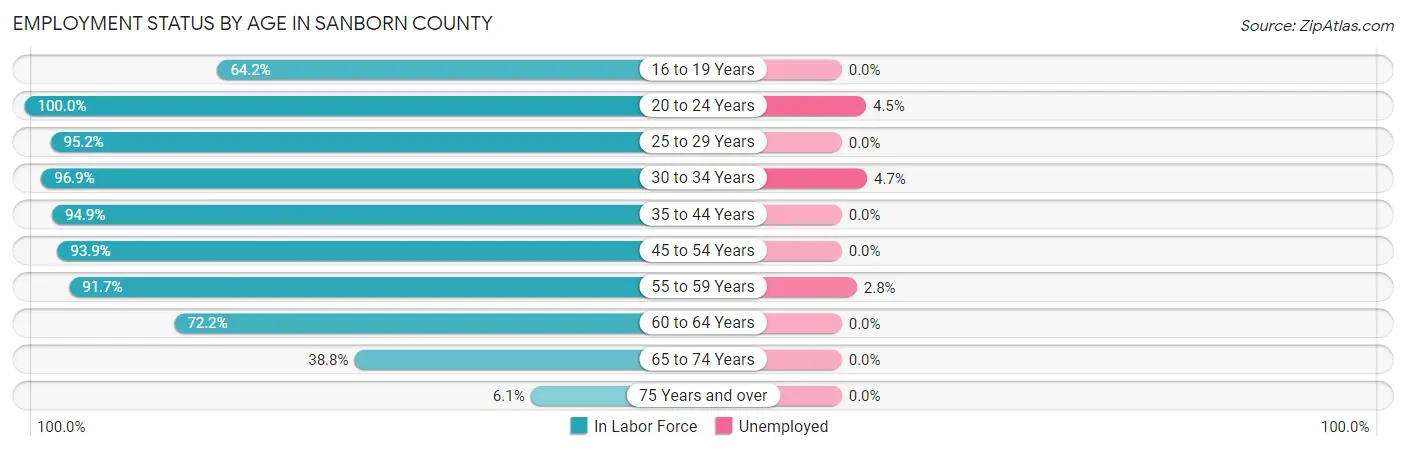
| Age Bracket | In Labor Force | Unemployed |
| 16 to 19 Years | 68 (64.2%) | 0 (0.0%) |
| 20 to 24 Years | 88 (100.0%) | 4 (4.5%) |
| 25 to 29 Years | 119 (95.2%) | 0 (0.0%) |
| 30 to 34 Years | 127 (96.9%) | 6 (4.7%) |
| 35 to 44 Years | 295 (94.9%) | 0 (0.0%) |
| 45 to 54 Years | 154 (93.9%) | 0 (0.0%) |
| 55 to 59 Years | 143 (91.7%) | 4 (2.8%) |
| 60 to 64 Years | 151 (72.2%) | 0 (0.0%) |
| 65 to 74 Years | 119 (38.8%) | 0 (0.0%) |
| 75 Years and over | 11 (6.1%) | 0 (0.0%) |
| Total | 1,276 (71.8%) | 14 (1.1%) |
Employment Status by Educational Attainment in Sanborn County
According to labor force statistics for Sanborn County, 90.2% of individuals (989) out of the total population between 25 and 64 years of age (1,096) are in the labor force, with 1.0% or 10 of them being unemployed. The group with the highest labor force participation rate are those with the educational attainment of bachelor's degree or higher, with 95.3% or 223 individuals in the labor force. Within the labor force, individuals with college / associate degree education have the highest percentage of unemployment, with 1.8% or 6 of them being unemployed.
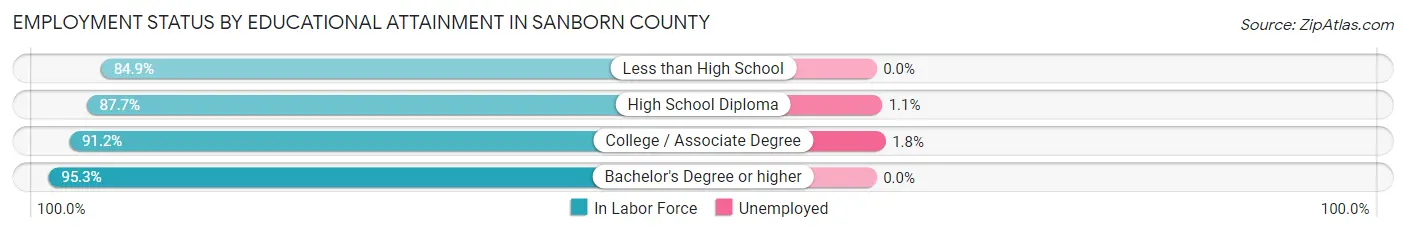
| Educational Attainment | In Labor Force | Unemployed |
| Less than High School | 79 (84.9%) | 0 (0.0%) |
| High School Diploma | 356 (87.7%) | 4 (1.1%) |
| College / Associate Degree | 331 (91.2%) | 7 (1.8%) |
| Bachelor's Degree or higher | 223 (95.3%) | 0 (0.0%) |
| Total | 989 (90.2%) | 11 (1.0%) |
Employment Occupations by Sex in Sanborn County
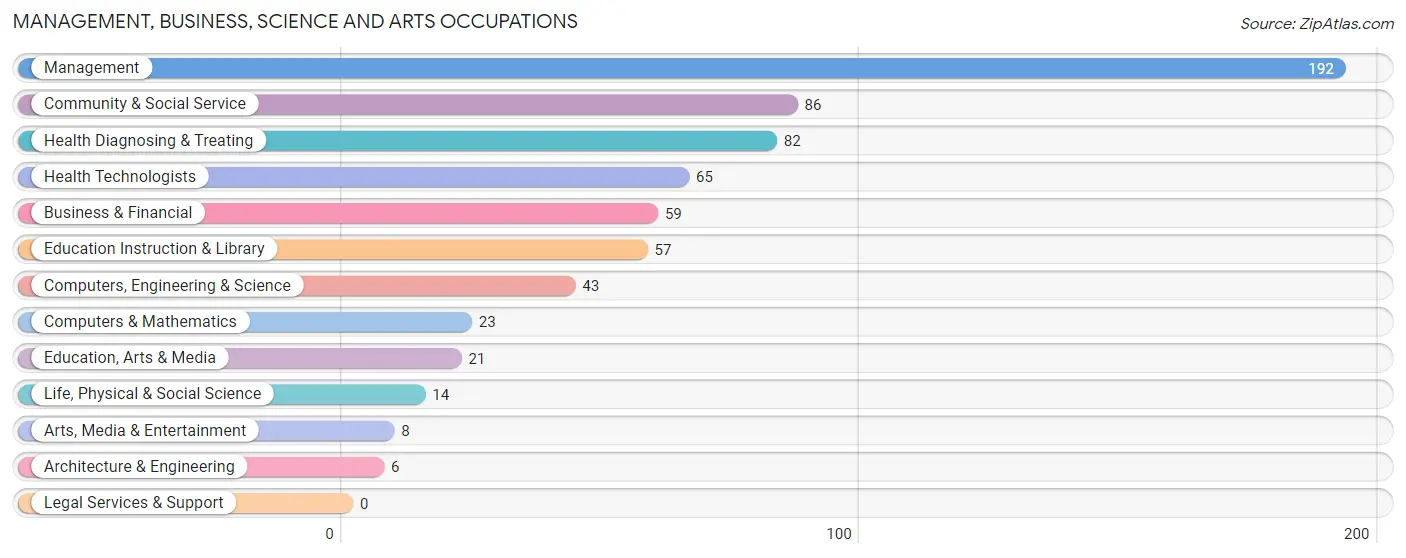
Management, Business, Science and Arts Occupations
The most common Management, Business, Science and Arts occupations in Sanborn County are Management (192 | 15.3%), Community & Social Service (86 | 6.9%), Health Diagnosing & Treating (82 | 6.5%), Health Technologists (65 | 5.2%), and Business & Financial (59 | 4.7%).
Management, Business, Science and Arts Occupations by Sex
Within the Management, Business, Science and Arts occupations in Sanborn County, the most male-oriented occupations are Arts, Media & Entertainment (100.0%), Architecture & Engineering (83.3%), and Computers & Mathematics (82.6%), while the most female-oriented occupations are Health Diagnosing & Treating (100.0%), Health Technologists (100.0%), and Education Instruction & Library (77.2%).
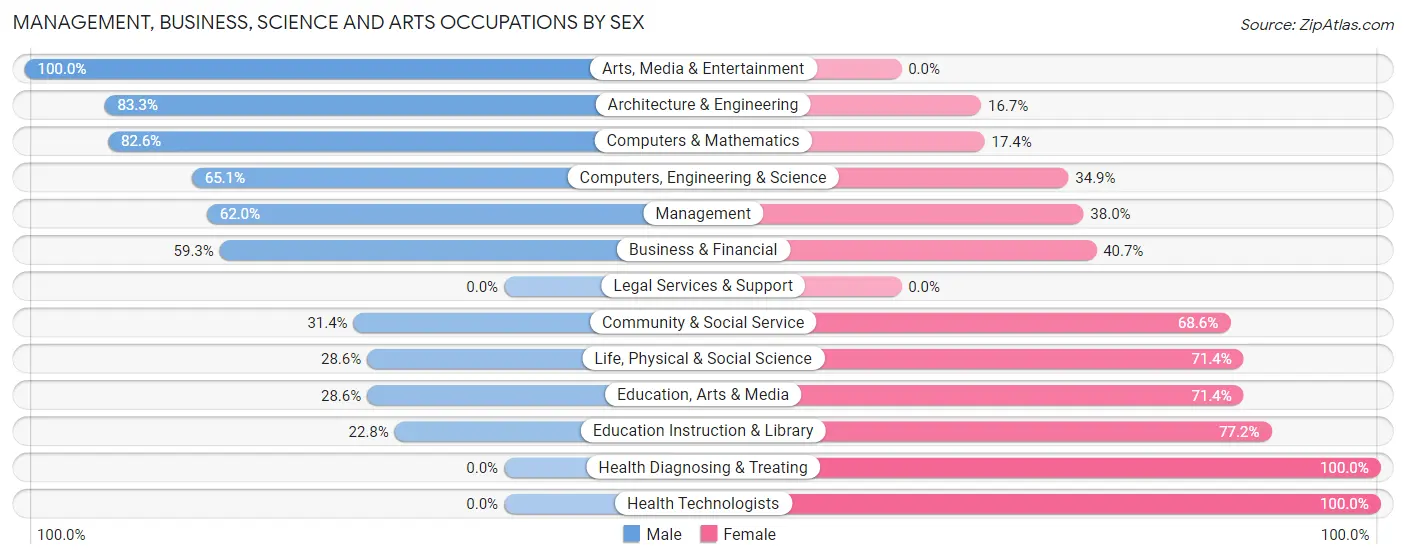
| Occupation | Male | Female |
| Management | 119 (62.0%) | 73 (38.0%) |
| Business & Financial | 35 (59.3%) | 24 (40.7%) |
| Computers, Engineering & Science | 28 (65.1%) | 15 (34.9%) |
| Computers & Mathematics | 19 (82.6%) | 4 (17.4%) |
| Architecture & Engineering | 5 (83.3%) | 1 (16.7%) |
| Life, Physical & Social Science | 4 (28.6%) | 10 (71.4%) |
| Community & Social Service | 27 (31.4%) | 59 (68.6%) |
| Education, Arts & Media | 6 (28.6%) | 15 (71.4%) |
| Legal Services & Support | 0 (0.0%) | 0 (0.0%) |
| Education Instruction & Library | 13 (22.8%) | 44 (77.2%) |
| Arts, Media & Entertainment | 8 (100.0%) | 0 (0.0%) |
| Health Diagnosing & Treating | 0 (0.0%) | 82 (100.0%) |
| Health Technologists | 0 (0.0%) | 65 (100.0%) |
| Total (Category) | 209 (45.2%) | 253 (54.8%) |
| Total (Overall) | 624 (49.7%) | 631 (50.3%) |
Services Occupations
The most common Services occupations in Sanborn County are Food Preparation & Serving (82 | 6.5%), Cleaning & Maintenance (44 | 3.5%), Healthcare Support (18 | 1.4%), Personal Care & Service (18 | 1.4%), and Security & Protection (7 | 0.6%).

Services Occupations by Sex
Within the Services occupations in Sanborn County, the most male-oriented occupations are Security & Protection (100.0%), Law Enforcement (100.0%), and Cleaning & Maintenance (45.5%), while the most female-oriented occupations are Healthcare Support (83.3%), Personal Care & Service (83.3%), and Food Preparation & Serving (67.1%).
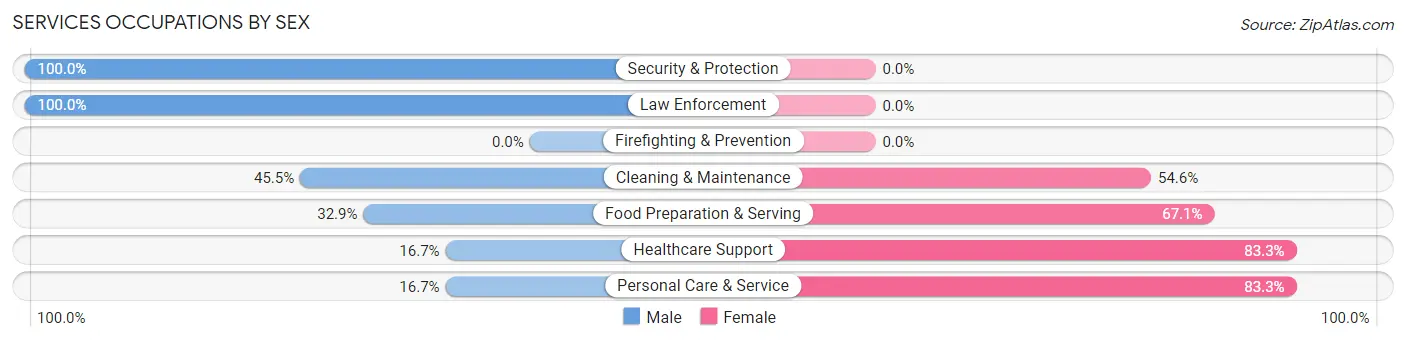
| Occupation | Male | Female |
| Healthcare Support | 3 (16.7%) | 15 (83.3%) |
| Security & Protection | 7 (100.0%) | 0 (0.0%) |
| Firefighting & Prevention | 0 (0.0%) | 0 (0.0%) |
| Law Enforcement | 7 (100.0%) | 0 (0.0%) |
| Food Preparation & Serving | 27 (32.9%) | 55 (67.1%) |
| Cleaning & Maintenance | 20 (45.5%) | 24 (54.5%) |
| Personal Care & Service | 3 (16.7%) | 15 (83.3%) |
| Total (Category) | 60 (35.5%) | 109 (64.5%) |
| Total (Overall) | 624 (49.7%) | 631 (50.3%) |
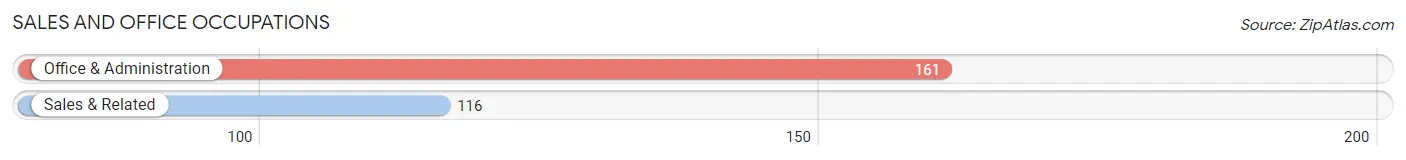
Sales and Office Occupations
The most common Sales and Office occupations in Sanborn County are Office & Administration (161 | 12.8%), and Sales & Related (116 | 9.2%).
Sales and Office Occupations by Sex
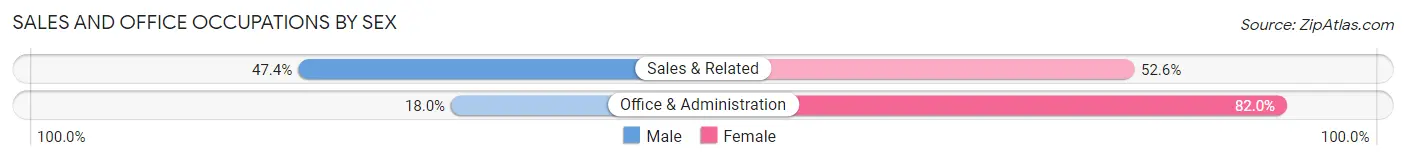
| Occupation | Male | Female |
| Sales & Related | 55 (47.4%) | 61 (52.6%) |
| Office & Administration | 29 (18.0%) | 132 (82.0%) |
| Total (Category) | 84 (30.3%) | 193 (69.7%) |
| Total (Overall) | 624 (49.7%) | 631 (50.3%) |
Natural Resources, Construction and Maintenance Occupations
The most common Natural Resources, Construction and Maintenance occupations in Sanborn County are Construction & Extraction (81 | 6.5%), Installation, Maintenance & Repair (53 | 4.2%), and Farming, Fishing & Forestry (48 | 3.8%).
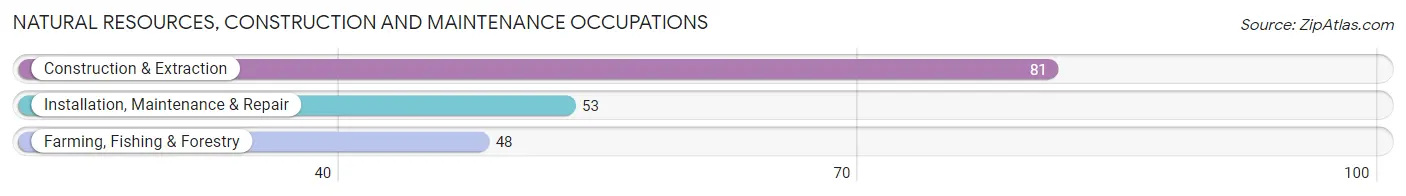
Natural Resources, Construction and Maintenance Occupations by Sex
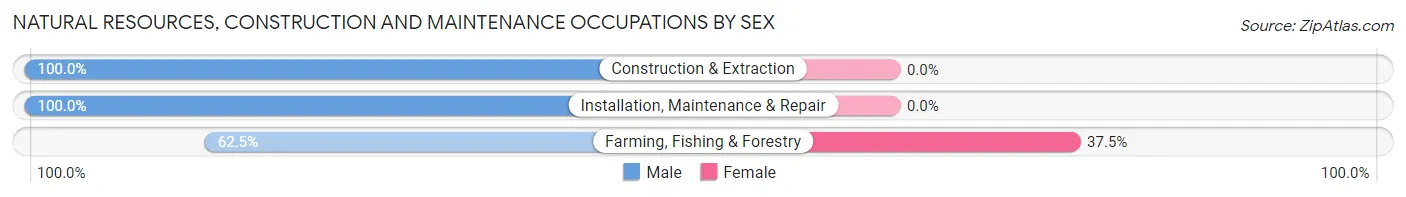
| Occupation | Male | Female |
| Farming, Fishing & Forestry | 30 (62.5%) | 18 (37.5%) |
| Construction & Extraction | 81 (100.0%) | 0 (0.0%) |
| Installation, Maintenance & Repair | 53 (100.0%) | 0 (0.0%) |
| Total (Category) | 164 (90.1%) | 18 (9.9%) |
| Total (Overall) | 624 (49.7%) | 631 (50.3%) |
Production, Transportation and Moving Occupations
The most common Production, Transportation and Moving occupations in Sanborn County are Transportation (69 | 5.5%), Production (65 | 5.2%), and Material Moving (31 | 2.5%).
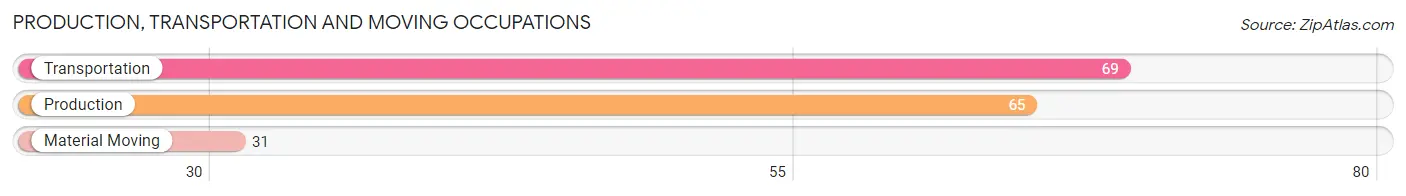
Production, Transportation and Moving Occupations by Sex
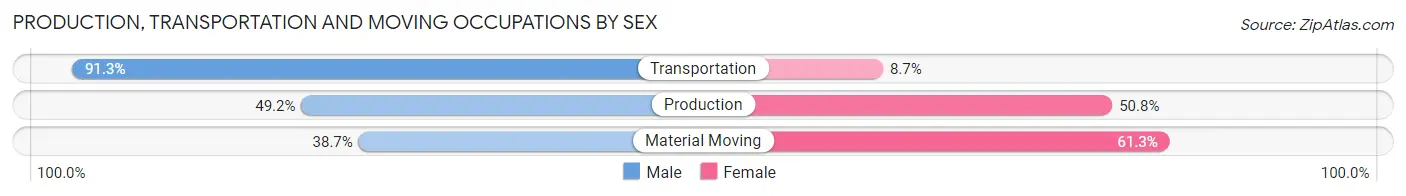
| Occupation | Male | Female |
| Production | 32 (49.2%) | 33 (50.8%) |
| Transportation | 63 (91.3%) | 6 (8.7%) |
| Material Moving | 12 (38.7%) | 19 (61.3%) |
| Total (Category) | 107 (64.8%) | 58 (35.1%) |
| Total (Overall) | 624 (49.7%) | 631 (50.3%) |
Employment Industries by Sex in Sanborn County
Employment Industries in Sanborn County
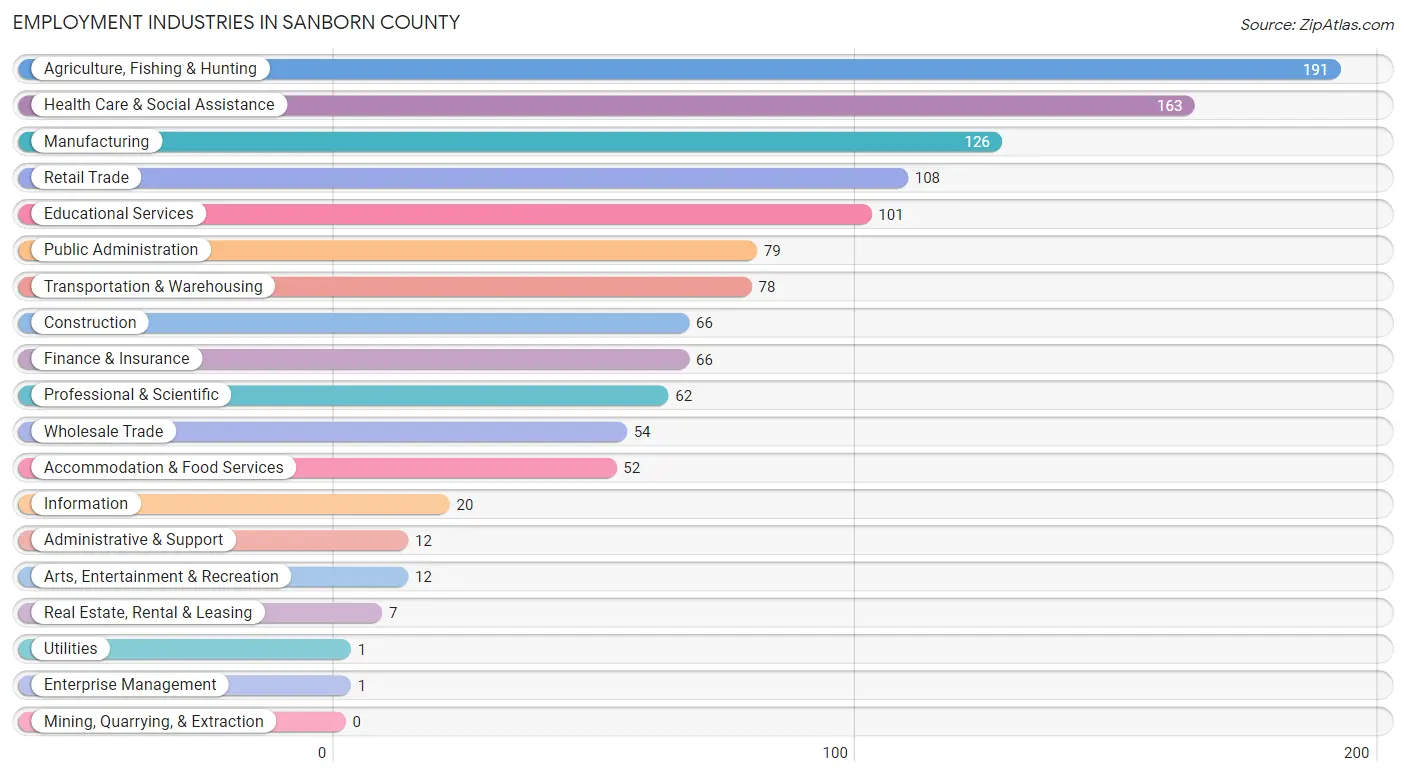
The major employment industries in Sanborn County include Agriculture, Fishing & Hunting (191 | 15.2%), Health Care & Social Assistance (163 | 13.0%), Manufacturing (126 | 10.0%), Retail Trade (108 | 8.6%), and Educational Services (101 | 8.1%).
Employment Industries by Sex in Sanborn County
The Sanborn County industries that see more men than women are Wholesale Trade (100.0%), Utilities (100.0%), and Real Estate, Rental & Leasing (100.0%), whereas the industries that tend to have a higher number of women are Enterprise Management (100.0%), Finance & Insurance (93.9%), and Accommodation & Food Services (84.6%).
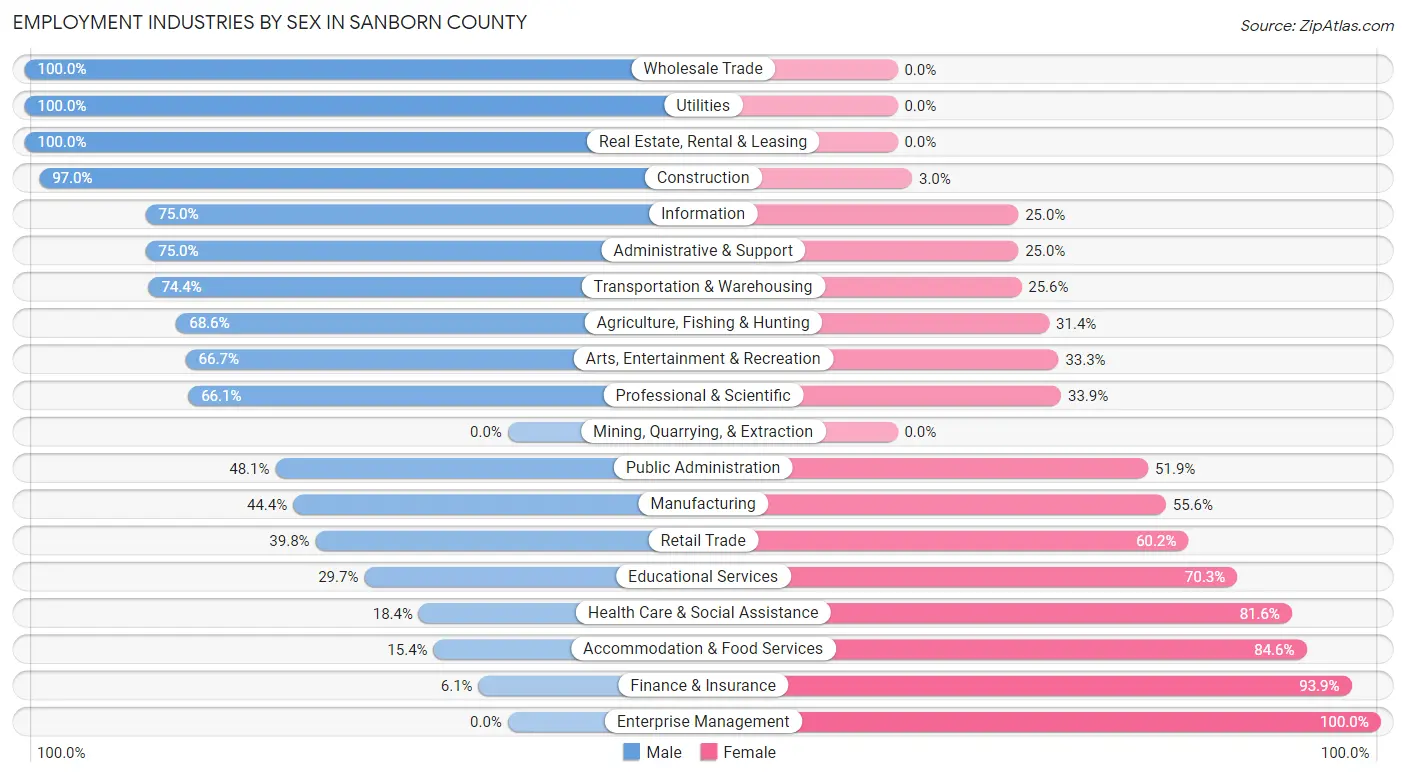
| Industry | Male | Female |
| Agriculture, Fishing & Hunting | 131 (68.6%) | 60 (31.4%) |
| Mining, Quarrying, & Extraction | 0 (0.0%) | 0 (0.0%) |
| Construction | 64 (97.0%) | 2 (3.0%) |
| Manufacturing | 56 (44.4%) | 70 (55.6%) |
| Wholesale Trade | 54 (100.0%) | 0 (0.0%) |
| Retail Trade | 43 (39.8%) | 65 (60.2%) |
| Transportation & Warehousing | 58 (74.4%) | 20 (25.6%) |
| Utilities | 1 (100.0%) | 0 (0.0%) |
| Information | 15 (75.0%) | 5 (25.0%) |
| Finance & Insurance | 4 (6.1%) | 62 (93.9%) |
| Real Estate, Rental & Leasing | 7 (100.0%) | 0 (0.0%) |
| Professional & Scientific | 41 (66.1%) | 21 (33.9%) |
| Enterprise Management | 0 (0.0%) | 1 (100.0%) |
| Administrative & Support | 9 (75.0%) | 3 (25.0%) |
| Educational Services | 30 (29.7%) | 71 (70.3%) |
| Health Care & Social Assistance | 30 (18.4%) | 133 (81.6%) |
| Arts, Entertainment & Recreation | 8 (66.7%) | 4 (33.3%) |
| Accommodation & Food Services | 8 (15.4%) | 44 (84.6%) |
| Public Administration | 38 (48.1%) | 41 (51.9%) |
| Total | 624 (49.7%) | 631 (50.3%) |
Education in Sanborn County
School Enrollment in Sanborn County
The most common levels of schooling among the 562 students in Sanborn County are elementary school (137 | 24.4%), high school (133 | 23.7%), and middle school (113 | 20.1%).
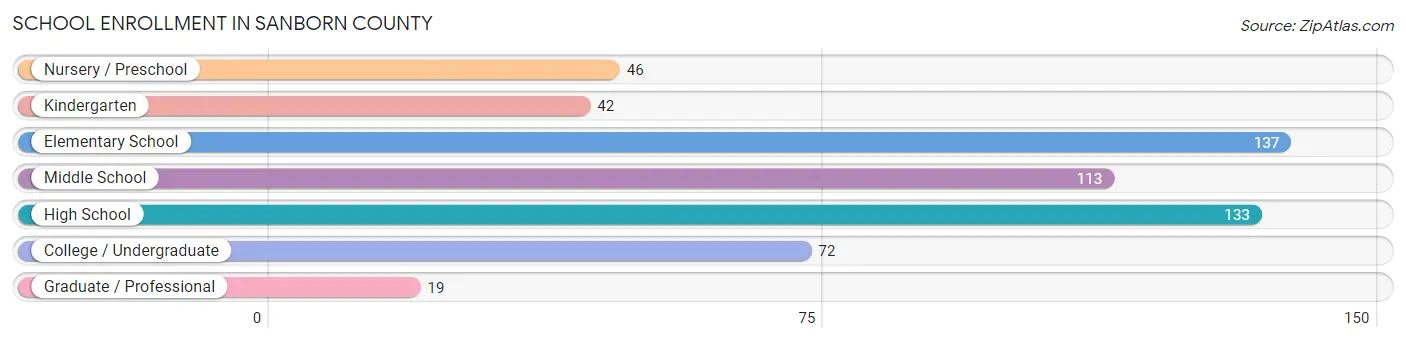
| School Level | # Students | % Students |
| Nursery / Preschool | 46 | 8.2% |
| Kindergarten | 42 | 7.5% |
| Elementary School | 137 | 24.4% |
| Middle School | 113 | 20.1% |
| High School | 133 | 23.7% |
| College / Undergraduate | 72 | 12.8% |
| Graduate / Professional | 19 | 3.4% |
| Total | 562 | 100.0% |
School Enrollment by Age by Funding Source in Sanborn County
Out of a total of 562 students who are enrolled in schools in Sanborn County, 12 (2.1%) attend a private institution, while the remaining 550 (97.9%) are enrolled in public schools. The age group of 25 to 34 year olds has the highest likelihood of being enrolled in private schools, with 7 (35.0% in the age bracket) enrolled. Conversely, the age group of 3 to 4 year olds has the lowest likelihood of being enrolled in a private school, with 29 (100.0% in the age bracket) attending a public institution.
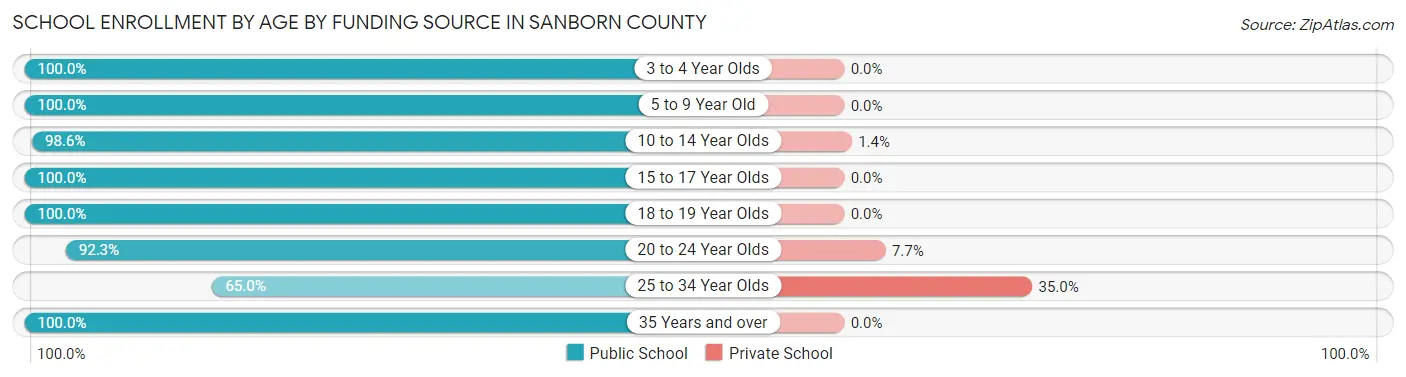
| Age Bracket | Public School | Private School |
| 3 to 4 Year Olds | 29 (100.0%) | 0 (0.0%) |
| 5 to 9 Year Old | 189 (100.0%) | 0 (0.0%) |
| 10 to 14 Year Olds | 141 (98.6%) | 2 (1.4%) |
| 15 to 17 Year Olds | 87 (100.0%) | 0 (0.0%) |
| 18 to 19 Year Olds | 41 (100.0%) | 0 (0.0%) |
| 20 to 24 Year Olds | 36 (92.3%) | 3 (7.7%) |
| 25 to 34 Year Olds | 13 (65.0%) | 7 (35.0%) |
| 35 Years and over | 14 (100.0%) | 0 (0.0%) |
| Total | 550 (97.9%) | 12 (2.1%) |
Educational Attainment by Field of Study in Sanborn County
Education (103 | 31.4%), bio, nature & agricultural (46 | 14.0%), arts & humanities (46 | 14.0%), science & technology (45 | 13.7%), and business (20 | 6.1%) are the most common fields of study among 328 individuals in Sanborn County who have obtained a bachelor's degree or higher.

| Field of Study | # Graduates | % Graduates |
| Computers & Mathematics | 11 | 3.4% |
| Bio, Nature & Agricultural | 46 | 14.0% |
| Physical & Health Sciences | 3 | 0.9% |
| Psychology | 6 | 1.8% |
| Social Sciences | 15 | 4.6% |
| Engineering | 7 | 2.1% |
| Multidisciplinary Studies | 0 | 0.0% |
| Science & Technology | 45 | 13.7% |
| Business | 20 | 6.1% |
| Education | 103 | 31.4% |
| Literature & Languages | 3 | 0.9% |
| Liberal Arts & History | 20 | 6.1% |
| Visual & Performing Arts | 3 | 0.9% |
| Communications | 0 | 0.0% |
| Arts & Humanities | 46 | 14.0% |
| Total | 328 | 100.0% |
Transportation & Commute in Sanborn County
Vehicle Availability by Sex in Sanborn County
The most prevalent vehicle ownership categories in Sanborn County are males with 2 vehicles (234, accounting for 38.0%) and females with 2 vehicles (169, making up 38.4%).
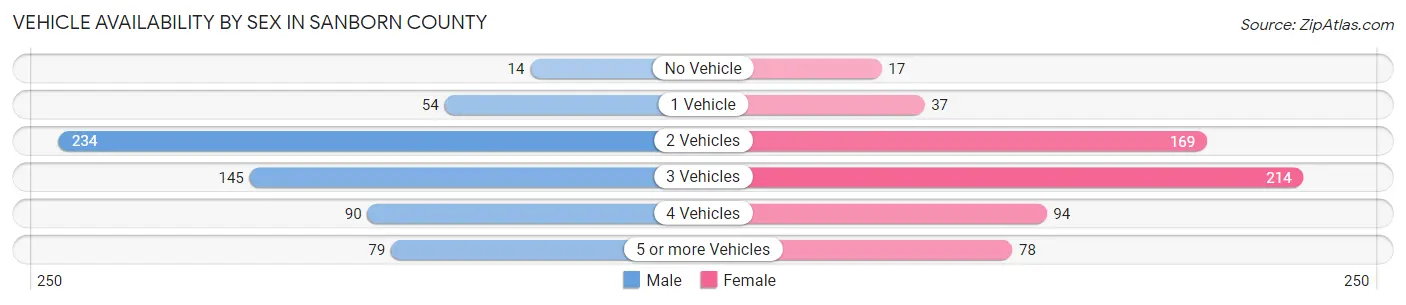
| Vehicles Available | Male | Female |
| No Vehicle | 14 (2.3%) | 17 (2.8%) |
| 1 Vehicle | 54 (8.8%) | 37 (6.1%) |
| 2 Vehicles | 234 (38.0%) | 169 (27.8%) |
| 3 Vehicles | 145 (23.5%) | 214 (35.1%) |
| 4 Vehicles | 90 (14.6%) | 94 (15.4%) |
| 5 or more Vehicles | 79 (12.8%) | 78 (12.8%) |
| Total | 616 (100.0%) | 609 (100.0%) |
Commute Time in Sanborn County
The most frequently occuring commute durations in Sanborn County are 5 to 9 minutes (237 commuters, 24.0%), 30 to 34 minutes (217 commuters, 21.9%), and less than 5 minutes (87 commuters, 8.8%).
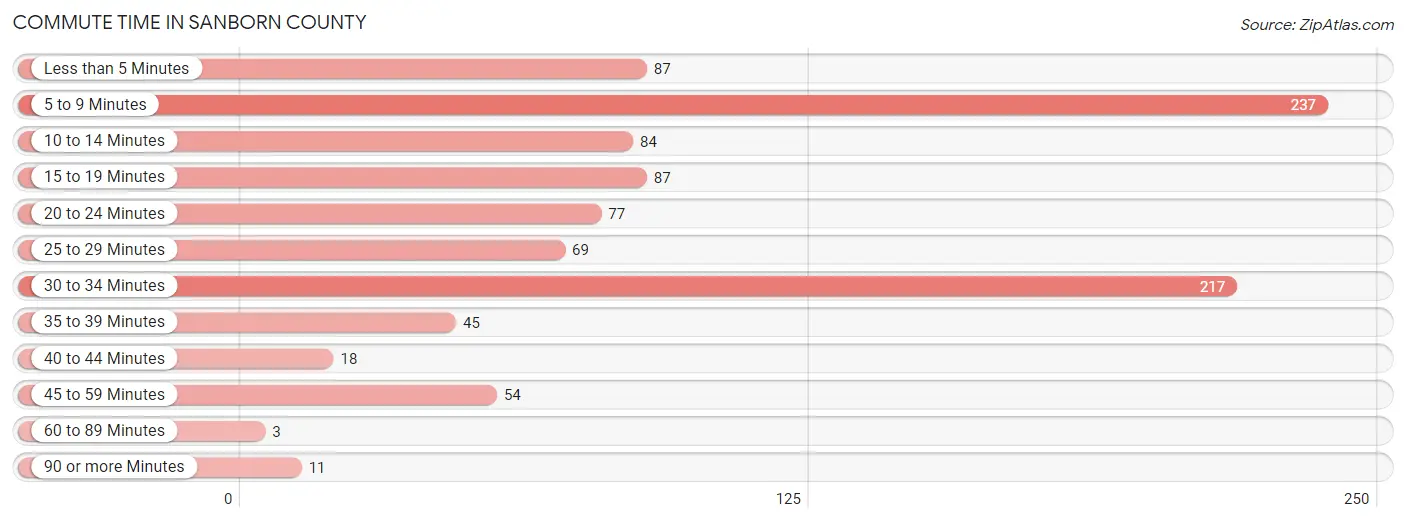
| Commute Time | # Commuters | % Commuters |
| Less than 5 Minutes | 87 | 8.8% |
| 5 to 9 Minutes | 237 | 24.0% |
| 10 to 14 Minutes | 84 | 8.5% |
| 15 to 19 Minutes | 87 | 8.8% |
| 20 to 24 Minutes | 77 | 7.8% |
| 25 to 29 Minutes | 69 | 7.0% |
| 30 to 34 Minutes | 217 | 21.9% |
| 35 to 39 Minutes | 45 | 4.5% |
| 40 to 44 Minutes | 18 | 1.8% |
| 45 to 59 Minutes | 54 | 5.5% |
| 60 to 89 Minutes | 3 | 0.3% |
| 90 or more Minutes | 11 | 1.1% |
Commute Time by Sex in Sanborn County
The most common commute times in Sanborn County are 5 to 9 minutes (105 commuters, 22.3%) for males and 5 to 9 minutes (132 commuters, 25.4%) for females.

| Commute Time | Male | Female |
| Less than 5 Minutes | 71 (15.1%) | 16 (3.1%) |
| 5 to 9 Minutes | 105 (22.3%) | 132 (25.4%) |
| 10 to 14 Minutes | 55 (11.7%) | 29 (5.6%) |
| 15 to 19 Minutes | 41 (8.7%) | 46 (8.9%) |
| 20 to 24 Minutes | 38 (8.1%) | 39 (7.5%) |
| 25 to 29 Minutes | 19 (4.0%) | 50 (9.6%) |
| 30 to 34 Minutes | 88 (18.7%) | 129 (24.9%) |
| 35 to 39 Minutes | 21 (4.5%) | 24 (4.6%) |
| 40 to 44 Minutes | 0 (0.0%) | 18 (3.5%) |
| 45 to 59 Minutes | 29 (6.2%) | 25 (4.8%) |
| 60 to 89 Minutes | 0 (0.0%) | 3 (0.6%) |
| 90 or more Minutes | 3 (0.6%) | 8 (1.5%) |
Time of Departure to Work by Sex in Sanborn County
The most frequent times of departure to work in Sanborn County are 7:30 AM to 7:59 AM (91, 19.4%) for males and 7:30 AM to 7:59 AM (174, 33.5%) for females.
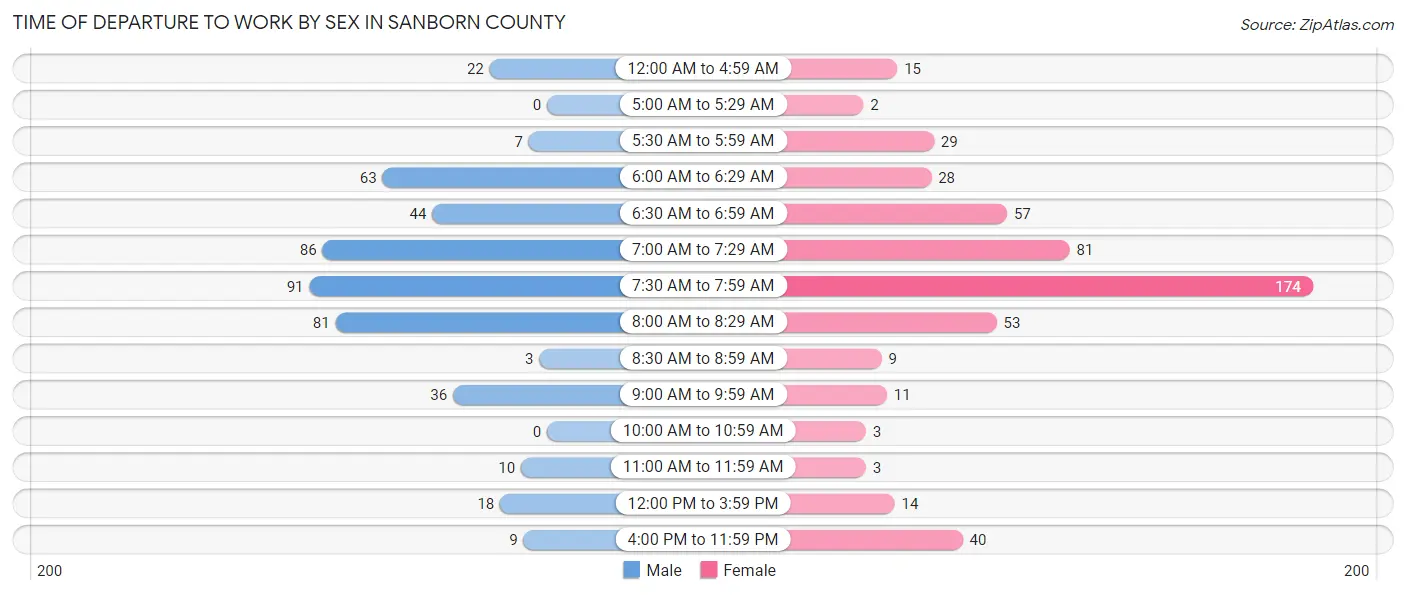
| Time of Departure | Male | Female |
| 12:00 AM to 4:59 AM | 22 (4.7%) | 15 (2.9%) |
| 5:00 AM to 5:29 AM | 0 (0.0%) | 2 (0.4%) |
| 5:30 AM to 5:59 AM | 7 (1.5%) | 29 (5.6%) |
| 6:00 AM to 6:29 AM | 63 (13.4%) | 28 (5.4%) |
| 6:30 AM to 6:59 AM | 44 (9.4%) | 57 (11.0%) |
| 7:00 AM to 7:29 AM | 86 (18.3%) | 81 (15.6%) |
| 7:30 AM to 7:59 AM | 91 (19.4%) | 174 (33.5%) |
| 8:00 AM to 8:29 AM | 81 (17.2%) | 53 (10.2%) |
| 8:30 AM to 8:59 AM | 3 (0.6%) | 9 (1.7%) |
| 9:00 AM to 9:59 AM | 36 (7.7%) | 11 (2.1%) |
| 10:00 AM to 10:59 AM | 0 (0.0%) | 3 (0.6%) |
| 11:00 AM to 11:59 AM | 10 (2.1%) | 3 (0.6%) |
| 12:00 PM to 3:59 PM | 18 (3.8%) | 14 (2.7%) |
| 4:00 PM to 11:59 PM | 9 (1.9%) | 40 (7.7%) |
| Total | 470 (100.0%) | 519 (100.0%) |
Housing Occupancy in Sanborn County
Occupancy by Ownership in Sanborn County
Of the total 939 dwellings in Sanborn County, owner-occupied units account for 714 (76.0%), while renter-occupied units make up 225 (24.0%).
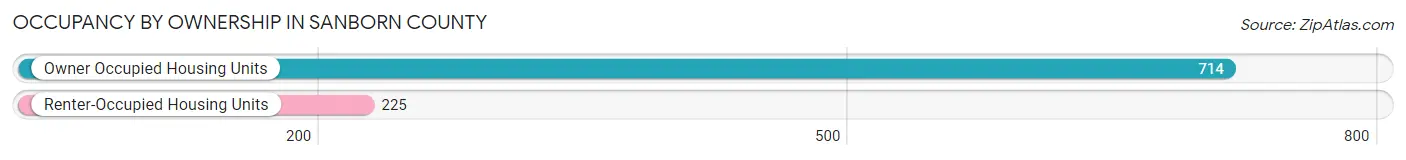
| Occupancy | # Housing Units | % Housing Units |
| Owner Occupied Housing Units | 714 | 76.0% |
| Renter-Occupied Housing Units | 225 | 24.0% |
| Total Occupied Housing Units | 939 | 100.0% |
Occupancy by Household Size in Sanborn County
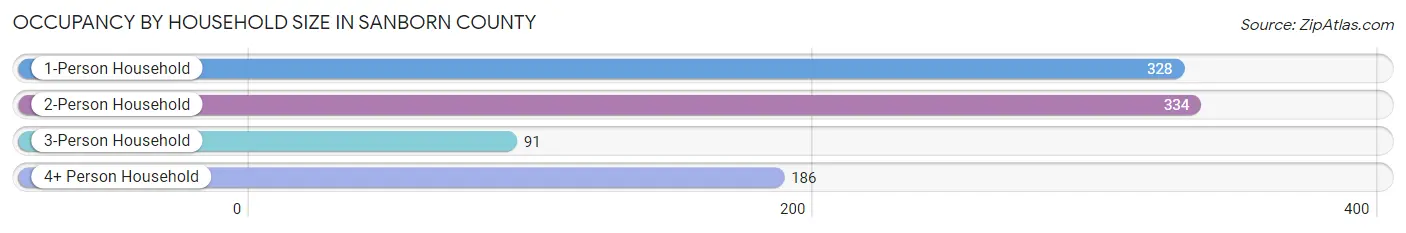
| Household Size | # Housing Units | % Housing Units |
| 1-Person Household | 328 | 34.9% |
| 2-Person Household | 334 | 35.6% |
| 3-Person Household | 91 | 9.7% |
| 4+ Person Household | 186 | 19.8% |
| Total Housing Units | 939 | 100.0% |
Occupancy by Ownership by Household Size in Sanborn County
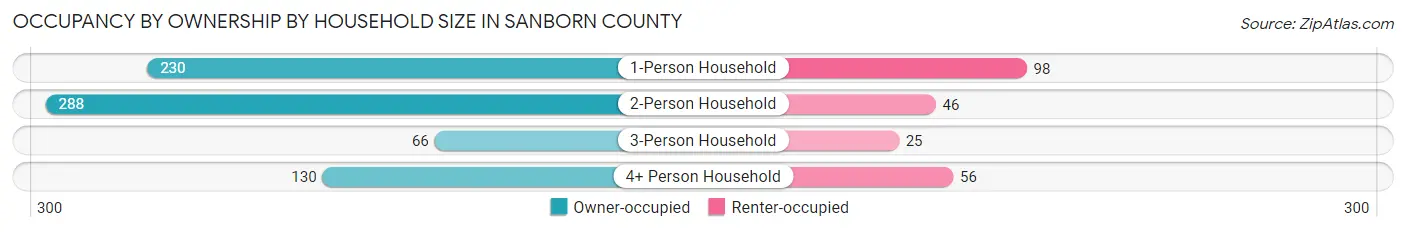
| Household Size | Owner-occupied | Renter-occupied |
| 1-Person Household | 230 (70.1%) | 98 (29.9%) |
| 2-Person Household | 288 (86.2%) | 46 (13.8%) |
| 3-Person Household | 66 (72.5%) | 25 (27.5%) |
| 4+ Person Household | 130 (69.9%) | 56 (30.1%) |
| Total Housing Units | 714 (76.0%) | 225 (24.0%) |
Occupancy by Educational Attainment in Sanborn County

| Household Size | Owner-occupied | Renter-occupied |
| Less than High School | 37 (71.2%) | 15 (28.8%) |
| High School Diploma | 316 (72.5%) | 120 (27.5%) |
| College/Associate Degree | 192 (82.8%) | 40 (17.2%) |
| Bachelor's Degree or higher | 169 (77.2%) | 50 (22.8%) |
Occupancy by Age of Householder in Sanborn County
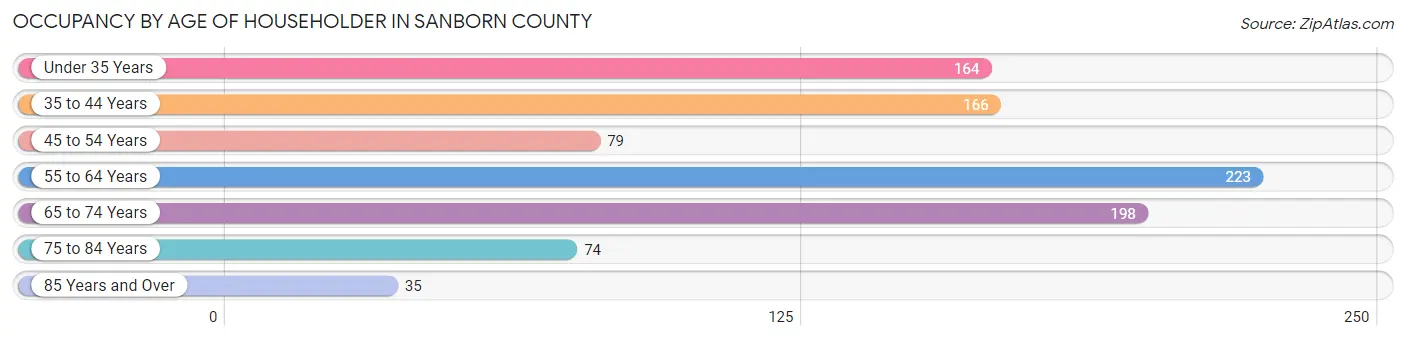
| Age Bracket | # Households | % Households |
| Under 35 Years | 164 | 17.5% |
| 35 to 44 Years | 166 | 17.7% |
| 45 to 54 Years | 79 | 8.4% |
| 55 to 64 Years | 223 | 23.7% |
| 65 to 74 Years | 198 | 21.1% |
| 75 to 84 Years | 74 | 7.9% |
| 85 Years and Over | 35 | 3.7% |
| Total | 939 | 100.0% |
Housing Finances in Sanborn County
Median Income by Occupancy in Sanborn County
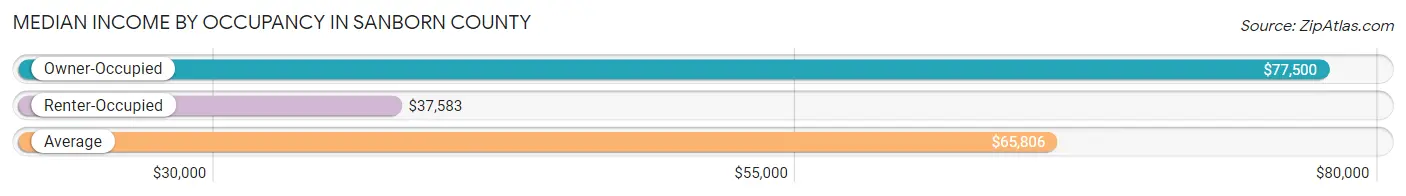
| Occupancy Type | # Households | Median Income |
| Owner-Occupied | 714 (76.0%) | $77,500 |
| Renter-Occupied | 225 (24.0%) | $37,583 |
| Average | 939 (100.0%) | $65,806 |
Occupancy by Householder Income Bracket in Sanborn County

| Income Bracket | Owner-occupied | Renter-occupied |
| Less than $5,000 | 5 (0.7%) | 2 (0.9%) |
| $5,000 to $9,999 | 14 (2.0%) | 14 (6.2%) |
| $10,000 to $14,999 | 14 (2.0%) | 61 (27.1%) |
| $15,000 to $19,999 | 33 (4.6%) | 17 (7.6%) |
| $20,000 to $24,999 | 14 (2.0%) | 2 (0.9%) |
| $25,000 to $34,999 | 46 (6.4%) | 16 (7.1%) |
| $35,000 to $49,999 | 95 (13.3%) | 29 (12.9%) |
| $50,000 to $74,999 | 130 (18.2%) | 50 (22.2%) |
| $75,000 to $99,999 | 115 (16.1%) | 21 (9.3%) |
| $100,000 to $149,999 | 157 (22.0%) | 0 (0.0%) |
| $150,000 or more | 91 (12.8%) | 13 (5.8%) |
| Total | 714 (100.0%) | 225 (100.0%) |
Monthly Housing Cost Tiers in Sanborn County

| Monthly Cost | Owner-occupied | Renter-occupied |
| Less than $300 | 39 (5.5%) | 14 (6.2%) |
| $300 to $499 | 117 (16.4%) | 48 (21.3%) |
| $500 to $799 | 264 (37.0%) | 49 (21.8%) |
| $800 to $999 | 79 (11.1%) | 31 (13.8%) |
| $1,000 to $1,499 | 126 (17.6%) | 13 (5.8%) |
| $1,500 to $1,999 | 62 (8.7%) | 0 (0.0%) |
| $2,000 to $2,499 | 23 (3.2%) | 0 (0.0%) |
| $2,500 to $2,999 | 3 (0.4%) | 0 (0.0%) |
| $3,000 or more | 1 (0.1%) | 0 (0.0%) |
| Total | 714 (100.0%) | 225 (100.0%) |
Physical Housing Characteristics in Sanborn County
Housing Structures in Sanborn County
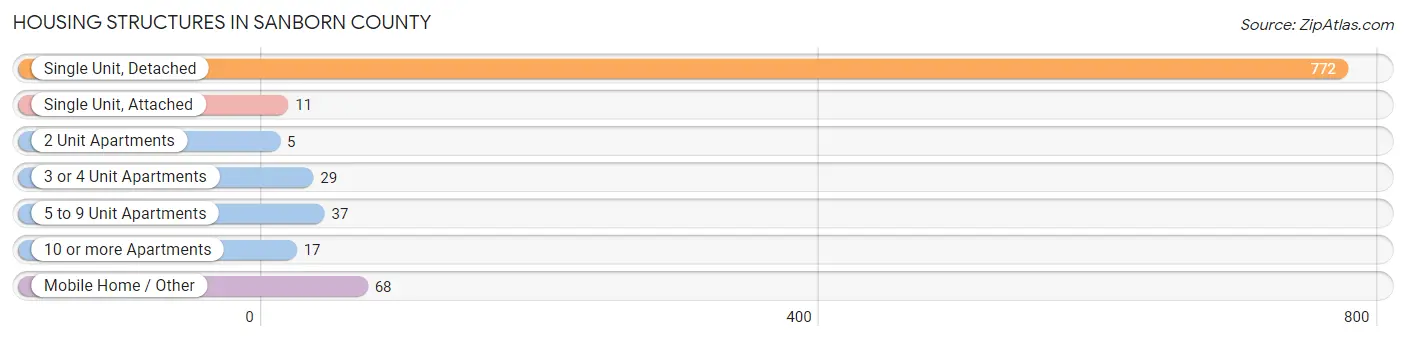
| Structure Type | # Housing Units | % Housing Units |
| Single Unit, Detached | 772 | 82.2% |
| Single Unit, Attached | 11 | 1.2% |
| 2 Unit Apartments | 5 | 0.5% |
| 3 or 4 Unit Apartments | 29 | 3.1% |
| 5 to 9 Unit Apartments | 37 | 3.9% |
| 10 or more Apartments | 17 | 1.8% |
| Mobile Home / Other | 68 | 7.2% |
| Total | 939 | 100.0% |
Housing Structures by Occupancy in Sanborn County
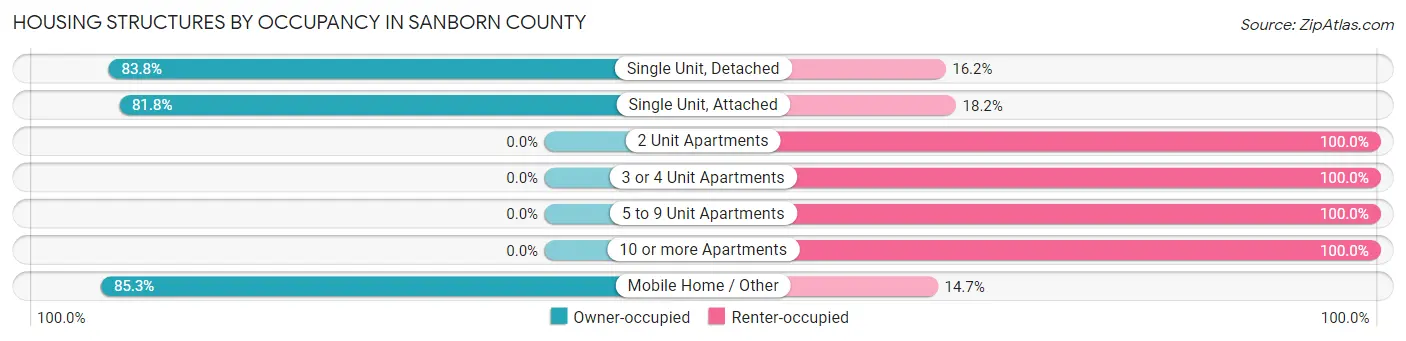
| Structure Type | Owner-occupied | Renter-occupied |
| Single Unit, Detached | 647 (83.8%) | 125 (16.2%) |
| Single Unit, Attached | 9 (81.8%) | 2 (18.2%) |
| 2 Unit Apartments | 0 (0.0%) | 5 (100.0%) |
| 3 or 4 Unit Apartments | 0 (0.0%) | 29 (100.0%) |
| 5 to 9 Unit Apartments | 0 (0.0%) | 37 (100.0%) |
| 10 or more Apartments | 0 (0.0%) | 17 (100.0%) |
| Mobile Home / Other | 58 (85.3%) | 10 (14.7%) |
| Total | 714 (76.0%) | 225 (24.0%) |
Housing Structures by Number of Rooms in Sanborn County
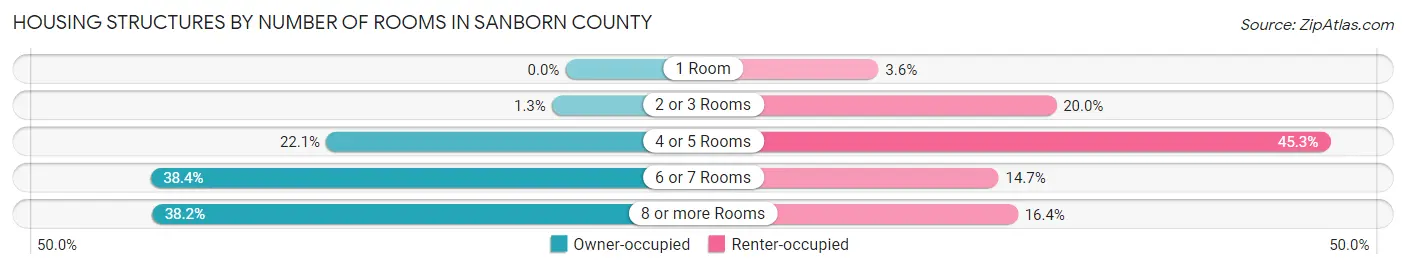
| Number of Rooms | Owner-occupied | Renter-occupied |
| 1 Room | 0 (0.0%) | 8 (3.6%) |
| 2 or 3 Rooms | 9 (1.3%) | 45 (20.0%) |
| 4 or 5 Rooms | 158 (22.1%) | 102 (45.3%) |
| 6 or 7 Rooms | 274 (38.4%) | 33 (14.7%) |
| 8 or more Rooms | 273 (38.2%) | 37 (16.4%) |
| Total | 714 (100.0%) | 225 (100.0%) |
Housing Structure by Heating Type in Sanborn County
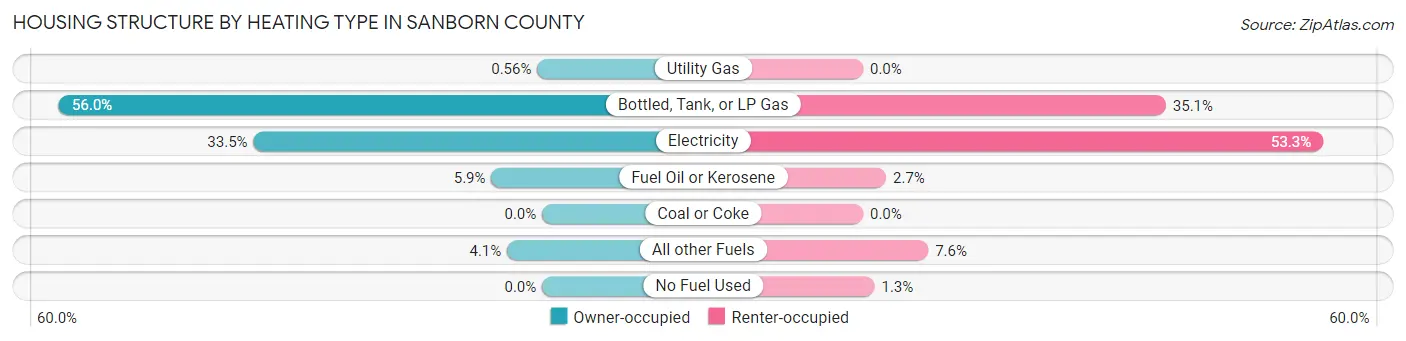
| Heating Type | Owner-occupied | Renter-occupied |
| Utility Gas | 4 (0.6%) | 0 (0.0%) |
| Bottled, Tank, or LP Gas | 400 (56.0%) | 79 (35.1%) |
| Electricity | 239 (33.5%) | 120 (53.3%) |
| Fuel Oil or Kerosene | 42 (5.9%) | 6 (2.7%) |
| Coal or Coke | 0 (0.0%) | 0 (0.0%) |
| All other Fuels | 29 (4.1%) | 17 (7.6%) |
| No Fuel Used | 0 (0.0%) | 3 (1.3%) |
| Total | 714 (100.0%) | 225 (100.0%) |
Household Vehicle Usage in Sanborn County
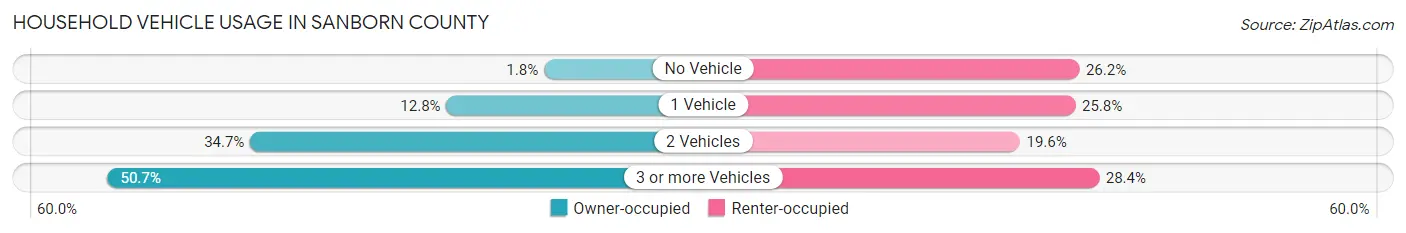
| Vehicles per Household | Owner-occupied | Renter-occupied |
| No Vehicle | 13 (1.8%) | 59 (26.2%) |
| 1 Vehicle | 91 (12.8%) | 58 (25.8%) |
| 2 Vehicles | 248 (34.7%) | 44 (19.6%) |
| 3 or more Vehicles | 362 (50.7%) | 64 (28.4%) |
| Total | 714 (100.0%) | 225 (100.0%) |
Real Estate & Mortgages in Sanborn County
Real Estate and Mortgage Overview in Sanborn County
| Characteristic | Without Mortgage | With Mortgage |
| Housing Units | 488 | 226 |
| Median Property Value | $122,800 | $136,200 |
| Median Household Income | $76,250 | $20 |
| Monthly Housing Costs | $618 | $1 |
| Real Estate Taxes | $1,764 | $8 |
Property Value by Mortgage Status in Sanborn County
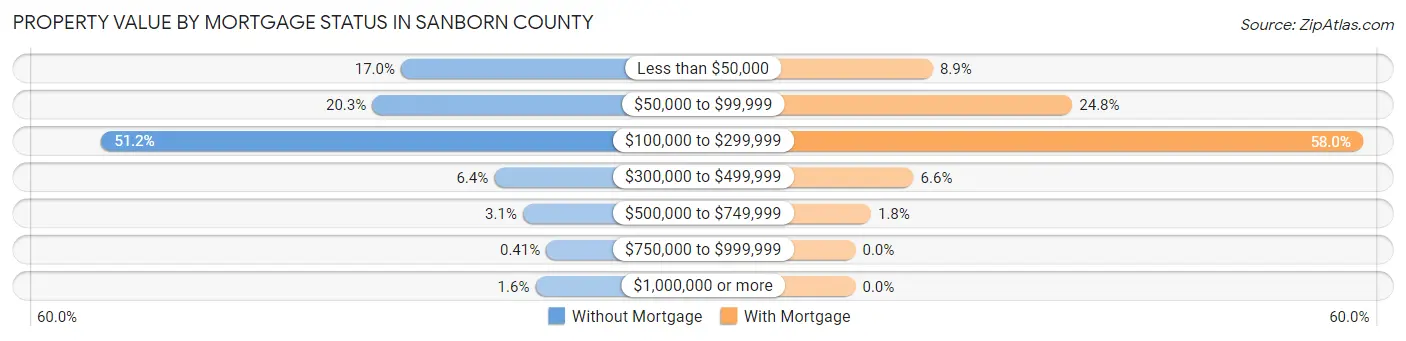
| Property Value | Without Mortgage | With Mortgage |
| Less than $50,000 | 83 (17.0%) | 20 (8.8%) |
| $50,000 to $99,999 | 99 (20.3%) | 56 (24.8%) |
| $100,000 to $299,999 | 250 (51.2%) | 131 (58.0%) |
| $300,000 to $499,999 | 31 (6.4%) | 15 (6.6%) |
| $500,000 to $749,999 | 15 (3.1%) | 4 (1.8%) |
| $750,000 to $999,999 | 2 (0.4%) | 0 (0.0%) |
| $1,000,000 or more | 8 (1.6%) | 0 (0.0%) |
| Total | 488 (100.0%) | 226 (100.0%) |
Household Income by Mortgage Status in Sanborn County
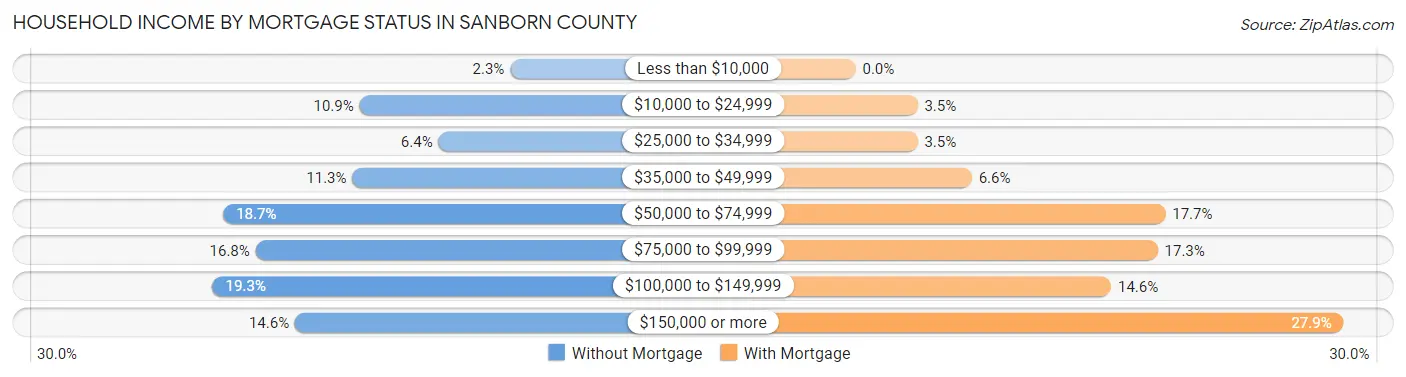
| Household Income | Without Mortgage | With Mortgage |
| Less than $10,000 | 11 (2.2%) | 0 (0.0%) |
| $10,000 to $24,999 | 53 (10.9%) | 8 (3.5%) |
| $25,000 to $34,999 | 31 (6.4%) | 8 (3.5%) |
| $35,000 to $49,999 | 55 (11.3%) | 15 (6.6%) |
| $50,000 to $74,999 | 91 (18.6%) | 40 (17.7%) |
| $75,000 to $99,999 | 82 (16.8%) | 39 (17.3%) |
| $100,000 to $149,999 | 94 (19.3%) | 33 (14.6%) |
| $150,000 or more | 71 (14.5%) | 63 (27.9%) |
| Total | 488 (100.0%) | 226 (100.0%) |
Property Value to Household Income Ratio in Sanborn County

| Value-to-Income Ratio | Without Mortgage | With Mortgage |
| Less than 2.0x | 296 (60.7%) | 81,250 (35,951.3%) |
| 2.0x to 2.9x | 45 (9.2%) | 143 (63.3%) |
| 3.0x to 3.9x | 38 (7.8%) | 25 (11.1%) |
| 4.0x or more | 109 (22.3%) | 22 (9.7%) |
| Total | 488 (100.0%) | 226 (100.0%) |
Real Estate Taxes by Mortgage Status in Sanborn County
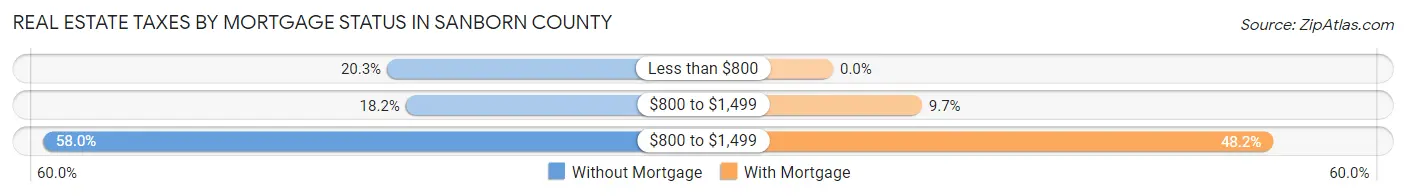
| Property Taxes | Without Mortgage | With Mortgage |
| Less than $800 | 99 (20.3%) | 0 (0.0%) |
| $800 to $1,499 | 89 (18.2%) | 22 (9.7%) |
| $800 to $1,499 | 283 (58.0%) | 109 (48.2%) |
| Total | 488 (100.0%) | 226 (100.0%) |
Health & Disability in Sanborn County
Health Insurance Coverage by Age in Sanborn County

| Age Bracket | With Coverage | Without Coverage |
| Under 6 Years | 234 (95.9%) | 10 (4.1%) |
| 6 to 18 Years | 395 (92.9%) | 30 (7.1%) |
| 19 to 25 Years | 97 (71.3%) | 39 (28.7%) |
| 26 to 34 Years | 207 (88.1%) | 28 (11.9%) |
| 35 to 44 Years | 279 (89.7%) | 32 (10.3%) |
| 45 to 54 Years | 159 (98.2%) | 3 (1.8%) |
| 55 to 64 Years | 343 (94.0%) | 22 (6.0%) |
| 65 to 74 Years | 294 (100.0%) | 0 (0.0%) |
| 75 Years and older | 138 (100.0%) | 0 (0.0%) |
| Total | 2,146 (92.9%) | 164 (7.1%) |
Health Insurance Coverage by Citizenship Status in Sanborn County
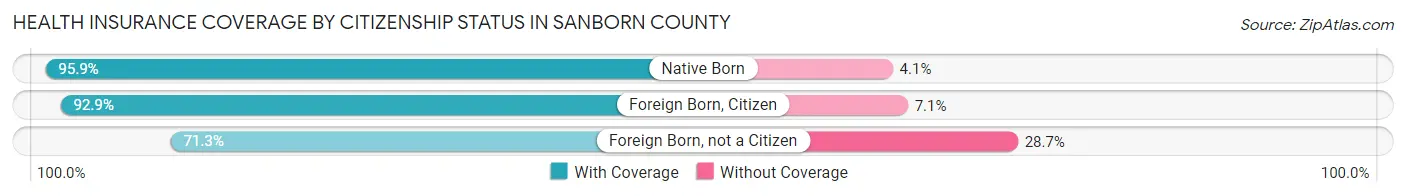
| Citizenship Status | With Coverage | Without Coverage |
| Native Born | 234 (95.9%) | 10 (4.1%) |
| Foreign Born, Citizen | 395 (92.9%) | 30 (7.1%) |
| Foreign Born, not a Citizen | 97 (71.3%) | 39 (28.7%) |
Health Insurance Coverage by Household Income in Sanborn County
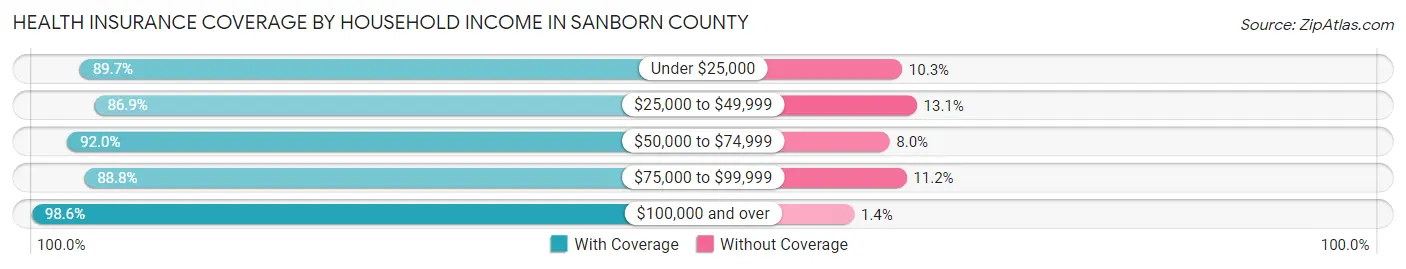
| Household Income | With Coverage | Without Coverage |
| Under $25,000 | 217 (89.7%) | 25 (10.3%) |
| $25,000 to $49,999 | 332 (86.9%) | 50 (13.1%) |
| $50,000 to $74,999 | 358 (92.0%) | 31 (8.0%) |
| $75,000 to $99,999 | 366 (88.8%) | 46 (11.2%) |
| $100,000 and over | 873 (98.6%) | 12 (1.4%) |
Public vs Private Health Insurance Coverage by Age in Sanborn County
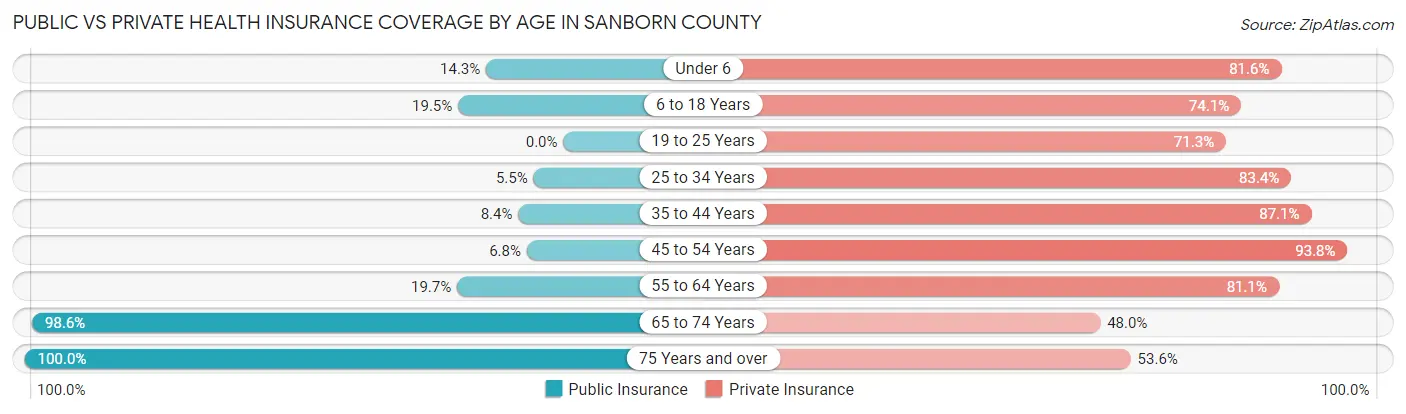
| Age Bracket | Public Insurance | Private Insurance |
| Under 6 | 35 (14.3%) | 199 (81.6%) |
| 6 to 18 Years | 83 (19.5%) | 315 (74.1%) |
| 19 to 25 Years | 0 (0.0%) | 97 (71.3%) |
| 25 to 34 Years | 13 (5.5%) | 196 (83.4%) |
| 35 to 44 Years | 26 (8.4%) | 271 (87.1%) |
| 45 to 54 Years | 11 (6.8%) | 152 (93.8%) |
| 55 to 64 Years | 72 (19.7%) | 296 (81.1%) |
| 65 to 74 Years | 290 (98.6%) | 141 (48.0%) |
| 75 Years and over | 138 (100.0%) | 74 (53.6%) |
| Total | 668 (28.9%) | 1,741 (75.4%) |
Disability Status by Sex by Age in Sanborn County
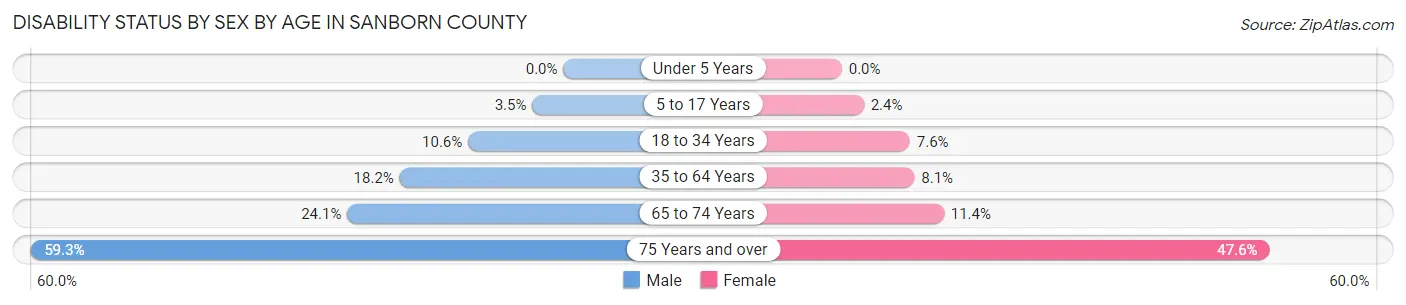
| Age Bracket | Male | Female |
| Under 5 Years | 0 (0.0%) | 0 (0.0%) |
| 5 to 17 Years | 8 (3.5%) | 5 (2.4%) |
| 18 to 34 Years | 21 (10.6%) | 15 (7.6%) |
| 35 to 64 Years | 76 (18.2%) | 34 (8.1%) |
| 65 to 74 Years | 39 (24.1%) | 15 (11.4%) |
| 75 Years and over | 32 (59.3%) | 40 (47.6%) |
Disability Class by Sex by Age in Sanborn County
Disability Class: Hearing Difficulty
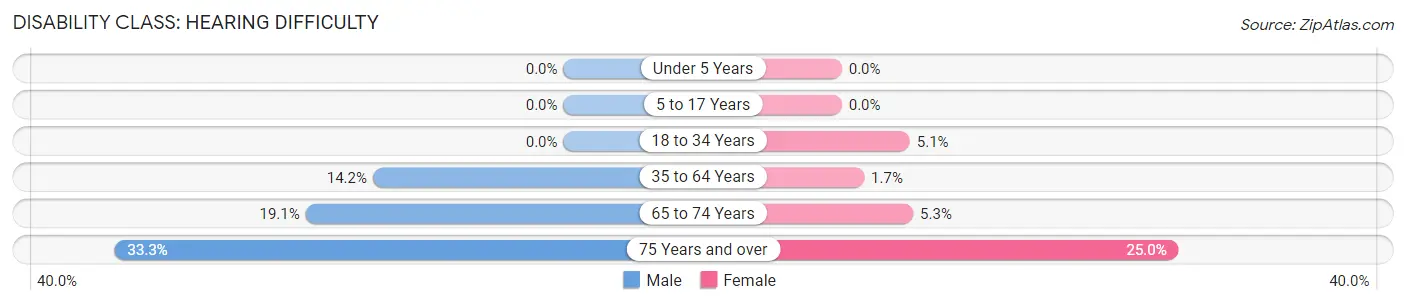
| Age Bracket | Male | Female |
| Under 5 Years | 0 (0.0%) | 0 (0.0%) |
| 5 to 17 Years | 0 (0.0%) | 0 (0.0%) |
| 18 to 34 Years | 0 (0.0%) | 10 (5.1%) |
| 35 to 64 Years | 59 (14.1%) | 7 (1.7%) |
| 65 to 74 Years | 31 (19.1%) | 7 (5.3%) |
| 75 Years and over | 18 (33.3%) | 21 (25.0%) |
Disability Class: Vision Difficulty
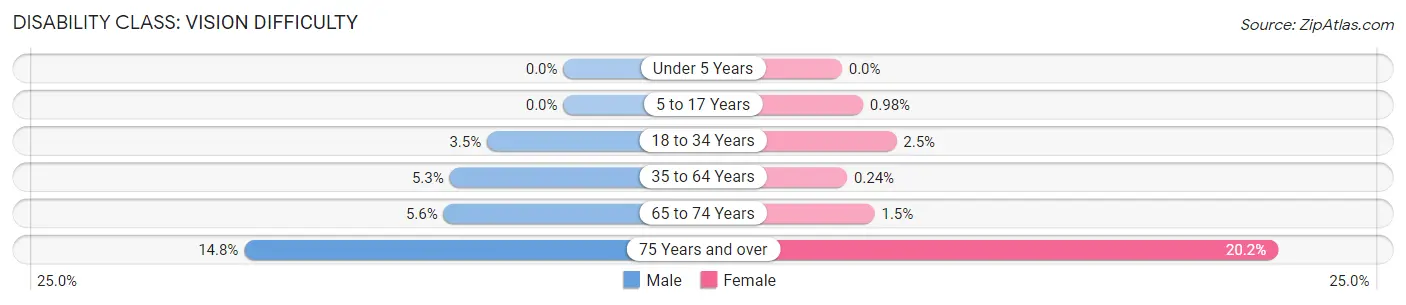
| Age Bracket | Male | Female |
| Under 5 Years | 0 (0.0%) | 0 (0.0%) |
| 5 to 17 Years | 0 (0.0%) | 2 (1.0%) |
| 18 to 34 Years | 7 (3.5%) | 5 (2.5%) |
| 35 to 64 Years | 22 (5.3%) | 1 (0.2%) |
| 65 to 74 Years | 9 (5.6%) | 2 (1.5%) |
| 75 Years and over | 8 (14.8%) | 17 (20.2%) |
Disability Class: Cognitive Difficulty

| Age Bracket | Male | Female |
| 5 to 17 Years | 8 (3.5%) | 3 (1.5%) |
| 18 to 34 Years | 14 (7.1%) | 0 (0.0%) |
| 35 to 64 Years | 22 (5.3%) | 0 (0.0%) |
| 65 to 74 Years | 9 (5.6%) | 0 (0.0%) |
| 75 Years and over | 7 (13.0%) | 19 (22.6%) |
Disability Class: Ambulatory Difficulty
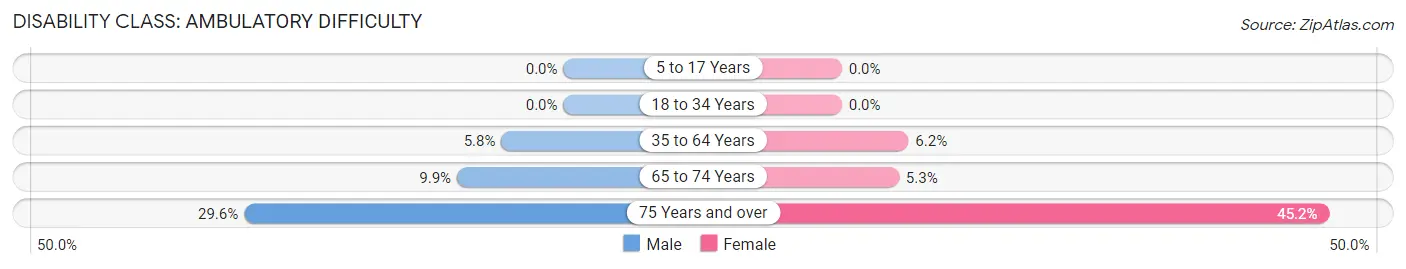
| Age Bracket | Male | Female |
| 5 to 17 Years | 0 (0.0%) | 0 (0.0%) |
| 18 to 34 Years | 0 (0.0%) | 0 (0.0%) |
| 35 to 64 Years | 24 (5.8%) | 26 (6.2%) |
| 65 to 74 Years | 16 (9.9%) | 7 (5.3%) |
| 75 Years and over | 16 (29.6%) | 38 (45.2%) |
Disability Class: Self-Care Difficulty
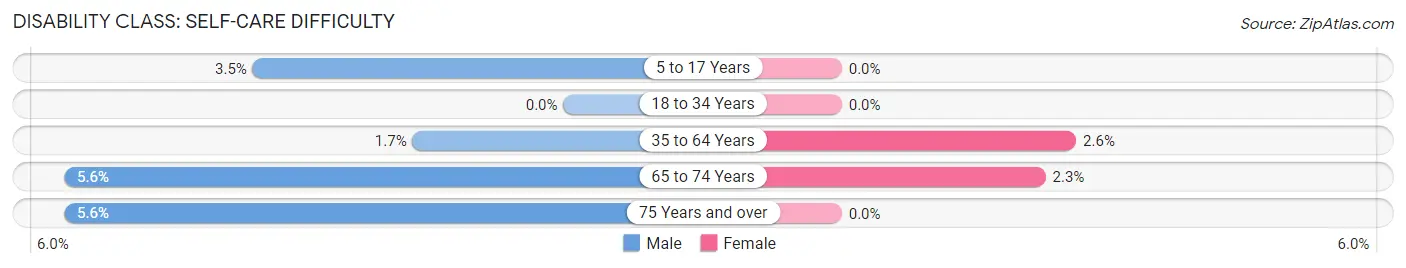
| Age Bracket | Male | Female |
| 5 to 17 Years | 8 (3.5%) | 0 (0.0%) |
| 18 to 34 Years | 0 (0.0%) | 0 (0.0%) |
| 35 to 64 Years | 7 (1.7%) | 11 (2.6%) |
| 65 to 74 Years | 9 (5.6%) | 3 (2.3%) |
| 75 Years and over | 3 (5.6%) | 0 (0.0%) |
Technology Access in Sanborn County
Computing Device Access in Sanborn County
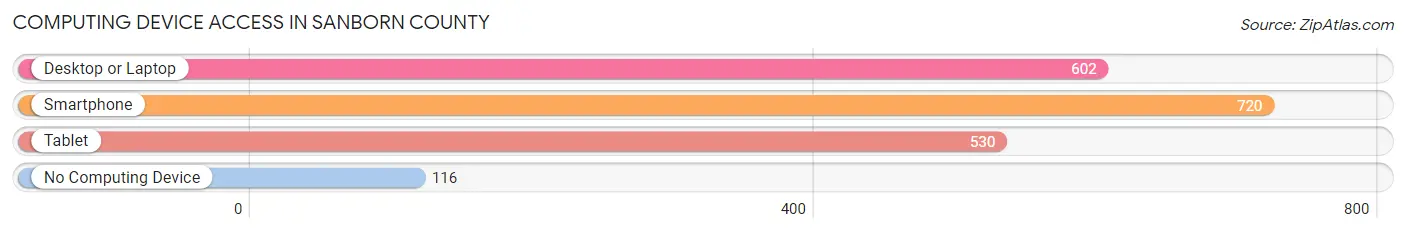
| Device Type | # Households | % Households |
| Desktop or Laptop | 602 | 64.1% |
| Smartphone | 720 | 76.7% |
| Tablet | 530 | 56.4% |
| No Computing Device | 116 | 12.3% |
| Total | 939 | 100.0% |
Internet Access in Sanborn County

| Internet Type | # Households | % Households |
| Dial-Up Internet | 5 | 0.5% |
| Broadband Home | 573 | 61.0% |
| Cellular Data Only | 108 | 11.5% |
| Satellite Internet | 62 | 6.6% |
| No Internet | 202 | 21.5% |
| Total | 939 | 100.0% |
Sanborn County Summary
Sanborn County is located in the southeastern corner of South Dakota, and is bordered by the states of Iowa and Minnesota. It is part of the Sioux Falls Metropolitan Statistical Area. The county was created in 1883 and named after Governor William A. Sanborn. As of the 2010 census, the population was 2,355.
Geography
Sanborn County is located in the southeastern corner of South Dakota, and is bordered by the states of Iowa and Minnesota. It is part of the Sioux Falls Metropolitan Statistical Area. The county has a total area of 576 square miles, of which 575 square miles is land and 1.2 square miles (0.2%) is water. The terrain is mostly rolling hills, with some flat areas in the east. The highest point in the county is located in the northwest corner, at an elevation of 1,845 feet.
The county is drained by the Big Sioux River, which flows through the western part of the county. Other major waterways include the Rock River, which flows through the northern part of the county, and the Little Sioux River, which flows through the eastern part of the county.
Climate
Sanborn County has a humid continental climate, with cold winters and hot summers. The average annual temperature is 48°F, and the average annual precipitation is 24.5 inches.
Demographics
As of the 2010 census, there were 2,355 people, 945 households, and 645 families residing in the county. The population density was 4.1 people per square mile. There were 1,072 housing units at an average density of 1.9 per square mile. The racial makeup of the county was 97.3% White, 0.2% African American, 0.3% Native American, 0.2% Asian, 0.1% Pacific Islander, 0.9% from other races, and 0.9% from two or more races. Hispanic or Latino of any race were 2.2% of the population.
There were 945 households, out of which 28.2% had children under the age of 18 living with them, 56.2% were married couples living together, 7.2% had a female householder with no husband present, and 32.7% were non-families. 28.2% of all households were made up of individuals, and 14.2% had someone living alone who was 65 years of age or older. The average household size was 2.45 and the average family size was 3.00.
The median age in the county was 43.3 years. 24.2% of residents were under the age of 18; 6.7% were between the ages of 18 and 24; 22.2% were from 25 to 44; 28.2% were from 45 to 64; and 18.7% were 65 years of age or older. The gender makeup of the county was 50.2% male and 49.8% female.
Economy
Sanborn County is largely an agricultural county, with the majority of the population employed in farming and related industries. The county is home to several large farms, including the Sanborn County Dairy, which produces milk, cheese, and other dairy products. Other major industries in the county include manufacturing, retail, and tourism.
The county is home to several small towns, including Artesian, Woonsocket, and Letcher. The county seat is Woonsocket, which is home to the Sanborn County Courthouse and the Sanborn County Historical Museum.
The county is served by two school districts, the Woonsocket School District and the Artesian School District. The county is also home to several higher education institutions, including the University of South Dakota, South Dakota State University, and the University of Sioux Falls.
Sanborn County is served by several major highways, including Interstate 90, U.S. Route 14, and U.S. Route 81. The county is also served by the Sioux Falls Regional Airport, which is located just outside of Woonsocket.
Conclusion
Sanborn County is a rural county located in the southeastern corner of South Dakota. It is part of the Sioux Falls Metropolitan Statistical Area, and is home to several small towns and farms. The county is largely agricultural, with the majority of the population employed in farming and related industries. The county is served by several major highways, and is home to several higher education institutions.
Common Questions
What is the Total Population of Sanborn County?
Total Population of Sanborn County is 2,373.
What is the Total Male Population of Sanborn County?
Total Male Population of Sanborn County is 1,188.
What is the Total Female Population of Sanborn County?
Total Female Population of Sanborn County is 1,185.
What is the Ratio of Males per 100 Females in Sanborn County?
There are 100.25 Males per 100 Females in Sanborn County.
What is the Ratio of Females per 100 Males in Sanborn County?
There are 99.75 Females per 100 Males in Sanborn County.
What is the Median Population Age in Sanborn County?
Median Population Age in Sanborn County is 39.3 Years.
What is the Average Family Size in Sanborn County
Average Family Size in Sanborn County is 3.2 People.
What is the Average Household Size in Sanborn County
Average Household Size in Sanborn County is 2.5 People.
What is Per Capita Income in Sanborn County?
Per Capita income in Sanborn County is $35,468.
What is the Median Family Income in Sanborn County?
Median Family Income in Sanborn County is $83,750.
What is the Median Household income in Sanborn County?
Median Household Income in Sanborn County is $65,806.
What is Income or Wage Gap in Sanborn County?
Income or Wage Gap in Sanborn County is 30.4%.
Women in Sanborn County earn 69.6 cents for every dollar earned by a man.
What is Inequality or Gini Index in Sanborn County?
Inequality or Gini Index in Sanborn County is 0.46.
How Large is the Labor Force in Sanborn County?
There are 1,276 People in the Labor Forcein in Sanborn County.
What is the Percentage of People in the Labor Force in Sanborn County?
71.8% of People are in the Labor Force in Sanborn County.
What is the Unemployment Rate in Sanborn County?
Unemployment Rate in Sanborn County is 1.1%.