Roberts County, SD
Roberts County Map
Roberts County Overview
10,242
TOTAL POPULATION
5,276
MALE POPULATION
4,966
FEMALE POPULATION
106.24
MALES / 100 FEMALES
94.12
FEMALES / 100 MALES
37.0
MEDIAN AGE
3.4
AVG FAMILY SIZE
2.7
AVG HOUSEHOLD SIZE
$28,613
PER CAPITA INCOME
$69,333
AVG FAMILY INCOME
$59,022
AVG HOUSEHOLD INCOME
24.8%
WAGE / INCOME GAP [ % ]
75.2¢/ $1
WAGE / INCOME GAP [ $ ]
$11,432
FAMILY INCOME DEFICIT
0.43
INEQUALITY / GINI INDEX
4,595
LABOR FORCE [ PEOPLE ]
60.5%
PERCENT IN LABOR FORCE
5.2%
UNEMPLOYMENT RATE
Roberts County Area Codes
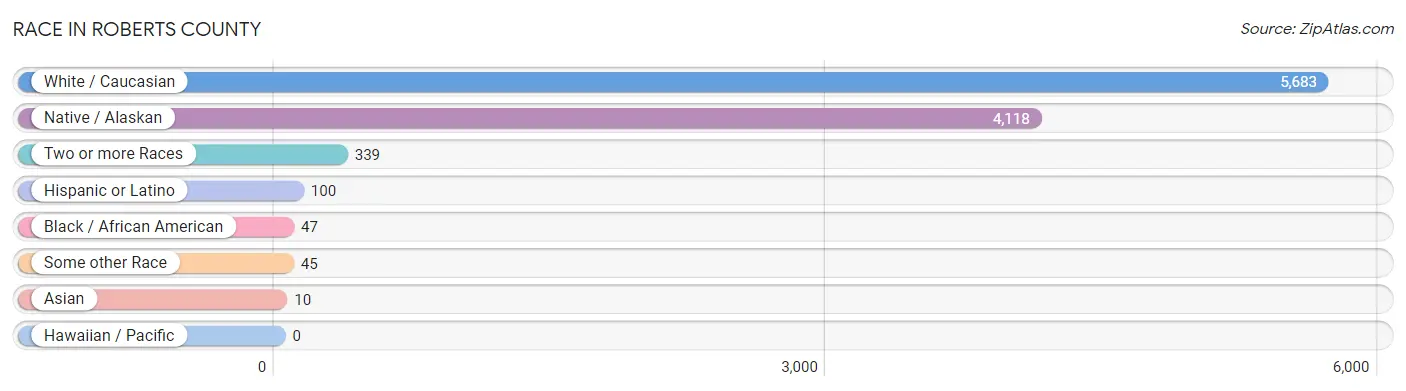
Race in Roberts County
The most populous races in Roberts County are White / Caucasian (5,683 | 55.5%), Native / Alaskan (4,118 | 40.2%), and Two or more Races (339 | 3.3%).
| Race | # Population | % Population |
| Asian | 10 | 0.1% |
| Black / African American | 47 | 0.5% |
| Hawaiian / Pacific | 0 | 0.0% |
| Hispanic or Latino | 100 | 1.0% |
| Native / Alaskan | 4,118 | 40.2% |
| White / Caucasian | 5,683 | 55.5% |
| Two or more Races | 339 | 3.3% |
| Some other Race | 45 | 0.4% |
| Total | 10,242 | 100.0% |
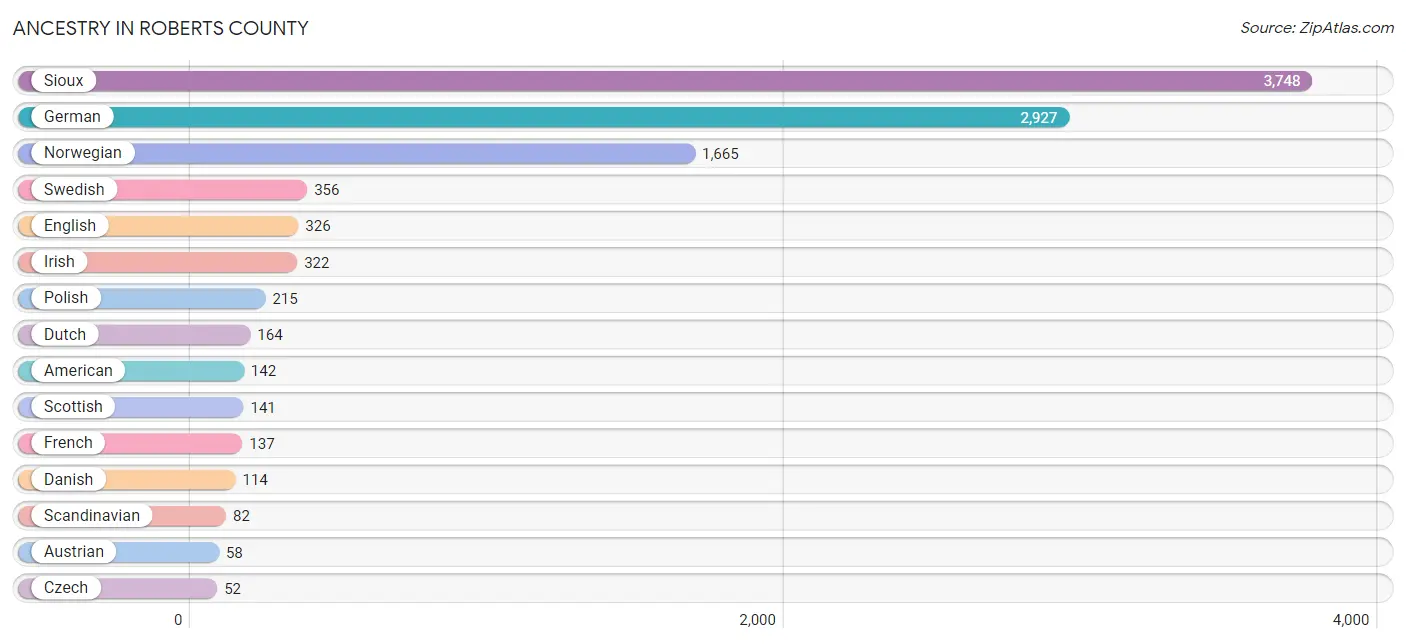
Ancestry in Roberts County
The most populous ancestries reported in Roberts County are Sioux (3,748 | 36.6%), German (2,927 | 28.6%), Norwegian (1,665 | 16.3%), Swedish (356 | 3.5%), and English (326 | 3.2%), together accounting for 88.1% of all Roberts County residents.
| Ancestry | # Population | % Population |
| African | 3 | 0.0% |
| American | 142 | 1.4% |
| Arab | 7 | 0.1% |
| Austrian | 58 | 0.6% |
| Belgian | 38 | 0.4% |
| Brazilian | 8 | 0.1% |
| British | 1 | 0.0% |
| Burmese | 8 | 0.1% |
| Cajun | 1 | 0.0% |
| Carpatho Rusyn | 11 | 0.1% |
| Central American | 28 | 0.3% |
| Chippewa | 2 | 0.0% |
| Czech | 52 | 0.5% |
| Danish | 114 | 1.1% |
| Dutch | 164 | 1.6% |
| Ecuadorian | 2 | 0.0% |
| English | 326 | 3.2% |
| European | 44 | 0.4% |
| Finnish | 49 | 0.5% |
| French | 137 | 1.3% |
| French Canadian | 21 | 0.2% |
| German | 2,927 | 28.6% |
| Greek | 6 | 0.1% |
| Guatemalan | 24 | 0.2% |
| Honduran | 4 | 0.0% |
| Hungarian | 26 | 0.3% |
| Indian (Asian) | 3 | 0.0% |
| Irish | 322 | 3.1% |
| Italian | 24 | 0.2% |
| Korean | 7 | 0.1% |
| Lebanese | 6 | 0.1% |
| Luxembourger | 8 | 0.1% |
| Mexican | 49 | 0.5% |
| Native Hawaiian | 1 | 0.0% |
| Navajo | 14 | 0.1% |
| Norwegian | 1,665 | 16.3% |
| Polish | 215 | 2.1% |
| Portuguese | 1 | 0.0% |
| Potawatomi | 13 | 0.1% |
| Puerto Rican | 11 | 0.1% |
| Puget Sound Salish | 24 | 0.2% |
| Russian | 11 | 0.1% |
| Scandinavian | 82 | 0.8% |
| Scotch-Irish | 35 | 0.3% |
| Scottish | 141 | 1.4% |
| Sioux | 3,748 | 36.6% |
| Slovak | 2 | 0.0% |
| South African | 16 | 0.2% |
| South American | 2 | 0.0% |
| Spaniard | 10 | 0.1% |
| Subsaharan African | 19 | 0.2% |
| Swedish | 356 | 3.5% |
| Swiss | 34 | 0.3% |
| Syrian | 1 | 0.0% |
| Ukrainian | 3 | 0.0% |
| Welsh | 1 | 0.0% | View All 56 Rows |
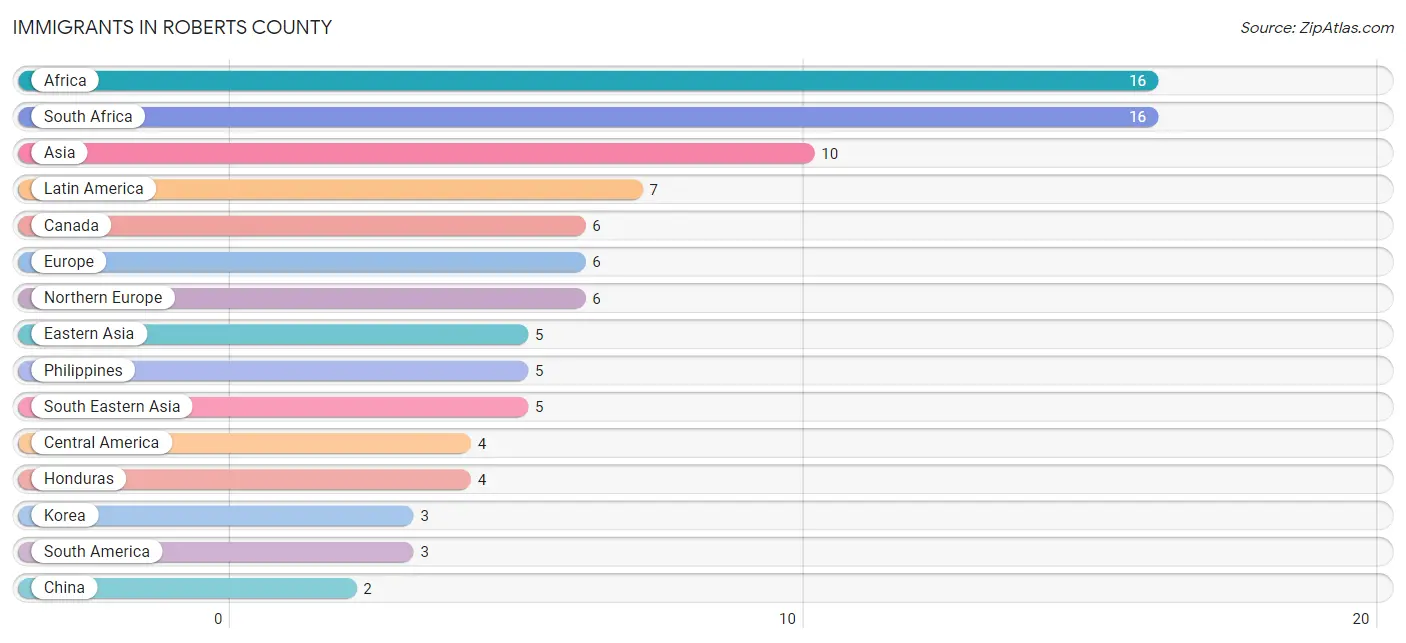
Immigrants in Roberts County
The most numerous immigrant groups reported in Roberts County came from Africa (16 | 0.2%), South Africa (16 | 0.2%), Asia (10 | 0.1%), Latin America (7 | 0.1%), and Canada (6 | 0.1%), together accounting for 0.6% of all Roberts County residents.
| Immigration Origin | # Population | % Population |
| Africa | 16 | 0.2% |
| Asia | 10 | 0.1% |
| Brazil | 1 | 0.0% |
| Canada | 6 | 0.1% |
| Central America | 4 | 0.0% |
| China | 2 | 0.0% |
| Eastern Asia | 5 | 0.1% |
| Ecuador | 2 | 0.0% |
| Europe | 6 | 0.1% |
| Honduras | 4 | 0.0% |
| Hong Kong | 2 | 0.0% |
| Korea | 3 | 0.0% |
| Latin America | 7 | 0.1% |
| Northern Europe | 6 | 0.1% |
| Philippines | 5 | 0.1% |
| South Africa | 16 | 0.2% |
| South America | 3 | 0.0% |
| South Eastern Asia | 5 | 0.1% | View All 18 Rows |
Sex and Age in Roberts County
Sex and Age in Roberts County
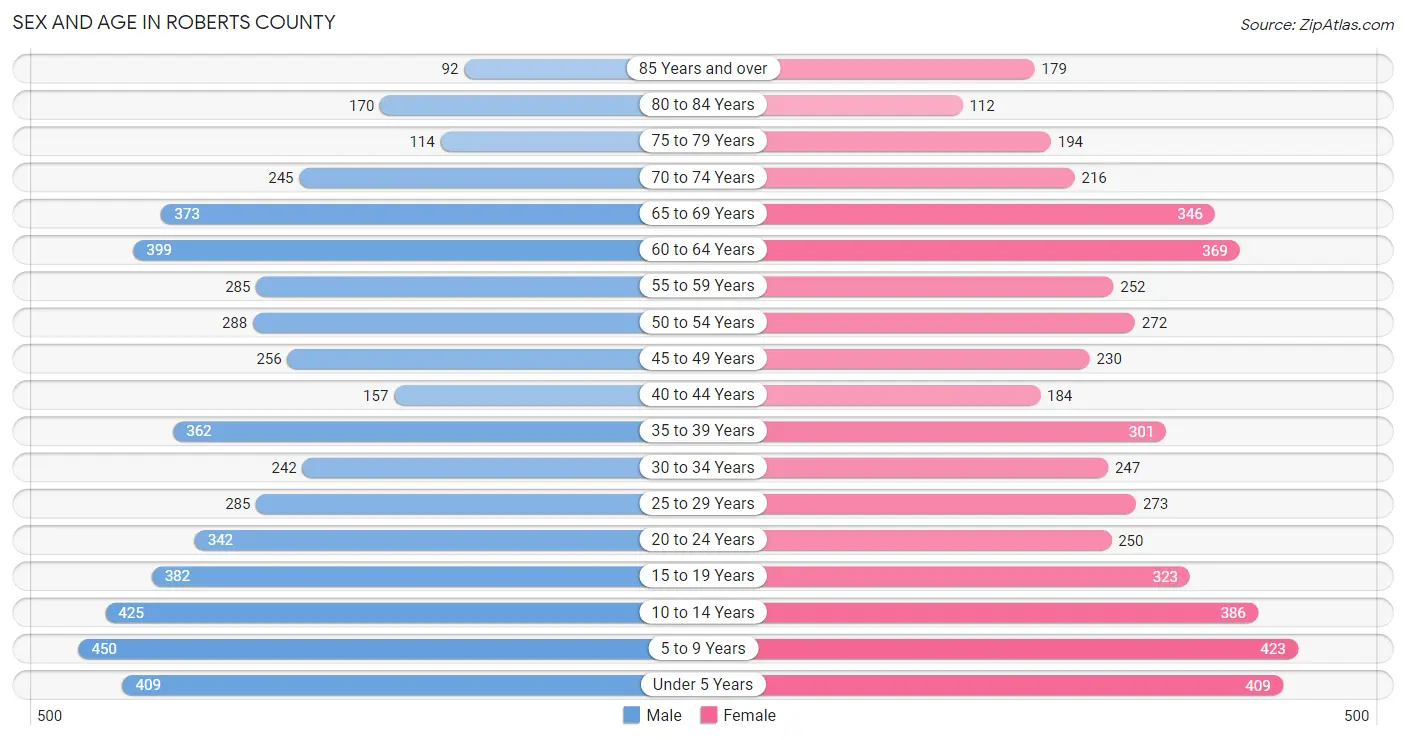
The most populous age groups in Roberts County are 5 to 9 Years (450 | 8.5%) for men and 5 to 9 Years (423 | 8.5%) for women.
| Age Bracket | Male | Female |
| Under 5 Years | 409 (7.7%) | 409 (8.2%) |
| 5 to 9 Years | 450 (8.5%) | 423 (8.5%) |
| 10 to 14 Years | 425 (8.1%) | 386 (7.8%) |
| 15 to 19 Years | 382 (7.2%) | 323 (6.5%) |
| 20 to 24 Years | 342 (6.5%) | 250 (5.0%) |
| 25 to 29 Years | 285 (5.4%) | 273 (5.5%) |
| 30 to 34 Years | 242 (4.6%) | 247 (5.0%) |
| 35 to 39 Years | 362 (6.9%) | 301 (6.1%) |
| 40 to 44 Years | 157 (3.0%) | 184 (3.7%) |
| 45 to 49 Years | 256 (4.9%) | 230 (4.6%) |
| 50 to 54 Years | 288 (5.5%) | 272 (5.5%) |
| 55 to 59 Years | 285 (5.4%) | 252 (5.1%) |
| 60 to 64 Years | 399 (7.6%) | 369 (7.4%) |
| 65 to 69 Years | 373 (7.1%) | 346 (7.0%) |
| 70 to 74 Years | 245 (4.6%) | 216 (4.3%) |
| 75 to 79 Years | 114 (2.2%) | 194 (3.9%) |
| 80 to 84 Years | 170 (3.2%) | 112 (2.3%) |
| 85 Years and over | 92 (1.7%) | 179 (3.6%) |
| Total | 5,276 (100.0%) | 4,966 (100.0%) |
Families and Households in Roberts County
Median Family Size in Roberts County
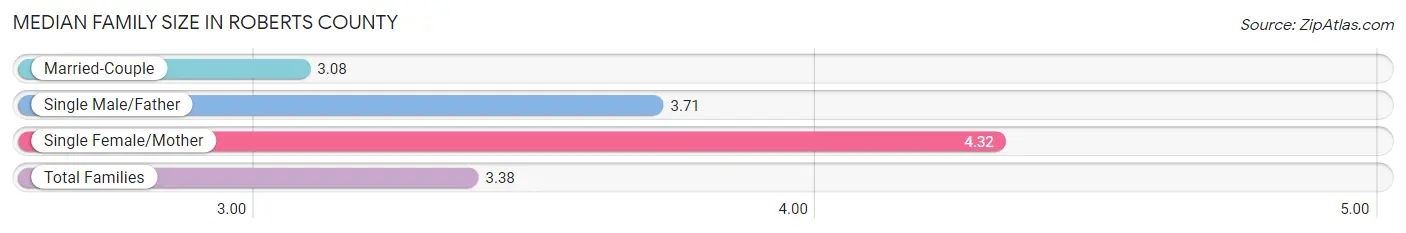
The median family size in Roberts County is 3.38 persons per family, with single female/mother families (492 | 19.7%) accounting for the largest median family size of 4.32 persons per family. On the other hand, married-couple families (1,767 | 70.9%) represent the smallest median family size with 3.08 persons per family.
| Family Type | # Families | Family Size |
| Married-Couple | 1,767 (70.9%) | 3.08 |
| Single Male/Father | 235 (9.4%) | 3.71 |
| Single Female/Mother | 492 (19.7%) | 4.32 |
| Total Families | 2,494 (100.0%) | 3.38 |
Median Household Size in Roberts County
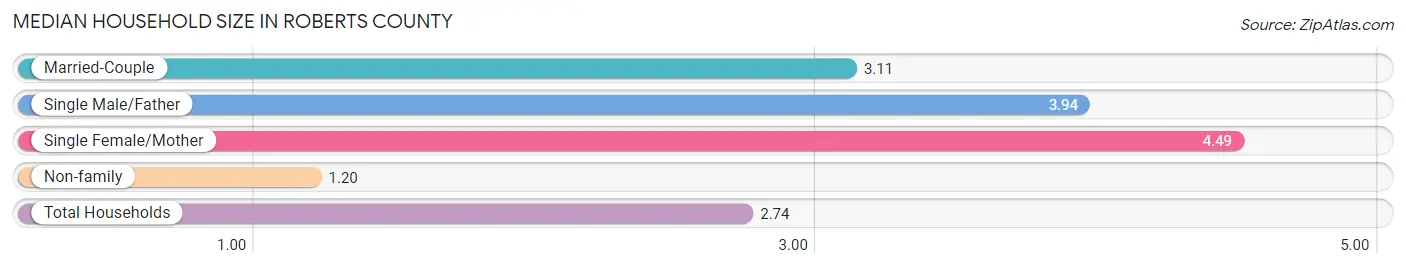
The median household size in Roberts County is 2.74 persons per household, with single female/mother households (492 | 13.5%) accounting for the largest median household size of 4.49 persons per household. non-family households (1,165 | 31.8%) represent the smallest median household size with 1.20 persons per household.
| Household Type | # Households | Household Size |
| Married-Couple | 1,767 (48.3%) | 3.11 |
| Single Male/Father | 235 (6.4%) | 3.94 |
| Single Female/Mother | 492 (13.5%) | 4.49 |
| Non-family | 1,165 (31.8%) | 1.20 |
| Total Households | 3,659 (100.0%) | 2.74 |
Household Size by Marriage Status in Roberts County
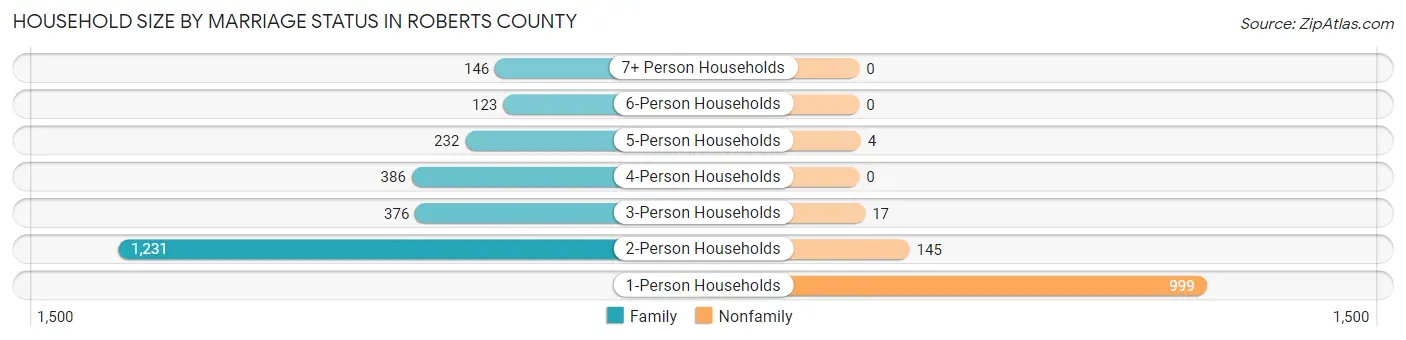
Out of a total of 3,659 households in Roberts County, 2,494 (68.2%) are family households, while 1,165 (31.8%) are nonfamily households. The most numerous type of family households are 2-person households, comprising 1,231, and the most common type of nonfamily households are 1-person households, comprising 999.
| Household Size | Family Households | Nonfamily Households |
| 1-Person Households | - | 999 (27.3%) |
| 2-Person Households | 1,231 (33.6%) | 145 (4.0%) |
| 3-Person Households | 376 (10.3%) | 17 (0.5%) |
| 4-Person Households | 386 (10.5%) | 0 (0.0%) |
| 5-Person Households | 232 (6.3%) | 4 (0.1%) |
| 6-Person Households | 123 (3.4%) | 0 (0.0%) |
| 7+ Person Households | 146 (4.0%) | 0 (0.0%) |
| Total | 2,494 (68.2%) | 1,165 (31.8%) |
Female Fertility in Roberts County
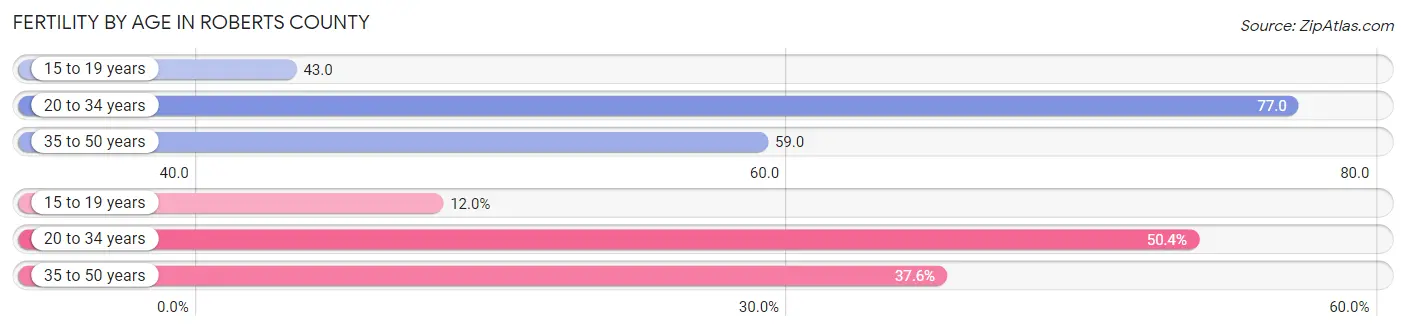
Fertility by Age in Roberts County
Average fertility rate in Roberts County is 64.0 births per 1,000 women. Women in the age bracket of 20 to 34 years have the highest fertility rate with 77.0 births per 1,000 women. Women in the age bracket of 20 to 34 years acount for 50.4% of all women with births.
| Age Bracket | Women with Births | Births / 1,000 Women |
| 15 to 19 years | 14 (12.0%) | 43.0 |
| 20 to 34 years | 59 (50.4%) | 77.0 |
| 35 to 50 years | 44 (37.6%) | 59.0 |
| Total | 117 (100.0%) | 64.0 |
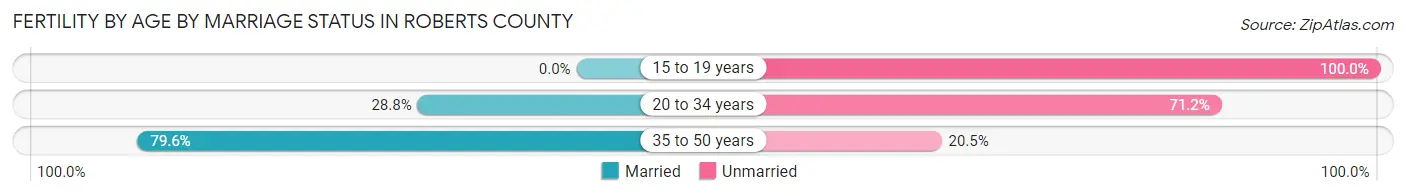
Fertility by Age by Marriage Status in Roberts County
44.4% of women with births (117) in Roberts County are married. The highest percentage of unmarried women with births falls into 15 to 19 years age bracket with 100.0% of them unmarried at the time of birth, while the lowest percentage of unmarried women with births belong to 35 to 50 years age bracket with 20.5% of them unmarried.
| Age Bracket | Married | Unmarried |
| 15 to 19 years | 0 (0.0%) | 14 (100.0%) |
| 20 to 34 years | 17 (28.8%) | 42 (71.2%) |
| 35 to 50 years | 35 (79.5%) | 9 (20.4%) |
| Total | 52 (44.4%) | 65 (55.6%) |
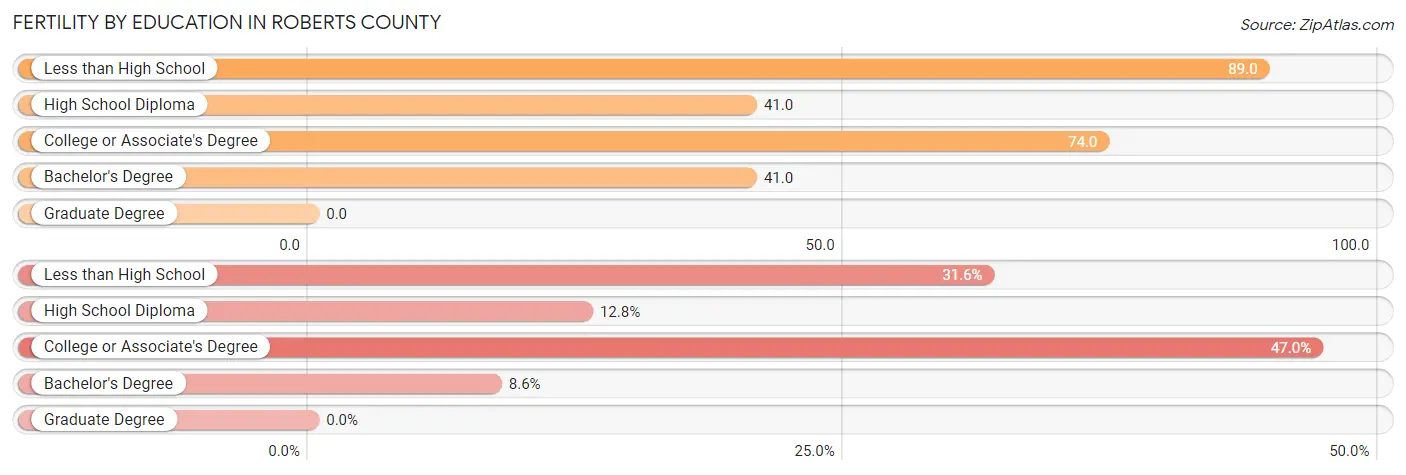
Fertility by Education in Roberts County
| Educational Attainment | Women with Births | Births / 1,000 Women |
| Less than High School | 37 (31.6%) | 89.0 |
| High School Diploma | 15 (12.8%) | 41.0 |
| College or Associate's Degree | 55 (47.0%) | 74.0 |
| Bachelor's Degree | 10 (8.6%) | 41.0 |
| Graduate Degree | 0 (0.0%) | 0.0 |
| Total | 117 (100.0%) | 64.0 |
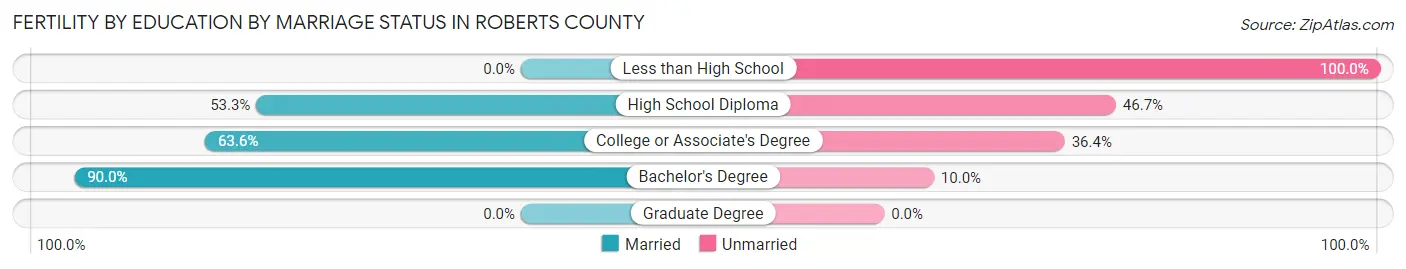
Fertility by Education by Marriage Status in Roberts County
55.6% of women with births in Roberts County are unmarried. Women with the educational attainment of bachelor's degree are most likely to be married with 90.0% of them married at childbirth, while women with the educational attainment of less than high school are least likely to be married with 100.0% of them unmarried at childbirth.
| Educational Attainment | Married | Unmarried |
| Less than High School | 0 (0.0%) | 37 (100.0%) |
| High School Diploma | 8 (53.3%) | 7 (46.7%) |
| College or Associate's Degree | 35 (63.6%) | 20 (36.4%) |
| Bachelor's Degree | 9 (90.0%) | 1 (10.0%) |
| Graduate Degree | 0 (0.0%) | 0 (0.0%) |
| Total | 52 (44.4%) | 65 (55.6%) |
Income in Roberts County
Income Overview in Roberts County
Per Capita Income in Roberts County is $28,613, while median incomes of families and households are $69,333 and $59,022 respectively.
| Characteristic | Number | Measure |
| Per Capita Income | 10,242 | $28,613 |
| Median Family Income | 2,494 | $69,333 |
| Mean Family Income | 2,494 | $85,457 |
| Median Household Income | 3,659 | $59,022 |
| Mean Household Income | 3,659 | $74,895 |
| Income Deficit | 2,494 | $11,432 |
| Wage / Income Gap (%) | 10,242 | 24.84% |
| Wage / Income Gap ($) | 10,242 | 75.16¢ per $1 |
| Gini / Inequality Index | 10,242 | 0.43 |
Earnings by Sex in Roberts County
Average Earnings in Roberts County are $33,414, $38,079 for men and $28,621 for women, a difference of 24.8%.
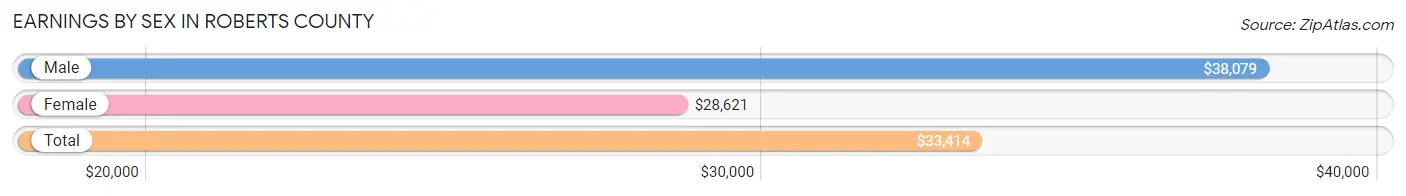
| Sex | Number | Average Earnings |
| Male | 2,740 (54.4%) | $38,079 |
| Female | 2,294 (45.6%) | $28,621 |
| Total | 5,034 (100.0%) | $33,414 |
Earnings by Sex by Income Bracket in Roberts County
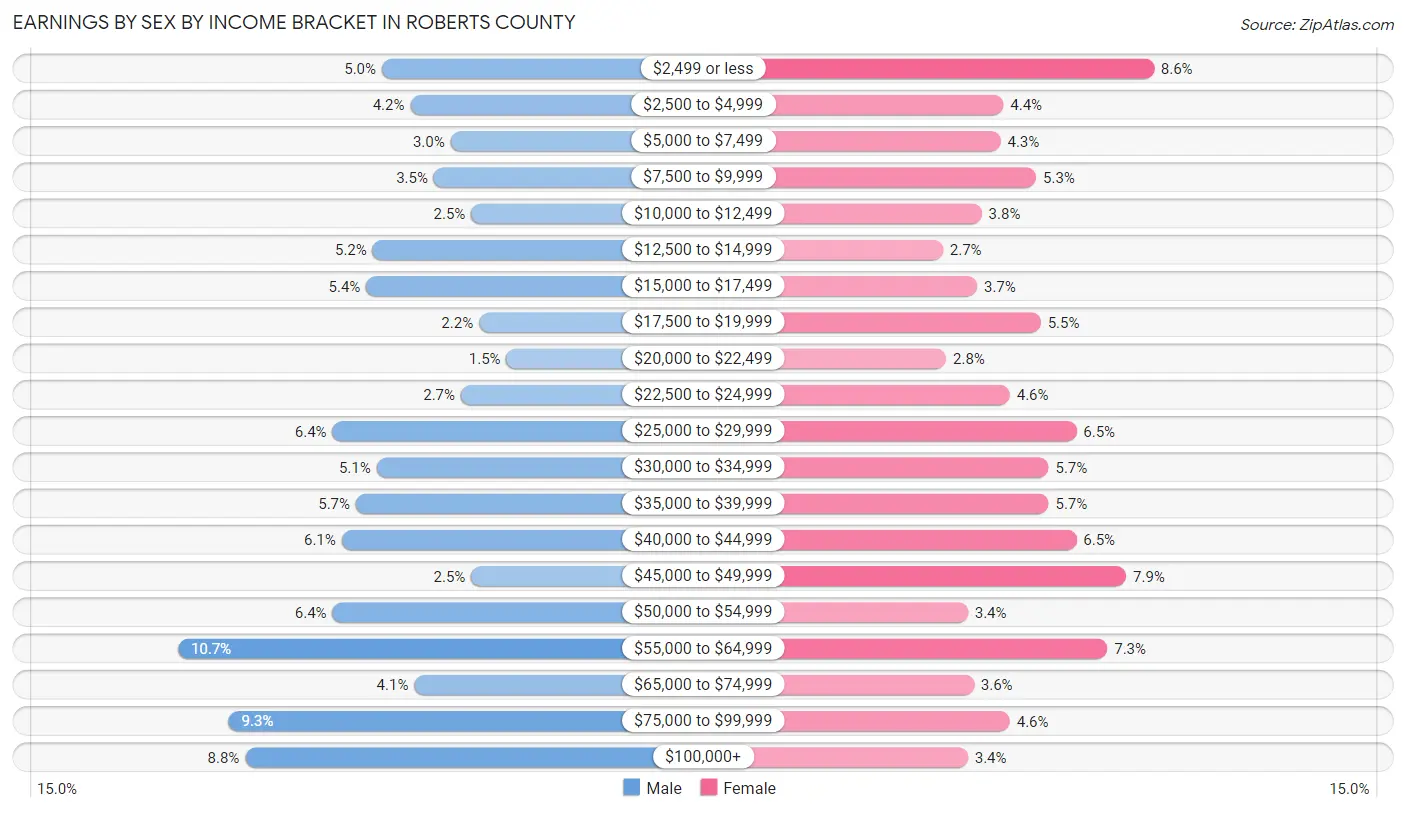
The most common earnings brackets in Roberts County are $55,000 to $64,999 for men (293 | 10.7%) and $2,499 or less for women (198 | 8.6%).
| Income | Male | Female |
| $2,499 or less | 136 (5.0%) | 198 (8.6%) |
| $2,500 to $4,999 | 114 (4.2%) | 101 (4.4%) |
| $5,000 to $7,499 | 83 (3.0%) | 99 (4.3%) |
| $7,500 to $9,999 | 96 (3.5%) | 122 (5.3%) |
| $10,000 to $12,499 | 67 (2.5%) | 87 (3.8%) |
| $12,500 to $14,999 | 143 (5.2%) | 62 (2.7%) |
| $15,000 to $17,499 | 148 (5.4%) | 84 (3.7%) |
| $17,500 to $19,999 | 61 (2.2%) | 125 (5.4%) |
| $20,000 to $22,499 | 40 (1.5%) | 64 (2.8%) |
| $22,500 to $24,999 | 75 (2.7%) | 105 (4.6%) |
| $25,000 to $29,999 | 174 (6.4%) | 148 (6.5%) |
| $30,000 to $34,999 | 140 (5.1%) | 130 (5.7%) |
| $35,000 to $39,999 | 156 (5.7%) | 130 (5.7%) |
| $40,000 to $44,999 | 167 (6.1%) | 148 (6.5%) |
| $45,000 to $49,999 | 67 (2.5%) | 180 (7.9%) |
| $50,000 to $54,999 | 174 (6.4%) | 78 (3.4%) |
| $55,000 to $64,999 | 293 (10.7%) | 168 (7.3%) |
| $65,000 to $74,999 | 111 (4.1%) | 82 (3.6%) |
| $75,000 to $99,999 | 254 (9.3%) | 105 (4.6%) |
| $100,000+ | 241 (8.8%) | 78 (3.4%) |
| Total | 2,740 (100.0%) | 2,294 (100.0%) |
Earnings by Sex by Educational Attainment in Roberts County
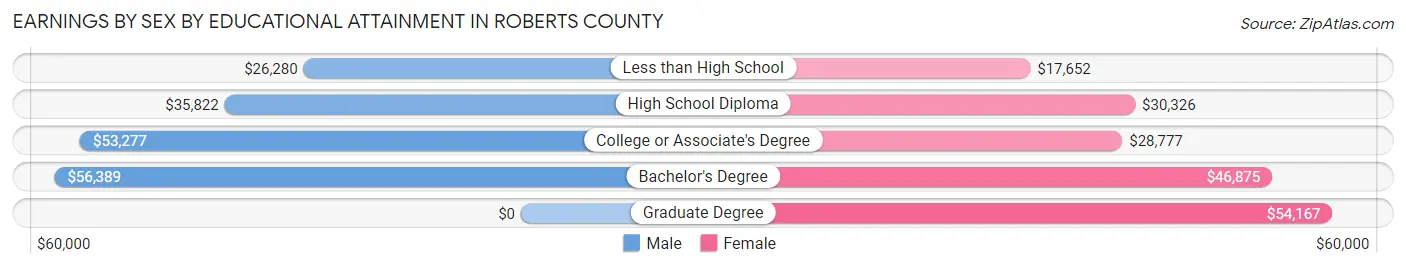
Average earnings in Roberts County are $41,781 for men and $33,158 for women, a difference of 20.6%. Men with an educational attainment of bachelor's degree enjoy the highest average annual earnings of $56,389, while those with less than high school education earn the least with $26,280. Women with an educational attainment of graduate degree earn the most with the average annual earnings of $54,167, while those with less than high school education have the smallest earnings of $17,652.
| Educational Attainment | Male Income | Female Income |
| Less than High School | $26,280 | $17,652 |
| High School Diploma | $35,822 | $30,326 |
| College or Associate's Degree | $53,277 | $28,777 |
| Bachelor's Degree | $56,389 | $46,875 |
| Graduate Degree | - | - |
| Total | $41,781 | $33,158 |
Family Income in Roberts County
Family Income Brackets in Roberts County
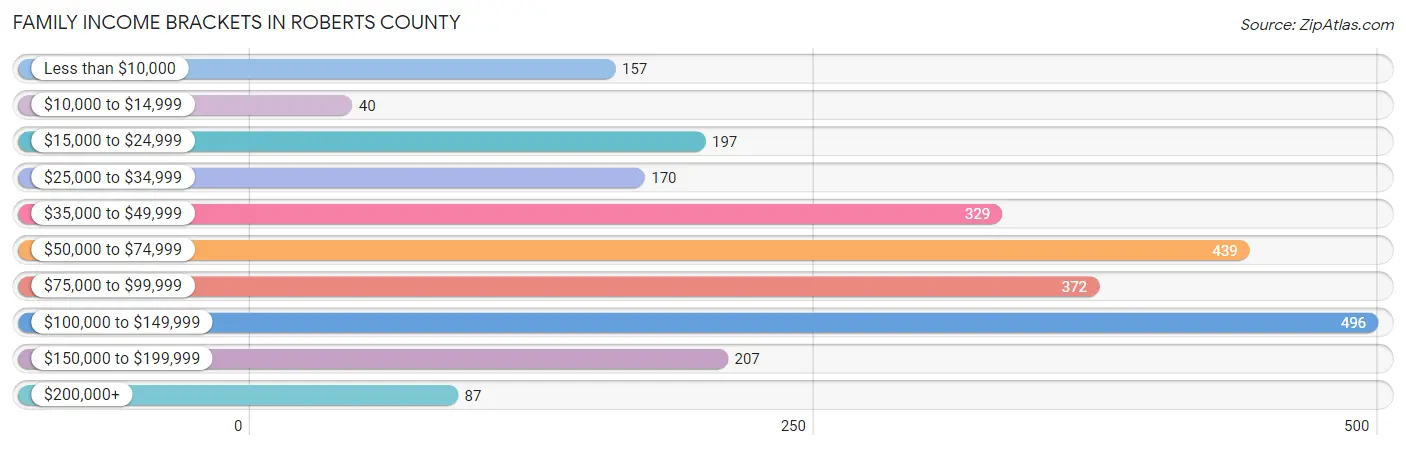
According to the Roberts County family income data, there are 496 families falling into the $100,000 to $149,999 income range, which is the most common income bracket and makes up 19.9% of all families. Conversely, the $10,000 to $14,999 income bracket is the least frequent group with only 40 families (1.6%) belonging to this category.
| Income Bracket | # Families | % Families |
| Less than $10,000 | 157 | 6.3% |
| $10,000 to $14,999 | 40 | 1.6% |
| $15,000 to $24,999 | 197 | 7.9% |
| $25,000 to $34,999 | 170 | 6.8% |
| $35,000 to $49,999 | 329 | 13.2% |
| $50,000 to $74,999 | 439 | 17.6% |
| $75,000 to $99,999 | 372 | 14.9% |
| $100,000 to $149,999 | 496 | 19.9% |
| $150,000 to $199,999 | 207 | 8.3% |
| $200,000+ | 87 | 3.5% |
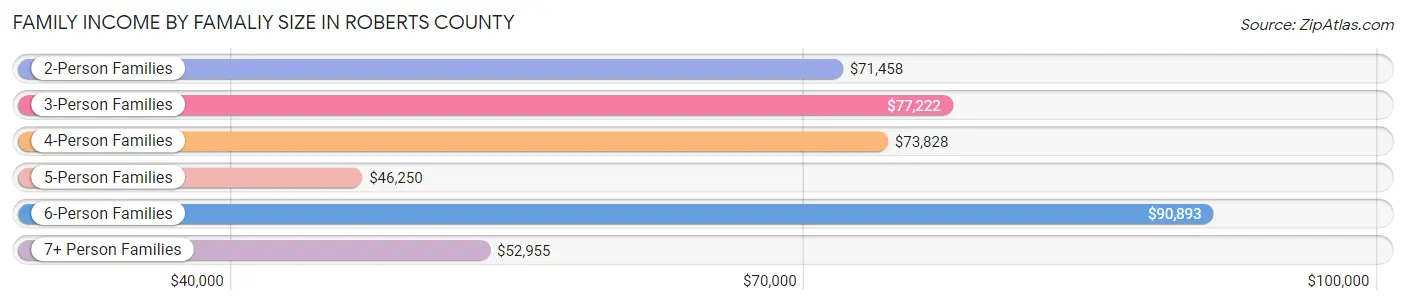
Family Income by Famaliy Size in Roberts County
6-person families (109 | 4.4%) account for the highest median family income in Roberts County with $90,893 per family, while 2-person families (1,256 | 50.4%) have the highest median income of $35,729 per family member.
| Income Bracket | # Families | Median Income |
| 2-Person Families | 1,256 (50.4%) | $71,458 |
| 3-Person Families | 386 (15.5%) | $77,222 |
| 4-Person Families | 401 (16.1%) | $73,828 |
| 5-Person Families | 198 (7.9%) | $46,250 |
| 6-Person Families | 109 (4.4%) | $90,893 |
| 7+ Person Families | 144 (5.8%) | $52,955 |
| Total | 2,494 (100.0%) | $69,333 |
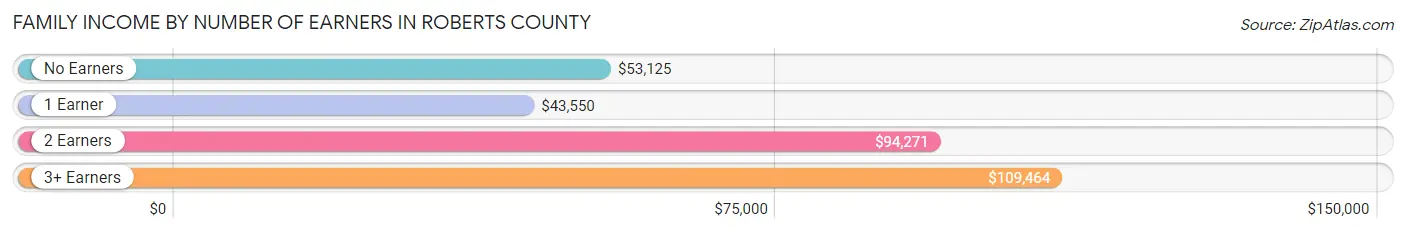
Family Income by Number of Earners in Roberts County
The median family income in Roberts County is $69,333, with families comprising 3+ earners (244) having the highest median family income of $109,464, while families with 1 earner (819) have the lowest median family income of $43,550, accounting for 9.8% and 32.8% of families, respectively.
| Number of Earners | # Families | Median Income |
| No Earners | 412 (16.5%) | $53,125 |
| 1 Earner | 819 (32.8%) | $43,550 |
| 2 Earners | 1,019 (40.9%) | $94,271 |
| 3+ Earners | 244 (9.8%) | $109,464 |
| Total | 2,494 (100.0%) | $69,333 |
Household Income in Roberts County
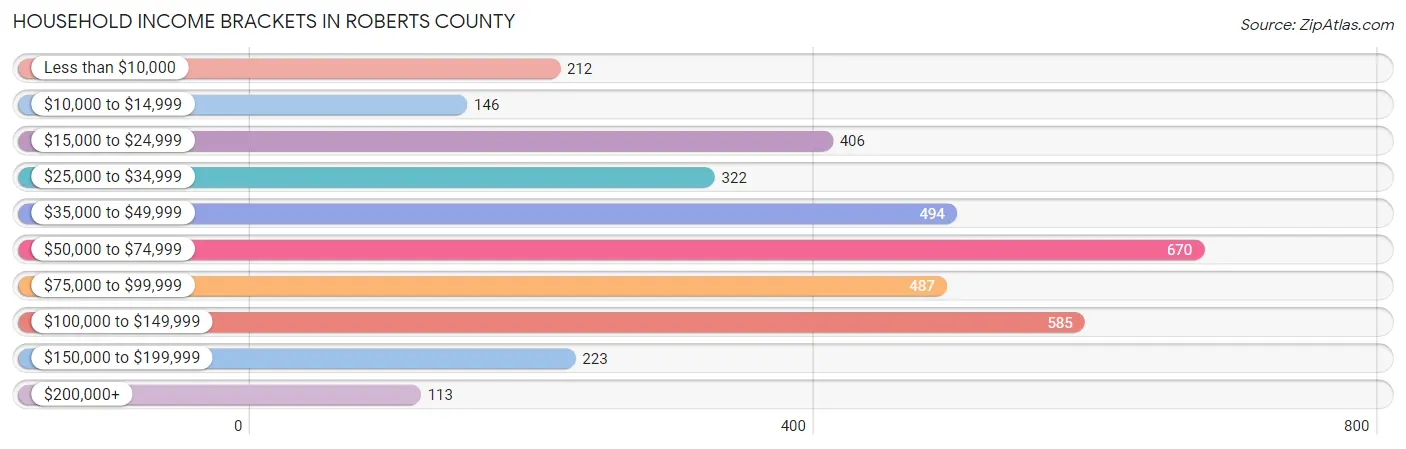
Household Income Brackets in Roberts County
With 670 households falling in the category, the $50,000 to $74,999 income range is the most frequent in Roberts County, accounting for 18.3% of all households. In contrast, only 113 households (3.1%) fall into the $200,000+ income bracket, making it the least populous group.
| Income Bracket | # Households | % Households |
| Less than $10,000 | 212 | 5.8% |
| $10,000 to $14,999 | 146 | 4.0% |
| $15,000 to $24,999 | 406 | 11.1% |
| $25,000 to $34,999 | 322 | 8.8% |
| $35,000 to $49,999 | 494 | 13.5% |
| $50,000 to $74,999 | 670 | 18.3% |
| $75,000 to $99,999 | 487 | 13.3% |
| $100,000 to $149,999 | 585 | 16.0% |
| $150,000 to $199,999 | 223 | 6.1% |
| $200,000+ | 113 | 3.1% |
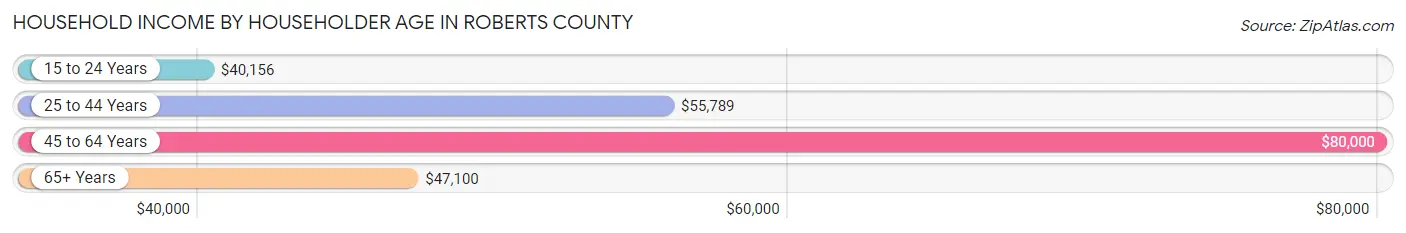
Household Income by Householder Age in Roberts County
The median household income in Roberts County is $59,022, with the highest median household income of $80,000 found in the 45 to 64 years age bracket for the primary householder. A total of 1,298 households (35.5%) fall into this category. Meanwhile, the 15 to 24 years age bracket for the primary householder has the lowest median household income of $40,156, with 99 households (2.7%) in this group.
| Income Bracket | # Households | Median Income |
| 15 to 24 Years | 99 (2.7%) | $40,156 |
| 25 to 44 Years | 980 (26.8%) | $55,789 |
| 45 to 64 Years | 1,298 (35.5%) | $80,000 |
| 65+ Years | 1,282 (35.0%) | $47,100 |
| Total | 3,659 (100.0%) | $59,022 |
Poverty in Roberts County
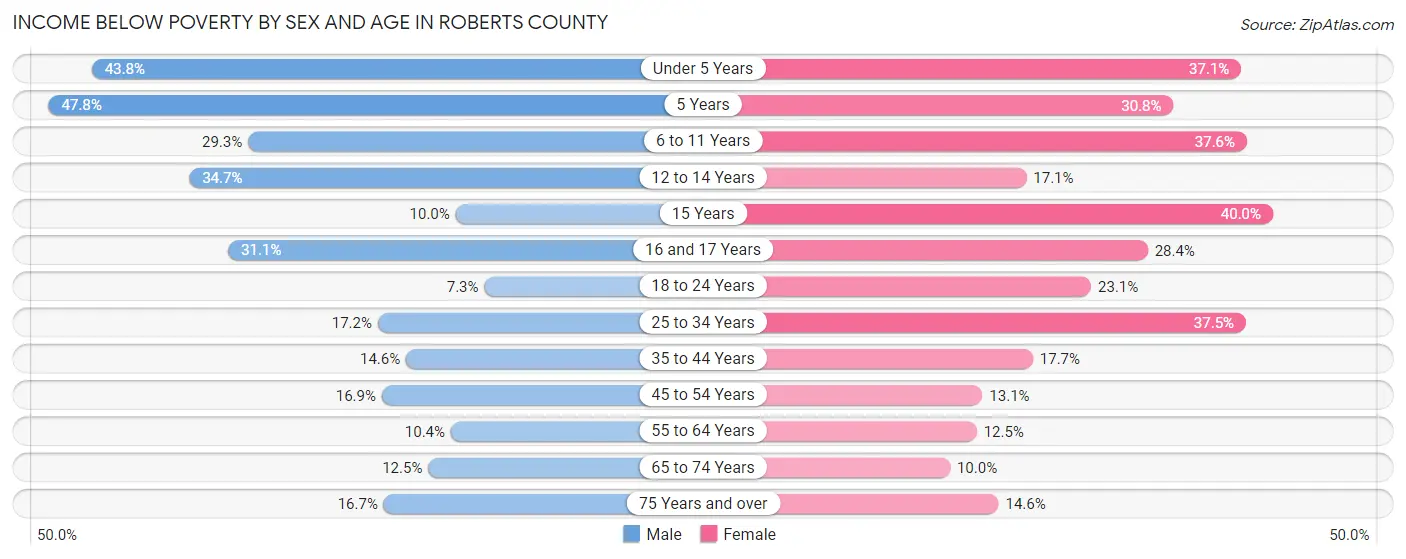
Income Below Poverty by Sex and Age in Roberts County
With 19.4% poverty level for males and 22.4% for females among the residents of Roberts County, 5 year old males and 15 year old females are the most vulnerable to poverty, with 43 males (47.8%) and 22 females (40.0%) in their respective age groups living below the poverty level.
| Age Bracket | Male | Female |
| Under 5 Years | 179 (43.8%) | 149 (37.1%) |
| 5 Years | 43 (47.8%) | 20 (30.8%) |
| 6 to 11 Years | 158 (29.3%) | 203 (37.6%) |
| 12 to 14 Years | 75 (34.7%) | 31 (17.1%) |
| 15 Years | 9 (10.0%) | 22 (40.0%) |
| 16 and 17 Years | 42 (31.1%) | 44 (28.4%) |
| 18 to 24 Years | 36 (7.3%) | 84 (23.1%) |
| 25 to 34 Years | 88 (17.2%) | 186 (37.5%) |
| 35 to 44 Years | 74 (14.6%) | 86 (17.7%) |
| 45 to 54 Years | 90 (16.9%) | 65 (13.1%) |
| 55 to 64 Years | 71 (10.4%) | 77 (12.5%) |
| 65 to 74 Years | 77 (12.5%) | 56 (10.0%) |
| 75 Years and over | 56 (16.7%) | 64 (14.5%) |
| Total | 998 (19.4%) | 1,087 (22.4%) |
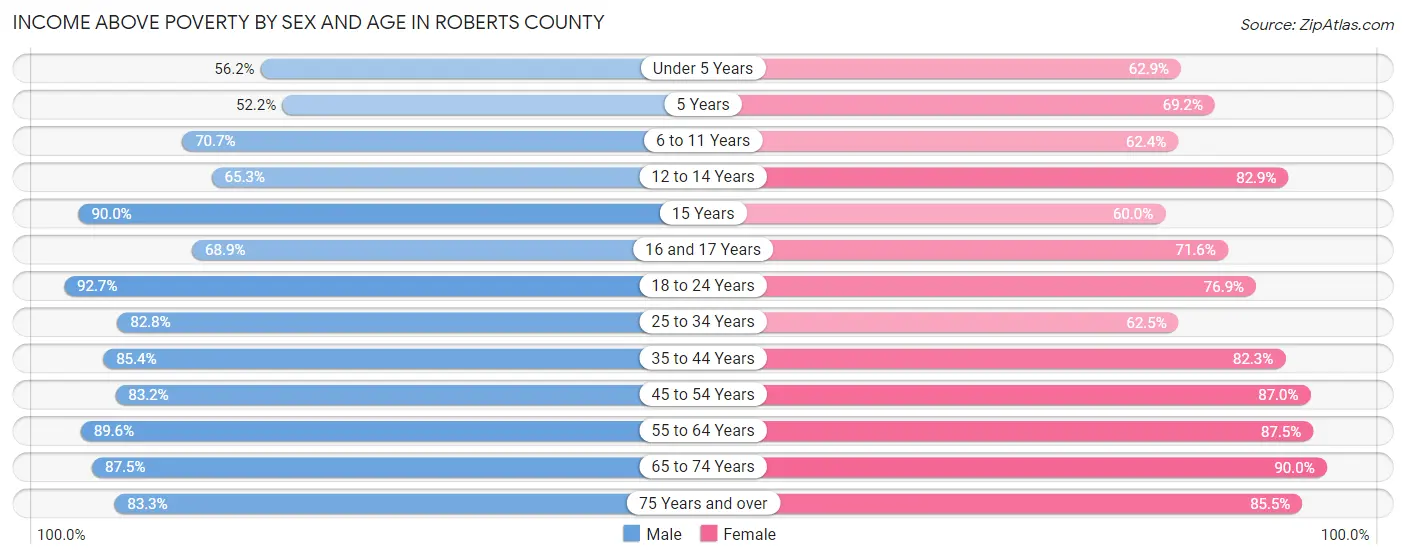
Income Above Poverty by Sex and Age in Roberts County
According to the poverty statistics in Roberts County, males aged 18 to 24 years and females aged 65 to 74 years are the age groups that are most secure financially, with 92.7% of males and 90.0% of females in these age groups living above the poverty line.
| Age Bracket | Male | Female |
| Under 5 Years | 230 (56.2%) | 253 (62.9%) |
| 5 Years | 47 (52.2%) | 45 (69.2%) |
| 6 to 11 Years | 382 (70.7%) | 337 (62.4%) |
| 12 to 14 Years | 141 (65.3%) | 150 (82.9%) |
| 15 Years | 81 (90.0%) | 33 (60.0%) |
| 16 and 17 Years | 93 (68.9%) | 111 (71.6%) |
| 18 to 24 Years | 455 (92.7%) | 279 (76.9%) |
| 25 to 34 Years | 423 (82.8%) | 310 (62.5%) |
| 35 to 44 Years | 433 (85.4%) | 399 (82.3%) |
| 45 to 54 Years | 444 (83.2%) | 433 (87.0%) |
| 55 to 64 Years | 609 (89.6%) | 538 (87.5%) |
| 65 to 74 Years | 537 (87.5%) | 502 (90.0%) |
| 75 Years and over | 280 (83.3%) | 376 (85.5%) |
| Total | 4,155 (80.6%) | 3,766 (77.6%) |
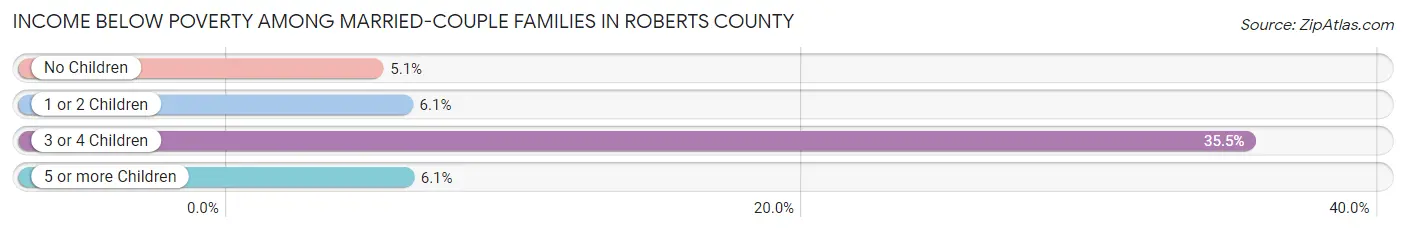
Income Below Poverty Among Married-Couple Families in Roberts County
The poverty statistics for married-couple families in Roberts County show that 8.6% or 151 of the total 1,767 families live below the poverty line. Families with 3 or 4 children have the highest poverty rate of 35.4%, comprising of 67 families. On the other hand, families with no children have the lowest poverty rate of 5.1%, which includes 59 families.
| Children | Above Poverty | Below Poverty |
| No Children | 1,108 (94.9%) | 59 (5.1%) |
| 1 or 2 Children | 340 (93.9%) | 22 (6.1%) |
| 3 or 4 Children | 122 (64.5%) | 67 (35.4%) |
| 5 or more Children | 46 (93.9%) | 3 (6.1%) |
| Total | 1,616 (91.4%) | 151 (8.6%) |
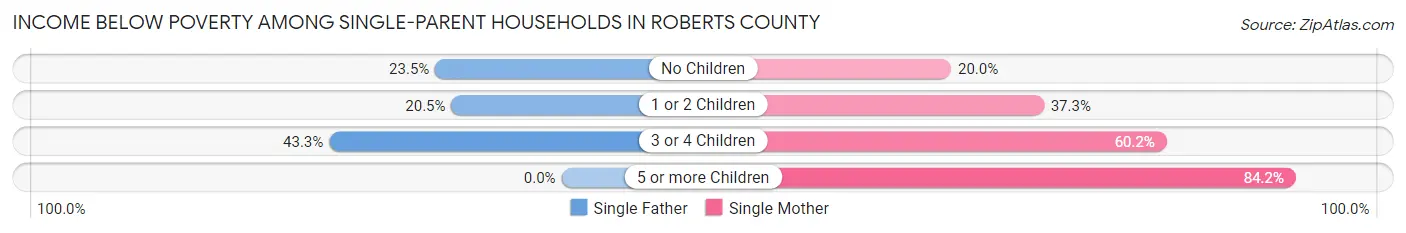
Income Below Poverty Among Single-Parent Households in Roberts County
According to the poverty data in Roberts County, 27.7% or 65 single-father households and 44.9% or 221 single-mother households are living below the poverty line. Among single-father households, those with 3 or 4 children have the highest poverty rate, with 29 households (43.3%) experiencing poverty. Likewise, among single-mother households, those with 5 or more children have the highest poverty rate, with 48 households (84.2%) falling below the poverty line.
| Children | Single Father | Single Mother |
| No Children | 12 (23.5%) | 20 (20.0%) |
| 1 or 2 Children | 24 (20.5%) | 79 (37.3%) |
| 3 or 4 Children | 29 (43.3%) | 74 (60.2%) |
| 5 or more Children | 0 (0.0%) | 48 (84.2%) |
| Total | 65 (27.7%) | 221 (44.9%) |
Income Below Poverty Among Married-Couple vs Single-Parent Households in Roberts County
The poverty data for Roberts County shows that 151 of the married-couple family households (8.6%) and 286 of the single-parent households (39.3%) are living below the poverty level. Within the married-couple family households, those with 3 or 4 children have the highest poverty rate, with 67 households (35.4%) falling below the poverty line. Among the single-parent households, those with 5 or more children have the highest poverty rate, with 48 household (84.2%) living below poverty.
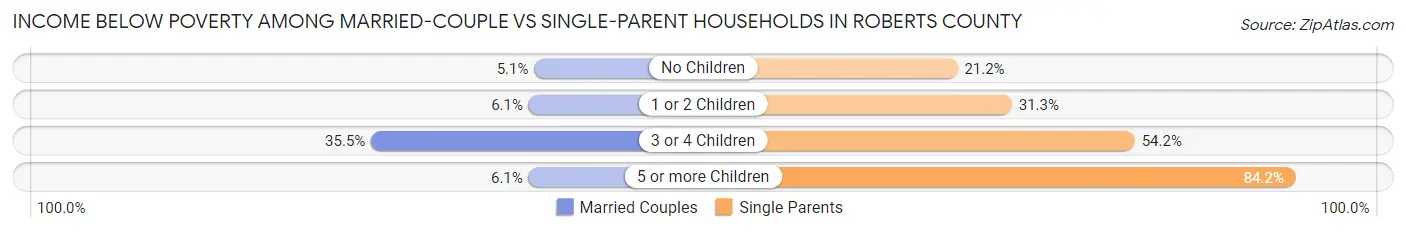
| Children | Married-Couple Families | Single-Parent Households |
| No Children | 59 (5.1%) | 32 (21.2%) |
| 1 or 2 Children | 22 (6.1%) | 103 (31.3%) |
| 3 or 4 Children | 67 (35.4%) | 103 (54.2%) |
| 5 or more Children | 3 (6.1%) | 48 (84.2%) |
| Total | 151 (8.6%) | 286 (39.3%) |
Employment Characteristics in Roberts County
Employment by Class of Employer in Roberts County
Among the 4,243 employed individuals in Roberts County, private company employees (2,186 | 51.5%), local government employees (604 | 14.2%), and self-employed (not incorporated) (547 | 12.9%) make up the most common classes of employment.
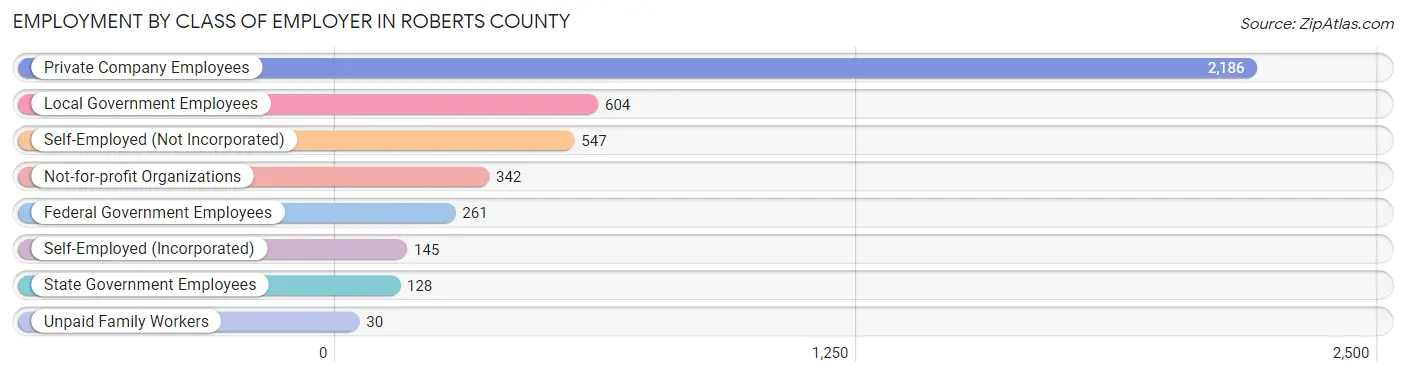
| Employer Class | # Employees | % Employees |
| Private Company Employees | 2,186 | 51.5% |
| Self-Employed (Incorporated) | 145 | 3.4% |
| Self-Employed (Not Incorporated) | 547 | 12.9% |
| Not-for-profit Organizations | 342 | 8.1% |
| Local Government Employees | 604 | 14.2% |
| State Government Employees | 128 | 3.0% |
| Federal Government Employees | 261 | 6.1% |
| Unpaid Family Workers | 30 | 0.7% |
| Total | 4,243 | 100.0% |
Employment Status by Age in Roberts County
According to the labor force statistics for Roberts County, out of the total population over 16 years of age (7,595), 60.5% or 4,595 individuals are in the labor force, with 5.2% or 239 of them unemployed. The age group with the highest labor force participation rate is 35 to 44 years, with 86.3% or 866 individuals in the labor force. Within the labor force, the 25 to 29 years age range has the highest percentage of unemployed individuals, with 13.8% or 65 of them being unemployed.
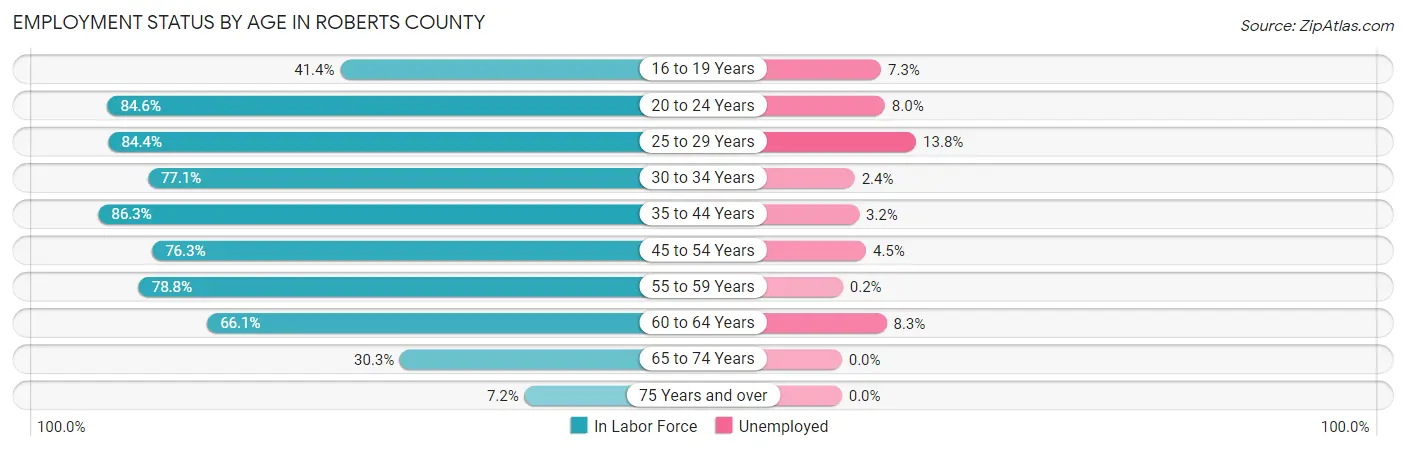
| Age Bracket | In Labor Force | Unemployed |
| 16 to 19 Years | 232 (41.4%) | 17 (7.3%) |
| 20 to 24 Years | 501 (84.6%) | 40 (8.0%) |
| 25 to 29 Years | 471 (84.4%) | 65 (13.8%) |
| 30 to 34 Years | 377 (77.1%) | 9 (2.4%) |
| 35 to 44 Years | 866 (86.3%) | 28 (3.2%) |
| 45 to 54 Years | 798 (76.3%) | 36 (4.5%) |
| 55 to 59 Years | 423 (78.8%) | 1 (0.2%) |
| 60 to 64 Years | 508 (66.1%) | 42 (8.3%) |
| 65 to 74 Years | 358 (30.3%) | 0 (0.0%) |
| 75 Years and over | 62 (7.2%) | 0 (0.0%) |
| Total | 4,595 (60.5%) | 239 (5.2%) |
Employment Status by Educational Attainment in Roberts County
According to labor force statistics for Roberts County, 78.2% of individuals (3,442) out of the total population between 25 and 64 years of age (4,402) are in the labor force, with 5.2% or 179 of them being unemployed. The group with the highest labor force participation rate are those with the educational attainment of college / associate degree, with 86.9% or 1,543 individuals in the labor force. Within the labor force, individuals with less than high school education have the highest percentage of unemployment, with 28.8% or 58 of them being unemployed.
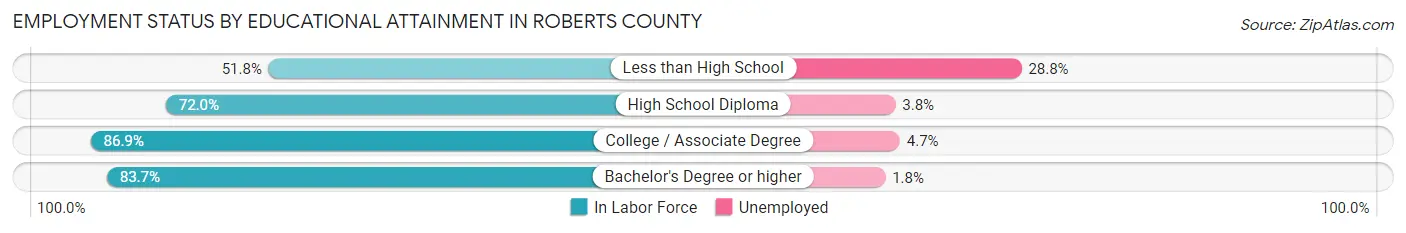
| Educational Attainment | In Labor Force | Unemployed |
| Less than High School | 201 (51.8%) | 112 (28.8%) |
| High School Diploma | 1,076 (72.0%) | 57 (3.8%) |
| College / Associate Degree | 1,543 (86.9%) | 83 (4.7%) |
| Bachelor's Degree or higher | 622 (83.7%) | 13 (1.8%) |
| Total | 3,442 (78.2%) | 229 (5.2%) |
Employment Occupations by Sex in Roberts County
Management, Business, Science and Arts Occupations
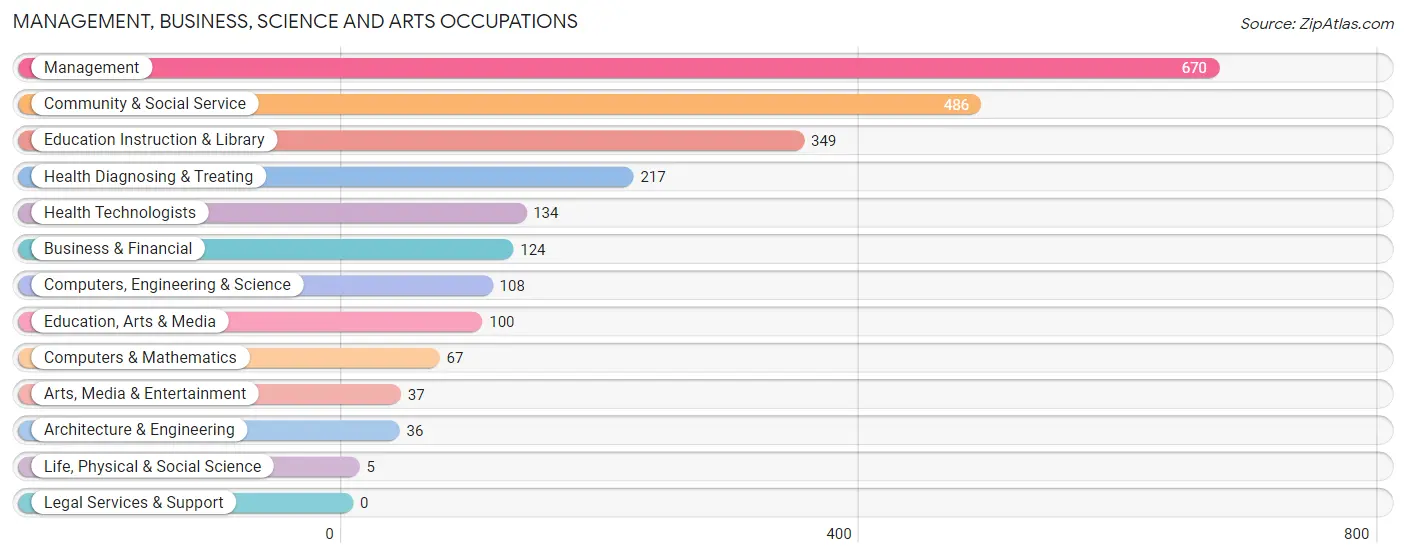
The most common Management, Business, Science and Arts occupations in Roberts County are Management (670 | 15.4%), Community & Social Service (486 | 11.2%), Education Instruction & Library (349 | 8.0%), Health Diagnosing & Treating (217 | 5.0%), and Health Technologists (134 | 3.1%).
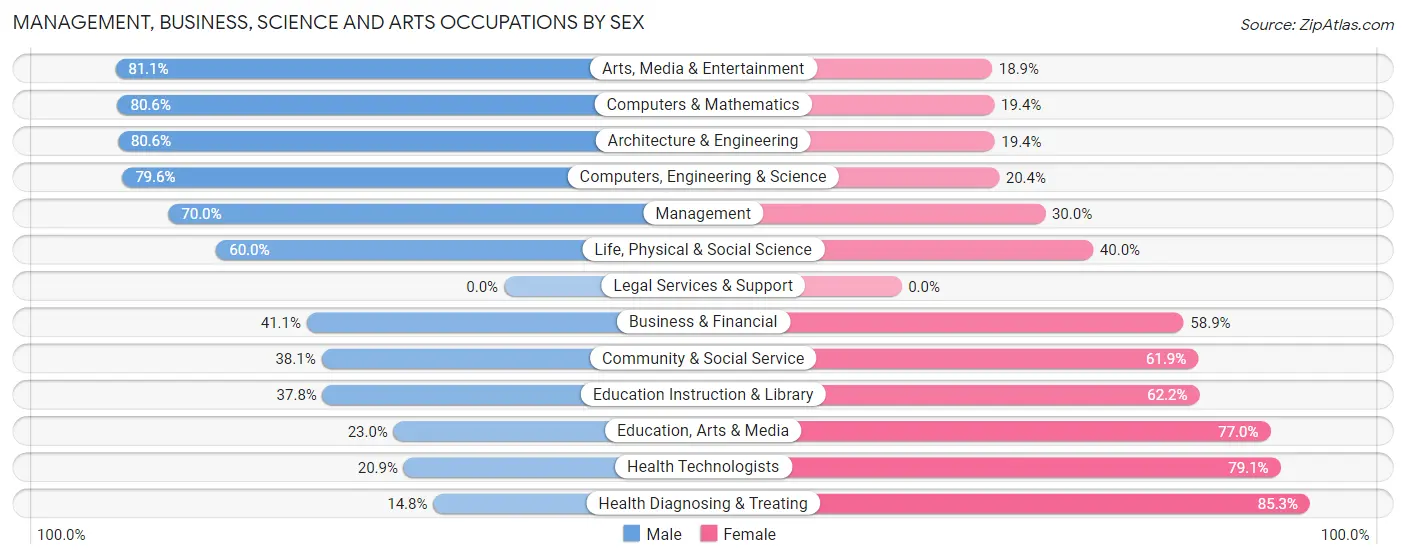
Management, Business, Science and Arts Occupations by Sex
Within the Management, Business, Science and Arts occupations in Roberts County, the most male-oriented occupations are Arts, Media & Entertainment (81.1%), Computers & Mathematics (80.6%), and Architecture & Engineering (80.6%), while the most female-oriented occupations are Health Diagnosing & Treating (85.3%), Health Technologists (79.1%), and Education, Arts & Media (77.0%).
| Occupation | Male | Female |
| Management | 469 (70.0%) | 201 (30.0%) |
| Business & Financial | 51 (41.1%) | 73 (58.9%) |
| Computers, Engineering & Science | 86 (79.6%) | 22 (20.4%) |
| Computers & Mathematics | 54 (80.6%) | 13 (19.4%) |
| Architecture & Engineering | 29 (80.6%) | 7 (19.4%) |
| Life, Physical & Social Science | 3 (60.0%) | 2 (40.0%) |
| Community & Social Service | 185 (38.1%) | 301 (61.9%) |
| Education, Arts & Media | 23 (23.0%) | 77 (77.0%) |
| Legal Services & Support | 0 (0.0%) | 0 (0.0%) |
| Education Instruction & Library | 132 (37.8%) | 217 (62.2%) |
| Arts, Media & Entertainment | 30 (81.1%) | 7 (18.9%) |
| Health Diagnosing & Treating | 32 (14.7%) | 185 (85.3%) |
| Health Technologists | 28 (20.9%) | 106 (79.1%) |
| Total (Category) | 823 (51.3%) | 782 (48.7%) |
| Total (Overall) | 2,365 (54.4%) | 1,981 (45.6%) |
Services Occupations
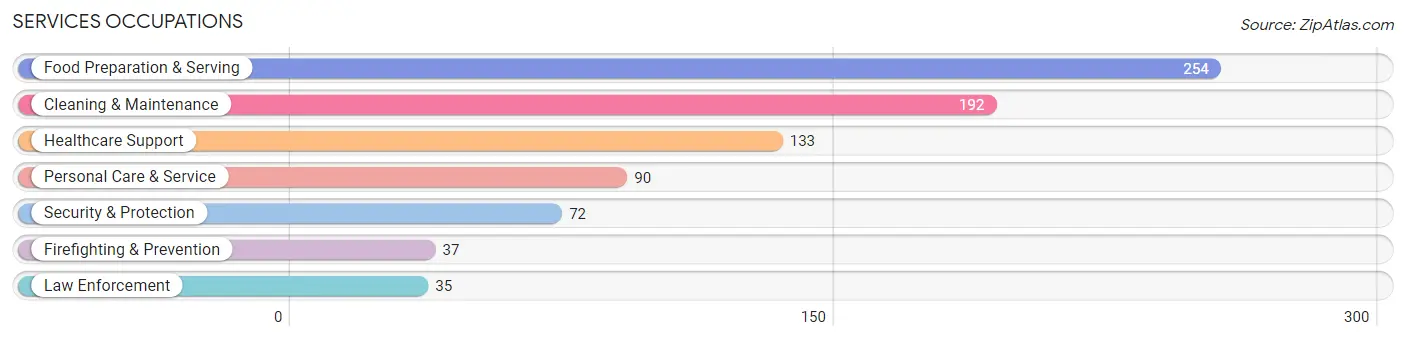
The most common Services occupations in Roberts County are Food Preparation & Serving (254 | 5.8%), Cleaning & Maintenance (192 | 4.4%), Healthcare Support (133 | 3.1%), Personal Care & Service (90 | 2.1%), and Security & Protection (72 | 1.7%).
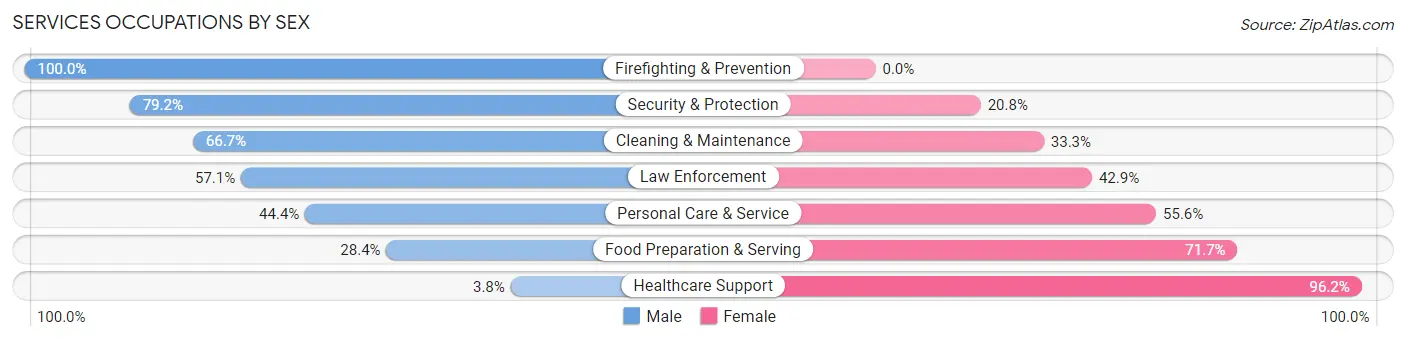
Services Occupations by Sex
Within the Services occupations in Roberts County, the most male-oriented occupations are Firefighting & Prevention (100.0%), Security & Protection (79.2%), and Cleaning & Maintenance (66.7%), while the most female-oriented occupations are Healthcare Support (96.2%), Food Preparation & Serving (71.7%), and Personal Care & Service (55.6%).
| Occupation | Male | Female |
| Healthcare Support | 5 (3.8%) | 128 (96.2%) |
| Security & Protection | 57 (79.2%) | 15 (20.8%) |
| Firefighting & Prevention | 37 (100.0%) | 0 (0.0%) |
| Law Enforcement | 20 (57.1%) | 15 (42.9%) |
| Food Preparation & Serving | 72 (28.3%) | 182 (71.7%) |
| Cleaning & Maintenance | 128 (66.7%) | 64 (33.3%) |
| Personal Care & Service | 40 (44.4%) | 50 (55.6%) |
| Total (Category) | 302 (40.8%) | 439 (59.2%) |
| Total (Overall) | 2,365 (54.4%) | 1,981 (45.6%) |
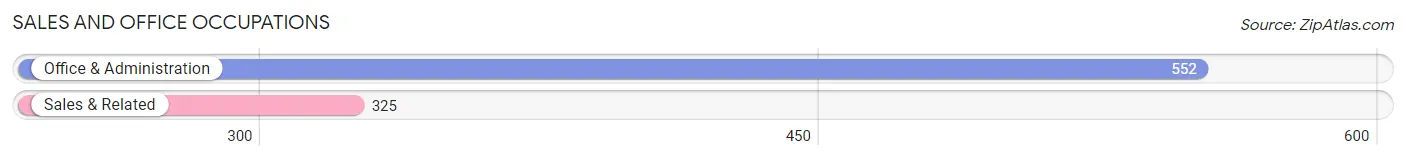
Sales and Office Occupations
The most common Sales and Office occupations in Roberts County are Office & Administration (552 | 12.7%), and Sales & Related (325 | 7.5%).
Sales and Office Occupations by Sex
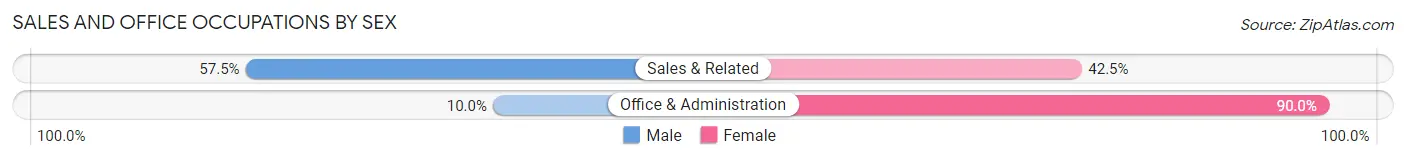
| Occupation | Male | Female |
| Sales & Related | 187 (57.5%) | 138 (42.5%) |
| Office & Administration | 55 (10.0%) | 497 (90.0%) |
| Total (Category) | 242 (27.6%) | 635 (72.4%) |
| Total (Overall) | 2,365 (54.4%) | 1,981 (45.6%) |
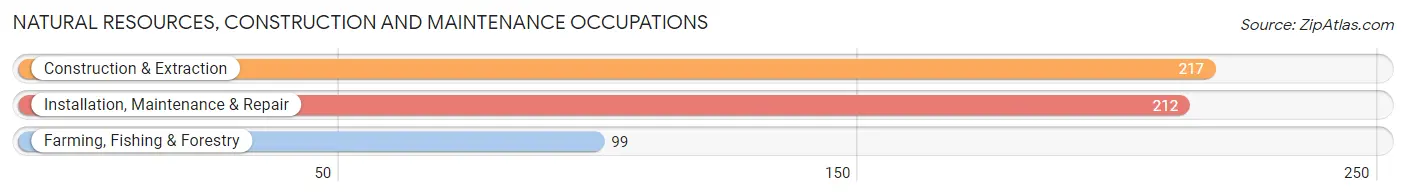
Natural Resources, Construction and Maintenance Occupations
The most common Natural Resources, Construction and Maintenance occupations in Roberts County are Construction & Extraction (217 | 5.0%), Installation, Maintenance & Repair (212 | 4.9%), and Farming, Fishing & Forestry (99 | 2.3%).
Natural Resources, Construction and Maintenance Occupations by Sex
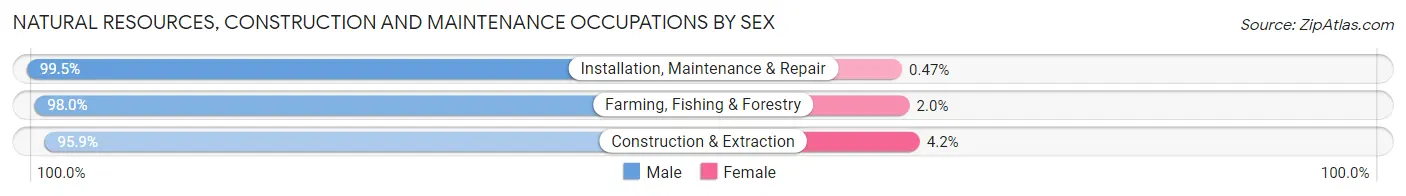
| Occupation | Male | Female |
| Farming, Fishing & Forestry | 97 (98.0%) | 2 (2.0%) |
| Construction & Extraction | 208 (95.9%) | 9 (4.2%) |
| Installation, Maintenance & Repair | 211 (99.5%) | 1 (0.5%) |
| Total (Category) | 516 (97.7%) | 12 (2.3%) |
| Total (Overall) | 2,365 (54.4%) | 1,981 (45.6%) |
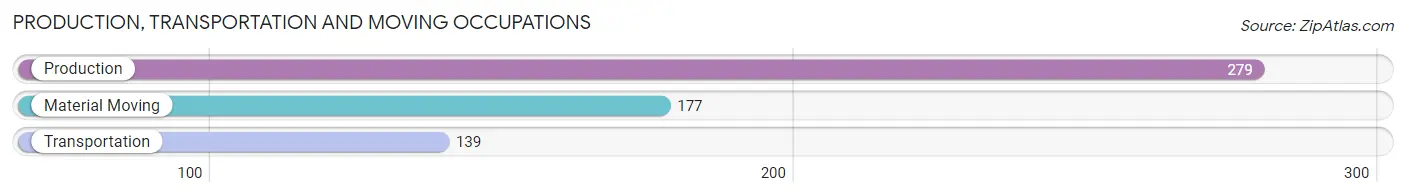
Production, Transportation and Moving Occupations
The most common Production, Transportation and Moving occupations in Roberts County are Production (279 | 6.4%), Material Moving (177 | 4.1%), and Transportation (139 | 3.2%).
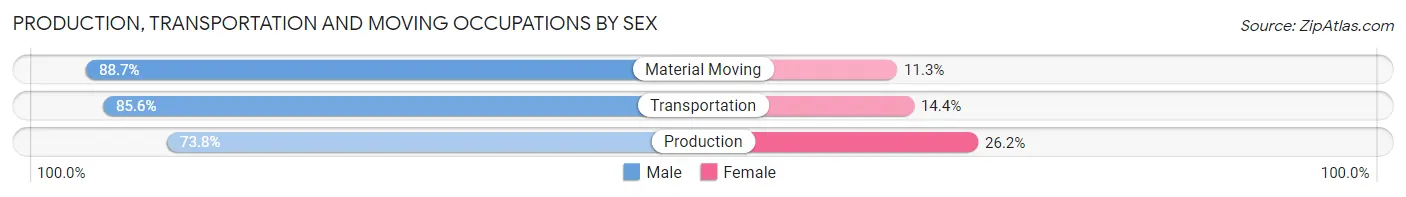
Production, Transportation and Moving Occupations by Sex
| Occupation | Male | Female |
| Production | 206 (73.8%) | 73 (26.2%) |
| Transportation | 119 (85.6%) | 20 (14.4%) |
| Material Moving | 157 (88.7%) | 20 (11.3%) |
| Total (Category) | 482 (81.0%) | 113 (19.0%) |
| Total (Overall) | 2,365 (54.4%) | 1,981 (45.6%) |
Employment Industries by Sex in Roberts County
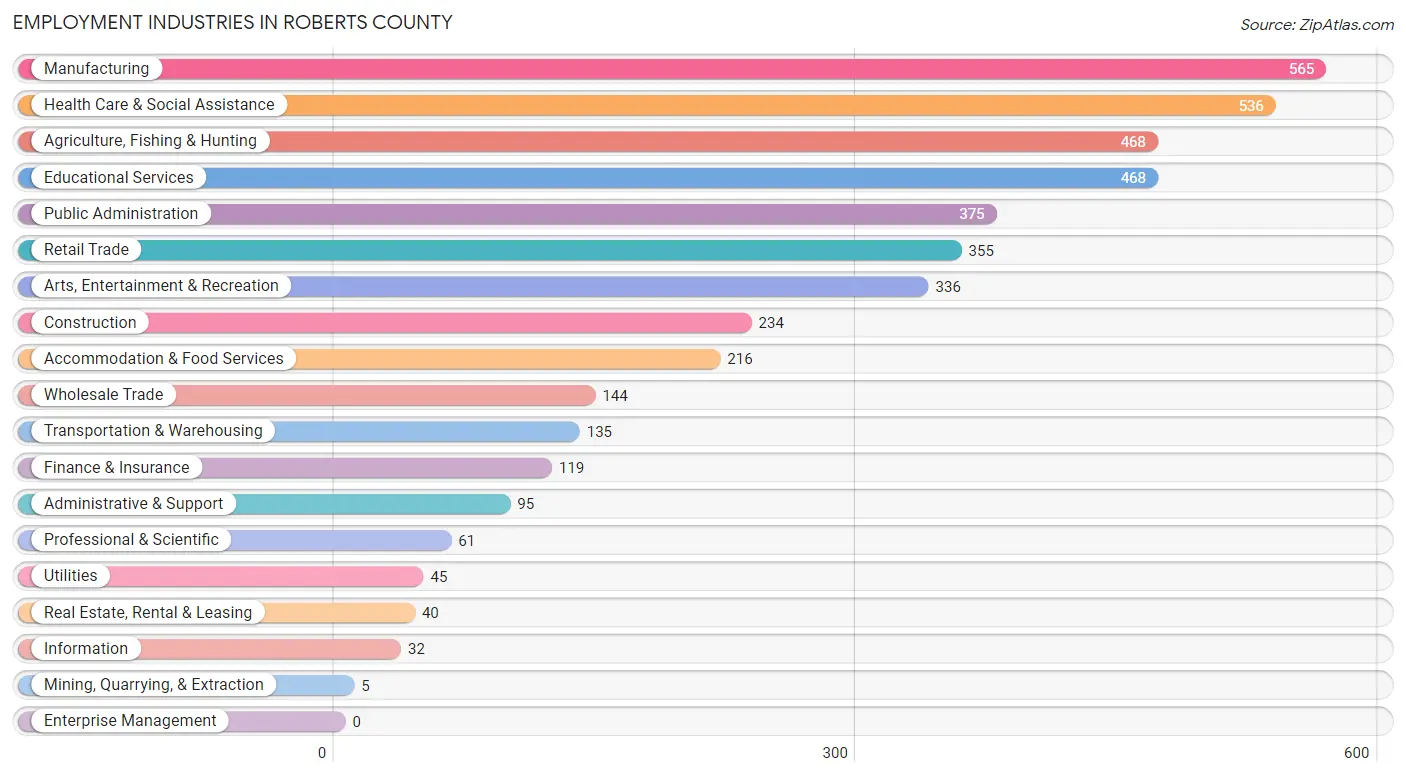
Employment Industries in Roberts County
The major employment industries in Roberts County include Manufacturing (565 | 13.0%), Health Care & Social Assistance (536 | 12.3%), Agriculture, Fishing & Hunting (468 | 10.8%), Educational Services (468 | 10.8%), and Public Administration (375 | 8.6%).
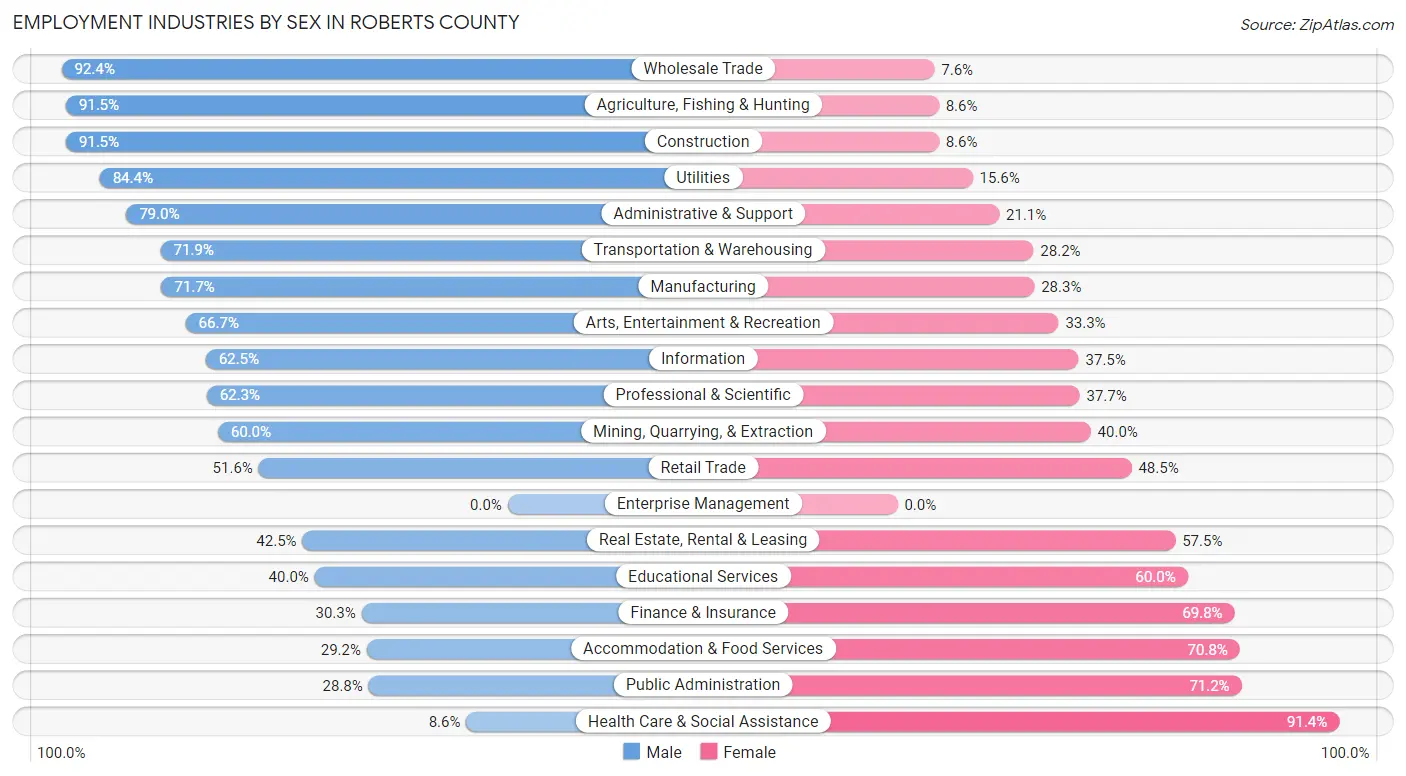
Employment Industries by Sex in Roberts County
The Roberts County industries that see more men than women are Wholesale Trade (92.4%), Agriculture, Fishing & Hunting (91.4%), and Construction (91.4%), whereas the industries that tend to have a higher number of women are Health Care & Social Assistance (91.4%), Public Administration (71.2%), and Accommodation & Food Services (70.8%).
| Industry | Male | Female |
| Agriculture, Fishing & Hunting | 428 (91.4%) | 40 (8.6%) |
| Mining, Quarrying, & Extraction | 3 (60.0%) | 2 (40.0%) |
| Construction | 214 (91.4%) | 20 (8.6%) |
| Manufacturing | 405 (71.7%) | 160 (28.3%) |
| Wholesale Trade | 133 (92.4%) | 11 (7.6%) |
| Retail Trade | 183 (51.5%) | 172 (48.4%) |
| Transportation & Warehousing | 97 (71.9%) | 38 (28.1%) |
| Utilities | 38 (84.4%) | 7 (15.6%) |
| Information | 20 (62.5%) | 12 (37.5%) |
| Finance & Insurance | 36 (30.2%) | 83 (69.8%) |
| Real Estate, Rental & Leasing | 17 (42.5%) | 23 (57.5%) |
| Professional & Scientific | 38 (62.3%) | 23 (37.7%) |
| Enterprise Management | 0 (0.0%) | 0 (0.0%) |
| Administrative & Support | 75 (78.9%) | 20 (21.0%) |
| Educational Services | 187 (40.0%) | 281 (60.0%) |
| Health Care & Social Assistance | 46 (8.6%) | 490 (91.4%) |
| Arts, Entertainment & Recreation | 224 (66.7%) | 112 (33.3%) |
| Accommodation & Food Services | 63 (29.2%) | 153 (70.8%) |
| Public Administration | 108 (28.8%) | 267 (71.2%) |
| Total | 2,365 (54.4%) | 1,981 (45.6%) |
Education in Roberts County
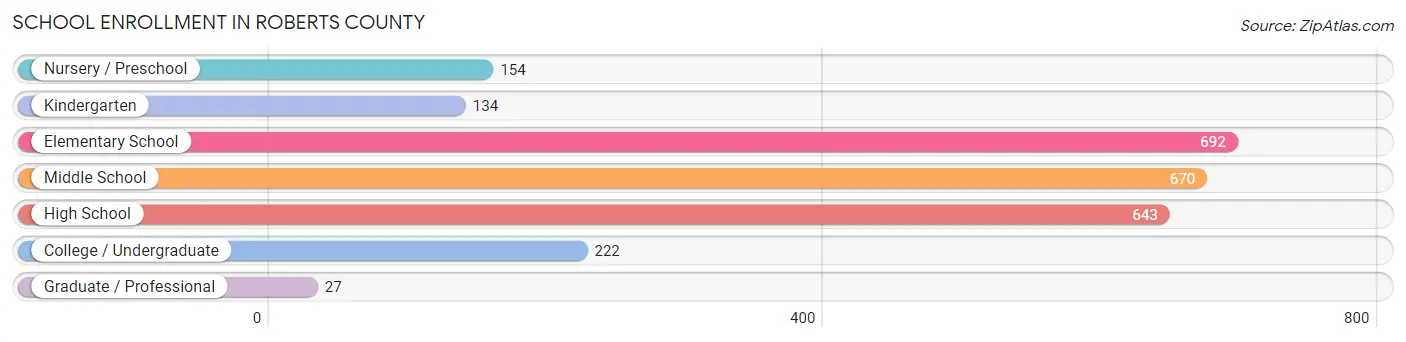
School Enrollment in Roberts County
The most common levels of schooling among the 2,542 students in Roberts County are elementary school (692 | 27.2%), middle school (670 | 26.4%), and high school (643 | 25.3%).
| School Level | # Students | % Students |
| Nursery / Preschool | 154 | 6.1% |
| Kindergarten | 134 | 5.3% |
| Elementary School | 692 | 27.2% |
| Middle School | 670 | 26.4% |
| High School | 643 | 25.3% |
| College / Undergraduate | 222 | 8.7% |
| Graduate / Professional | 27 | 1.1% |
| Total | 2,542 | 100.0% |
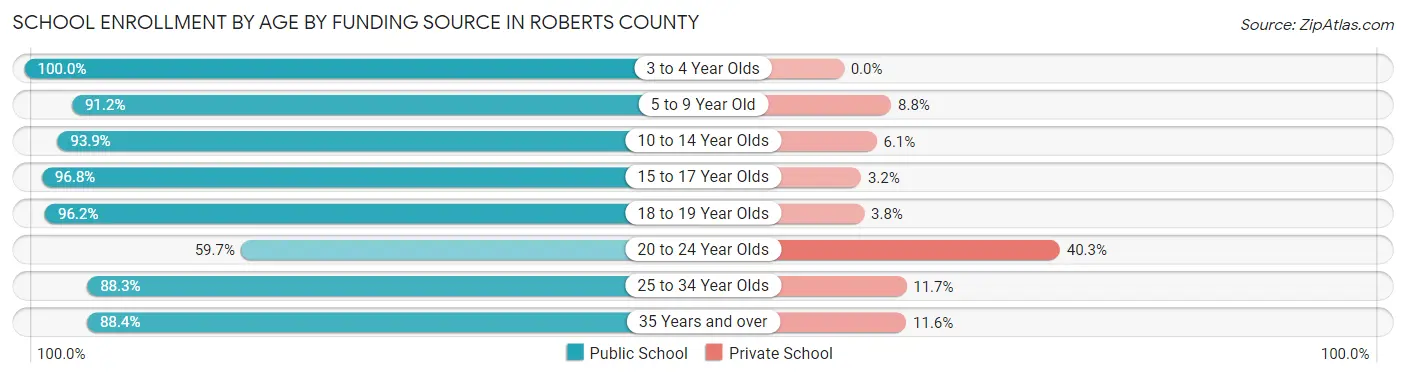
School Enrollment by Age by Funding Source in Roberts County
Out of a total of 2,542 students who are enrolled in schools in Roberts County, 183 (7.2%) attend a private institution, while the remaining 2,359 (92.8%) are enrolled in public schools. The age group of 20 to 24 year olds has the highest likelihood of being enrolled in private schools, with 31 (40.3% in the age bracket) enrolled. Conversely, the age group of 3 to 4 year olds has the lowest likelihood of being enrolled in a private school, with 112 (100.0% in the age bracket) attending a public institution.
| Age Bracket | Public School | Private School |
| 3 to 4 Year Olds | 112 (100.0%) | 0 (0.0%) |
| 5 to 9 Year Old | 712 (91.2%) | 69 (8.8%) |
| 10 to 14 Year Olds | 751 (93.9%) | 49 (6.1%) |
| 15 to 17 Year Olds | 419 (96.8%) | 14 (3.2%) |
| 18 to 19 Year Olds | 227 (96.2%) | 9 (3.8%) |
| 20 to 24 Year Olds | 46 (59.7%) | 31 (40.3%) |
| 25 to 34 Year Olds | 53 (88.3%) | 7 (11.7%) |
| 35 Years and over | 38 (88.4%) | 5 (11.6%) |
| Total | 2,359 (92.8%) | 183 (7.2%) |
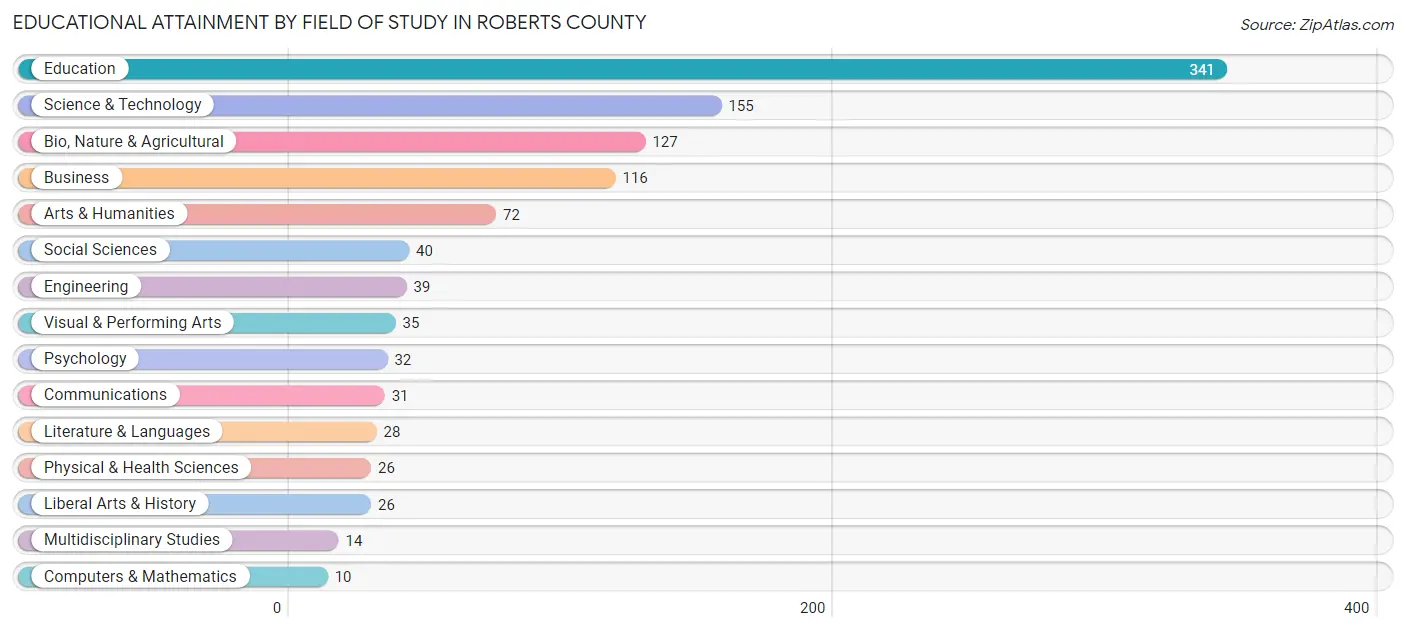
Educational Attainment by Field of Study in Roberts County
Education (341 | 31.2%), science & technology (155 | 14.2%), bio, nature & agricultural (127 | 11.6%), business (116 | 10.6%), and arts & humanities (72 | 6.6%) are the most common fields of study among 1,092 individuals in Roberts County who have obtained a bachelor's degree or higher.
| Field of Study | # Graduates | % Graduates |
| Computers & Mathematics | 10 | 0.9% |
| Bio, Nature & Agricultural | 127 | 11.6% |
| Physical & Health Sciences | 26 | 2.4% |
| Psychology | 32 | 2.9% |
| Social Sciences | 40 | 3.7% |
| Engineering | 39 | 3.6% |
| Multidisciplinary Studies | 14 | 1.3% |
| Science & Technology | 155 | 14.2% |
| Business | 116 | 10.6% |
| Education | 341 | 31.2% |
| Literature & Languages | 28 | 2.6% |
| Liberal Arts & History | 26 | 2.4% |
| Visual & Performing Arts | 35 | 3.2% |
| Communications | 31 | 2.8% |
| Arts & Humanities | 72 | 6.6% |
| Total | 1,092 | 100.0% |
Transportation & Commute in Roberts County
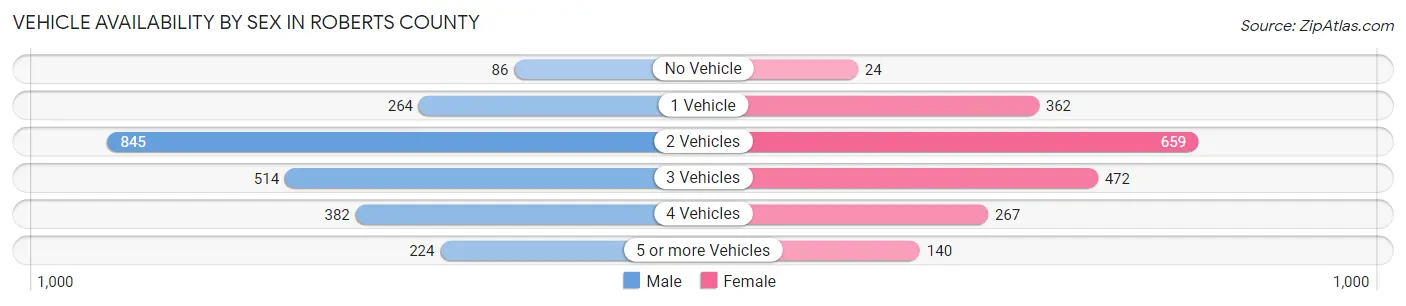
Vehicle Availability by Sex in Roberts County
The most prevalent vehicle ownership categories in Roberts County are males with 2 vehicles (845, accounting for 36.5%) and females with 2 vehicles (659, making up 43.9%).
| Vehicles Available | Male | Female |
| No Vehicle | 86 (3.7%) | 24 (1.3%) |
| 1 Vehicle | 264 (11.4%) | 362 (18.8%) |
| 2 Vehicles | 845 (36.5%) | 659 (34.3%) |
| 3 Vehicles | 514 (22.2%) | 472 (24.5%) |
| 4 Vehicles | 382 (16.5%) | 267 (13.9%) |
| 5 or more Vehicles | 224 (9.7%) | 140 (7.3%) |
| Total | 2,315 (100.0%) | 1,924 (100.0%) |
Commute Time in Roberts County
The most frequently occuring commute durations in Roberts County are 5 to 9 minutes (939 commuters, 23.9%), 15 to 19 minutes (645 commuters, 16.4%), and 10 to 14 minutes (617 commuters, 15.7%).
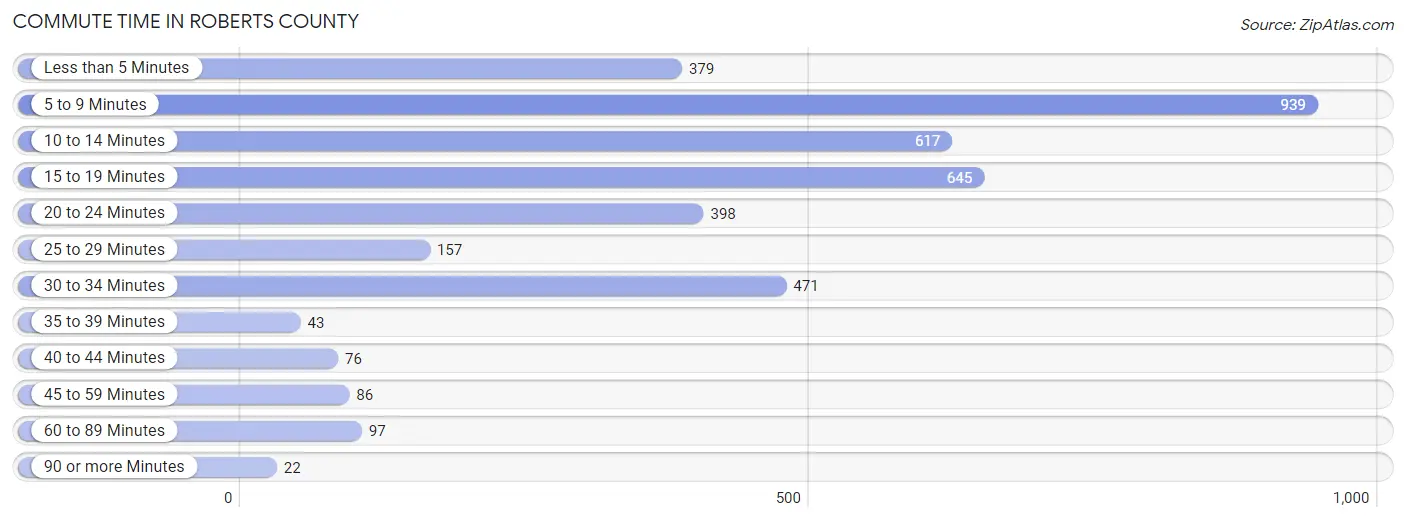
| Commute Time | # Commuters | % Commuters |
| Less than 5 Minutes | 379 | 9.6% |
| 5 to 9 Minutes | 939 | 23.9% |
| 10 to 14 Minutes | 617 | 15.7% |
| 15 to 19 Minutes | 645 | 16.4% |
| 20 to 24 Minutes | 398 | 10.1% |
| 25 to 29 Minutes | 157 | 4.0% |
| 30 to 34 Minutes | 471 | 12.0% |
| 35 to 39 Minutes | 43 | 1.1% |
| 40 to 44 Minutes | 76 | 1.9% |
| 45 to 59 Minutes | 86 | 2.2% |
| 60 to 89 Minutes | 97 | 2.5% |
| 90 or more Minutes | 22 | 0.6% |
Commute Time by Sex in Roberts County
The most common commute times in Roberts County are 5 to 9 minutes (572 commuters, 26.7%) for males and 5 to 9 minutes (367 commuters, 20.6%) for females.
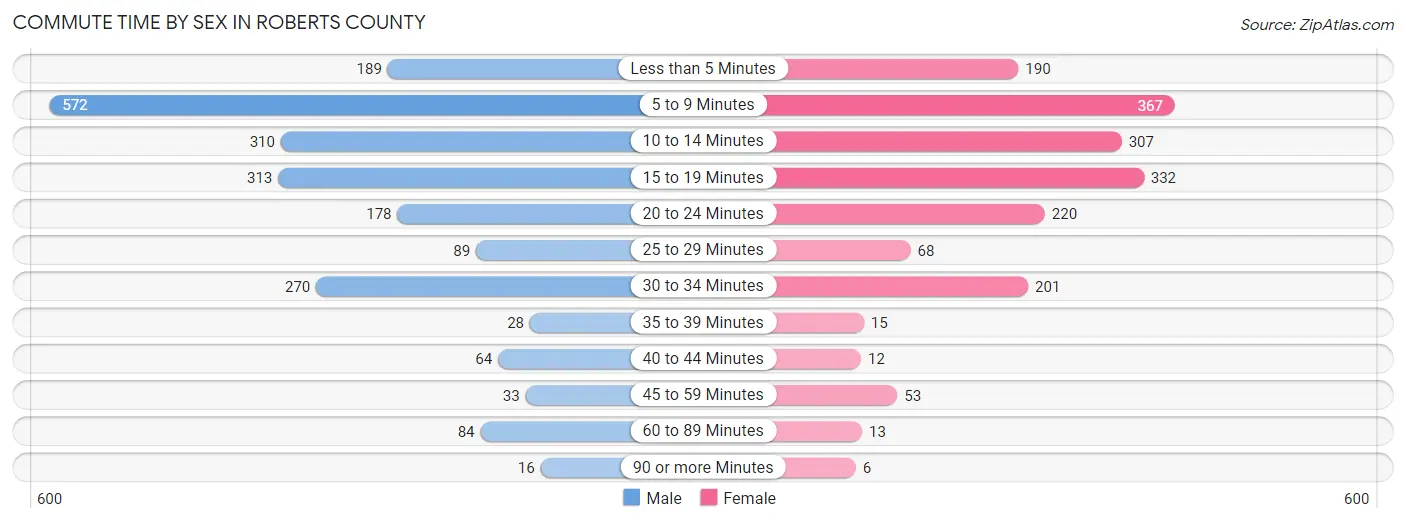
| Commute Time | Male | Female |
| Less than 5 Minutes | 189 (8.8%) | 190 (10.6%) |
| 5 to 9 Minutes | 572 (26.7%) | 367 (20.6%) |
| 10 to 14 Minutes | 310 (14.4%) | 307 (17.2%) |
| 15 to 19 Minutes | 313 (14.6%) | 332 (18.6%) |
| 20 to 24 Minutes | 178 (8.3%) | 220 (12.3%) |
| 25 to 29 Minutes | 89 (4.2%) | 68 (3.8%) |
| 30 to 34 Minutes | 270 (12.6%) | 201 (11.3%) |
| 35 to 39 Minutes | 28 (1.3%) | 15 (0.8%) |
| 40 to 44 Minutes | 64 (3.0%) | 12 (0.7%) |
| 45 to 59 Minutes | 33 (1.5%) | 53 (3.0%) |
| 60 to 89 Minutes | 84 (3.9%) | 13 (0.7%) |
| 90 or more Minutes | 16 (0.7%) | 6 (0.3%) |
Time of Departure to Work by Sex in Roberts County
The most frequent times of departure to work in Roberts County are 7:00 AM to 7:29 AM (394, 18.4%) for males and 7:30 AM to 7:59 AM (612, 34.3%) for females.
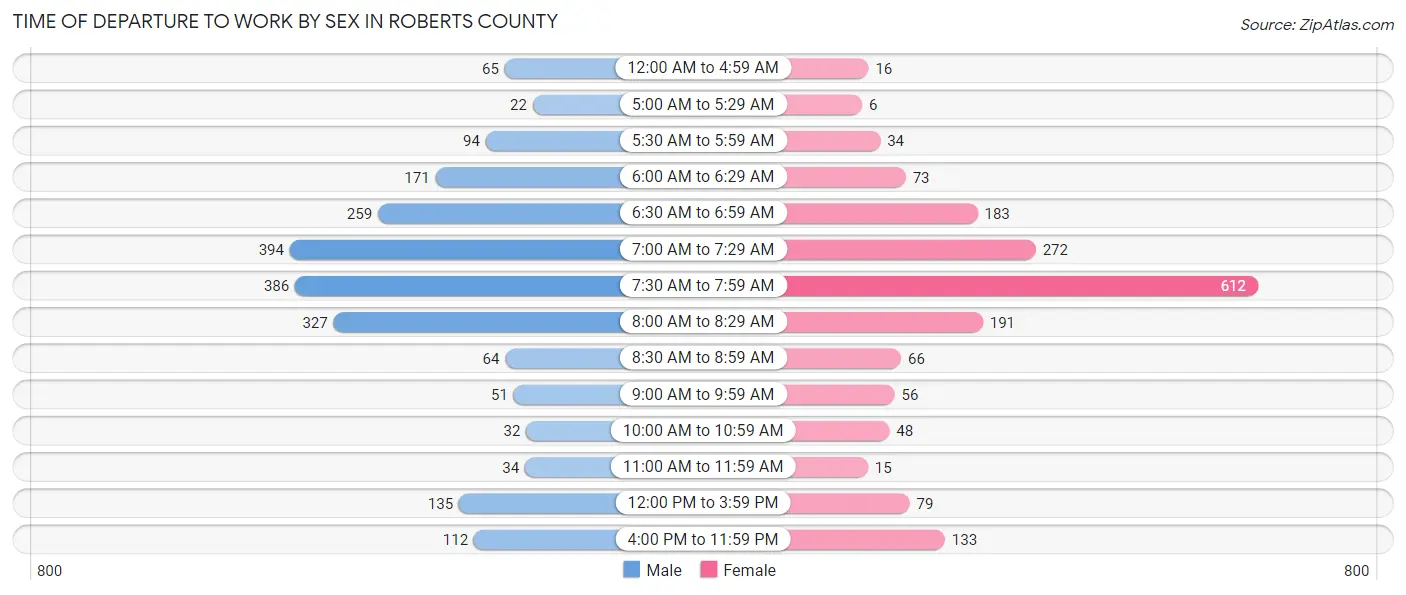
| Time of Departure | Male | Female |
| 12:00 AM to 4:59 AM | 65 (3.0%) | 16 (0.9%) |
| 5:00 AM to 5:29 AM | 22 (1.0%) | 6 (0.3%) |
| 5:30 AM to 5:59 AM | 94 (4.4%) | 34 (1.9%) |
| 6:00 AM to 6:29 AM | 171 (8.0%) | 73 (4.1%) |
| 6:30 AM to 6:59 AM | 259 (12.1%) | 183 (10.3%) |
| 7:00 AM to 7:29 AM | 394 (18.4%) | 272 (15.2%) |
| 7:30 AM to 7:59 AM | 386 (18.0%) | 612 (34.3%) |
| 8:00 AM to 8:29 AM | 327 (15.2%) | 191 (10.7%) |
| 8:30 AM to 8:59 AM | 64 (3.0%) | 66 (3.7%) |
| 9:00 AM to 9:59 AM | 51 (2.4%) | 56 (3.1%) |
| 10:00 AM to 10:59 AM | 32 (1.5%) | 48 (2.7%) |
| 11:00 AM to 11:59 AM | 34 (1.6%) | 15 (0.8%) |
| 12:00 PM to 3:59 PM | 135 (6.3%) | 79 (4.4%) |
| 4:00 PM to 11:59 PM | 112 (5.2%) | 133 (7.5%) |
| Total | 2,146 (100.0%) | 1,784 (100.0%) |
Housing Occupancy in Roberts County
Occupancy by Ownership in Roberts County
Of the total 3,659 dwellings in Roberts County, owner-occupied units account for 2,483 (67.9%), while renter-occupied units make up 1,176 (32.1%).
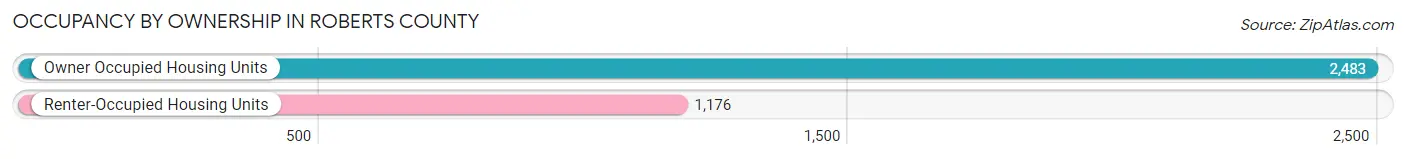
| Occupancy | # Housing Units | % Housing Units |
| Owner Occupied Housing Units | 2,483 | 67.9% |
| Renter-Occupied Housing Units | 1,176 | 32.1% |
| Total Occupied Housing Units | 3,659 | 100.0% |
Occupancy by Household Size in Roberts County
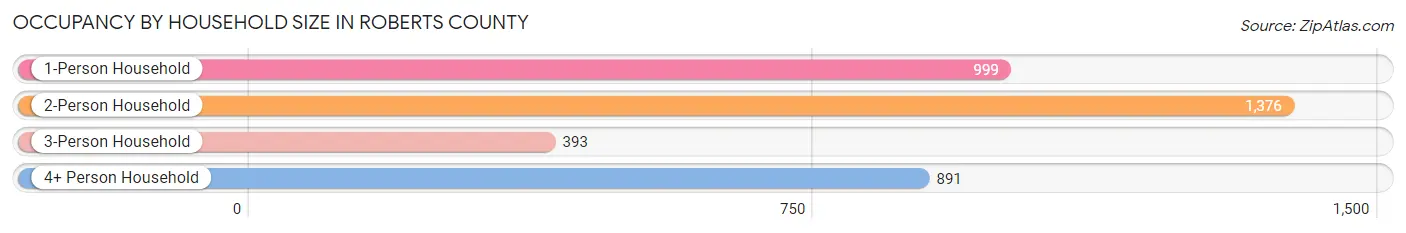
| Household Size | # Housing Units | % Housing Units |
| 1-Person Household | 999 | 27.3% |
| 2-Person Household | 1,376 | 37.6% |
| 3-Person Household | 393 | 10.7% |
| 4+ Person Household | 891 | 24.3% |
| Total Housing Units | 3,659 | 100.0% |
Occupancy by Ownership by Household Size in Roberts County
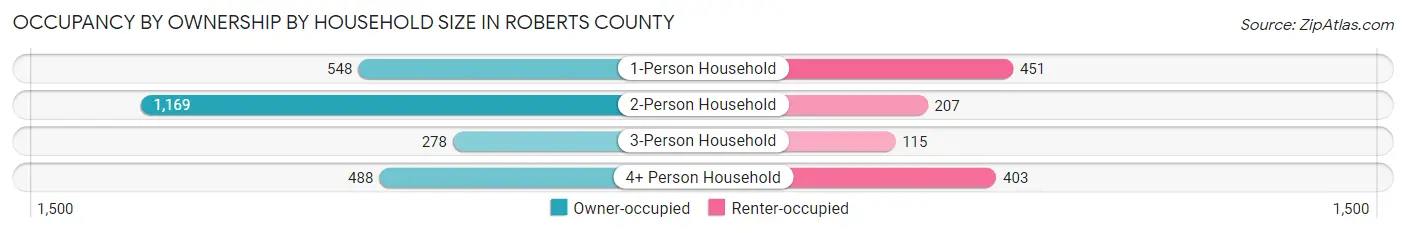
| Household Size | Owner-occupied | Renter-occupied |
| 1-Person Household | 548 (54.8%) | 451 (45.2%) |
| 2-Person Household | 1,169 (85.0%) | 207 (15.0%) |
| 3-Person Household | 278 (70.7%) | 115 (29.3%) |
| 4+ Person Household | 488 (54.8%) | 403 (45.2%) |
| Total Housing Units | 2,483 (67.9%) | 1,176 (32.1%) |
Occupancy by Educational Attainment in Roberts County
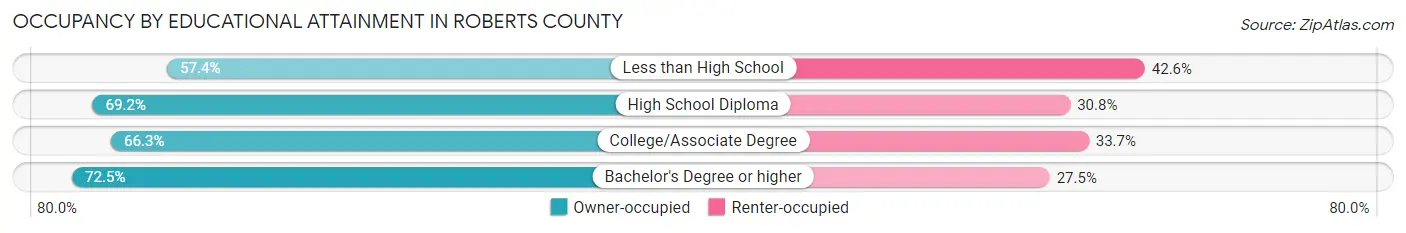
| Household Size | Owner-occupied | Renter-occupied |
| Less than High School | 136 (57.4%) | 101 (42.6%) |
| High School Diploma | 922 (69.2%) | 410 (30.8%) |
| College/Associate Degree | 959 (66.3%) | 488 (33.7%) |
| Bachelor's Degree or higher | 466 (72.5%) | 177 (27.5%) |
Occupancy by Age of Householder in Roberts County
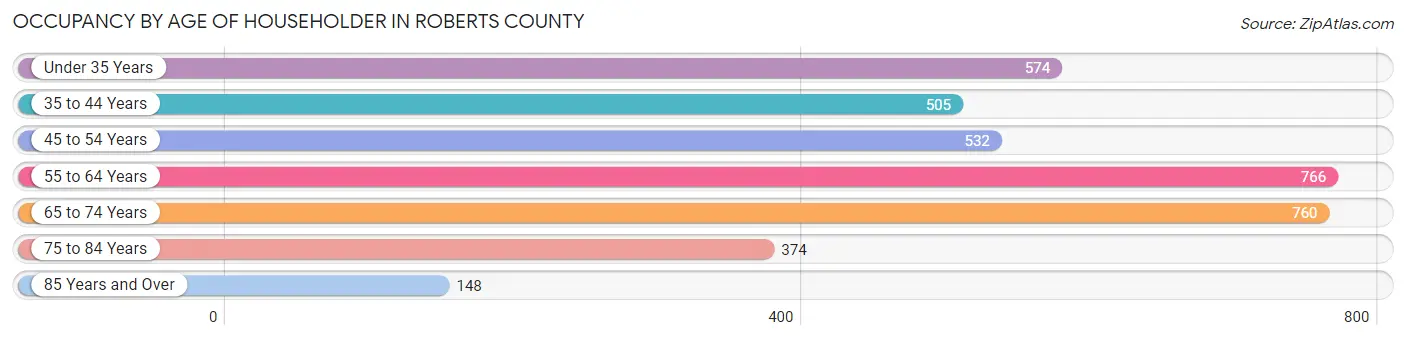
| Age Bracket | # Households | % Households |
| Under 35 Years | 574 | 15.7% |
| 35 to 44 Years | 505 | 13.8% |
| 45 to 54 Years | 532 | 14.5% |
| 55 to 64 Years | 766 | 20.9% |
| 65 to 74 Years | 760 | 20.8% |
| 75 to 84 Years | 374 | 10.2% |
| 85 Years and Over | 148 | 4.0% |
| Total | 3,659 | 100.0% |
Housing Finances in Roberts County
Median Income by Occupancy in Roberts County
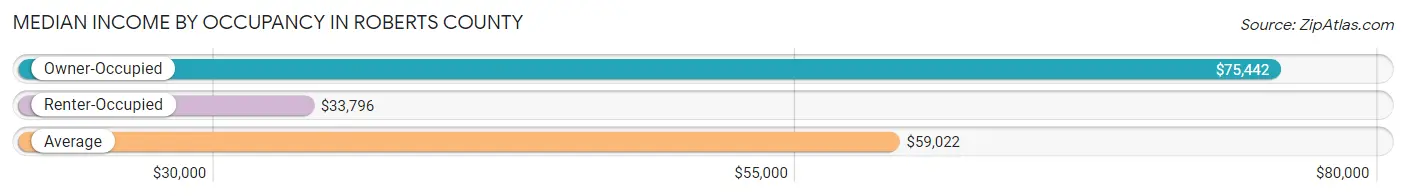
| Occupancy Type | # Households | Median Income |
| Owner-Occupied | 2,483 (67.9%) | $75,442 |
| Renter-Occupied | 1,176 (32.1%) | $33,796 |
| Average | 3,659 (100.0%) | $59,022 |
Occupancy by Householder Income Bracket in Roberts County
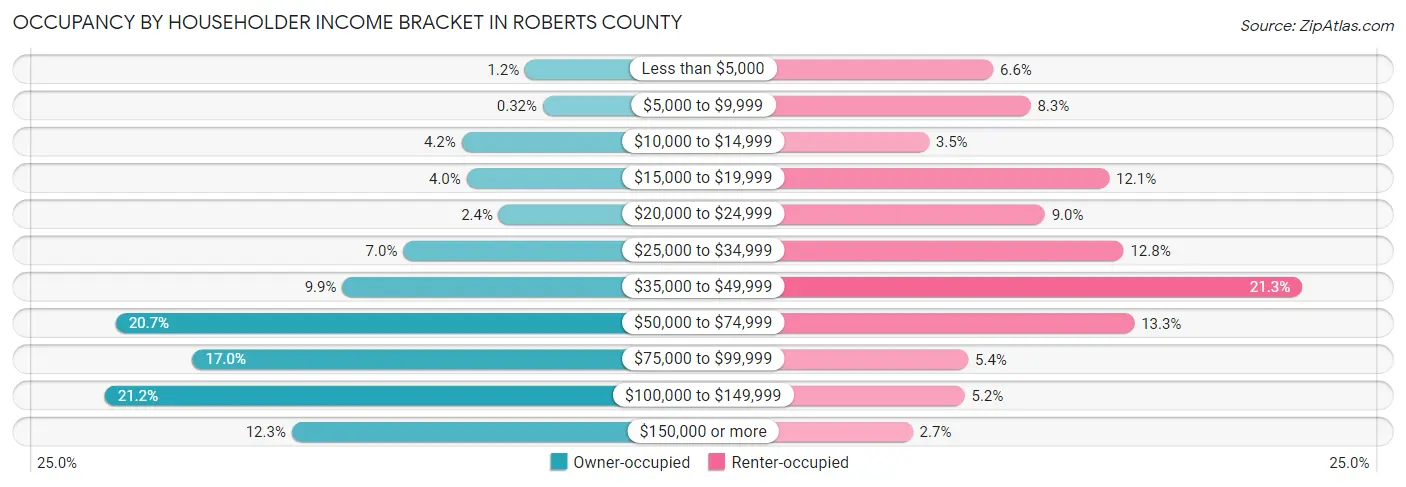
| Income Bracket | Owner-occupied | Renter-occupied |
| Less than $5,000 | 29 (1.2%) | 77 (6.6%) |
| $5,000 to $9,999 | 8 (0.3%) | 98 (8.3%) |
| $10,000 to $14,999 | 104 (4.2%) | 41 (3.5%) |
| $15,000 to $19,999 | 98 (4.0%) | 142 (12.1%) |
| $20,000 to $24,999 | 60 (2.4%) | 106 (9.0%) |
| $25,000 to $34,999 | 173 (7.0%) | 150 (12.8%) |
| $35,000 to $49,999 | 245 (9.9%) | 250 (21.3%) |
| $50,000 to $74,999 | 513 (20.7%) | 156 (13.3%) |
| $75,000 to $99,999 | 422 (17.0%) | 63 (5.4%) |
| $100,000 to $149,999 | 526 (21.2%) | 61 (5.2%) |
| $150,000 or more | 305 (12.3%) | 32 (2.7%) |
| Total | 2,483 (100.0%) | 1,176 (100.0%) |
Monthly Housing Cost Tiers in Roberts County
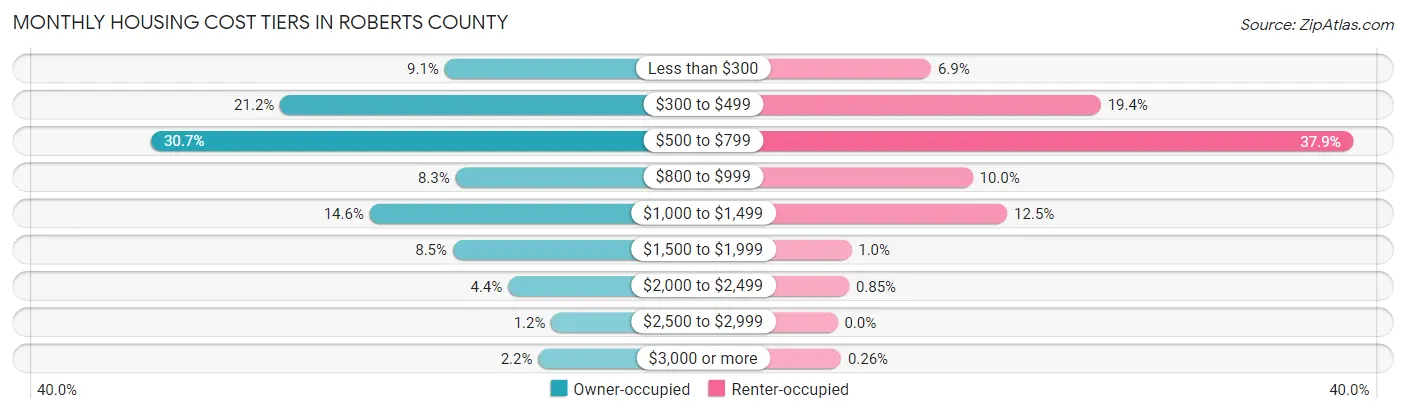
| Monthly Cost | Owner-occupied | Renter-occupied |
| Less than $300 | 225 (9.1%) | 81 (6.9%) |
| $300 to $499 | 526 (21.2%) | 228 (19.4%) |
| $500 to $799 | 762 (30.7%) | 446 (37.9%) |
| $800 to $999 | 205 (8.3%) | 117 (10.0%) |
| $1,000 to $1,499 | 362 (14.6%) | 147 (12.5%) |
| $1,500 to $1,999 | 210 (8.5%) | 12 (1.0%) |
| $2,000 to $2,499 | 109 (4.4%) | 10 (0.9%) |
| $2,500 to $2,999 | 30 (1.2%) | 0 (0.0%) |
| $3,000 or more | 54 (2.2%) | 3 (0.3%) |
| Total | 2,483 (100.0%) | 1,176 (100.0%) |
Physical Housing Characteristics in Roberts County
Housing Structures in Roberts County
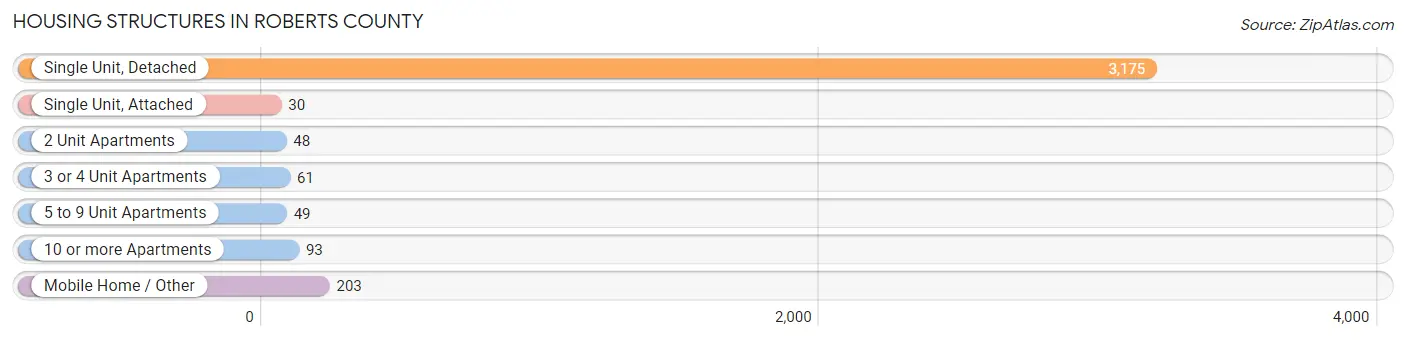
| Structure Type | # Housing Units | % Housing Units |
| Single Unit, Detached | 3,175 | 86.8% |
| Single Unit, Attached | 30 | 0.8% |
| 2 Unit Apartments | 48 | 1.3% |
| 3 or 4 Unit Apartments | 61 | 1.7% |
| 5 to 9 Unit Apartments | 49 | 1.3% |
| 10 or more Apartments | 93 | 2.5% |
| Mobile Home / Other | 203 | 5.6% |
| Total | 3,659 | 100.0% |
Housing Structures by Occupancy in Roberts County
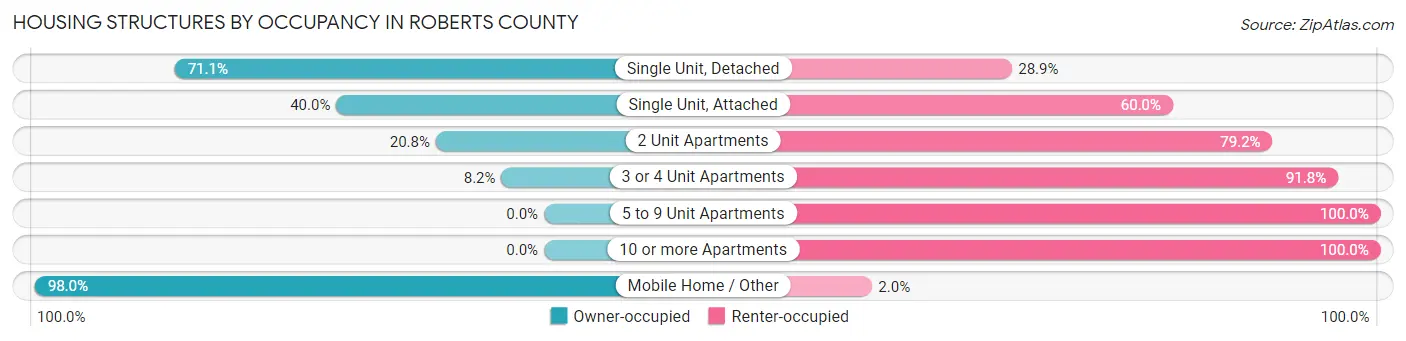
| Structure Type | Owner-occupied | Renter-occupied |
| Single Unit, Detached | 2,257 (71.1%) | 918 (28.9%) |
| Single Unit, Attached | 12 (40.0%) | 18 (60.0%) |
| 2 Unit Apartments | 10 (20.8%) | 38 (79.2%) |
| 3 or 4 Unit Apartments | 5 (8.2%) | 56 (91.8%) |
| 5 to 9 Unit Apartments | 0 (0.0%) | 49 (100.0%) |
| 10 or more Apartments | 0 (0.0%) | 93 (100.0%) |
| Mobile Home / Other | 199 (98.0%) | 4 (2.0%) |
| Total | 2,483 (67.9%) | 1,176 (32.1%) |
Housing Structures by Number of Rooms in Roberts County
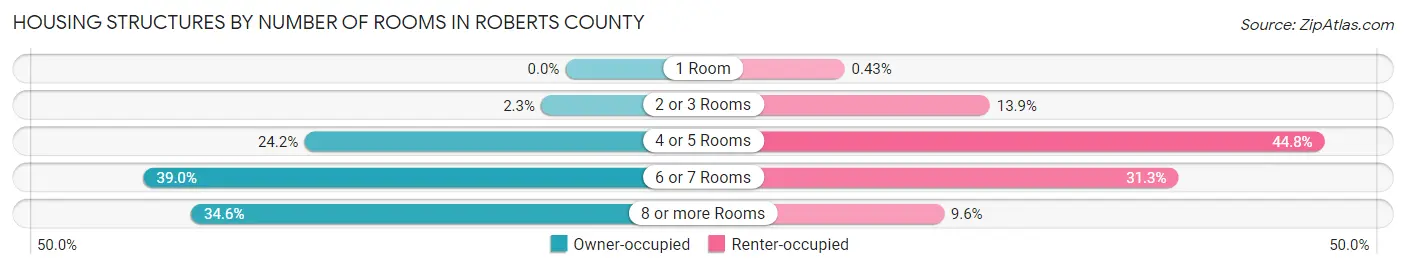
| Number of Rooms | Owner-occupied | Renter-occupied |
| 1 Room | 0 (0.0%) | 5 (0.4%) |
| 2 or 3 Rooms | 56 (2.3%) | 163 (13.9%) |
| 4 or 5 Rooms | 600 (24.2%) | 527 (44.8%) |
| 6 or 7 Rooms | 968 (39.0%) | 368 (31.3%) |
| 8 or more Rooms | 859 (34.6%) | 113 (9.6%) |
| Total | 2,483 (100.0%) | 1,176 (100.0%) |
Housing Structure by Heating Type in Roberts County
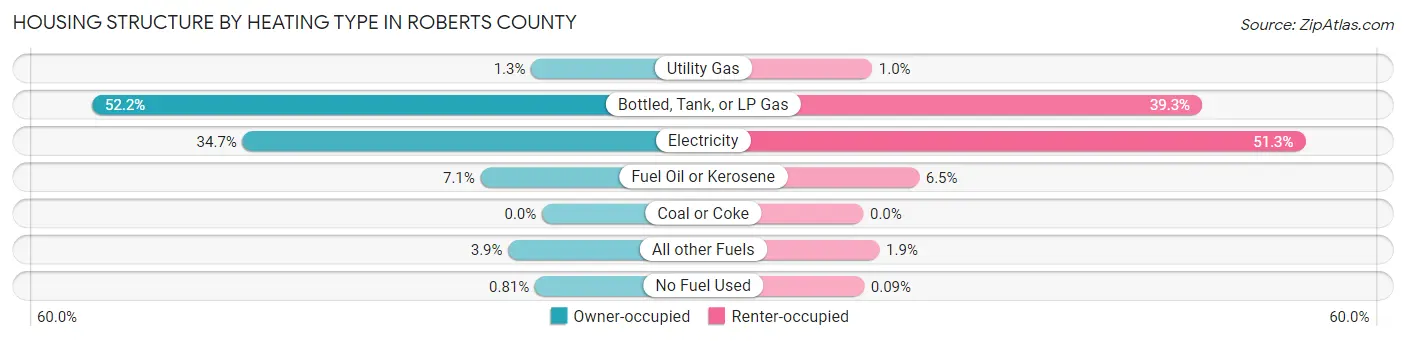
| Heating Type | Owner-occupied | Renter-occupied |
| Utility Gas | 31 (1.3%) | 12 (1.0%) |
| Bottled, Tank, or LP Gas | 1,296 (52.2%) | 462 (39.3%) |
| Electricity | 862 (34.7%) | 603 (51.3%) |
| Fuel Oil or Kerosene | 177 (7.1%) | 76 (6.5%) |
| Coal or Coke | 0 (0.0%) | 0 (0.0%) |
| All other Fuels | 97 (3.9%) | 22 (1.9%) |
| No Fuel Used | 20 (0.8%) | 1 (0.1%) |
| Total | 2,483 (100.0%) | 1,176 (100.0%) |
Household Vehicle Usage in Roberts County
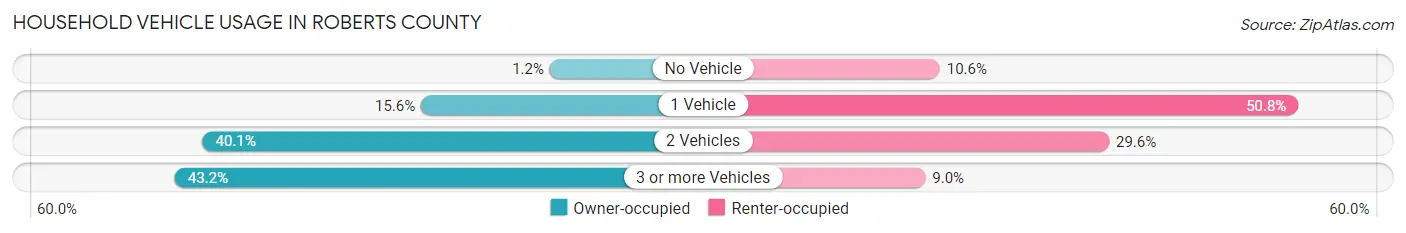
| Vehicles per Household | Owner-occupied | Renter-occupied |
| No Vehicle | 29 (1.2%) | 125 (10.6%) |
| 1 Vehicle | 387 (15.6%) | 597 (50.8%) |
| 2 Vehicles | 995 (40.1%) | 348 (29.6%) |
| 3 or more Vehicles | 1,072 (43.2%) | 106 (9.0%) |
| Total | 2,483 (100.0%) | 1,176 (100.0%) |
Real Estate & Mortgages in Roberts County
Real Estate and Mortgage Overview in Roberts County
| Characteristic | Without Mortgage | With Mortgage |
| Housing Units | 1,574 | 909 |
| Median Property Value | $102,100 | $175,700 |
| Median Household Income | $63,952 | $161 |
| Monthly Housing Costs | $520 | $50 |
| Real Estate Taxes | $1,147 | $23 |
Property Value by Mortgage Status in Roberts County
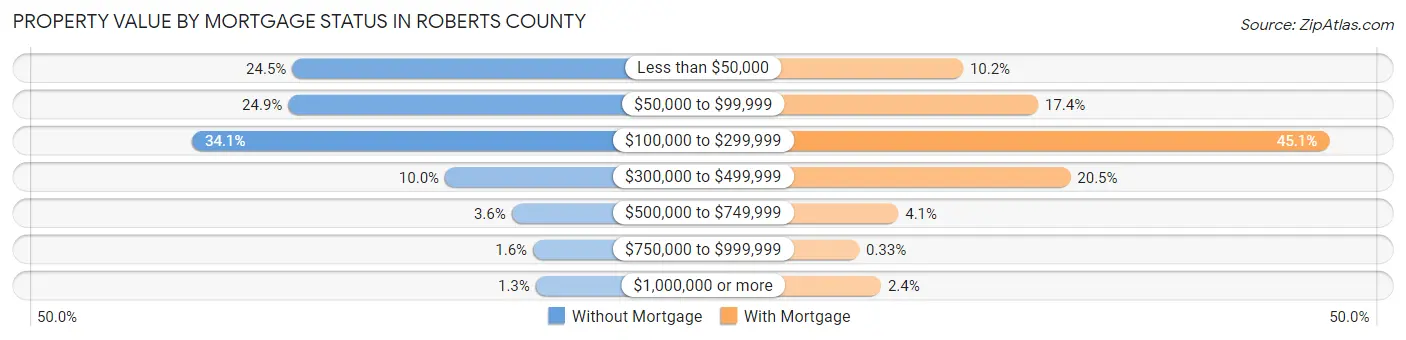
| Property Value | Without Mortgage | With Mortgage |
| Less than $50,000 | 386 (24.5%) | 93 (10.2%) |
| $50,000 to $99,999 | 392 (24.9%) | 158 (17.4%) |
| $100,000 to $299,999 | 536 (34.1%) | 410 (45.1%) |
| $300,000 to $499,999 | 157 (10.0%) | 186 (20.5%) |
| $500,000 to $749,999 | 57 (3.6%) | 37 (4.1%) |
| $750,000 to $999,999 | 25 (1.6%) | 3 (0.3%) |
| $1,000,000 or more | 21 (1.3%) | 22 (2.4%) |
| Total | 1,574 (100.0%) | 909 (100.0%) |
Household Income by Mortgage Status in Roberts County
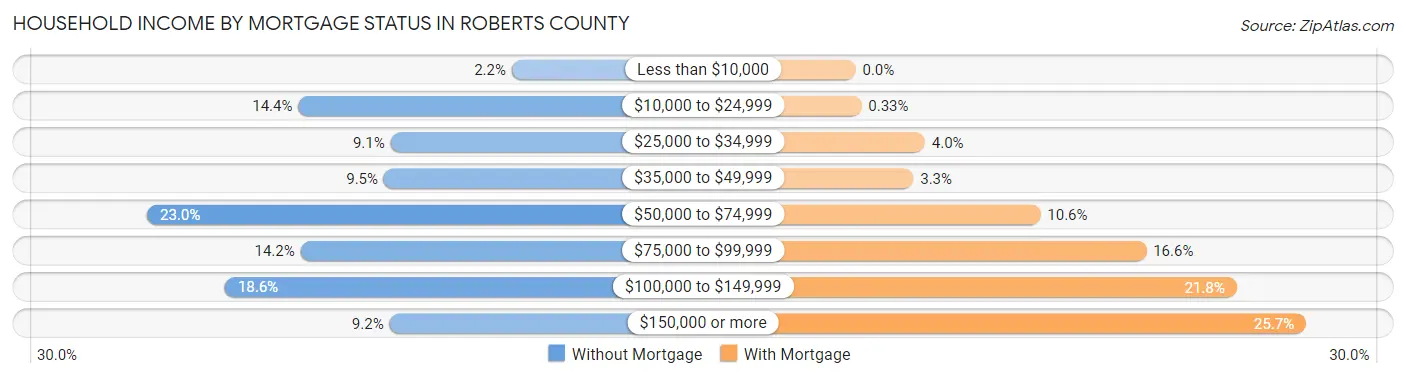
| Household Income | Without Mortgage | With Mortgage |
| Less than $10,000 | 34 (2.2%) | 0 (0.0%) |
| $10,000 to $24,999 | 226 (14.4%) | 3 (0.3%) |
| $25,000 to $34,999 | 143 (9.1%) | 36 (4.0%) |
| $35,000 to $49,999 | 149 (9.5%) | 30 (3.3%) |
| $50,000 to $74,999 | 362 (23.0%) | 96 (10.6%) |
| $75,000 to $99,999 | 224 (14.2%) | 151 (16.6%) |
| $100,000 to $149,999 | 292 (18.5%) | 198 (21.8%) |
| $150,000 or more | 144 (9.1%) | 234 (25.7%) |
| Total | 1,574 (100.0%) | 909 (100.0%) |
Property Value to Household Income Ratio in Roberts County
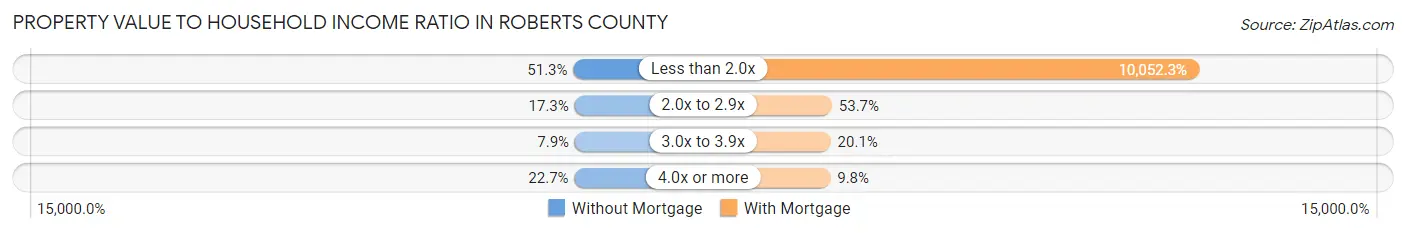
| Value-to-Income Ratio | Without Mortgage | With Mortgage |
| Less than 2.0x | 808 (51.3%) | 91,375 (10,052.3%) |
| 2.0x to 2.9x | 273 (17.3%) | 488 (53.7%) |
| 3.0x to 3.9x | 125 (7.9%) | 183 (20.1%) |
| 4.0x or more | 357 (22.7%) | 89 (9.8%) |
| Total | 1,574 (100.0%) | 909 (100.0%) |
Real Estate Taxes by Mortgage Status in Roberts County
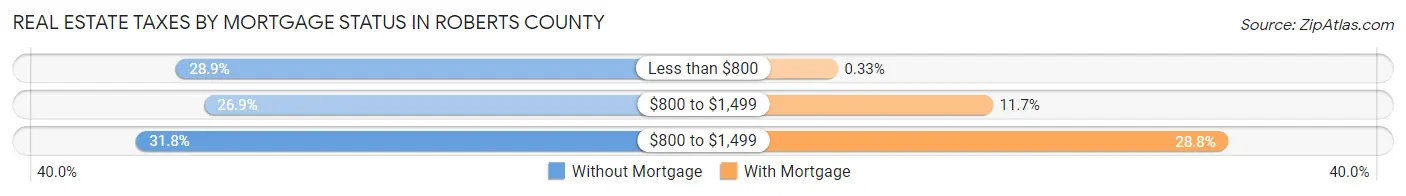
| Property Taxes | Without Mortgage | With Mortgage |
| Less than $800 | 455 (28.9%) | 3 (0.3%) |
| $800 to $1,499 | 423 (26.9%) | 106 (11.7%) |
| $800 to $1,499 | 501 (31.8%) | 262 (28.8%) |
| Total | 1,574 (100.0%) | 909 (100.0%) |
Health & Disability in Roberts County
Health Insurance Coverage by Age in Roberts County
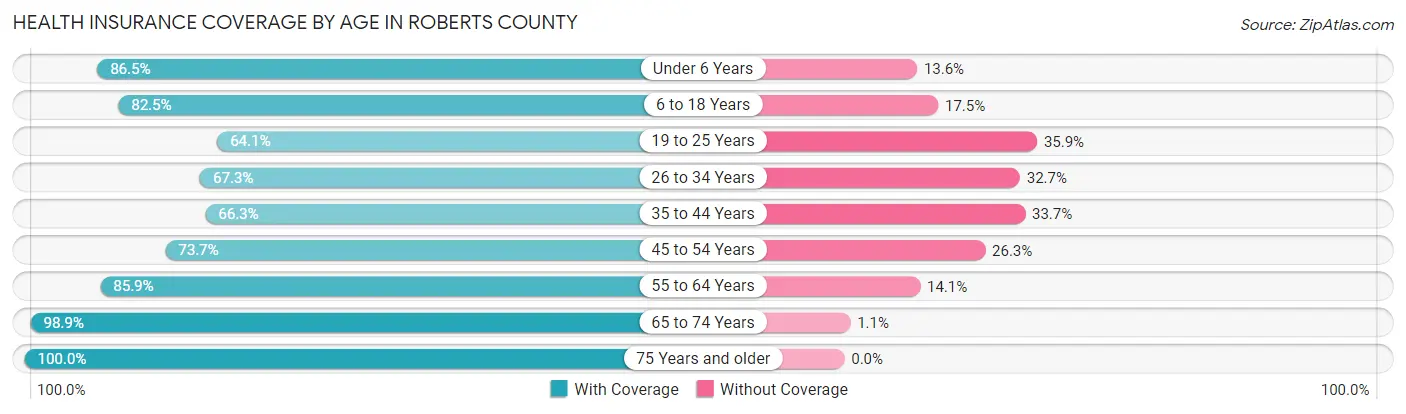
| Age Bracket | With Coverage | Without Coverage |
| Under 6 Years | 855 (86.5%) | 134 (13.6%) |
| 6 to 18 Years | 1,732 (82.5%) | 367 (17.5%) |
| 19 to 25 Years | 519 (64.1%) | 291 (35.9%) |
| 26 to 34 Years | 598 (67.3%) | 291 (32.7%) |
| 35 to 44 Years | 651 (66.3%) | 331 (33.7%) |
| 45 to 54 Years | 761 (73.7%) | 271 (26.3%) |
| 55 to 64 Years | 1,112 (85.9%) | 183 (14.1%) |
| 65 to 74 Years | 1,159 (98.9%) | 13 (1.1%) |
| 75 Years and older | 776 (100.0%) | 0 (0.0%) |
| Total | 8,163 (81.3%) | 1,881 (18.7%) |
Health Insurance Coverage by Citizenship Status in Roberts County
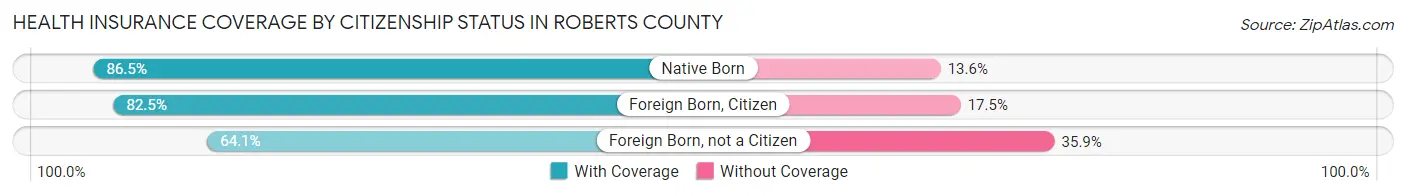
| Citizenship Status | With Coverage | Without Coverage |
| Native Born | 855 (86.5%) | 134 (13.6%) |
| Foreign Born, Citizen | 1,732 (82.5%) | 367 (17.5%) |
| Foreign Born, not a Citizen | 519 (64.1%) | 291 (35.9%) |
Health Insurance Coverage by Household Income in Roberts County
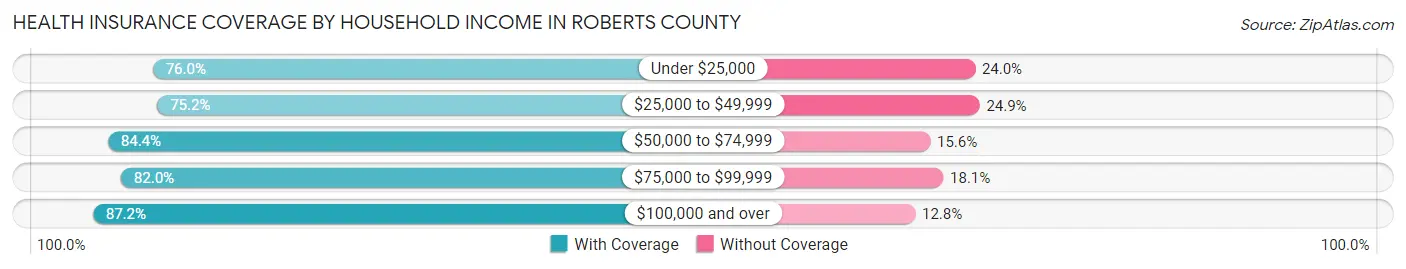
| Household Income | With Coverage | Without Coverage |
| Under $25,000 | 1,282 (76.0%) | 405 (24.0%) |
| $25,000 to $49,999 | 1,588 (75.1%) | 525 (24.8%) |
| $50,000 to $74,999 | 1,580 (84.4%) | 292 (15.6%) |
| $75,000 to $99,999 | 1,199 (82.0%) | 264 (18.0%) |
| $100,000 and over | 2,511 (87.2%) | 368 (12.8%) |
Public vs Private Health Insurance Coverage by Age in Roberts County
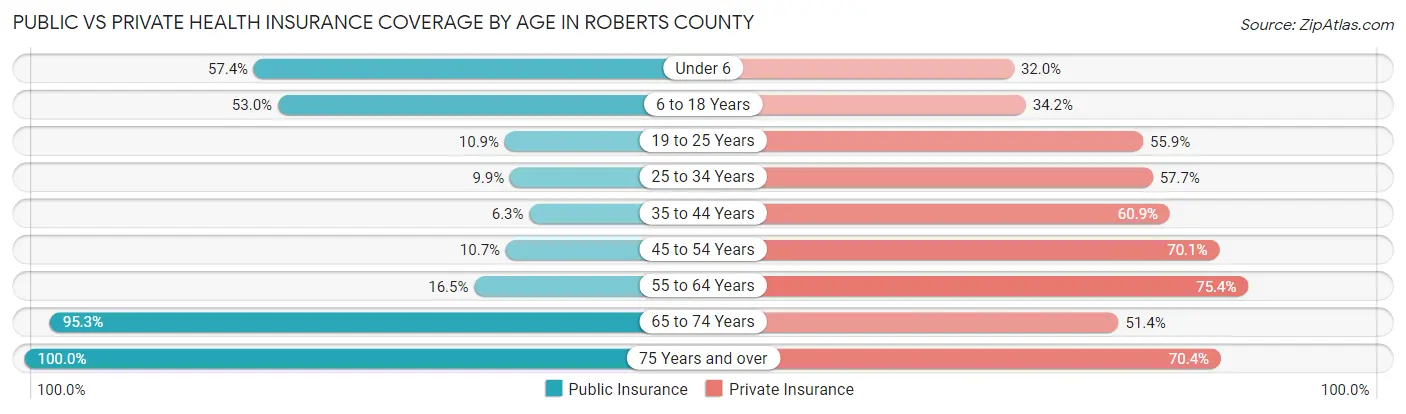
| Age Bracket | Public Insurance | Private Insurance |
| Under 6 | 568 (57.4%) | 316 (32.0%) |
| 6 to 18 Years | 1,112 (53.0%) | 717 (34.2%) |
| 19 to 25 Years | 88 (10.9%) | 453 (55.9%) |
| 25 to 34 Years | 88 (9.9%) | 513 (57.7%) |
| 35 to 44 Years | 62 (6.3%) | 598 (60.9%) |
| 45 to 54 Years | 110 (10.7%) | 723 (70.1%) |
| 55 to 64 Years | 214 (16.5%) | 977 (75.4%) |
| 65 to 74 Years | 1,117 (95.3%) | 602 (51.4%) |
| 75 Years and over | 776 (100.0%) | 546 (70.4%) |
| Total | 4,135 (41.2%) | 5,445 (54.2%) |
Disability Status by Sex by Age in Roberts County
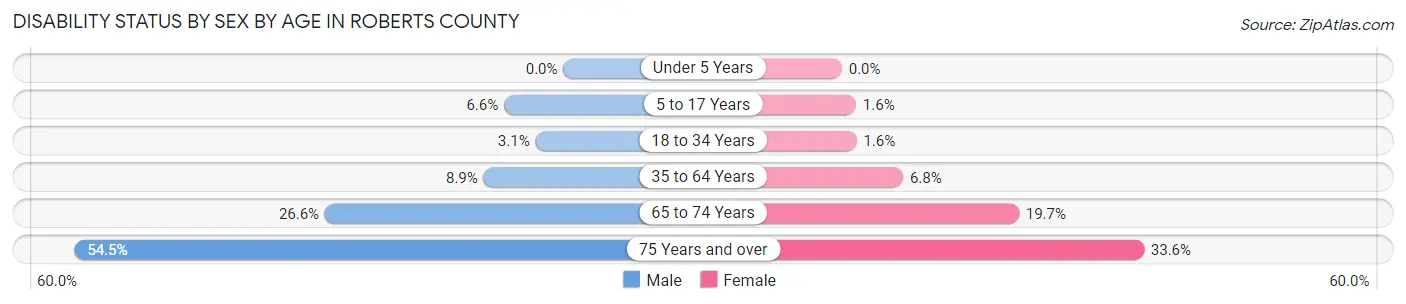
| Age Bracket | Male | Female |
| Under 5 Years | 0 (0.0%) | 0 (0.0%) |
| 5 to 17 Years | 72 (6.6%) | 16 (1.6%) |
| 18 to 34 Years | 31 (3.1%) | 14 (1.6%) |
| 35 to 64 Years | 152 (8.9%) | 109 (6.8%) |
| 65 to 74 Years | 163 (26.6%) | 110 (19.7%) |
| 75 Years and over | 183 (54.5%) | 148 (33.6%) |
Disability Class by Sex by Age in Roberts County
Disability Class: Hearing Difficulty
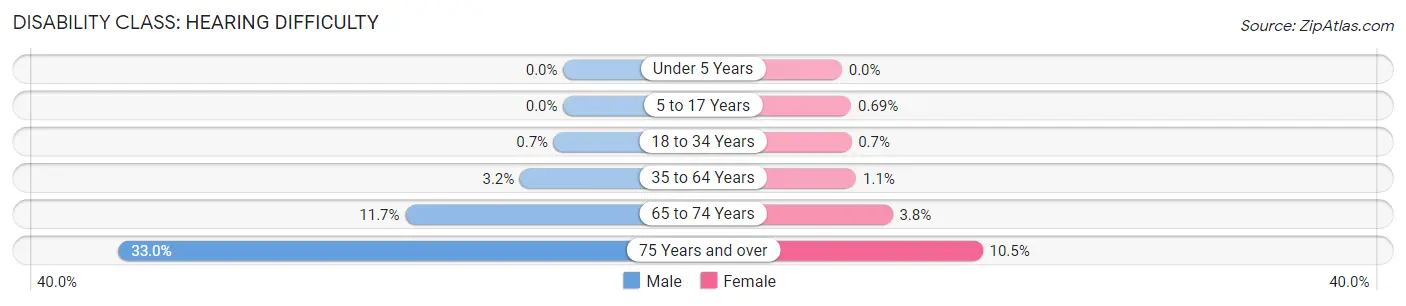
| Age Bracket | Male | Female |
| Under 5 Years | 0 (0.0%) | 0 (0.0%) |
| 5 to 17 Years | 0 (0.0%) | 7 (0.7%) |
| 18 to 34 Years | 7 (0.7%) | 6 (0.7%) |
| 35 to 64 Years | 55 (3.2%) | 17 (1.1%) |
| 65 to 74 Years | 72 (11.7%) | 21 (3.8%) |
| 75 Years and over | 111 (33.0%) | 46 (10.4%) |
Disability Class: Vision Difficulty
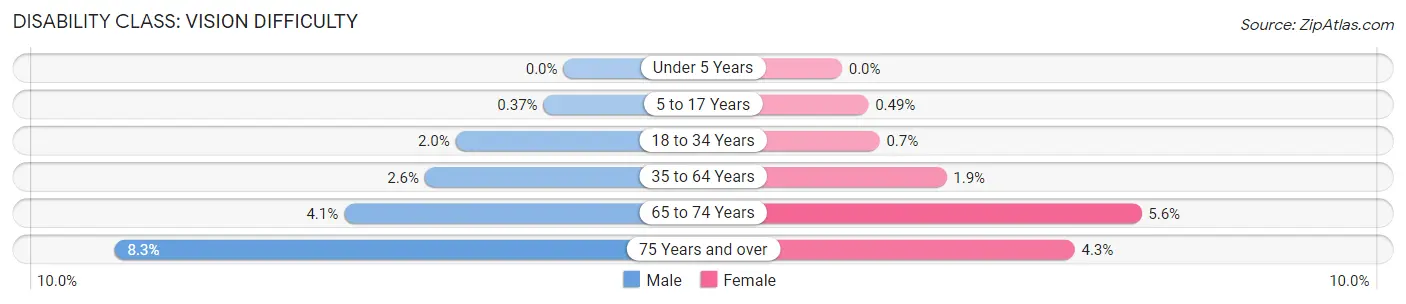
| Age Bracket | Male | Female |
| Under 5 Years | 0 (0.0%) | 0 (0.0%) |
| 5 to 17 Years | 4 (0.4%) | 5 (0.5%) |
| 18 to 34 Years | 20 (2.0%) | 6 (0.7%) |
| 35 to 64 Years | 44 (2.6%) | 31 (1.9%) |
| 65 to 74 Years | 25 (4.1%) | 31 (5.6%) |
| 75 Years and over | 28 (8.3%) | 19 (4.3%) |
Disability Class: Cognitive Difficulty
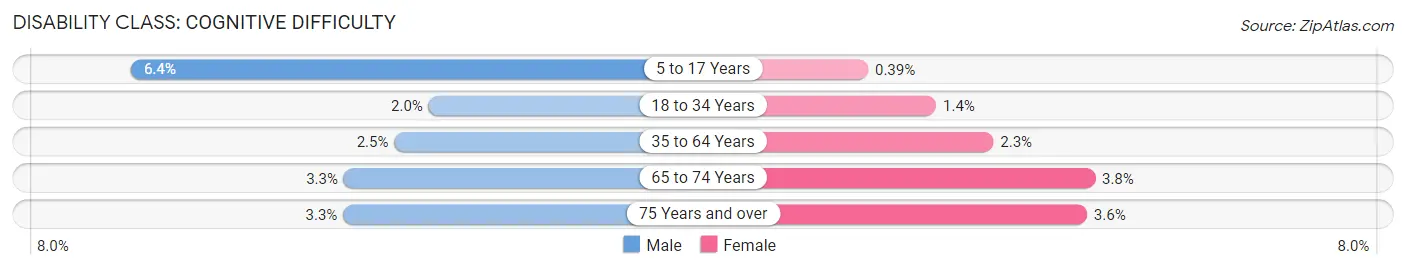
| Age Bracket | Male | Female |
| 5 to 17 Years | 70 (6.4%) | 4 (0.4%) |
| 18 to 34 Years | 20 (2.0%) | 12 (1.4%) |
| 35 to 64 Years | 43 (2.5%) | 36 (2.2%) |
| 65 to 74 Years | 20 (3.3%) | 21 (3.8%) |
| 75 Years and over | 11 (3.3%) | 16 (3.6%) |
Disability Class: Ambulatory Difficulty

| Age Bracket | Male | Female |
| 5 to 17 Years | 2 (0.2%) | 0 (0.0%) |
| 18 to 34 Years | 2 (0.2%) | 0 (0.0%) |
| 35 to 64 Years | 87 (5.1%) | 96 (6.0%) |
| 65 to 74 Years | 83 (13.5%) | 66 (11.8%) |
| 75 Years and over | 117 (34.8%) | 98 (22.3%) |
Disability Class: Self-Care Difficulty
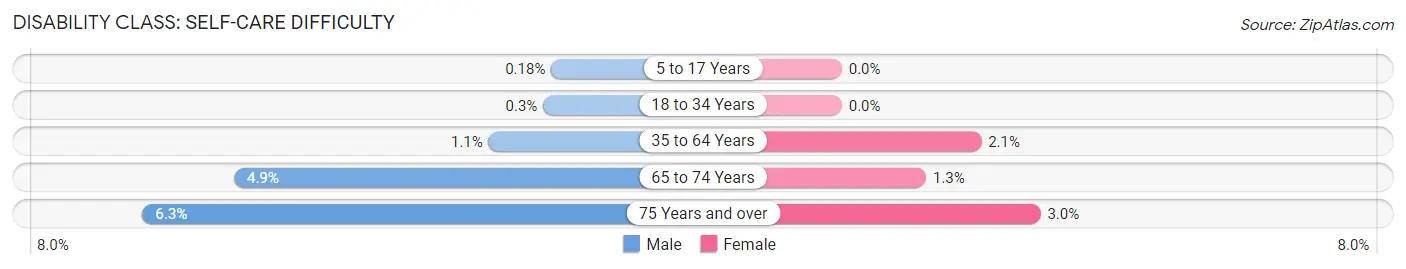
| Age Bracket | Male | Female |
| 5 to 17 Years | 2 (0.2%) | 0 (0.0%) |
| 18 to 34 Years | 3 (0.3%) | 0 (0.0%) |
| 35 to 64 Years | 19 (1.1%) | 33 (2.1%) |
| 65 to 74 Years | 30 (4.9%) | 7 (1.3%) |
| 75 Years and over | 21 (6.2%) | 13 (2.9%) |
Technology Access in Roberts County
Computing Device Access in Roberts County
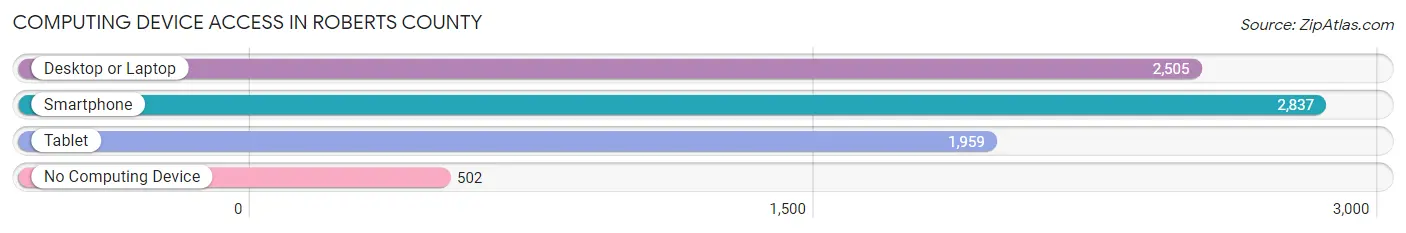
| Device Type | # Households | % Households |
| Desktop or Laptop | 2,505 | 68.5% |
| Smartphone | 2,837 | 77.5% |
| Tablet | 1,959 | 53.5% |
| No Computing Device | 502 | 13.7% |
| Total | 3,659 | 100.0% |
Internet Access in Roberts County
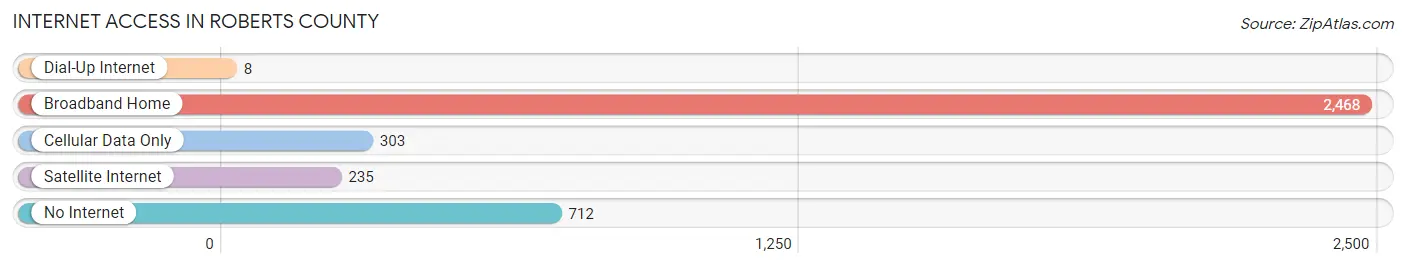
| Internet Type | # Households | % Households |
| Dial-Up Internet | 8 | 0.2% |
| Broadband Home | 2,468 | 67.4% |
| Cellular Data Only | 303 | 8.3% |
| Satellite Internet | 235 | 6.4% |
| No Internet | 712 | 19.5% |
| Total | 3,659 | 100.0% |
Roberts County Summary
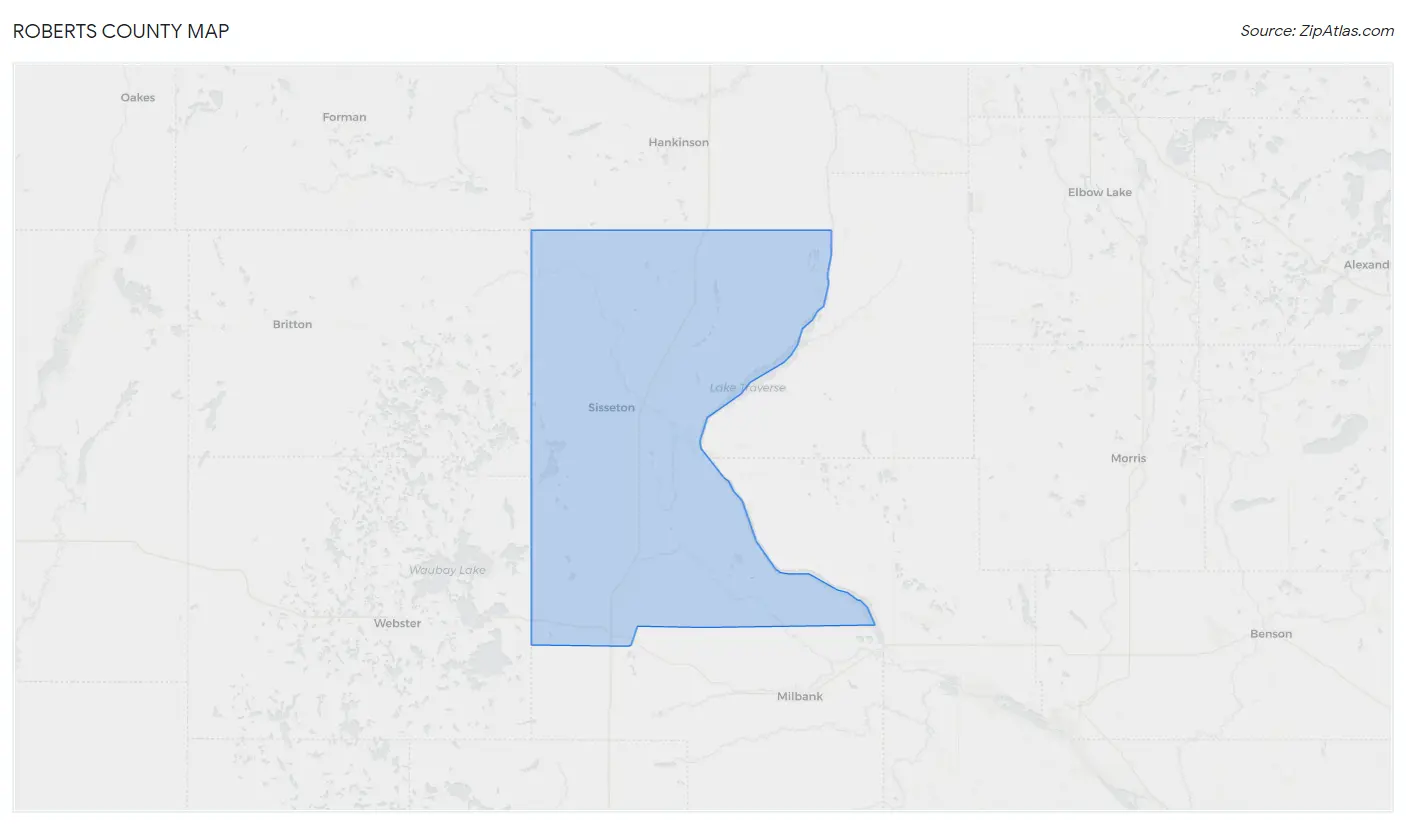
Roberts County is located in the northeastern corner of South Dakota, and is bordered by North Dakota to the north and Minnesota to the east. The county was established in 1883 and named after Amasa Roberts, a prominent early settler. The county seat is Sisseton, and the county has a total area of 845 square miles. As of the 2010 census, the population was 10,149.
History
The area that is now Roberts County was originally inhabited by the Dakota Sioux. The first white settlers arrived in the area in the late 1870s, and the county was officially established in 1883. The county was named after Amasa Roberts, a prominent early settler who had served in the Civil War.
The county was initially an agricultural area, with settlers growing wheat, oats, and barley. In the early 1900s, the county began to diversify its economy, with the development of coal mining, lumbering, and other industries. The county also became a popular destination for hunters and fishermen, and the area is still known for its excellent hunting and fishing opportunities.
Geography
Roberts County is located in the northeastern corner of South Dakota, and is bordered by North Dakota to the north and Minnesota to the east. The county has a total area of 845 square miles, and is mostly rural and agricultural. The terrain is mostly flat, with some rolling hills in the western part of the county. The county is drained by the Red River of the North, which forms the county's northern border.
The county is home to several lakes, including Big Stone Lake, Lake Traverse, and Lake Poinsett. The county also contains several wildlife management areas, including the Big Stone National Wildlife Refuge and the Lake Traverse Wildlife Management Area.
Economy
Agriculture is the primary economic activity in Roberts County. The county is home to a large number of farms, and the main crops grown in the area are wheat, oats, barley, and soybeans. The county is also home to several large cattle ranches.
In addition to agriculture, the county is home to several industries, including coal mining, lumbering, and manufacturing. The county is also home to several tourist attractions, including the Big Stone National Wildlife Refuge and the Lake Traverse Wildlife Management Area.
Demographics
As of the 2010 census, the population of Roberts County was 10,149. The population is mostly white (94.3%), with small percentages of Native American (2.3%), African American (1.2%), and Asian (0.5%) populations. The median household income in the county is $41,945, and the median age is 38.7 years.
The county is home to several small towns, including Sisseton (the county seat), Big Stone City, and Wilmot. The county is also home to several Native American reservations, including the Sisseton-Wahpeton Oyate, the Lake Traverse Reservation, and the Spirit Lake Reservation.
Common Questions
What is the Total Population of Roberts County?
Total Population of Roberts County is 10,242.
What is the Total Male Population of Roberts County?
Total Male Population of Roberts County is 5,276.
What is the Total Female Population of Roberts County?
Total Female Population of Roberts County is 4,966.
What is the Ratio of Males per 100 Females in Roberts County?
There are 106.24 Males per 100 Females in Roberts County.
What is the Ratio of Females per 100 Males in Roberts County?
There are 94.12 Females per 100 Males in Roberts County.
What is the Median Population Age in Roberts County?
Median Population Age in Roberts County is 37.0 Years.
What is the Average Family Size in Roberts County
Average Family Size in Roberts County is 3.4 People.
What is the Average Household Size in Roberts County
Average Household Size in Roberts County is 2.7 People.
What is Per Capita Income in Roberts County?
Per Capita income in Roberts County is $28,613.
What is the Median Family Income in Roberts County?
Median Family Income in Roberts County is $69,333.
What is the Median Household income in Roberts County?
Median Household Income in Roberts County is $59,022.
What is Income or Wage Gap in Roberts County?
Income or Wage Gap in Roberts County is 24.8%.
Women in Roberts County earn 75.2 cents for every dollar earned by a man.
What is Family Income Deficit in Roberts County?
Family Income Deficit in Roberts County is $11,432.
Families that are below poverty line in Roberts County earn $11,432 less on average than the poverty threshold level.
What is Inequality or Gini Index in Roberts County?
Inequality or Gini Index in Roberts County is 0.43.
How Large is the Labor Force in Roberts County?
There are 4,595 People in the Labor Forcein in Roberts County.
What is the Percentage of People in the Labor Force in Roberts County?
60.5% of People are in the Labor Force in Roberts County.
What is the Unemployment Rate in Roberts County?
Unemployment Rate in Roberts County is 5.2%.