Potter County, SD
Potter County Map
Potter County Overview
2,587
TOTAL POPULATION
1,264
MALE POPULATION
1,323
FEMALE POPULATION
95.54
MALES / 100 FEMALES
104.67
FEMALES / 100 MALES
44.7
MEDIAN AGE
3.1
AVG FAMILY SIZE
2.4
AVG HOUSEHOLD SIZE
$34,335
PER CAPITA INCOME
$89,750
AVG FAMILY INCOME
$71,786
AVG HOUSEHOLD INCOME
47.7%
WAGE / INCOME GAP [ % ]
52.3¢/ $1
WAGE / INCOME GAP [ $ ]
0.39
INEQUALITY / GINI INDEX
1,263
LABOR FORCE [ PEOPLE ]
61.7%
PERCENT IN LABOR FORCE
2.8%
UNEMPLOYMENT RATE
Potter County Area Codes
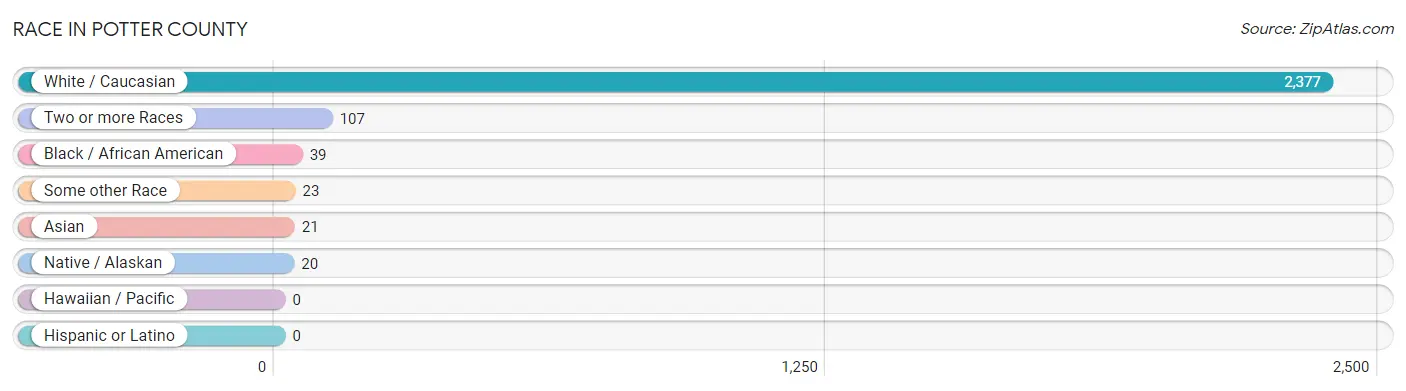
Race in Potter County
The most populous races in Potter County are White / Caucasian (2,377 | 91.9%), Two or more Races (107 | 4.1%), and Black / African American (39 | 1.5%).
| Race | # Population | % Population |
| Asian | 21 | 0.8% |
| Black / African American | 39 | 1.5% |
| Hawaiian / Pacific | 0 | 0.0% |
| Hispanic or Latino | 0 | 0.0% |
| Native / Alaskan | 20 | 0.8% |
| White / Caucasian | 2,377 | 91.9% |
| Two or more Races | 107 | 4.1% |
| Some other Race | 23 | 0.9% |
| Total | 2,587 | 100.0% |
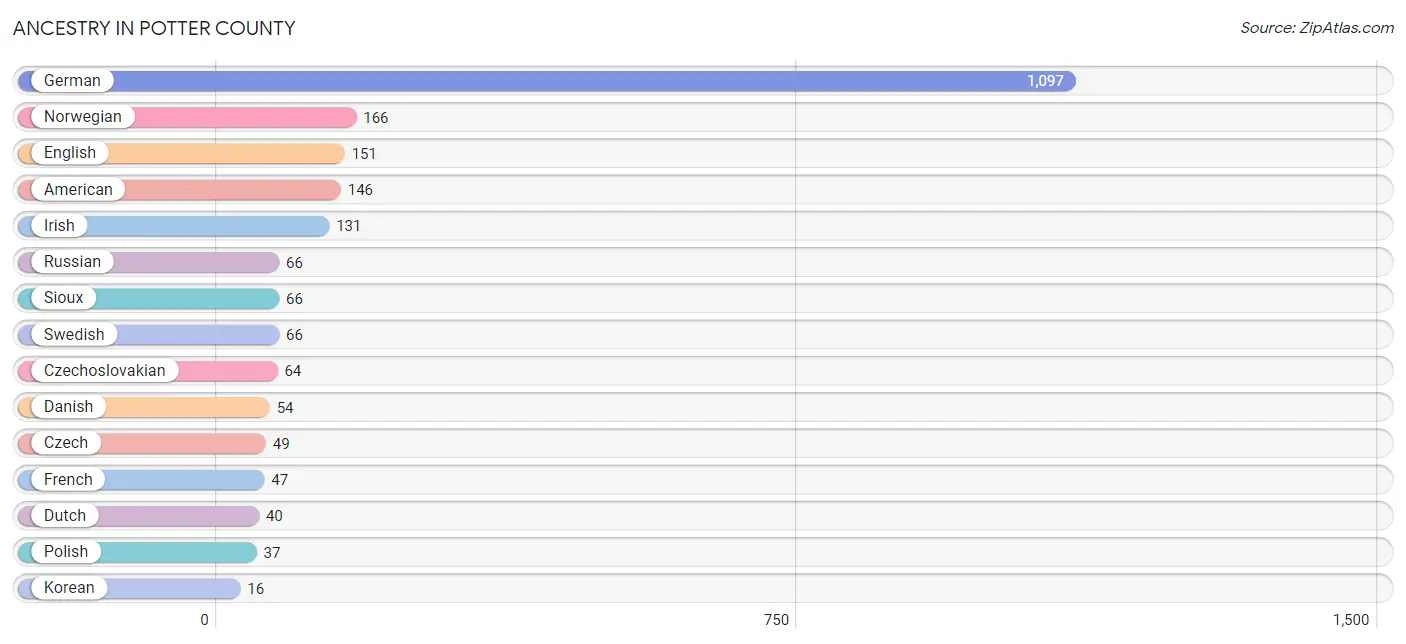
Ancestry in Potter County
The most populous ancestries reported in Potter County are German (1,097 | 42.4%), Norwegian (166 | 6.4%), English (151 | 5.8%), American (146 | 5.6%), and Irish (131 | 5.1%), together accounting for 65.4% of all Potter County residents.
| Ancestry | # Population | % Population |
| American | 146 | 5.6% |
| Austrian | 4 | 0.2% |
| Bulgarian | 1 | 0.0% |
| Burmese | 5 | 0.2% |
| Cherokee | 4 | 0.2% |
| Cheyenne | 6 | 0.2% |
| Czech | 49 | 1.9% |
| Czechoslovakian | 64 | 2.5% |
| Danish | 54 | 2.1% |
| Dutch | 40 | 1.5% |
| English | 151 | 5.8% |
| French | 47 | 1.8% |
| French Canadian | 8 | 0.3% |
| German | 1,097 | 42.4% |
| Greek | 6 | 0.2% |
| Irish | 131 | 5.1% |
| Italian | 14 | 0.5% |
| Korean | 16 | 0.6% |
| Northern European | 6 | 0.2% |
| Norwegian | 166 | 6.4% |
| Polish | 37 | 1.4% |
| Russian | 66 | 2.5% |
| Scandinavian | 3 | 0.1% |
| Scotch-Irish | 16 | 0.6% |
| Scottish | 11 | 0.4% |
| Sioux | 66 | 2.5% |
| Swedish | 66 | 2.5% |
| Ukrainian | 2 | 0.1% |
| Welsh | 15 | 0.6% | View All 29 Rows |
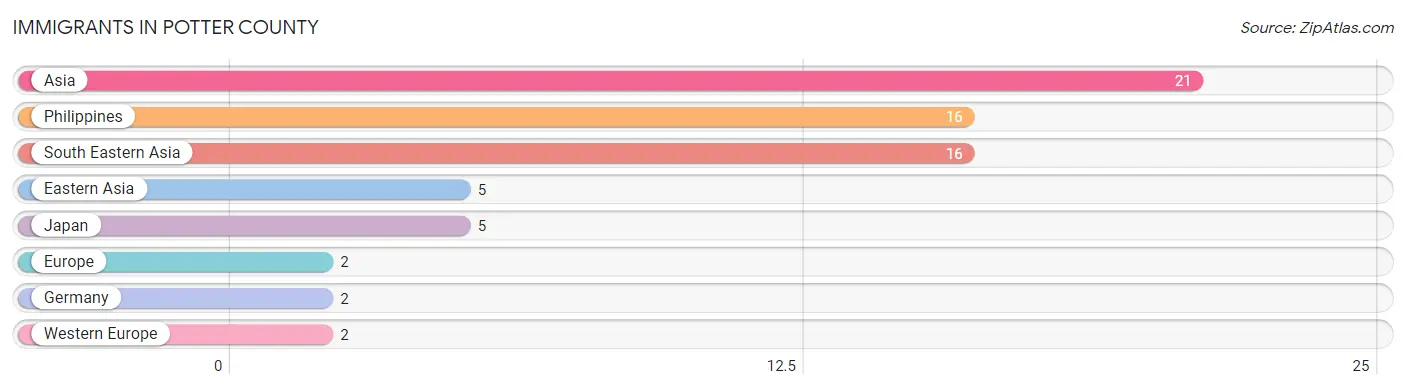
Immigrants in Potter County
The most numerous immigrant groups reported in Potter County came from Asia (21 | 0.8%), Philippines (16 | 0.6%), South Eastern Asia (16 | 0.6%), Eastern Asia (5 | 0.2%), and Japan (5 | 0.2%), together accounting for 2.4% of all Potter County residents.
| Immigration Origin | # Population | % Population |
| Asia | 21 | 0.8% |
| Eastern Asia | 5 | 0.2% |
| Europe | 2 | 0.1% |
| Germany | 2 | 0.1% |
| Japan | 5 | 0.2% |
| Philippines | 16 | 0.6% |
| South Eastern Asia | 16 | 0.6% |
| Western Europe | 2 | 0.1% | View All 8 Rows |
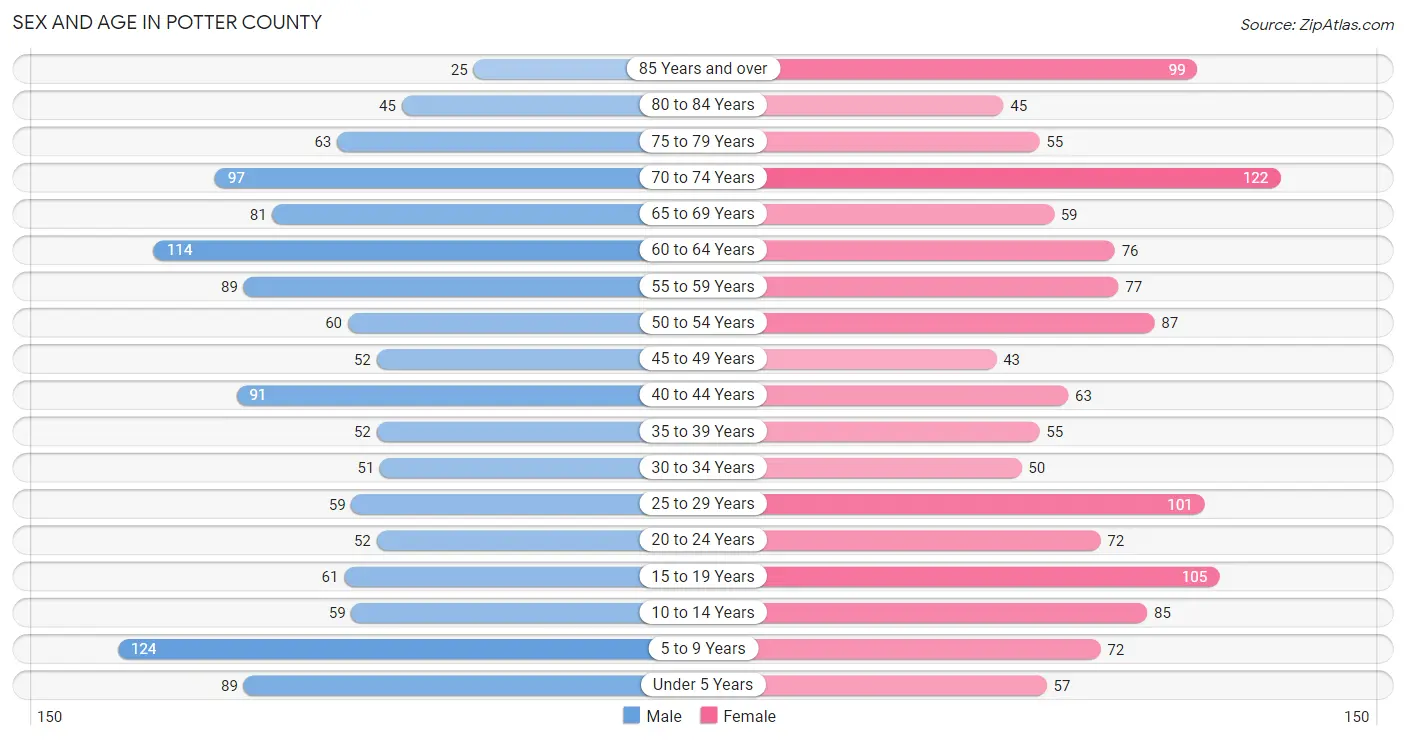
Sex and Age in Potter County
Sex and Age in Potter County
The most populous age groups in Potter County are 5 to 9 Years (124 | 9.8%) for men and 70 to 74 Years (122 | 9.2%) for women.
| Age Bracket | Male | Female |
| Under 5 Years | 89 (7.0%) | 57 (4.3%) |
| 5 to 9 Years | 124 (9.8%) | 72 (5.4%) |
| 10 to 14 Years | 59 (4.7%) | 85 (6.4%) |
| 15 to 19 Years | 61 (4.8%) | 105 (7.9%) |
| 20 to 24 Years | 52 (4.1%) | 72 (5.4%) |
| 25 to 29 Years | 59 (4.7%) | 101 (7.6%) |
| 30 to 34 Years | 51 (4.0%) | 50 (3.8%) |
| 35 to 39 Years | 52 (4.1%) | 55 (4.2%) |
| 40 to 44 Years | 91 (7.2%) | 63 (4.8%) |
| 45 to 49 Years | 52 (4.1%) | 43 (3.3%) |
| 50 to 54 Years | 60 (4.8%) | 87 (6.6%) |
| 55 to 59 Years | 89 (7.0%) | 77 (5.8%) |
| 60 to 64 Years | 114 (9.0%) | 76 (5.7%) |
| 65 to 69 Years | 81 (6.4%) | 59 (4.5%) |
| 70 to 74 Years | 97 (7.7%) | 122 (9.2%) |
| 75 to 79 Years | 63 (5.0%) | 55 (4.2%) |
| 80 to 84 Years | 45 (3.6%) | 45 (3.4%) |
| 85 Years and over | 25 (2.0%) | 99 (7.5%) |
| Total | 1,264 (100.0%) | 1,323 (100.0%) |
Families and Households in Potter County
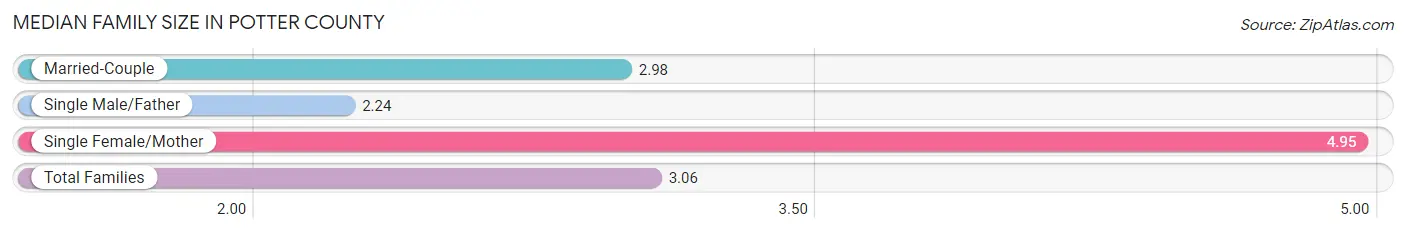
Median Family Size in Potter County
The median family size in Potter County is 3.06 persons per family, with single female/mother families (39 | 5.7%) accounting for the largest median family size of 4.95 persons per family. On the other hand, single male/father families (29 | 4.3%) represent the smallest median family size with 2.24 persons per family.
| Family Type | # Families | Family Size |
| Married-Couple | 613 (90.0%) | 2.98 |
| Single Male/Father | 29 (4.3%) | 2.24 |
| Single Female/Mother | 39 (5.7%) | 4.95 |
| Total Families | 681 (100.0%) | 3.06 |
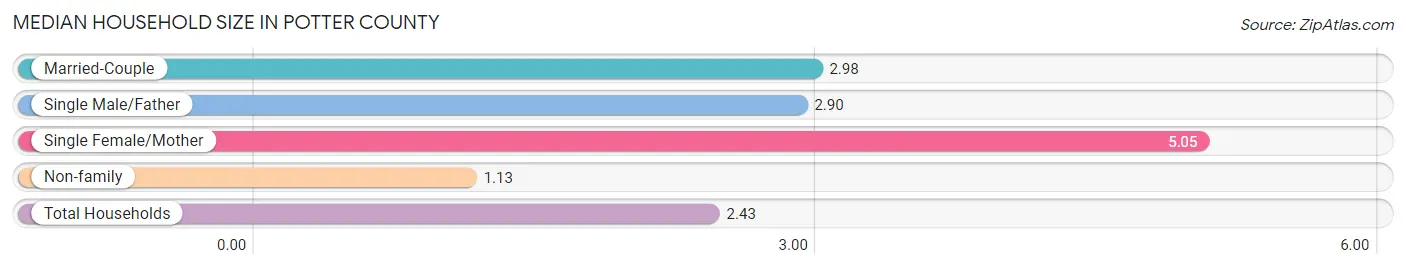
Median Household Size in Potter County
The median household size in Potter County is 2.43 persons per household, with single female/mother households (39 | 3.8%) accounting for the largest median household size of 5.05 persons per household. non-family households (353 | 34.1%) represent the smallest median household size with 1.13 persons per household.
| Household Type | # Households | Household Size |
| Married-Couple | 613 (59.3%) | 2.98 |
| Single Male/Father | 29 (2.8%) | 2.90 |
| Single Female/Mother | 39 (3.8%) | 5.05 |
| Non-family | 353 (34.1%) | 1.13 |
| Total Households | 1,034 (100.0%) | 2.43 |
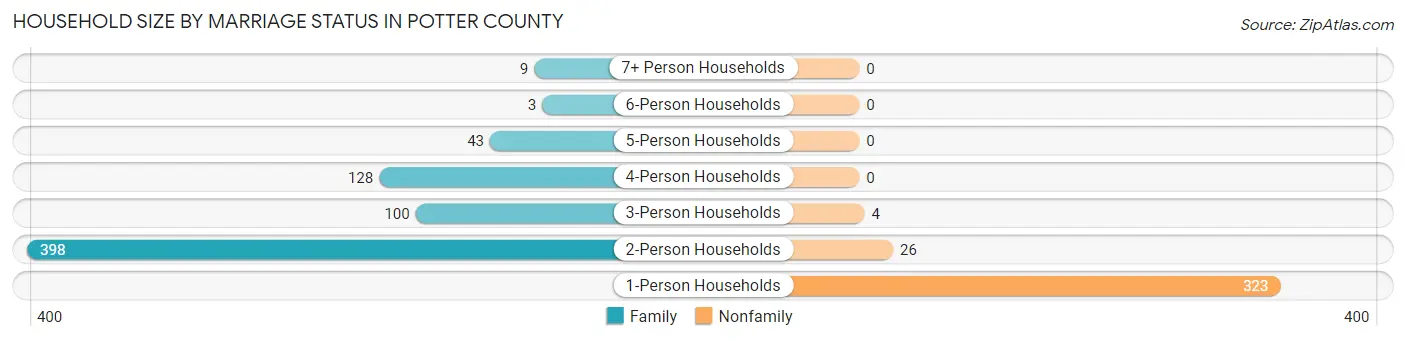
Household Size by Marriage Status in Potter County
Out of a total of 1,034 households in Potter County, 681 (65.9%) are family households, while 353 (34.1%) are nonfamily households. The most numerous type of family households are 2-person households, comprising 398, and the most common type of nonfamily households are 1-person households, comprising 323.
| Household Size | Family Households | Nonfamily Households |
| 1-Person Households | - | 323 (31.2%) |
| 2-Person Households | 398 (38.5%) | 26 (2.5%) |
| 3-Person Households | 100 (9.7%) | 4 (0.4%) |
| 4-Person Households | 128 (12.4%) | 0 (0.0%) |
| 5-Person Households | 43 (4.2%) | 0 (0.0%) |
| 6-Person Households | 3 (0.3%) | 0 (0.0%) |
| 7+ Person Households | 9 (0.9%) | 0 (0.0%) |
| Total | 681 (65.9%) | 353 (34.1%) |
Female Fertility in Potter County
Fertility by Age in Potter County
Average fertility rate in Potter County is 62.0 births per 1,000 women. Women in the age bracket of 20 to 34 years have the highest fertility rate with 139.0 births per 1,000 women. Women in the age bracket of 20 to 34 years acount for 100.0% of all women with births.
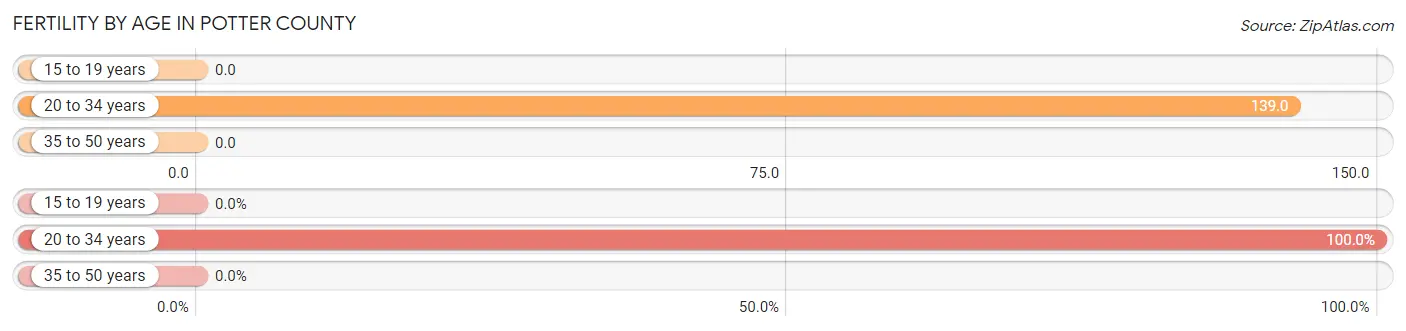
| Age Bracket | Women with Births | Births / 1,000 Women |
| 15 to 19 years | 0 (0.0%) | 0.0 |
| 20 to 34 years | 31 (100.0%) | 139.0 |
| 35 to 50 years | 0 (0.0%) | 0.0 |
| Total | 31 (100.0%) | 62.0 |
Fertility by Age by Marriage Status in Potter County
83.9% of women with births (31) in Potter County are married. The highest percentage of unmarried women with births falls into 20 to 34 years age bracket with 16.1% of them unmarried at the time of birth, while the lowest percentage of unmarried women with births belong to 20 to 34 years age bracket with 16.1% of them unmarried.
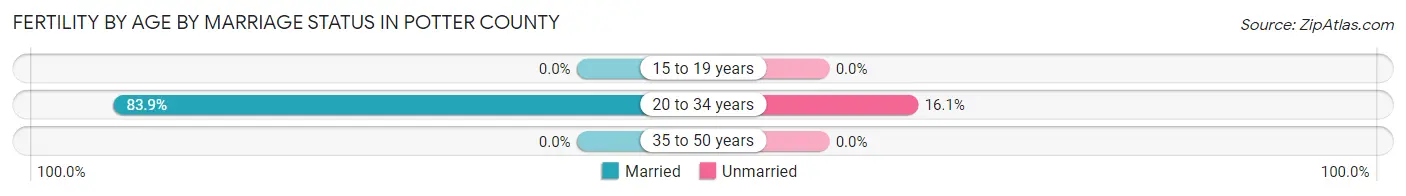
| Age Bracket | Married | Unmarried |
| 15 to 19 years | 0 (0.0%) | 0 (0.0%) |
| 20 to 34 years | 26 (83.9%) | 5 (16.1%) |
| 35 to 50 years | 0 (0.0%) | 0 (0.0%) |
| Total | 26 (83.9%) | 5 (16.1%) |
Fertility by Education in Potter County

| Educational Attainment | Women with Births | Births / 1,000 Women |
| Less than High School | 0 (0.0%) | 0.0 |
| High School Diploma | 0 (0.0%) | 0.0 |
| College or Associate's Degree | 16 (51.6%) | 118.0 |
| Bachelor's Degree | 8 (25.8%) | 100.0 |
| Graduate Degree | 7 (22.6%) | 368.0 |
| Total | 31 (100.0%) | 62.0 |
Fertility by Education by Marriage Status in Potter County
16.1% of women with births in Potter County are unmarried. Women with the educational attainment of bachelor's degree are most likely to be married with 100.0% of them married at childbirth, while women with the educational attainment of college or associate's degree are least likely to be married with 31.2% of them unmarried at childbirth.
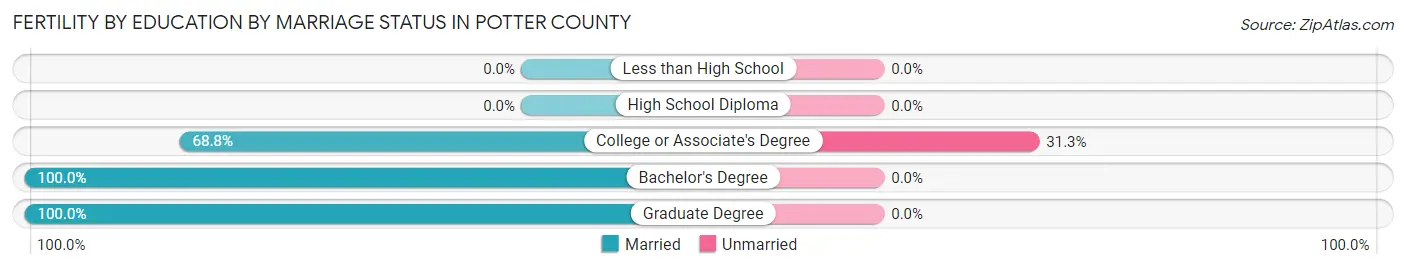
| Educational Attainment | Married | Unmarried |
| Less than High School | 0 (0.0%) | 0 (0.0%) |
| High School Diploma | 0 (0.0%) | 0 (0.0%) |
| College or Associate's Degree | 11 (68.8%) | 5 (31.2%) |
| Bachelor's Degree | 8 (100.0%) | 0 (0.0%) |
| Graduate Degree | 7 (100.0%) | 0 (0.0%) |
| Total | 26 (83.9%) | 5 (16.1%) |
Income in Potter County
Income Overview in Potter County
Per Capita Income in Potter County is $34,335, while median incomes of families and households are $89,750 and $71,786 respectively.
| Characteristic | Number | Measure |
| Per Capita Income | 2,587 | $34,335 |
| Median Family Income | 681 | $89,750 |
| Mean Family Income | 681 | $100,220 |
| Median Household Income | 1,034 | $71,786 |
| Mean Household Income | 1,034 | $84,176 |
| Income Deficit | 681 | $0 |
| Wage / Income Gap (%) | 2,587 | 47.71% |
| Wage / Income Gap ($) | 2,587 | 52.29¢ per $1 |
| Gini / Inequality Index | 2,587 | 0.39 |
Earnings by Sex in Potter County
Average Earnings in Potter County are $38,333, $46,667 for men and $24,400 for women, a difference of 47.7%.
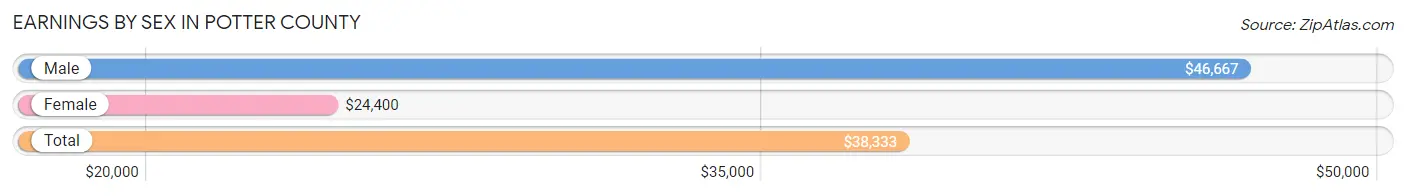
| Sex | Number | Average Earnings |
| Male | 720 (53.6%) | $46,667 |
| Female | 624 (46.4%) | $24,400 |
| Total | 1,344 (100.0%) | $38,333 |
Earnings by Sex by Income Bracket in Potter County
The most common earnings brackets in Potter County are $55,000 to $64,999 for men (98 | 13.6%) and $2,500 to $4,999 for women (88 | 14.1%).
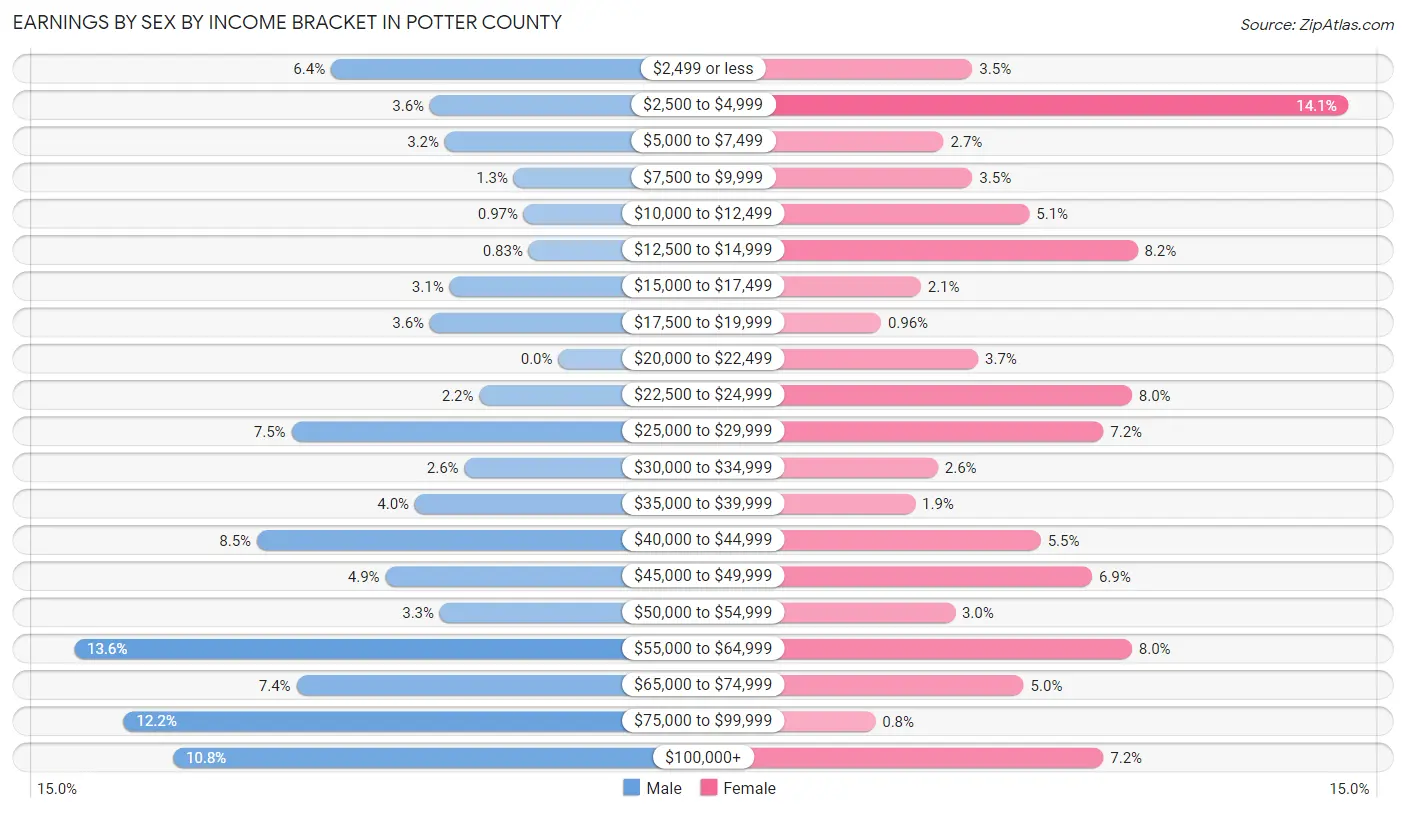
| Income | Male | Female |
| $2,499 or less | 46 (6.4%) | 22 (3.5%) |
| $2,500 to $4,999 | 26 (3.6%) | 88 (14.1%) |
| $5,000 to $7,499 | 23 (3.2%) | 17 (2.7%) |
| $7,500 to $9,999 | 9 (1.3%) | 22 (3.5%) |
| $10,000 to $12,499 | 7 (1.0%) | 32 (5.1%) |
| $12,500 to $14,999 | 6 (0.8%) | 51 (8.2%) |
| $15,000 to $17,499 | 22 (3.1%) | 13 (2.1%) |
| $17,500 to $19,999 | 26 (3.6%) | 6 (1.0%) |
| $20,000 to $22,499 | 0 (0.0%) | 23 (3.7%) |
| $22,500 to $24,999 | 16 (2.2%) | 50 (8.0%) |
| $25,000 to $29,999 | 54 (7.5%) | 45 (7.2%) |
| $30,000 to $34,999 | 19 (2.6%) | 16 (2.6%) |
| $35,000 to $39,999 | 29 (4.0%) | 12 (1.9%) |
| $40,000 to $44,999 | 61 (8.5%) | 34 (5.4%) |
| $45,000 to $49,999 | 35 (4.9%) | 43 (6.9%) |
| $50,000 to $54,999 | 24 (3.3%) | 19 (3.0%) |
| $55,000 to $64,999 | 98 (13.6%) | 50 (8.0%) |
| $65,000 to $74,999 | 53 (7.4%) | 31 (5.0%) |
| $75,000 to $99,999 | 88 (12.2%) | 5 (0.8%) |
| $100,000+ | 78 (10.8%) | 45 (7.2%) |
| Total | 720 (100.0%) | 624 (100.0%) |
Earnings by Sex by Educational Attainment in Potter County
Average earnings in Potter County are $51,548 for men and $27,768 for women, a difference of 46.1%. Men with an educational attainment of bachelor's degree enjoy the highest average annual earnings of $56,563, while those with high school diploma education earn the least with $46,146. Women with an educational attainment of graduate degree earn the most with the average annual earnings of $70,625, while those with high school diploma education have the smallest earnings of $23,750.

| Educational Attainment | Male Income | Female Income |
| Less than High School | - | - |
| High School Diploma | $46,146 | $23,750 |
| College or Associate's Degree | $51,125 | $47,891 |
| Bachelor's Degree | $56,563 | $24,375 |
| Graduate Degree | - | - |
| Total | $51,548 | $27,768 |
Family Income in Potter County
Family Income Brackets in Potter County
According to the Potter County family income data, there are 146 families falling into the $100,000 to $149,999 income range, which is the most common income bracket and makes up 21.4% of all families.
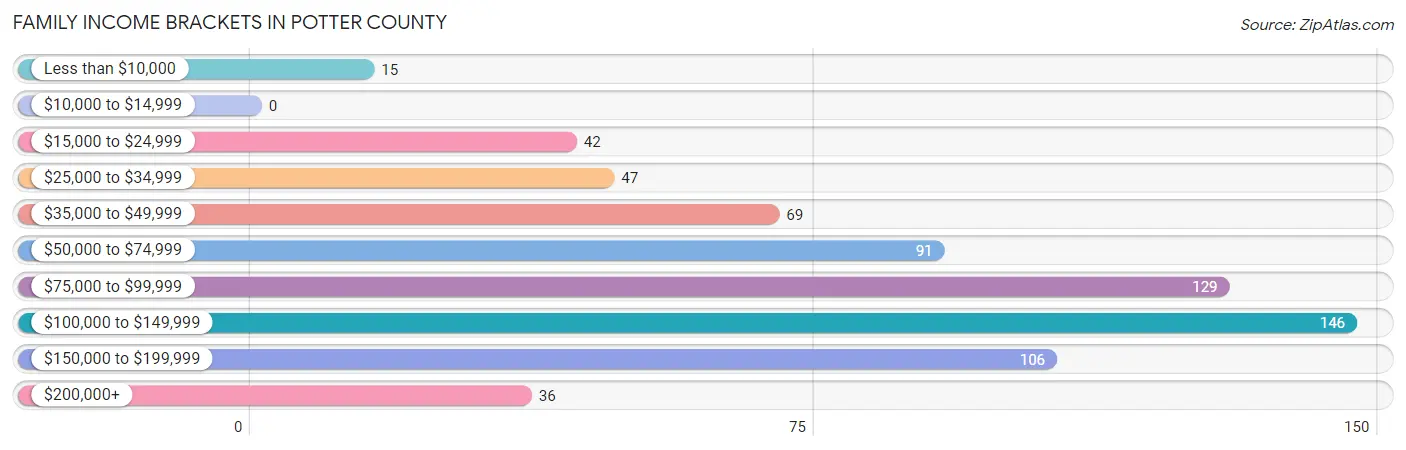
| Income Bracket | # Families | % Families |
| Less than $10,000 | 15 | 2.2% |
| $10,000 to $14,999 | 0 | 0.0% |
| $15,000 to $24,999 | 42 | 6.2% |
| $25,000 to $34,999 | 47 | 6.9% |
| $35,000 to $49,999 | 69 | 10.1% |
| $50,000 to $74,999 | 91 | 13.4% |
| $75,000 to $99,999 | 129 | 18.9% |
| $100,000 to $149,999 | 146 | 21.4% |
| $150,000 to $199,999 | 106 | 15.6% |
| $200,000+ | 36 | 5.3% |
Family Income by Famaliy Size in Potter County
4-person families (126 | 18.5%) account for the highest median family income in Potter County with $130,893 per family, while 2-person families (417 | 61.2%) have the highest median income of $40,044 per family member.

| Income Bracket | # Families | Median Income |
| 2-Person Families | 417 (61.2%) | $80,089 |
| 3-Person Families | 85 (12.5%) | $91,607 |
| 4-Person Families | 126 (18.5%) | $130,893 |
| 5-Person Families | 41 (6.0%) | $122,750 |
| 6-Person Families | 3 (0.4%) | $0 |
| 7+ Person Families | 9 (1.3%) | $0 |
| Total | 681 (100.0%) | $89,750 |
Family Income by Number of Earners in Potter County
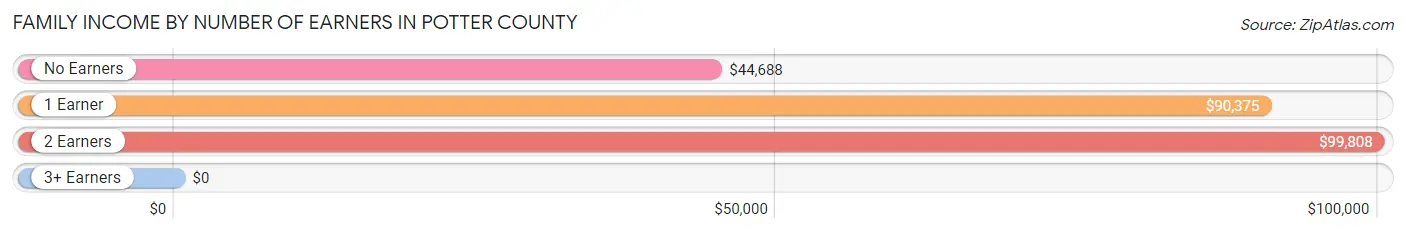
| Number of Earners | # Families | Median Income |
| No Earners | 123 (18.1%) | $44,688 |
| 1 Earner | 183 (26.9%) | $90,375 |
| 2 Earners | 350 (51.4%) | $99,808 |
| 3+ Earners | 25 (3.7%) | $0 |
| Total | 681 (100.0%) | $89,750 |
Household Income in Potter County
Household Income Brackets in Potter County
With 181 households falling in the category, the $75,000 to $99,999 income range is the most frequent in Potter County, accounting for 17.5% of all households. In contrast, only 26 households (2.5%) fall into the less than $10,000 income bracket, making it the least populous group.
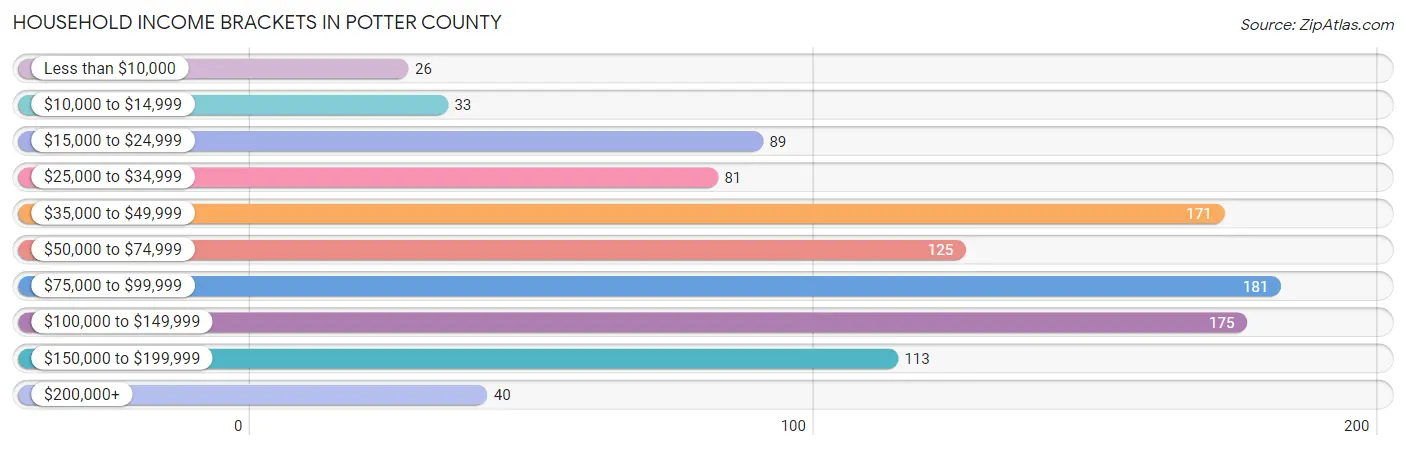
| Income Bracket | # Households | % Households |
| Less than $10,000 | 26 | 2.5% |
| $10,000 to $14,999 | 33 | 3.2% |
| $15,000 to $24,999 | 89 | 8.6% |
| $25,000 to $34,999 | 81 | 7.8% |
| $35,000 to $49,999 | 171 | 16.5% |
| $50,000 to $74,999 | 125 | 12.1% |
| $75,000 to $99,999 | 181 | 17.5% |
| $100,000 to $149,999 | 175 | 16.9% |
| $150,000 to $199,999 | 113 | 10.9% |
| $200,000+ | 40 | 3.9% |
Household Income by Householder Age in Potter County
The median household income in Potter County is $71,786, with the highest median household income of $98,472 found in the 25 to 44 years age bracket for the primary householder. A total of 213 households (20.6%) fall into this category. Meanwhile, the 15 to 24 years age bracket for the primary householder has the lowest median household income of $36,618, with 58 households (5.6%) in this group.
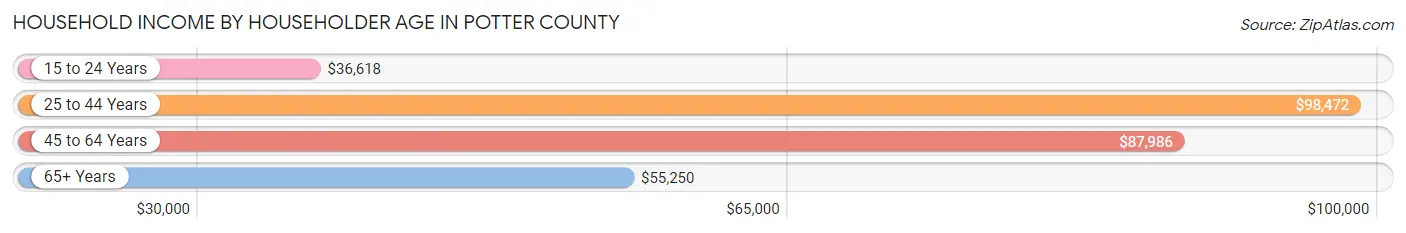
| Income Bracket | # Households | Median Income |
| 15 to 24 Years | 58 (5.6%) | $36,618 |
| 25 to 44 Years | 213 (20.6%) | $98,472 |
| 45 to 64 Years | 355 (34.3%) | $87,986 |
| 65+ Years | 408 (39.5%) | $55,250 |
| Total | 1,034 (100.0%) | $71,786 |
Poverty in Potter County
Income Below Poverty by Sex and Age in Potter County
With 10.1% poverty level for males and 3.8% for females among the residents of Potter County, 5 year old males and 75 year old and over females are the most vulnerable to poverty, with 26 males (66.7%) and 12 females (8.5%) in their respective age groups living below the poverty level.
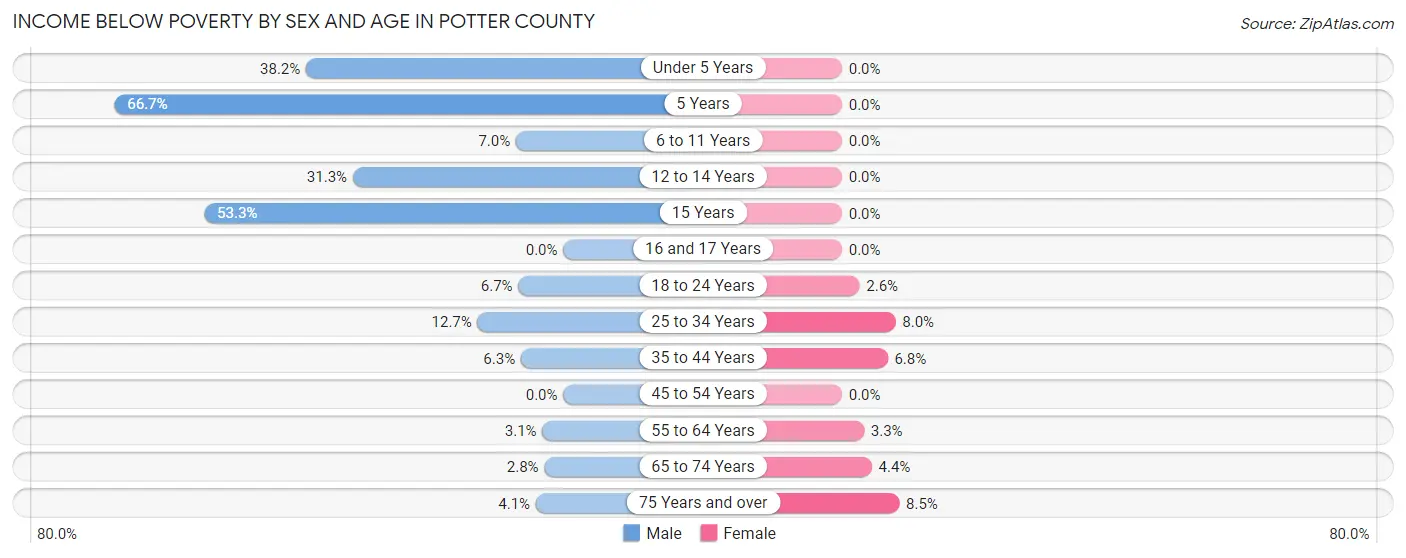
| Age Bracket | Male | Female |
| Under 5 Years | 34 (38.2%) | 0 (0.0%) |
| 5 Years | 26 (66.7%) | 0 (0.0%) |
| 6 to 11 Years | 9 (7.0%) | 0 (0.0%) |
| 12 to 14 Years | 5 (31.2%) | 0 (0.0%) |
| 15 Years | 8 (53.3%) | 0 (0.0%) |
| 16 and 17 Years | 0 (0.0%) | 0 (0.0%) |
| 18 to 24 Years | 5 (6.7%) | 3 (2.6%) |
| 25 to 34 Years | 14 (12.7%) | 12 (8.0%) |
| 35 to 44 Years | 9 (6.3%) | 8 (6.8%) |
| 45 to 54 Years | 0 (0.0%) | 0 (0.0%) |
| 55 to 64 Years | 6 (3.1%) | 5 (3.3%) |
| 65 to 74 Years | 5 (2.8%) | 8 (4.4%) |
| 75 Years and over | 5 (4.1%) | 12 (8.5%) |
| Total | 126 (10.1%) | 48 (3.8%) |
Income Above Poverty by Sex and Age in Potter County
According to the poverty statistics in Potter County, males aged 16 and 17 years and females aged under 5 years are the age groups that are most secure financially, with 100.0% of males and 100.0% of females in these age groups living above the poverty line.
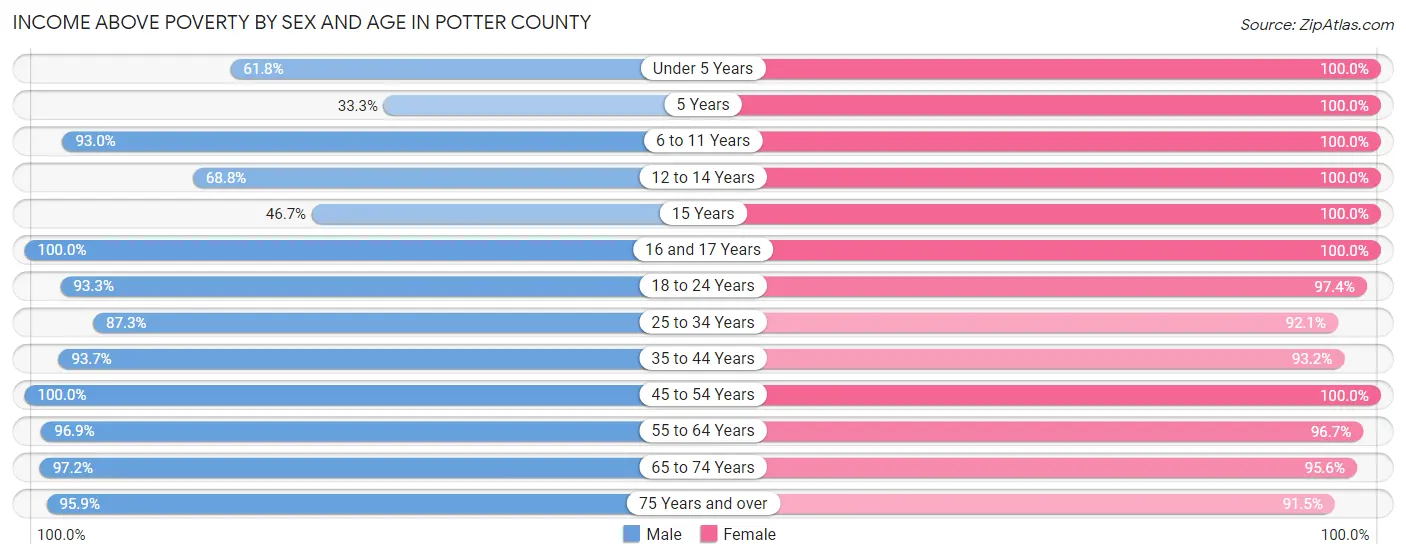
| Age Bracket | Male | Female |
| Under 5 Years | 55 (61.8%) | 47 (100.0%) |
| 5 Years | 13 (33.3%) | 17 (100.0%) |
| 6 to 11 Years | 119 (93.0%) | 73 (100.0%) |
| 12 to 14 Years | 11 (68.8%) | 64 (100.0%) |
| 15 Years | 7 (46.7%) | 39 (100.0%) |
| 16 and 17 Years | 23 (100.0%) | 23 (100.0%) |
| 18 to 24 Years | 70 (93.3%) | 112 (97.4%) |
| 25 to 34 Years | 96 (87.3%) | 139 (92.0%) |
| 35 to 44 Years | 134 (93.7%) | 110 (93.2%) |
| 45 to 54 Years | 112 (100.0%) | 130 (100.0%) |
| 55 to 64 Years | 187 (96.9%) | 148 (96.7%) |
| 65 to 74 Years | 173 (97.2%) | 173 (95.6%) |
| 75 Years and over | 118 (95.9%) | 129 (91.5%) |
| Total | 1,118 (89.9%) | 1,204 (96.2%) |
Income Below Poverty Among Married-Couple Families in Potter County
The poverty statistics for married-couple families in Potter County show that 5.1% or 31 of the total 613 families live below the poverty line. Families with 1 or 2 children have the highest poverty rate of 13.9%, comprising of 23 families. On the other hand, families with 3 or 4 children have the lowest poverty rate of 0.0%, which includes 0 families.

| Children | Above Poverty | Below Poverty |
| No Children | 389 (98.0%) | 8 (2.0%) |
| 1 or 2 Children | 143 (86.1%) | 23 (13.9%) |
| 3 or 4 Children | 41 (100.0%) | 0 (0.0%) |
| 5 or more Children | 9 (100.0%) | 0 (0.0%) |
| Total | 582 (94.9%) | 31 (5.1%) |
Income Below Poverty Among Single-Parent Households in Potter County

| Children | Single Father | Single Mother |
| No Children | 0 (0.0%) | 0 (0.0%) |
| 1 or 2 Children | 0 (0.0%) | 0 (0.0%) |
| 3 or 4 Children | 0 (0.0%) | 1 (50.0%) |
| 5 or more Children | 0 (0.0%) | 0 (0.0%) |
| Total | 0 (0.0%) | 1 (2.6%) |
Income Below Poverty Among Married-Couple vs Single-Parent Households in Potter County
The poverty data for Potter County shows that 31 of the married-couple family households (5.1%) and 1 of the single-parent households (1.5%) are living below the poverty level. Within the married-couple family households, those with 1 or 2 children have the highest poverty rate, with 23 households (13.9%) falling below the poverty line. Among the single-parent households, those with 3 or 4 children have the highest poverty rate, with 1 household (50.0%) living below poverty.
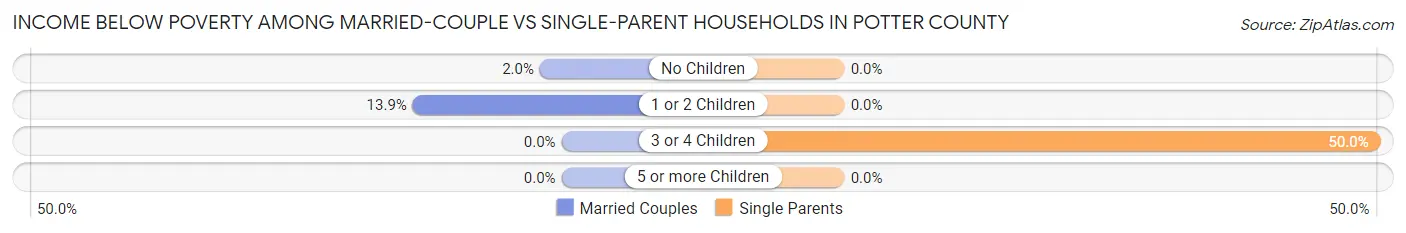
| Children | Married-Couple Families | Single-Parent Households |
| No Children | 8 (2.0%) | 0 (0.0%) |
| 1 or 2 Children | 23 (13.9%) | 0 (0.0%) |
| 3 or 4 Children | 0 (0.0%) | 1 (50.0%) |
| 5 or more Children | 0 (0.0%) | 0 (0.0%) |
| Total | 31 (5.1%) | 1 (1.5%) |
Employment Characteristics in Potter County
Employment by Class of Employer in Potter County
Among the 1,212 employed individuals in Potter County, private company employees (687 | 56.7%), self-employed (not incorporated) (169 | 13.9%), and self-employed (incorporated) (127 | 10.5%) make up the most common classes of employment.
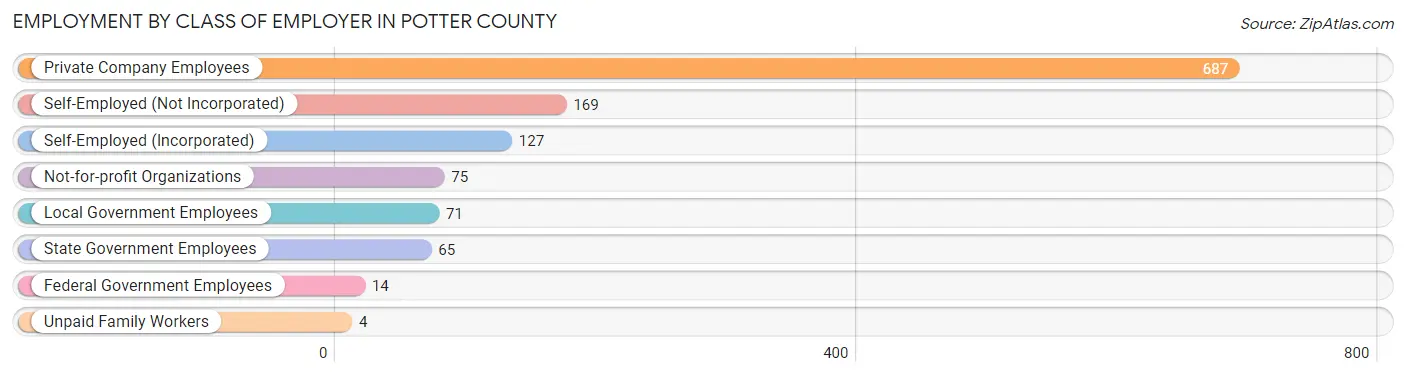
| Employer Class | # Employees | % Employees |
| Private Company Employees | 687 | 56.7% |
| Self-Employed (Incorporated) | 127 | 10.5% |
| Self-Employed (Not Incorporated) | 169 | 13.9% |
| Not-for-profit Organizations | 75 | 6.2% |
| Local Government Employees | 71 | 5.9% |
| State Government Employees | 65 | 5.4% |
| Federal Government Employees | 14 | 1.2% |
| Unpaid Family Workers | 4 | 0.3% |
| Total | 1,212 | 100.0% |
Employment Status by Age in Potter County
According to the labor force statistics for Potter County, out of the total population over 16 years of age (2,047), 61.7% or 1,263 individuals are in the labor force, with 2.8% or 35 of them unemployed. The age group with the highest labor force participation rate is 25 to 29 years, with 100.0% or 160 individuals in the labor force. Within the labor force, the 60 to 64 years age range has the highest percentage of unemployed individuals, with 17.2% or 20 of them being unemployed.
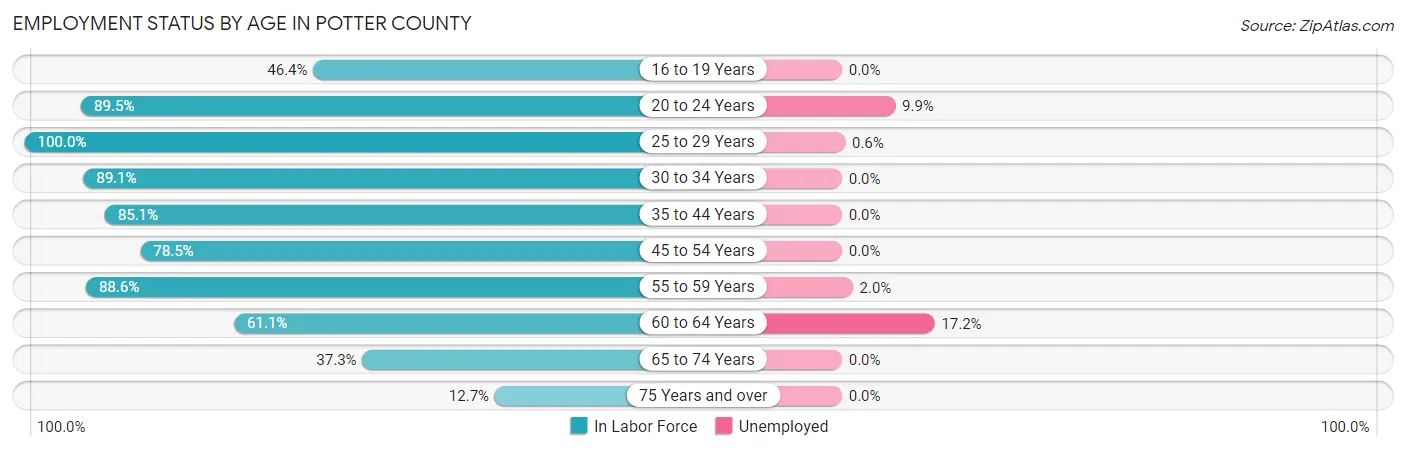
| Age Bracket | In Labor Force | Unemployed |
| 16 to 19 Years | 52 (46.4%) | 0 (0.0%) |
| 20 to 24 Years | 111 (89.5%) | 11 (9.9%) |
| 25 to 29 Years | 160 (100.0%) | 1 (0.6%) |
| 30 to 34 Years | 90 (89.1%) | 0 (0.0%) |
| 35 to 44 Years | 222 (85.1%) | 0 (0.0%) |
| 45 to 54 Years | 190 (78.5%) | 0 (0.0%) |
| 55 to 59 Years | 147 (88.6%) | 3 (2.0%) |
| 60 to 64 Years | 116 (61.1%) | 20 (17.2%) |
| 65 to 74 Years | 134 (37.3%) | 0 (0.0%) |
| 75 Years and over | 42 (12.7%) | 0 (0.0%) |
| Total | 1,263 (61.7%) | 35 (2.8%) |
Employment Status by Educational Attainment in Potter County
According to labor force statistics for Potter County, 82.6% of individuals (925) out of the total population between 25 and 64 years of age (1,120) are in the labor force, with 2.6% or 24 of them being unemployed. The group with the highest labor force participation rate are those with the educational attainment of less than high school, with 100.0% or 21 individuals in the labor force. Within the labor force, individuals with high school diploma education have the highest percentage of unemployment, with 5.4% or 20 of them being unemployed.
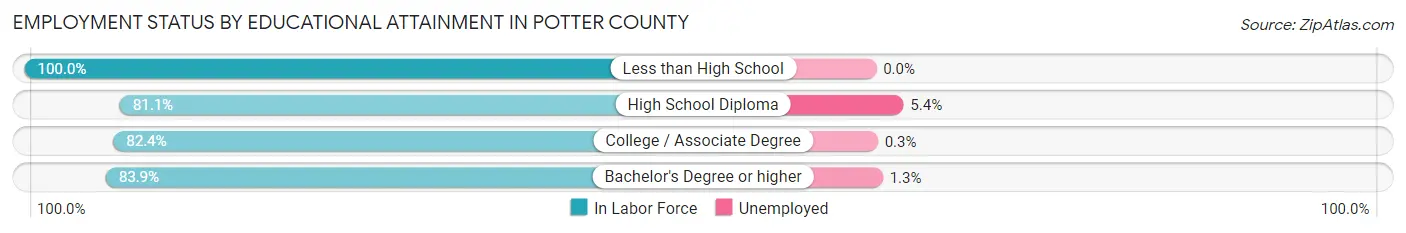
| Educational Attainment | In Labor Force | Unemployed |
| Less than High School | 21 (100.0%) | 0 (0.0%) |
| High School Diploma | 370 (81.1%) | 25 (5.4%) |
| College / Associate Degree | 305 (82.4%) | 1 (0.3%) |
| Bachelor's Degree or higher | 229 (83.9%) | 4 (1.3%) |
| Total | 925 (82.6%) | 29 (2.6%) |
Employment Occupations by Sex in Potter County
Management, Business, Science and Arts Occupations
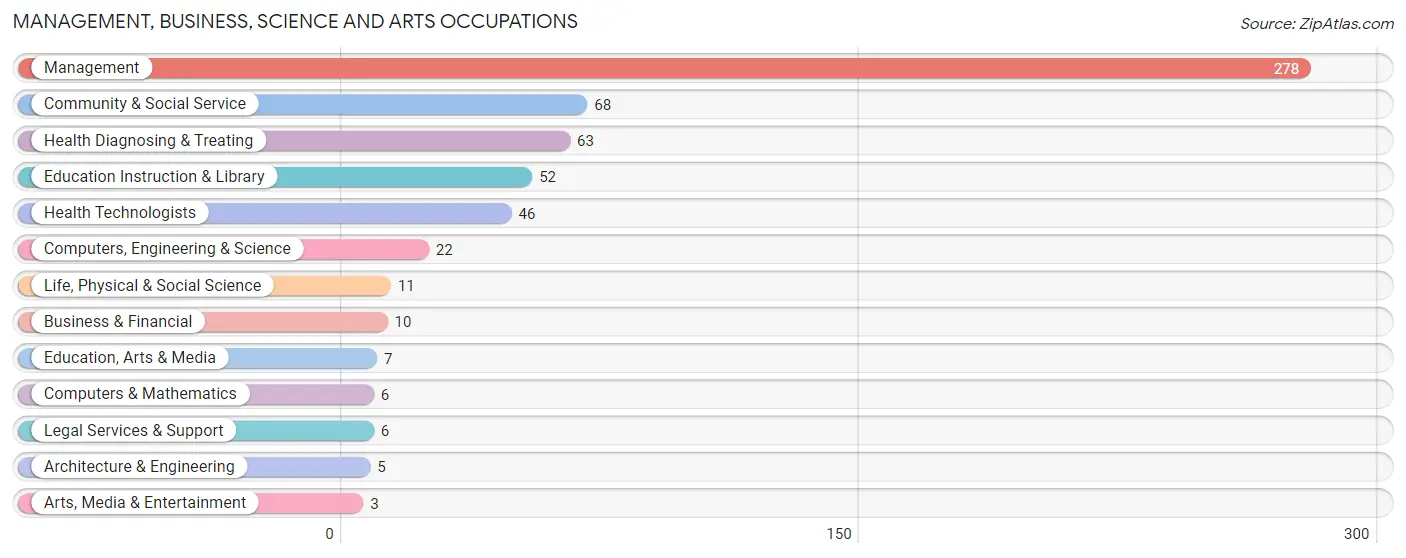
The most common Management, Business, Science and Arts occupations in Potter County are Management (278 | 22.6%), Community & Social Service (68 | 5.5%), Health Diagnosing & Treating (63 | 5.1%), Education Instruction & Library (52 | 4.2%), and Health Technologists (46 | 3.7%).
Management, Business, Science and Arts Occupations by Sex
Within the Management, Business, Science and Arts occupations in Potter County, the most male-oriented occupations are Computers, Engineering & Science (100.0%), Computers & Mathematics (100.0%), and Architecture & Engineering (100.0%), while the most female-oriented occupations are Arts, Media & Entertainment (100.0%), Health Diagnosing & Treating (100.0%), and Health Technologists (100.0%).
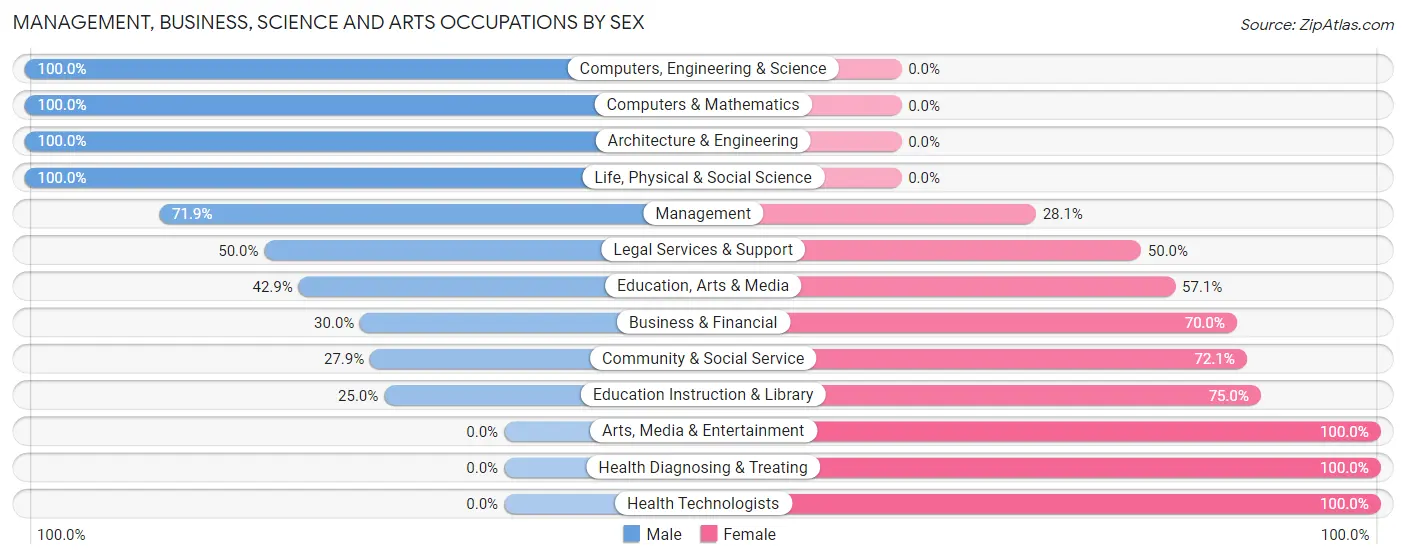
| Occupation | Male | Female |
| Management | 200 (71.9%) | 78 (28.1%) |
| Business & Financial | 3 (30.0%) | 7 (70.0%) |
| Computers, Engineering & Science | 22 (100.0%) | 0 (0.0%) |
| Computers & Mathematics | 6 (100.0%) | 0 (0.0%) |
| Architecture & Engineering | 5 (100.0%) | 0 (0.0%) |
| Life, Physical & Social Science | 11 (100.0%) | 0 (0.0%) |
| Community & Social Service | 19 (27.9%) | 49 (72.1%) |
| Education, Arts & Media | 3 (42.9%) | 4 (57.1%) |
| Legal Services & Support | 3 (50.0%) | 3 (50.0%) |
| Education Instruction & Library | 13 (25.0%) | 39 (75.0%) |
| Arts, Media & Entertainment | 0 (0.0%) | 3 (100.0%) |
| Health Diagnosing & Treating | 0 (0.0%) | 63 (100.0%) |
| Health Technologists | 0 (0.0%) | 46 (100.0%) |
| Total (Category) | 244 (55.3%) | 197 (44.7%) |
| Total (Overall) | 639 (52.0%) | 590 (48.0%) |
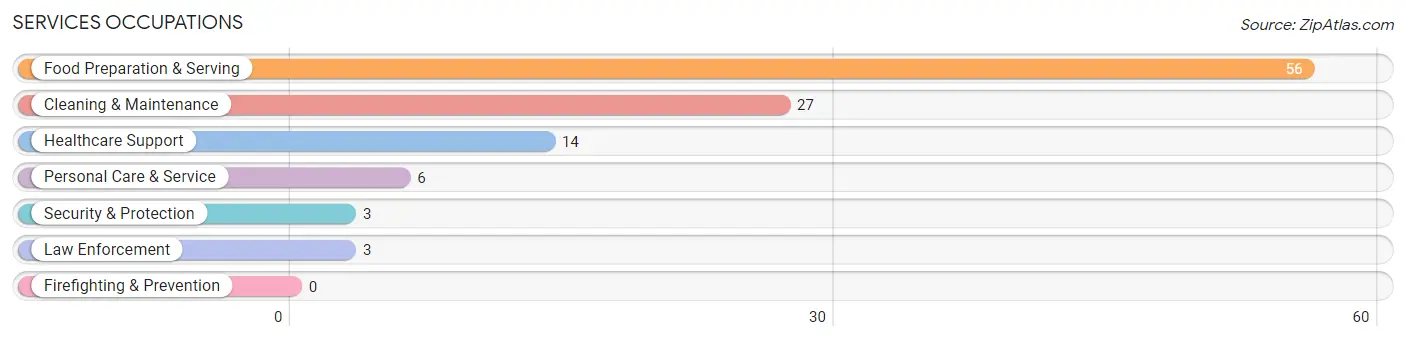
Services Occupations
The most common Services occupations in Potter County are Food Preparation & Serving (56 | 4.6%), Cleaning & Maintenance (27 | 2.2%), Healthcare Support (14 | 1.1%), Personal Care & Service (6 | 0.5%), and Security & Protection (3 | 0.2%).
Services Occupations by Sex
Within the Services occupations in Potter County, the most male-oriented occupations are Security & Protection (100.0%), Law Enforcement (100.0%), and Cleaning & Maintenance (63.0%), while the most female-oriented occupations are Healthcare Support (100.0%), Personal Care & Service (100.0%), and Food Preparation & Serving (82.1%).
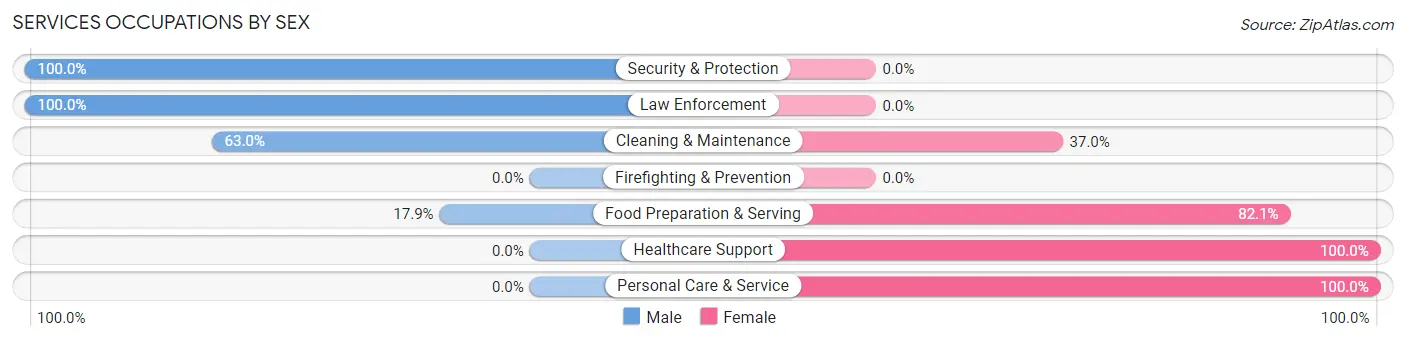
| Occupation | Male | Female |
| Healthcare Support | 0 (0.0%) | 14 (100.0%) |
| Security & Protection | 3 (100.0%) | 0 (0.0%) |
| Firefighting & Prevention | 0 (0.0%) | 0 (0.0%) |
| Law Enforcement | 3 (100.0%) | 0 (0.0%) |
| Food Preparation & Serving | 10 (17.9%) | 46 (82.1%) |
| Cleaning & Maintenance | 17 (63.0%) | 10 (37.0%) |
| Personal Care & Service | 0 (0.0%) | 6 (100.0%) |
| Total (Category) | 30 (28.3%) | 76 (71.7%) |
| Total (Overall) | 639 (52.0%) | 590 (48.0%) |
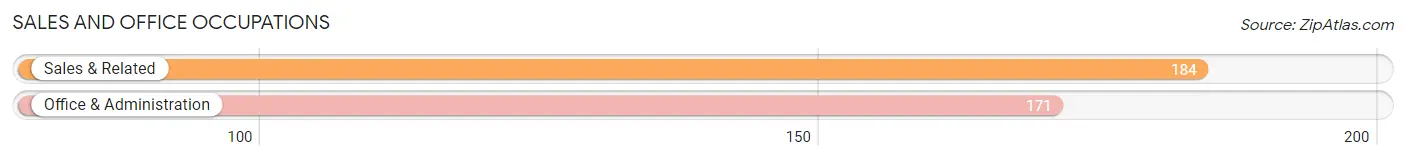
Sales and Office Occupations
The most common Sales and Office occupations in Potter County are Sales & Related (184 | 15.0%), and Office & Administration (171 | 13.9%).
Sales and Office Occupations by Sex
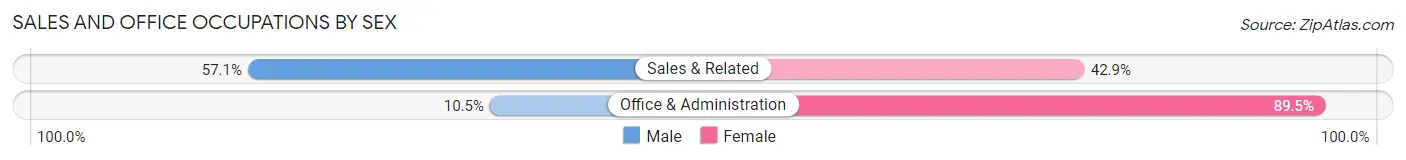
| Occupation | Male | Female |
| Sales & Related | 105 (57.1%) | 79 (42.9%) |
| Office & Administration | 18 (10.5%) | 153 (89.5%) |
| Total (Category) | 123 (34.6%) | 232 (65.3%) |
| Total (Overall) | 639 (52.0%) | 590 (48.0%) |
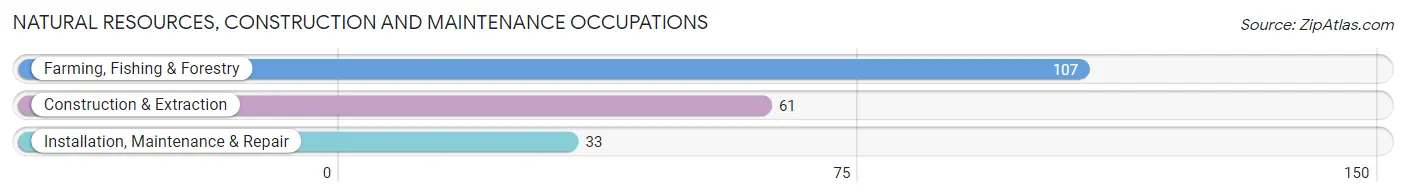
Natural Resources, Construction and Maintenance Occupations
The most common Natural Resources, Construction and Maintenance occupations in Potter County are Farming, Fishing & Forestry (107 | 8.7%), Construction & Extraction (61 | 5.0%), and Installation, Maintenance & Repair (33 | 2.7%).
Natural Resources, Construction and Maintenance Occupations by Sex
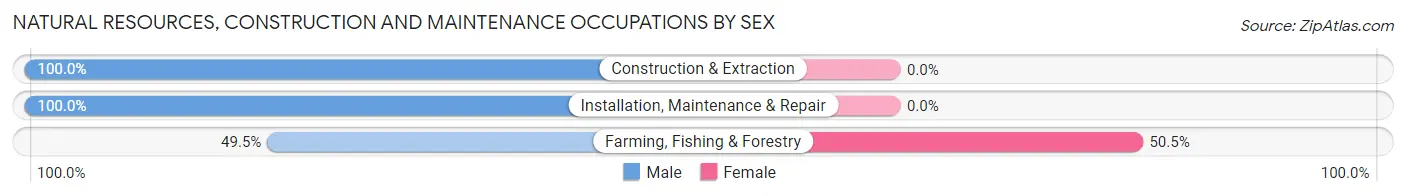
| Occupation | Male | Female |
| Farming, Fishing & Forestry | 53 (49.5%) | 54 (50.5%) |
| Construction & Extraction | 61 (100.0%) | 0 (0.0%) |
| Installation, Maintenance & Repair | 33 (100.0%) | 0 (0.0%) |
| Total (Category) | 147 (73.1%) | 54 (26.9%) |
| Total (Overall) | 639 (52.0%) | 590 (48.0%) |
Production, Transportation and Moving Occupations
The most common Production, Transportation and Moving occupations in Potter County are Transportation (74 | 6.0%), Material Moving (41 | 3.3%), and Production (11 | 0.9%).

Production, Transportation and Moving Occupations by Sex
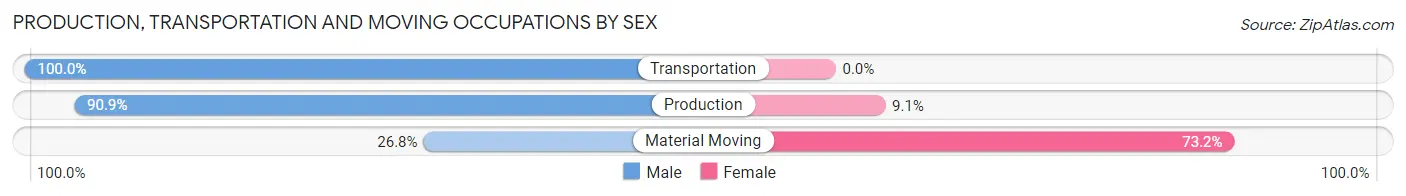
| Occupation | Male | Female |
| Production | 10 (90.9%) | 1 (9.1%) |
| Transportation | 74 (100.0%) | 0 (0.0%) |
| Material Moving | 11 (26.8%) | 30 (73.2%) |
| Total (Category) | 95 (75.4%) | 31 (24.6%) |
| Total (Overall) | 639 (52.0%) | 590 (48.0%) |
Employment Industries by Sex in Potter County
Employment Industries in Potter County
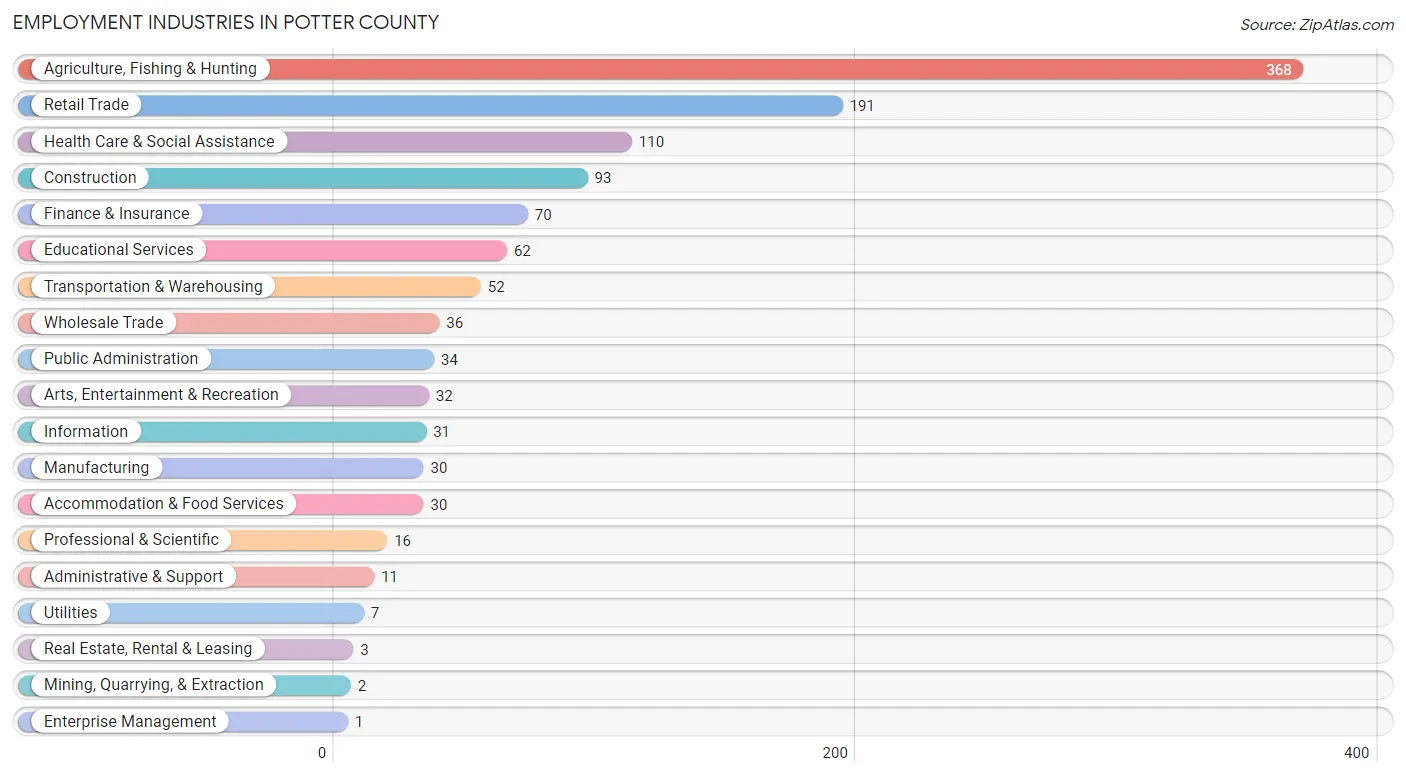
The major employment industries in Potter County include Agriculture, Fishing & Hunting (368 | 29.9%), Retail Trade (191 | 15.5%), Health Care & Social Assistance (110 | 8.9%), Construction (93 | 7.6%), and Finance & Insurance (70 | 5.7%).
Employment Industries by Sex in Potter County
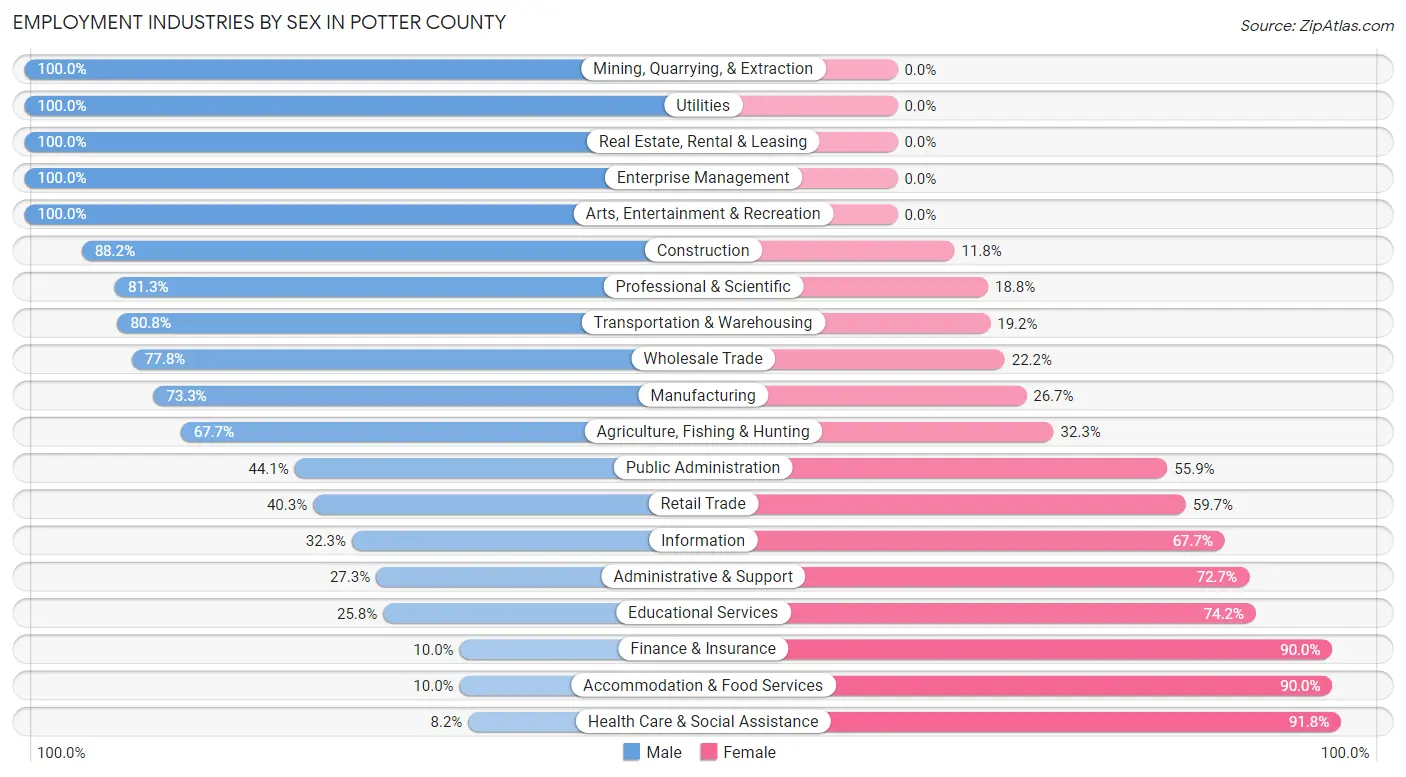
The Potter County industries that see more men than women are Mining, Quarrying, & Extraction (100.0%), Utilities (100.0%), and Real Estate, Rental & Leasing (100.0%), whereas the industries that tend to have a higher number of women are Health Care & Social Assistance (91.8%), Finance & Insurance (90.0%), and Accommodation & Food Services (90.0%).
| Industry | Male | Female |
| Agriculture, Fishing & Hunting | 249 (67.7%) | 119 (32.3%) |
| Mining, Quarrying, & Extraction | 2 (100.0%) | 0 (0.0%) |
| Construction | 82 (88.2%) | 11 (11.8%) |
| Manufacturing | 22 (73.3%) | 8 (26.7%) |
| Wholesale Trade | 28 (77.8%) | 8 (22.2%) |
| Retail Trade | 77 (40.3%) | 114 (59.7%) |
| Transportation & Warehousing | 42 (80.8%) | 10 (19.2%) |
| Utilities | 7 (100.0%) | 0 (0.0%) |
| Information | 10 (32.3%) | 21 (67.7%) |
| Finance & Insurance | 7 (10.0%) | 63 (90.0%) |
| Real Estate, Rental & Leasing | 3 (100.0%) | 0 (0.0%) |
| Professional & Scientific | 13 (81.2%) | 3 (18.8%) |
| Enterprise Management | 1 (100.0%) | 0 (0.0%) |
| Administrative & Support | 3 (27.3%) | 8 (72.7%) |
| Educational Services | 16 (25.8%) | 46 (74.2%) |
| Health Care & Social Assistance | 9 (8.2%) | 101 (91.8%) |
| Arts, Entertainment & Recreation | 32 (100.0%) | 0 (0.0%) |
| Accommodation & Food Services | 3 (10.0%) | 27 (90.0%) |
| Public Administration | 15 (44.1%) | 19 (55.9%) |
| Total | 639 (52.0%) | 590 (48.0%) |
Education in Potter County
School Enrollment in Potter County
The most common levels of schooling among the 569 students in Potter County are high school (156 | 27.4%), middle school (130 | 22.9%), and elementary school (122 | 21.4%).

| School Level | # Students | % Students |
| Nursery / Preschool | 44 | 7.7% |
| Kindergarten | 45 | 7.9% |
| Elementary School | 122 | 21.4% |
| Middle School | 130 | 22.9% |
| High School | 156 | 27.4% |
| College / Undergraduate | 67 | 11.8% |
| Graduate / Professional | 5 | 0.9% |
| Total | 569 | 100.0% |
School Enrollment by Age by Funding Source in Potter County
Out of a total of 569 students who are enrolled in schools in Potter County, 118 (20.7%) attend a private institution, while the remaining 451 (79.3%) are enrolled in public schools. The age group of 3 to 4 year olds has the highest likelihood of being enrolled in private schools, with 12 (57.1% in the age bracket) enrolled. Conversely, the age group of 25 to 34 year olds has the lowest likelihood of being enrolled in a private school, with 11 (100.0% in the age bracket) attending a public institution.

| Age Bracket | Public School | Private School |
| 3 to 4 Year Olds | 9 (42.9%) | 12 (57.1%) |
| 5 to 9 Year Old | 149 (81.9%) | 33 (18.1%) |
| 10 to 14 Year Olds | 124 (86.1%) | 20 (13.9%) |
| 15 to 17 Year Olds | 81 (81.0%) | 19 (19.0%) |
| 18 to 19 Year Olds | 28 (56.0%) | 22 (44.0%) |
| 20 to 24 Year Olds | 34 (82.9%) | 7 (17.1%) |
| 25 to 34 Year Olds | 11 (100.0%) | 0 (0.0%) |
| 35 Years and over | 15 (75.0%) | 5 (25.0%) |
| Total | 451 (79.3%) | 118 (20.7%) |
Educational Attainment by Field of Study in Potter County
Education (127 | 26.6%), bio, nature & agricultural (99 | 20.7%), business (67 | 14.0%), arts & humanities (61 | 12.8%), and science & technology (48 | 10.0%) are the most common fields of study among 478 individuals in Potter County who have obtained a bachelor's degree or higher.

| Field of Study | # Graduates | % Graduates |
| Computers & Mathematics | 0 | 0.0% |
| Bio, Nature & Agricultural | 99 | 20.7% |
| Physical & Health Sciences | 4 | 0.8% |
| Psychology | 11 | 2.3% |
| Social Sciences | 38 | 8.0% |
| Engineering | 5 | 1.1% |
| Multidisciplinary Studies | 7 | 1.5% |
| Science & Technology | 48 | 10.0% |
| Business | 67 | 14.0% |
| Education | 127 | 26.6% |
| Literature & Languages | 0 | 0.0% |
| Liberal Arts & History | 11 | 2.3% |
| Visual & Performing Arts | 0 | 0.0% |
| Communications | 0 | 0.0% |
| Arts & Humanities | 61 | 12.8% |
| Total | 478 | 100.0% |
Transportation & Commute in Potter County
Vehicle Availability by Sex in Potter County
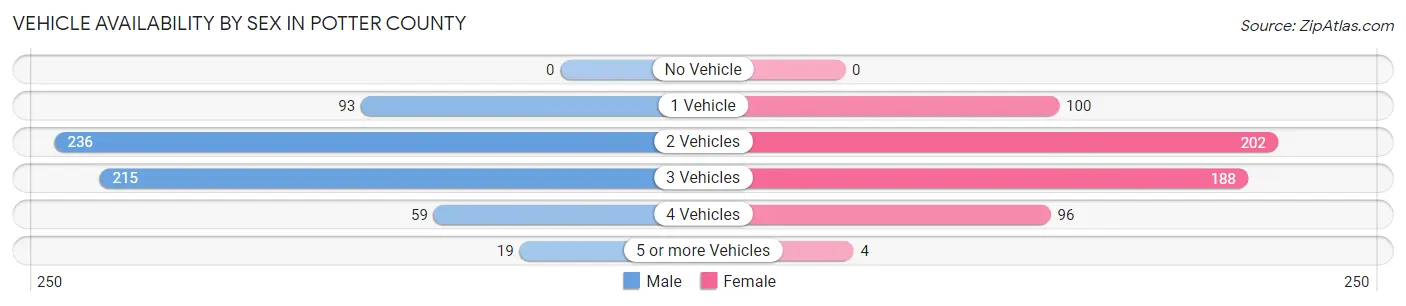
The most prevalent vehicle ownership categories in Potter County are males with 2 vehicles (236, accounting for 37.9%) and females with 2 vehicles (202, making up 40.0%).
| Vehicles Available | Male | Female |
| No Vehicle | 0 (0.0%) | 0 (0.0%) |
| 1 Vehicle | 93 (14.9%) | 100 (17.0%) |
| 2 Vehicles | 236 (37.9%) | 202 (34.2%) |
| 3 Vehicles | 215 (34.6%) | 188 (31.9%) |
| 4 Vehicles | 59 (9.5%) | 96 (16.3%) |
| 5 or more Vehicles | 19 (3.0%) | 4 (0.7%) |
| Total | 622 (100.0%) | 590 (100.0%) |
Commute Time in Potter County
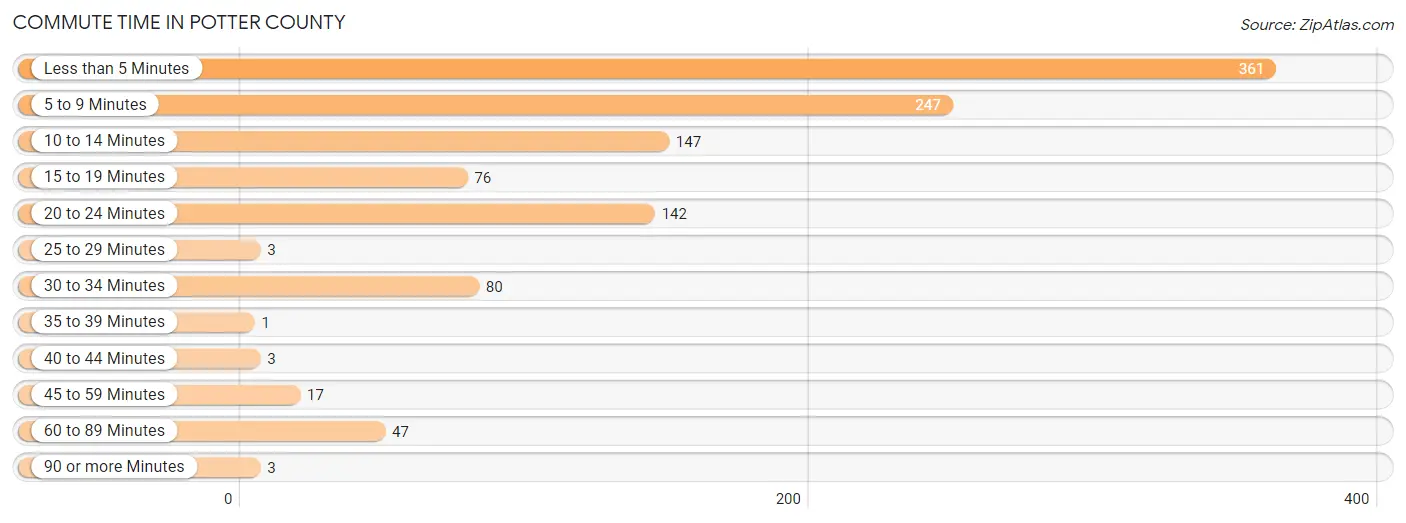
The most frequently occuring commute durations in Potter County are less than 5 minutes (361 commuters, 32.0%), 5 to 9 minutes (247 commuters, 21.9%), and 10 to 14 minutes (147 commuters, 13.0%).
| Commute Time | # Commuters | % Commuters |
| Less than 5 Minutes | 361 | 32.0% |
| 5 to 9 Minutes | 247 | 21.9% |
| 10 to 14 Minutes | 147 | 13.0% |
| 15 to 19 Minutes | 76 | 6.7% |
| 20 to 24 Minutes | 142 | 12.6% |
| 25 to 29 Minutes | 3 | 0.3% |
| 30 to 34 Minutes | 80 | 7.1% |
| 35 to 39 Minutes | 1 | 0.1% |
| 40 to 44 Minutes | 3 | 0.3% |
| 45 to 59 Minutes | 17 | 1.5% |
| 60 to 89 Minutes | 47 | 4.2% |
| 90 or more Minutes | 3 | 0.3% |
Commute Time by Sex in Potter County
The most common commute times in Potter County are less than 5 minutes (176 commuters, 30.6%) for males and less than 5 minutes (185 commuters, 33.6%) for females.
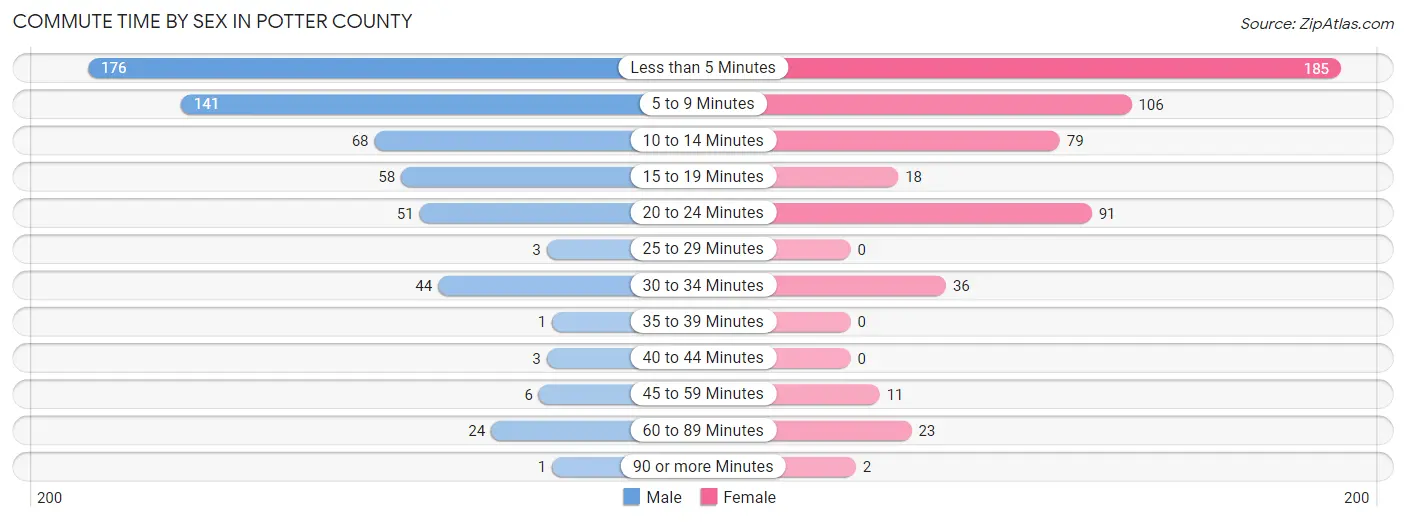
| Commute Time | Male | Female |
| Less than 5 Minutes | 176 (30.6%) | 185 (33.6%) |
| 5 to 9 Minutes | 141 (24.5%) | 106 (19.2%) |
| 10 to 14 Minutes | 68 (11.8%) | 79 (14.3%) |
| 15 to 19 Minutes | 58 (10.1%) | 18 (3.3%) |
| 20 to 24 Minutes | 51 (8.8%) | 91 (16.5%) |
| 25 to 29 Minutes | 3 (0.5%) | 0 (0.0%) |
| 30 to 34 Minutes | 44 (7.6%) | 36 (6.5%) |
| 35 to 39 Minutes | 1 (0.2%) | 0 (0.0%) |
| 40 to 44 Minutes | 3 (0.5%) | 0 (0.0%) |
| 45 to 59 Minutes | 6 (1.0%) | 11 (2.0%) |
| 60 to 89 Minutes | 24 (4.2%) | 23 (4.2%) |
| 90 or more Minutes | 1 (0.2%) | 2 (0.4%) |
Time of Departure to Work by Sex in Potter County
The most frequent times of departure to work in Potter County are 7:00 AM to 7:29 AM (184, 31.9%) for males and 7:00 AM to 7:29 AM (134, 24.3%) for females.

| Time of Departure | Male | Female |
| 12:00 AM to 4:59 AM | 15 (2.6%) | 8 (1.5%) |
| 5:00 AM to 5:29 AM | 7 (1.2%) | 9 (1.6%) |
| 5:30 AM to 5:59 AM | 0 (0.0%) | 12 (2.2%) |
| 6:00 AM to 6:29 AM | 52 (9.0%) | 29 (5.3%) |
| 6:30 AM to 6:59 AM | 35 (6.1%) | 62 (11.3%) |
| 7:00 AM to 7:29 AM | 184 (31.9%) | 134 (24.3%) |
| 7:30 AM to 7:59 AM | 132 (22.9%) | 104 (18.9%) |
| 8:00 AM to 8:29 AM | 96 (16.7%) | 64 (11.6%) |
| 8:30 AM to 8:59 AM | 21 (3.6%) | 45 (8.2%) |
| 9:00 AM to 9:59 AM | 7 (1.2%) | 65 (11.8%) |
| 10:00 AM to 10:59 AM | 9 (1.6%) | 9 (1.6%) |
| 11:00 AM to 11:59 AM | 0 (0.0%) | 0 (0.0%) |
| 12:00 PM to 3:59 PM | 12 (2.1%) | 6 (1.1%) |
| 4:00 PM to 11:59 PM | 6 (1.0%) | 4 (0.7%) |
| Total | 576 (100.0%) | 551 (100.0%) |
Housing Occupancy in Potter County
Occupancy by Ownership in Potter County
Of the total 1,034 dwellings in Potter County, owner-occupied units account for 805 (77.8%), while renter-occupied units make up 229 (22.2%).
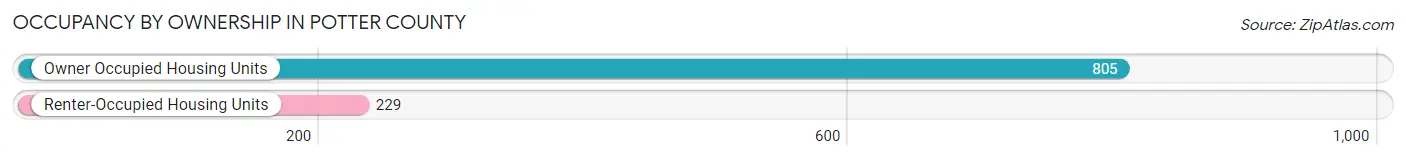
| Occupancy | # Housing Units | % Housing Units |
| Owner Occupied Housing Units | 805 | 77.8% |
| Renter-Occupied Housing Units | 229 | 22.2% |
| Total Occupied Housing Units | 1,034 | 100.0% |
Occupancy by Household Size in Potter County
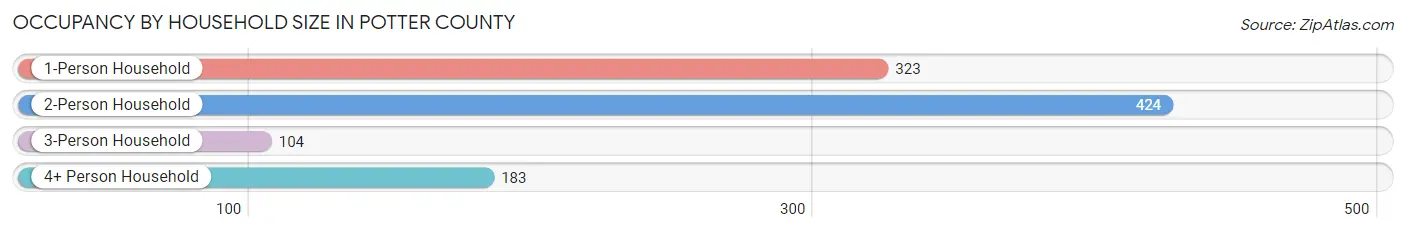
| Household Size | # Housing Units | % Housing Units |
| 1-Person Household | 323 | 31.2% |
| 2-Person Household | 424 | 41.0% |
| 3-Person Household | 104 | 10.1% |
| 4+ Person Household | 183 | 17.7% |
| Total Housing Units | 1,034 | 100.0% |
Occupancy by Ownership by Household Size in Potter County
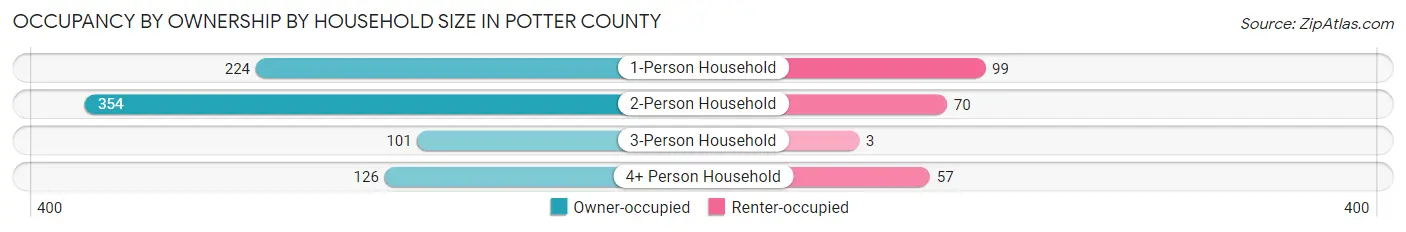
| Household Size | Owner-occupied | Renter-occupied |
| 1-Person Household | 224 (69.4%) | 99 (30.6%) |
| 2-Person Household | 354 (83.5%) | 70 (16.5%) |
| 3-Person Household | 101 (97.1%) | 3 (2.9%) |
| 4+ Person Household | 126 (68.9%) | 57 (31.1%) |
| Total Housing Units | 805 (77.8%) | 229 (22.2%) |
Occupancy by Educational Attainment in Potter County
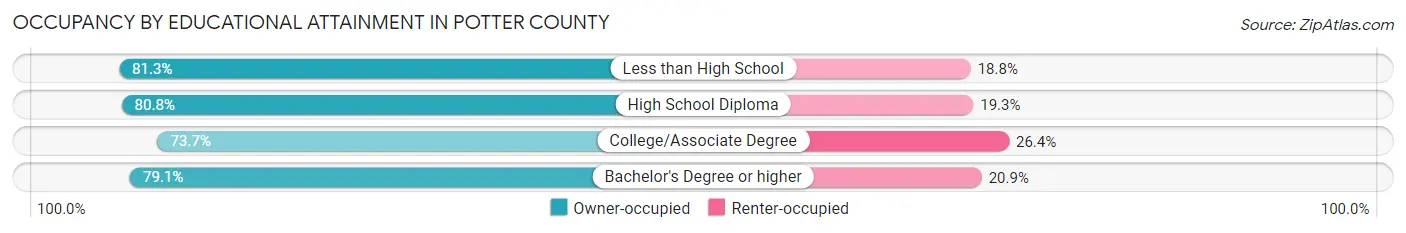
| Household Size | Owner-occupied | Renter-occupied |
| Less than High School | 26 (81.2%) | 6 (18.8%) |
| High School Diploma | 281 (80.7%) | 67 (19.3%) |
| College/Associate Degree | 260 (73.7%) | 93 (26.4%) |
| Bachelor's Degree or higher | 238 (79.1%) | 63 (20.9%) |
Occupancy by Age of Householder in Potter County

| Age Bracket | # Households | % Households |
| Under 35 Years | 154 | 14.9% |
| 35 to 44 Years | 117 | 11.3% |
| 45 to 54 Years | 148 | 14.3% |
| 55 to 64 Years | 207 | 20.0% |
| 65 to 74 Years | 229 | 22.2% |
| 75 to 84 Years | 118 | 11.4% |
| 85 Years and Over | 61 | 5.9% |
| Total | 1,034 | 100.0% |
Housing Finances in Potter County
Median Income by Occupancy in Potter County
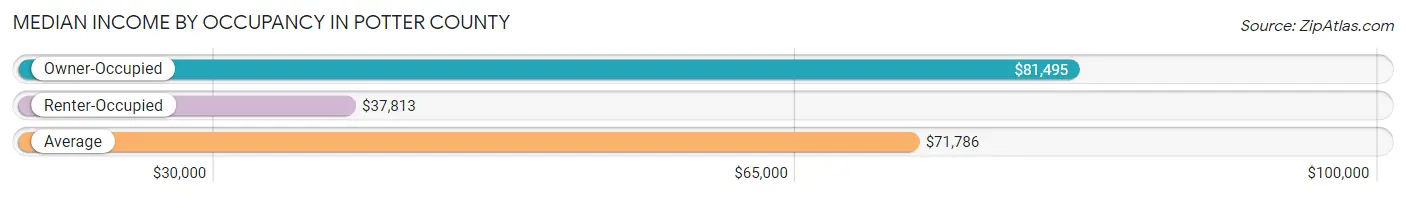
| Occupancy Type | # Households | Median Income |
| Owner-Occupied | 805 (77.8%) | $81,495 |
| Renter-Occupied | 229 (22.2%) | $37,813 |
| Average | 1,034 (100.0%) | $71,786 |
Occupancy by Householder Income Bracket in Potter County
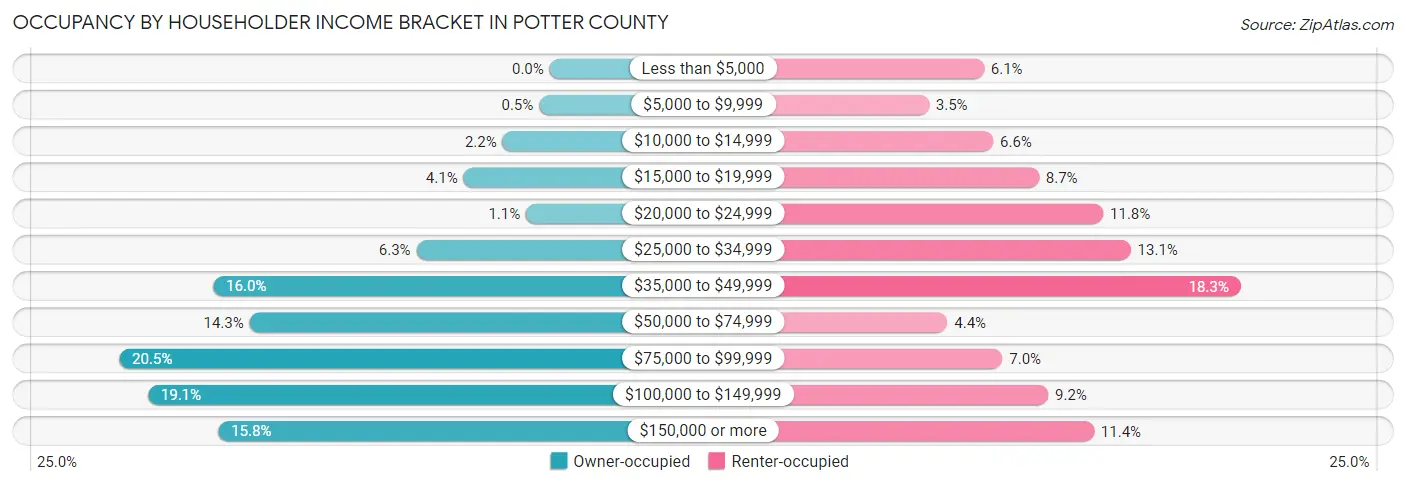
| Income Bracket | Owner-occupied | Renter-occupied |
| Less than $5,000 | 0 (0.0%) | 14 (6.1%) |
| $5,000 to $9,999 | 4 (0.5%) | 8 (3.5%) |
| $10,000 to $14,999 | 18 (2.2%) | 15 (6.6%) |
| $15,000 to $19,999 | 33 (4.1%) | 20 (8.7%) |
| $20,000 to $24,999 | 9 (1.1%) | 27 (11.8%) |
| $25,000 to $34,999 | 51 (6.3%) | 30 (13.1%) |
| $35,000 to $49,999 | 129 (16.0%) | 42 (18.3%) |
| $50,000 to $74,999 | 115 (14.3%) | 10 (4.4%) |
| $75,000 to $99,999 | 165 (20.5%) | 16 (7.0%) |
| $100,000 to $149,999 | 154 (19.1%) | 21 (9.2%) |
| $150,000 or more | 127 (15.8%) | 26 (11.4%) |
| Total | 805 (100.0%) | 229 (100.0%) |
Monthly Housing Cost Tiers in Potter County
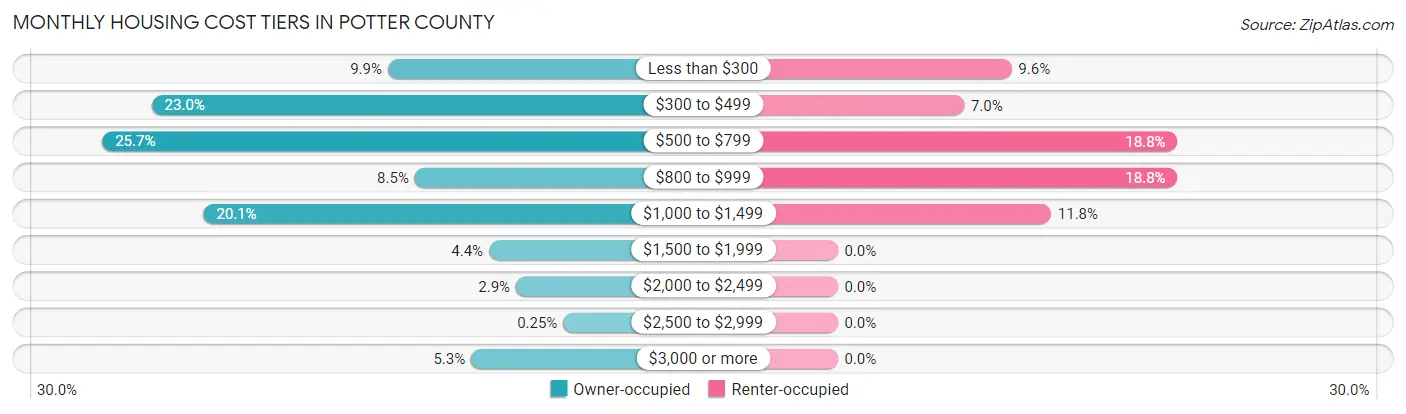
| Monthly Cost | Owner-occupied | Renter-occupied |
| Less than $300 | 80 (9.9%) | 22 (9.6%) |
| $300 to $499 | 185 (23.0%) | 16 (7.0%) |
| $500 to $799 | 207 (25.7%) | 43 (18.8%) |
| $800 to $999 | 68 (8.5%) | 43 (18.8%) |
| $1,000 to $1,499 | 162 (20.1%) | 27 (11.8%) |
| $1,500 to $1,999 | 35 (4.3%) | 0 (0.0%) |
| $2,000 to $2,499 | 23 (2.9%) | 0 (0.0%) |
| $2,500 to $2,999 | 2 (0.3%) | 0 (0.0%) |
| $3,000 or more | 43 (5.3%) | 0 (0.0%) |
| Total | 805 (100.0%) | 229 (100.0%) |
Physical Housing Characteristics in Potter County
Housing Structures in Potter County
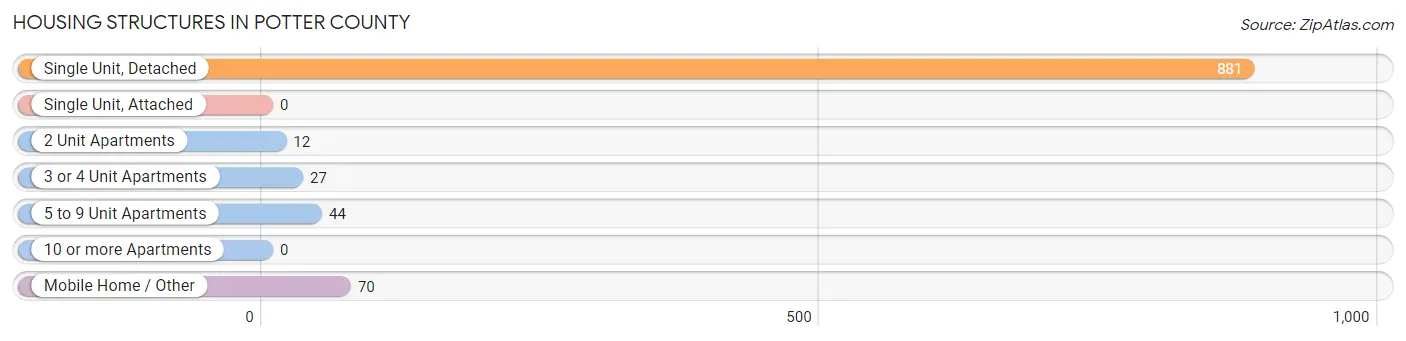
| Structure Type | # Housing Units | % Housing Units |
| Single Unit, Detached | 881 | 85.2% |
| Single Unit, Attached | 0 | 0.0% |
| 2 Unit Apartments | 12 | 1.2% |
| 3 or 4 Unit Apartments | 27 | 2.6% |
| 5 to 9 Unit Apartments | 44 | 4.3% |
| 10 or more Apartments | 0 | 0.0% |
| Mobile Home / Other | 70 | 6.8% |
| Total | 1,034 | 100.0% |
Housing Structures by Occupancy in Potter County
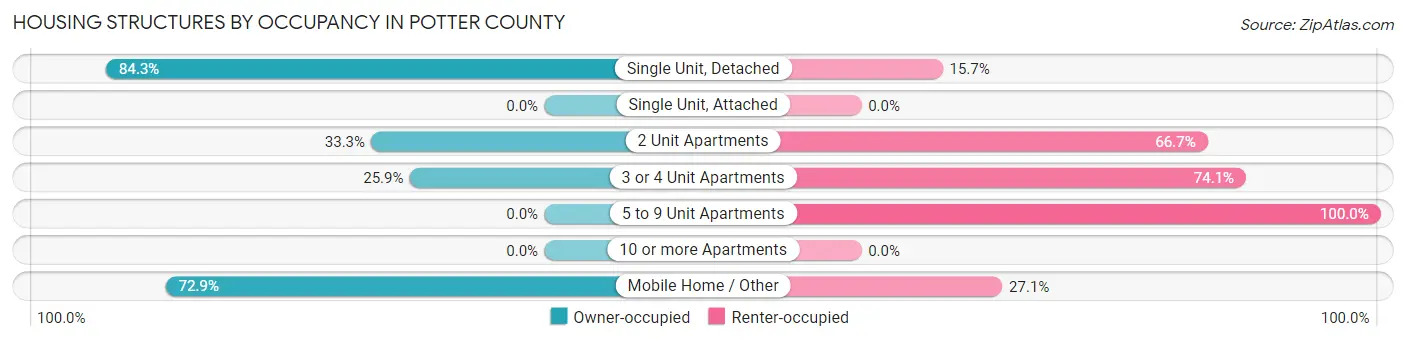
| Structure Type | Owner-occupied | Renter-occupied |
| Single Unit, Detached | 743 (84.3%) | 138 (15.7%) |
| Single Unit, Attached | 0 (0.0%) | 0 (0.0%) |
| 2 Unit Apartments | 4 (33.3%) | 8 (66.7%) |
| 3 or 4 Unit Apartments | 7 (25.9%) | 20 (74.1%) |
| 5 to 9 Unit Apartments | 0 (0.0%) | 44 (100.0%) |
| 10 or more Apartments | 0 (0.0%) | 0 (0.0%) |
| Mobile Home / Other | 51 (72.9%) | 19 (27.1%) |
| Total | 805 (77.8%) | 229 (22.2%) |
Housing Structures by Number of Rooms in Potter County
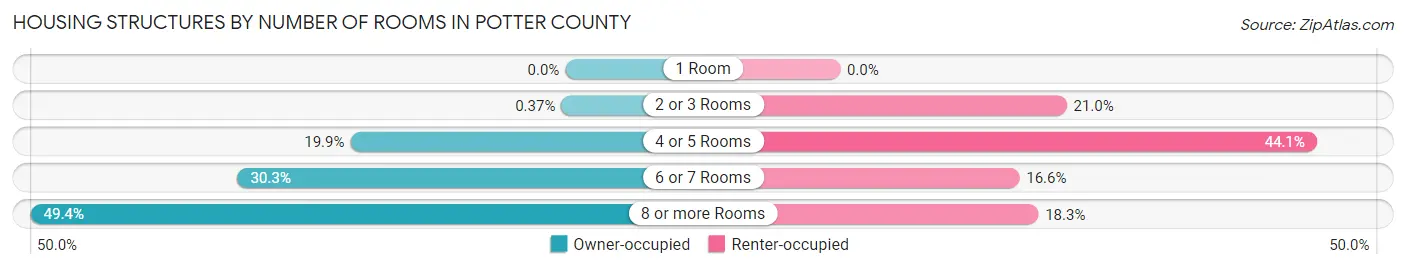
| Number of Rooms | Owner-occupied | Renter-occupied |
| 1 Room | 0 (0.0%) | 0 (0.0%) |
| 2 or 3 Rooms | 3 (0.4%) | 48 (21.0%) |
| 4 or 5 Rooms | 160 (19.9%) | 101 (44.1%) |
| 6 or 7 Rooms | 244 (30.3%) | 38 (16.6%) |
| 8 or more Rooms | 398 (49.4%) | 42 (18.3%) |
| Total | 805 (100.0%) | 229 (100.0%) |
Housing Structure by Heating Type in Potter County
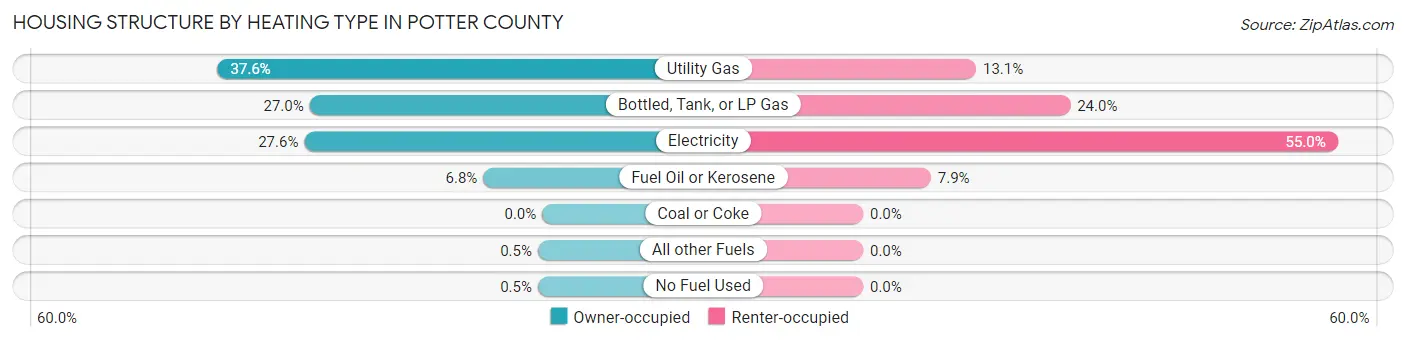
| Heating Type | Owner-occupied | Renter-occupied |
| Utility Gas | 303 (37.6%) | 30 (13.1%) |
| Bottled, Tank, or LP Gas | 217 (27.0%) | 55 (24.0%) |
| Electricity | 222 (27.6%) | 126 (55.0%) |
| Fuel Oil or Kerosene | 55 (6.8%) | 18 (7.9%) |
| Coal or Coke | 0 (0.0%) | 0 (0.0%) |
| All other Fuels | 4 (0.5%) | 0 (0.0%) |
| No Fuel Used | 4 (0.5%) | 0 (0.0%) |
| Total | 805 (100.0%) | 229 (100.0%) |
Household Vehicle Usage in Potter County
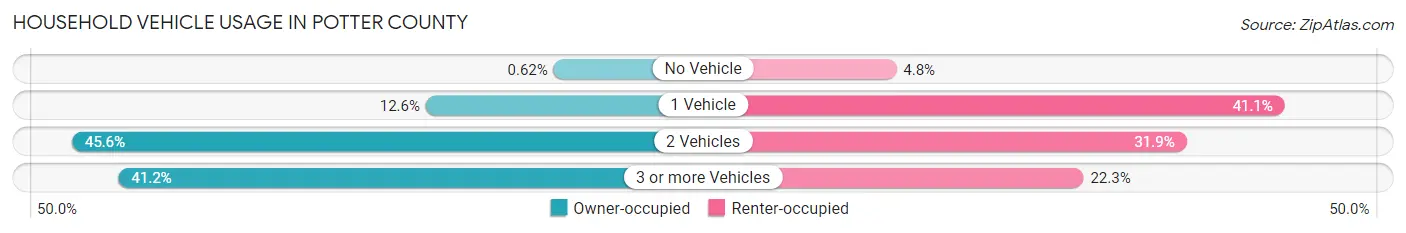
| Vehicles per Household | Owner-occupied | Renter-occupied |
| No Vehicle | 5 (0.6%) | 11 (4.8%) |
| 1 Vehicle | 101 (12.6%) | 94 (41.0%) |
| 2 Vehicles | 367 (45.6%) | 73 (31.9%) |
| 3 or more Vehicles | 332 (41.2%) | 51 (22.3%) |
| Total | 805 (100.0%) | 229 (100.0%) |
Real Estate & Mortgages in Potter County
Real Estate and Mortgage Overview in Potter County
| Characteristic | Without Mortgage | With Mortgage |
| Housing Units | 499 | 306 |
| Median Property Value | $111,200 | $180,500 |
| Median Household Income | $66,250 | $68 |
| Monthly Housing Costs | $503 | $38 |
| Real Estate Taxes | $1,482 | $5 |
Property Value by Mortgage Status in Potter County
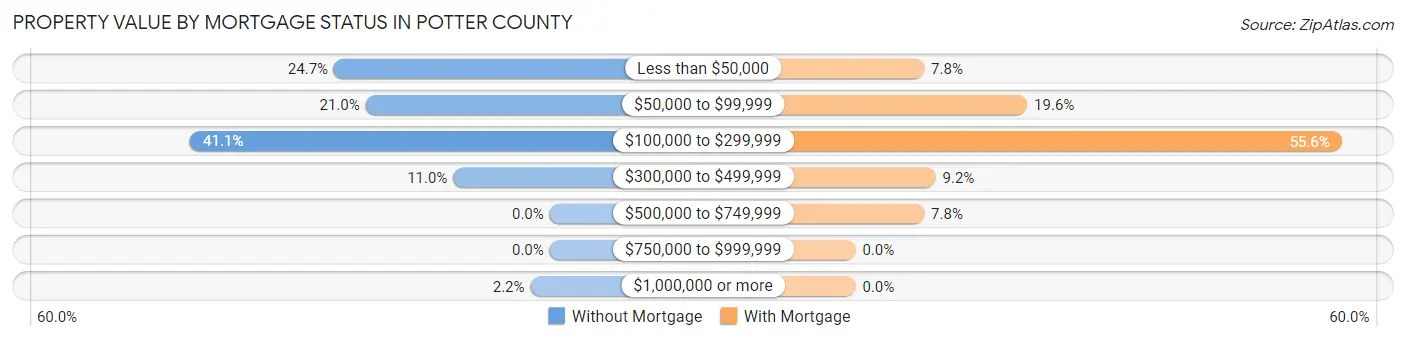
| Property Value | Without Mortgage | With Mortgage |
| Less than $50,000 | 123 (24.6%) | 24 (7.8%) |
| $50,000 to $99,999 | 105 (21.0%) | 60 (19.6%) |
| $100,000 to $299,999 | 205 (41.1%) | 170 (55.6%) |
| $300,000 to $499,999 | 55 (11.0%) | 28 (9.1%) |
| $500,000 to $749,999 | 0 (0.0%) | 24 (7.8%) |
| $750,000 to $999,999 | 0 (0.0%) | 0 (0.0%) |
| $1,000,000 or more | 11 (2.2%) | 0 (0.0%) |
| Total | 499 (100.0%) | 306 (100.0%) |
Household Income by Mortgage Status in Potter County
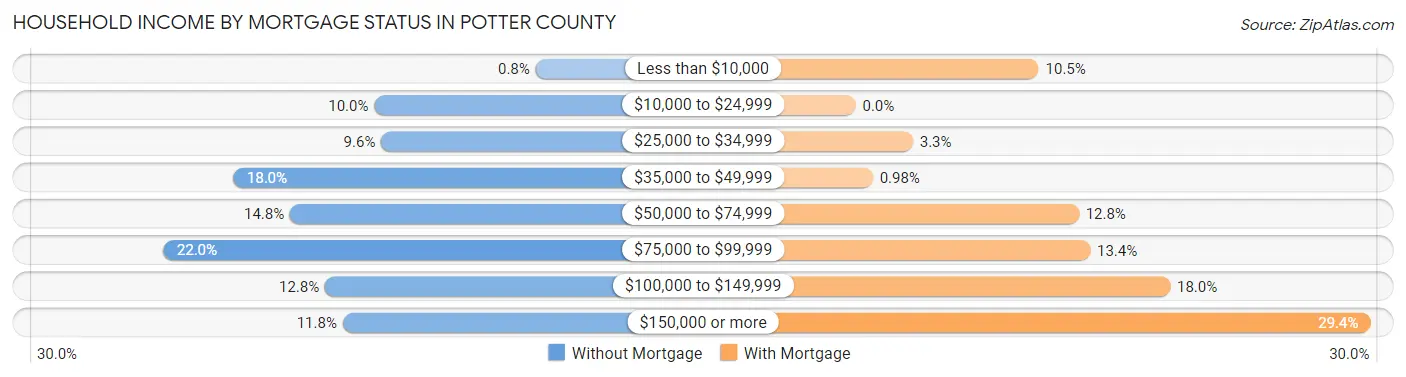
| Household Income | Without Mortgage | With Mortgage |
| Less than $10,000 | 4 (0.8%) | 32 (10.5%) |
| $10,000 to $24,999 | 50 (10.0%) | 0 (0.0%) |
| $25,000 to $34,999 | 48 (9.6%) | 10 (3.3%) |
| $35,000 to $49,999 | 90 (18.0%) | 3 (1.0%) |
| $50,000 to $74,999 | 74 (14.8%) | 39 (12.8%) |
| $75,000 to $99,999 | 110 (22.0%) | 41 (13.4%) |
| $100,000 to $149,999 | 64 (12.8%) | 55 (18.0%) |
| $150,000 or more | 59 (11.8%) | 90 (29.4%) |
| Total | 499 (100.0%) | 306 (100.0%) |
Property Value to Household Income Ratio in Potter County
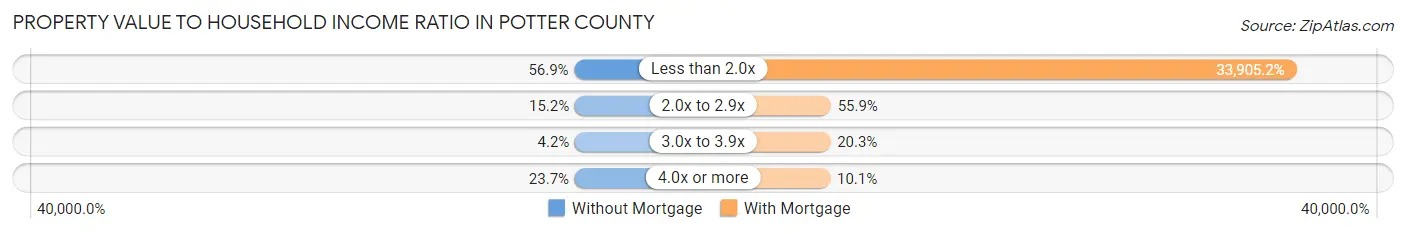
| Value-to-Income Ratio | Without Mortgage | With Mortgage |
| Less than 2.0x | 284 (56.9%) | 103,750 (33,905.2%) |
| 2.0x to 2.9x | 76 (15.2%) | 171 (55.9%) |
| 3.0x to 3.9x | 21 (4.2%) | 62 (20.3%) |
| 4.0x or more | 118 (23.6%) | 31 (10.1%) |
| Total | 499 (100.0%) | 306 (100.0%) |
Real Estate Taxes by Mortgage Status in Potter County
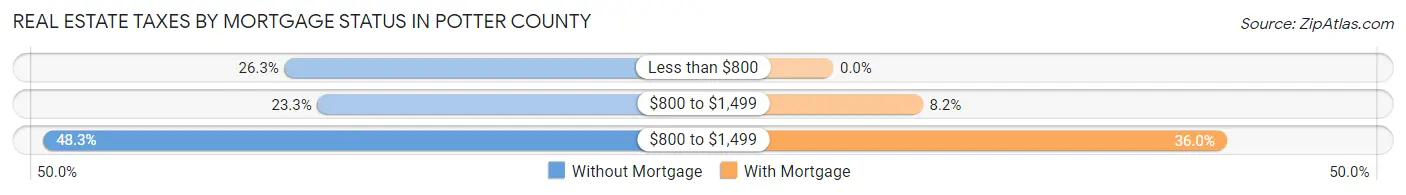
| Property Taxes | Without Mortgage | With Mortgage |
| Less than $800 | 131 (26.3%) | 0 (0.0%) |
| $800 to $1,499 | 116 (23.3%) | 25 (8.2%) |
| $800 to $1,499 | 241 (48.3%) | 110 (35.9%) |
| Total | 499 (100.0%) | 306 (100.0%) |
Health & Disability in Potter County
Health Insurance Coverage by Age in Potter County
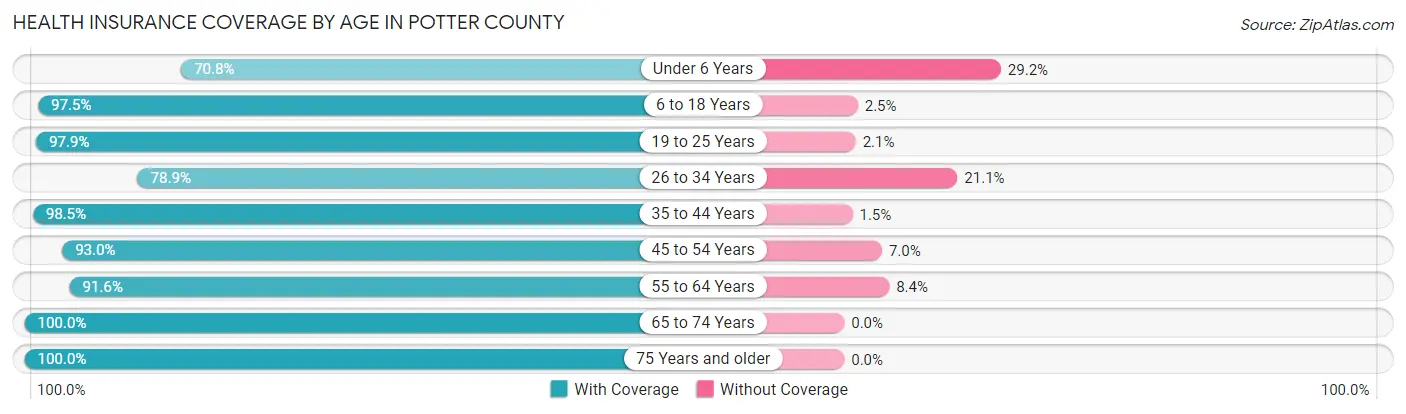
| Age Bracket | With Coverage | Without Coverage |
| Under 6 Years | 143 (70.8%) | 59 (29.2%) |
| 6 to 18 Years | 427 (97.5%) | 11 (2.5%) |
| 19 to 25 Years | 138 (97.9%) | 3 (2.1%) |
| 26 to 34 Years | 202 (78.9%) | 54 (21.1%) |
| 35 to 44 Years | 257 (98.5%) | 4 (1.5%) |
| 45 to 54 Years | 225 (93.0%) | 17 (7.0%) |
| 55 to 64 Years | 317 (91.6%) | 29 (8.4%) |
| 65 to 74 Years | 359 (100.0%) | 0 (0.0%) |
| 75 Years and older | 264 (100.0%) | 0 (0.0%) |
| Total | 2,332 (92.9%) | 177 (7.0%) |
Health Insurance Coverage by Citizenship Status in Potter County

| Citizenship Status | With Coverage | Without Coverage |
| Native Born | 143 (70.8%) | 59 (29.2%) |
| Foreign Born, Citizen | 427 (97.5%) | 11 (2.5%) |
| Foreign Born, not a Citizen | 138 (97.9%) | 3 (2.1%) |
Health Insurance Coverage by Household Income in Potter County
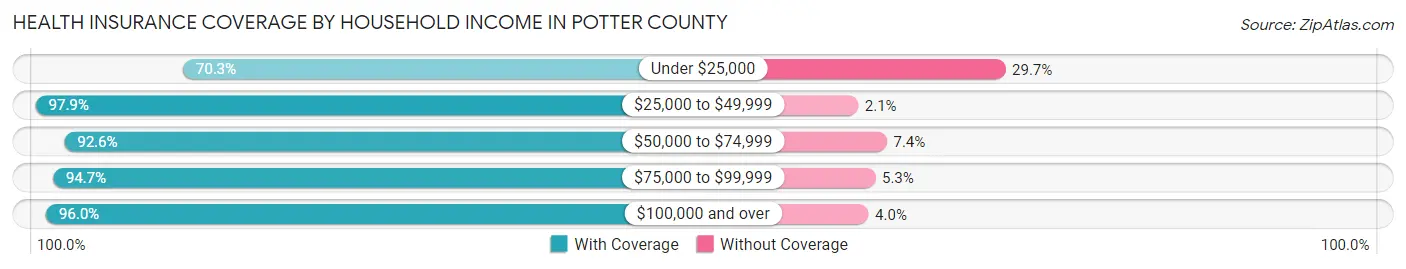
| Household Income | With Coverage | Without Coverage |
| Under $25,000 | 185 (70.3%) | 78 (29.7%) |
| $25,000 to $49,999 | 425 (97.9%) | 9 (2.1%) |
| $50,000 to $74,999 | 286 (92.6%) | 23 (7.4%) |
| $75,000 to $99,999 | 501 (94.7%) | 28 (5.3%) |
| $100,000 and over | 935 (96.0%) | 39 (4.0%) |
Public vs Private Health Insurance Coverage by Age in Potter County
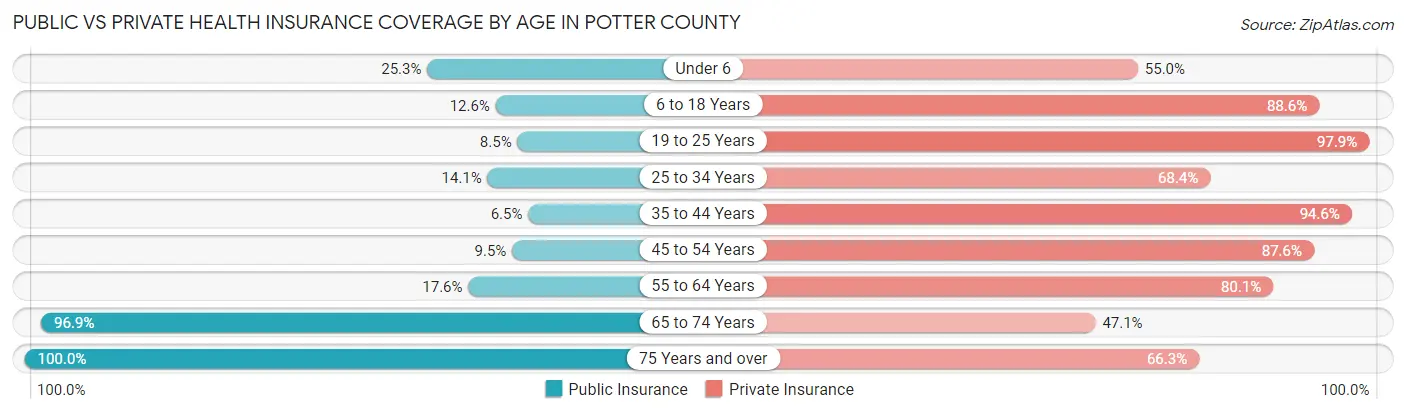
| Age Bracket | Public Insurance | Private Insurance |
| Under 6 | 51 (25.3%) | 111 (54.9%) |
| 6 to 18 Years | 55 (12.6%) | 388 (88.6%) |
| 19 to 25 Years | 12 (8.5%) | 138 (97.9%) |
| 25 to 34 Years | 36 (14.1%) | 175 (68.4%) |
| 35 to 44 Years | 17 (6.5%) | 247 (94.6%) |
| 45 to 54 Years | 23 (9.5%) | 212 (87.6%) |
| 55 to 64 Years | 61 (17.6%) | 277 (80.1%) |
| 65 to 74 Years | 348 (96.9%) | 169 (47.1%) |
| 75 Years and over | 264 (100.0%) | 175 (66.3%) |
| Total | 867 (34.6%) | 1,892 (75.4%) |
Disability Status by Sex by Age in Potter County
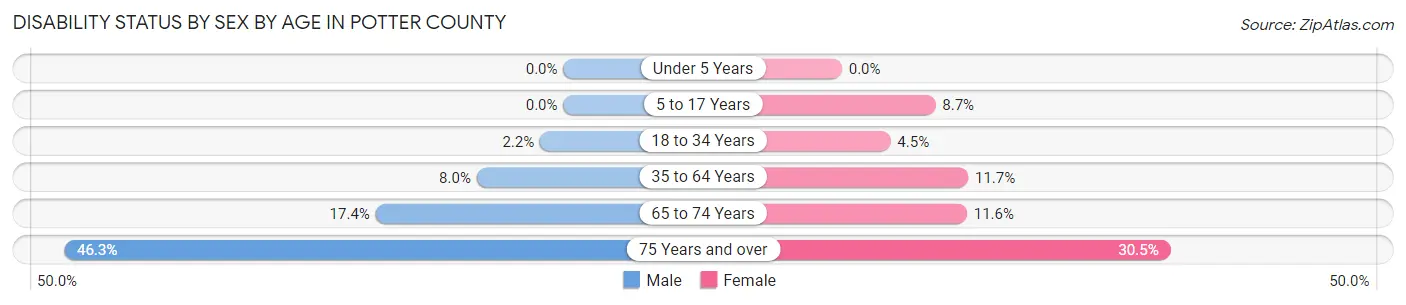
| Age Bracket | Male | Female |
| Under 5 Years | 0 (0.0%) | 0 (0.0%) |
| 5 to 17 Years | 0 (0.0%) | 19 (8.7%) |
| 18 to 34 Years | 4 (2.2%) | 12 (4.5%) |
| 35 to 64 Years | 36 (8.0%) | 47 (11.7%) |
| 65 to 74 Years | 31 (17.4%) | 21 (11.6%) |
| 75 Years and over | 57 (46.3%) | 43 (30.5%) |
Disability Class by Sex by Age in Potter County
Disability Class: Hearing Difficulty
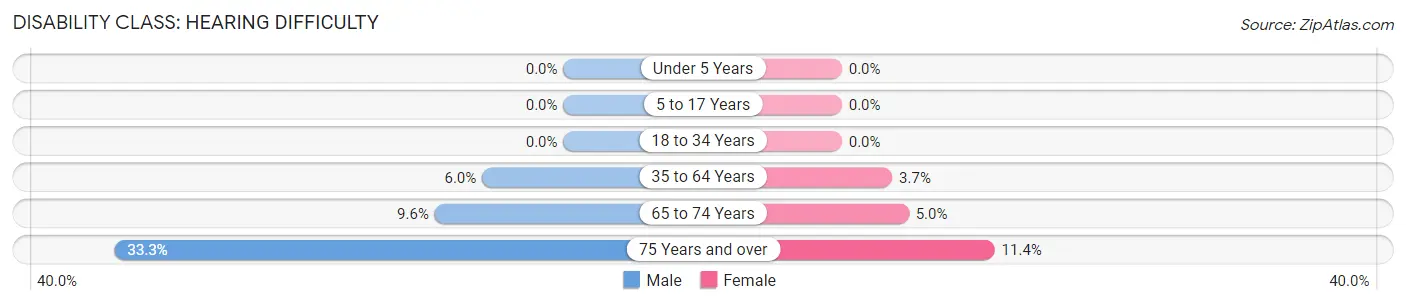
| Age Bracket | Male | Female |
| Under 5 Years | 0 (0.0%) | 0 (0.0%) |
| 5 to 17 Years | 0 (0.0%) | 0 (0.0%) |
| 18 to 34 Years | 0 (0.0%) | 0 (0.0%) |
| 35 to 64 Years | 27 (6.0%) | 15 (3.7%) |
| 65 to 74 Years | 17 (9.6%) | 9 (5.0%) |
| 75 Years and over | 41 (33.3%) | 16 (11.4%) |
Disability Class: Vision Difficulty
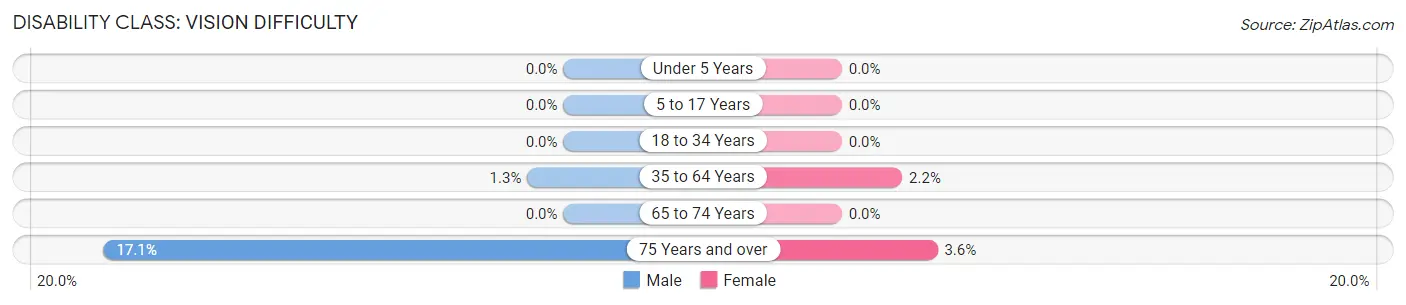
| Age Bracket | Male | Female |
| Under 5 Years | 0 (0.0%) | 0 (0.0%) |
| 5 to 17 Years | 0 (0.0%) | 0 (0.0%) |
| 18 to 34 Years | 0 (0.0%) | 0 (0.0%) |
| 35 to 64 Years | 6 (1.3%) | 9 (2.2%) |
| 65 to 74 Years | 0 (0.0%) | 0 (0.0%) |
| 75 Years and over | 21 (17.1%) | 5 (3.5%) |
Disability Class: Cognitive Difficulty
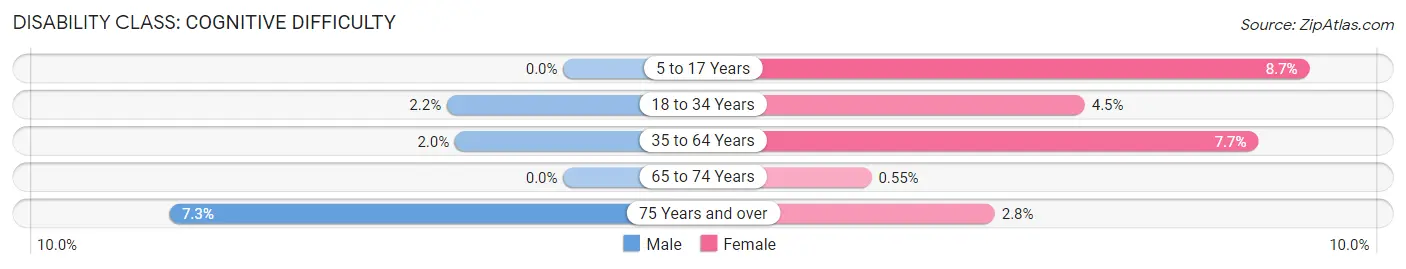
| Age Bracket | Male | Female |
| 5 to 17 Years | 0 (0.0%) | 19 (8.7%) |
| 18 to 34 Years | 4 (2.2%) | 12 (4.5%) |
| 35 to 64 Years | 9 (2.0%) | 31 (7.7%) |
| 65 to 74 Years | 0 (0.0%) | 1 (0.5%) |
| 75 Years and over | 9 (7.3%) | 4 (2.8%) |
Disability Class: Ambulatory Difficulty
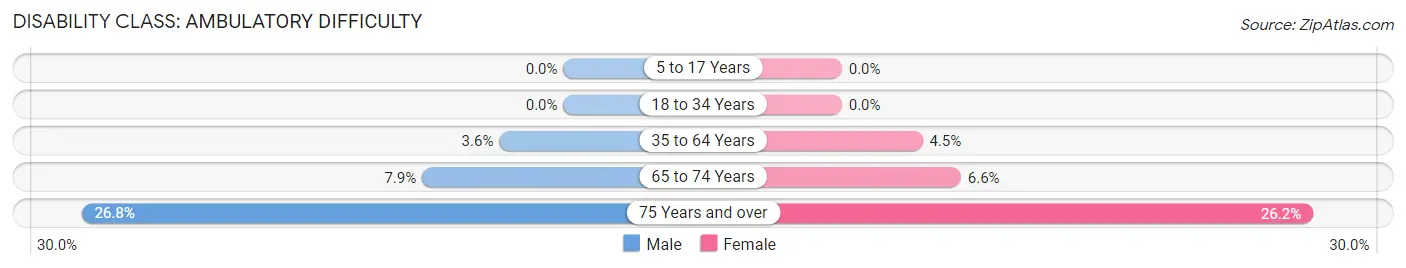
| Age Bracket | Male | Female |
| 5 to 17 Years | 0 (0.0%) | 0 (0.0%) |
| 18 to 34 Years | 0 (0.0%) | 0 (0.0%) |
| 35 to 64 Years | 16 (3.6%) | 18 (4.5%) |
| 65 to 74 Years | 14 (7.9%) | 12 (6.6%) |
| 75 Years and over | 33 (26.8%) | 37 (26.2%) |
Disability Class: Self-Care Difficulty
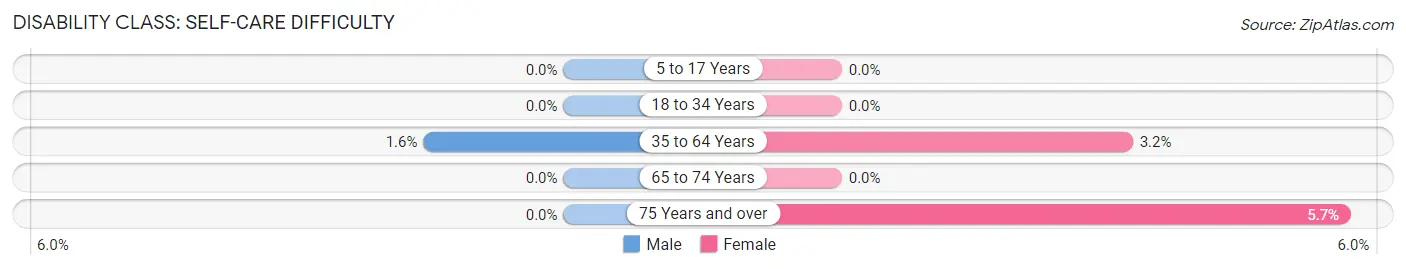
| Age Bracket | Male | Female |
| 5 to 17 Years | 0 (0.0%) | 0 (0.0%) |
| 18 to 34 Years | 0 (0.0%) | 0 (0.0%) |
| 35 to 64 Years | 7 (1.6%) | 13 (3.2%) |
| 65 to 74 Years | 0 (0.0%) | 0 (0.0%) |
| 75 Years and over | 0 (0.0%) | 8 (5.7%) |
Technology Access in Potter County
Computing Device Access in Potter County

| Device Type | # Households | % Households |
| Desktop or Laptop | 805 | 77.8% |
| Smartphone | 885 | 85.6% |
| Tablet | 675 | 65.3% |
| No Computing Device | 43 | 4.2% |
| Total | 1,034 | 100.0% |
Internet Access in Potter County
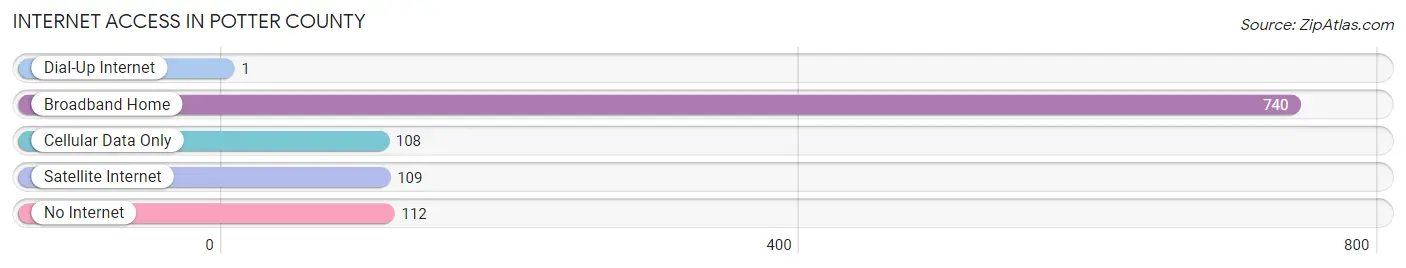
| Internet Type | # Households | % Households |
| Dial-Up Internet | 1 | 0.1% |
| Broadband Home | 740 | 71.6% |
| Cellular Data Only | 108 | 10.4% |
| Satellite Internet | 109 | 10.5% |
| No Internet | 112 | 10.8% |
| Total | 1,034 | 100.0% |
Potter County Summary
Potter County is located in the northeastern corner of South Dakota, and is bordered by the states of North Dakota and Minnesota. It is the second-smallest county in the state, with an area of only 544 square miles. Potter County is part of the Red River Valley region, and is home to a variety of natural features, including the Sheyenne River, the Red River, and the Turtle Mountains.
History
Potter County was established in 1873, and was named after James Potter, a prominent politician in the area. The county was originally part of the Dakota Territory, and was part of the original land grant given to the Sioux Nation in 1868. The county was organized in 1883, and the first county seat was located in the town of Sanborn. The county seat was moved to the town of Potter in 1887.
Geography
Potter County is located in the northeastern corner of South Dakota, and is bordered by the states of North Dakota and Minnesota. It is the second-smallest county in the state, with an area of only 544 square miles. Potter County is part of the Red River Valley region, and is home to a variety of natural features, including the Sheyenne River, the Red River, and the Turtle Mountains. The county is mostly rural, with the majority of the population living in small towns and rural areas.
Economy
The economy of Potter County is largely based on agriculture. The county is home to a variety of crops, including wheat, corn, soybeans, and sunflowers. Livestock production is also an important part of the local economy, with cattle, hogs, and sheep being raised in the area. The county is also home to a variety of manufacturing and service industries, including food processing, construction, and health care.
Demographics
As of the 2010 census, Potter County had a population of 3,845. The population is spread out across the county, with the majority of the population living in small towns and rural areas. The racial makeup of the county is 97.3% White, 0.3% African American, 0.3% Native American, 0.2% Asian, 0.1% Pacific Islander, 0.7% from other races, and 1.1% from two or more races. The median household income in the county is $41,945, and the median family income is $50,938. The per capita income in the county is $20,845.
Potter County is a rural county with a rich history and a diverse economy. The county is home to a variety of natural features, and is a popular destination for outdoor recreation. The county is also home to a variety of industries, including agriculture, manufacturing, and services. The population of the county is diverse, and the median household income is slightly above the state average. Potter County is a great place to live, work, and play.
Common Questions
What is the Total Population of Potter County?
Total Population of Potter County is 2,587.
What is the Total Male Population of Potter County?
Total Male Population of Potter County is 1,264.
What is the Total Female Population of Potter County?
Total Female Population of Potter County is 1,323.
What is the Ratio of Males per 100 Females in Potter County?
There are 95.54 Males per 100 Females in Potter County.
What is the Ratio of Females per 100 Males in Potter County?
There are 104.67 Females per 100 Males in Potter County.
What is the Median Population Age in Potter County?
Median Population Age in Potter County is 44.7 Years.
What is the Average Family Size in Potter County
Average Family Size in Potter County is 3.1 People.
What is the Average Household Size in Potter County
Average Household Size in Potter County is 2.4 People.
What is Per Capita Income in Potter County?
Per Capita income in Potter County is $34,335.
What is the Median Family Income in Potter County?
Median Family Income in Potter County is $89,750.
What is the Median Household income in Potter County?
Median Household Income in Potter County is $71,786.
What is Income or Wage Gap in Potter County?
Income or Wage Gap in Potter County is 47.7%.
Women in Potter County earn 52.3 cents for every dollar earned by a man.
What is Inequality or Gini Index in Potter County?
Inequality or Gini Index in Potter County is 0.39.
How Large is the Labor Force in Potter County?
There are 1,263 People in the Labor Forcein in Potter County.
What is the Percentage of People in the Labor Force in Potter County?
61.7% of People are in the Labor Force in Potter County.
What is the Unemployment Rate in Potter County?
Unemployment Rate in Potter County is 2.8%.