Perkins County, SD
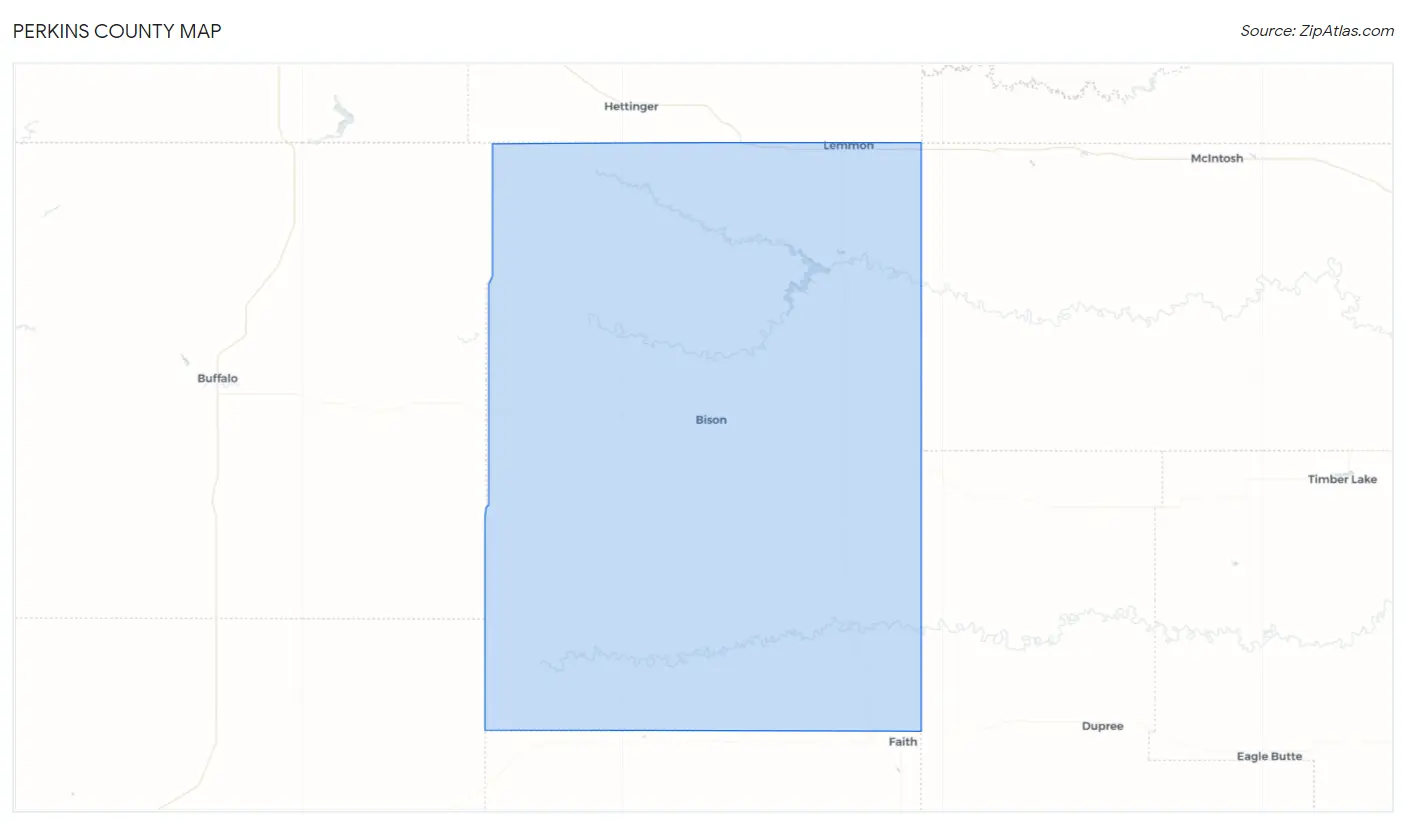
Perkins County Map
Perkins County Overview
2,970
TOTAL POPULATION
1,492
MALE POPULATION
1,478
FEMALE POPULATION
100.95
MALES / 100 FEMALES
99.06
FEMALES / 100 MALES
45.4
MEDIAN AGE
2.9
AVG FAMILY SIZE
2.3
AVG HOUSEHOLD SIZE
$40,235
PER CAPITA INCOME
$80,263
AVG FAMILY INCOME
$64,410
AVG HOUSEHOLD INCOME
39.8%
WAGE / INCOME GAP [ % ]
60.2¢/ $1
WAGE / INCOME GAP [ $ ]
0.50
INEQUALITY / GINI INDEX
1,650
LABOR FORCE [ PEOPLE ]
69.4%
PERCENT IN LABOR FORCE
4.2%
UNEMPLOYMENT RATE
Perkins County Area Codes
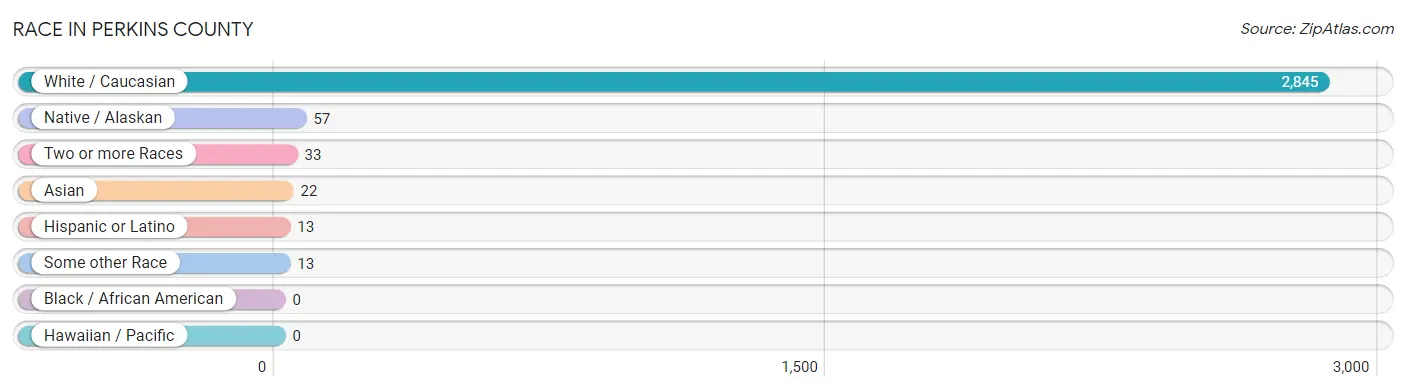
Race in Perkins County
The most populous races in Perkins County are White / Caucasian (2,845 | 95.8%), Native / Alaskan (57 | 1.9%), and Two or more Races (33 | 1.1%).
| Race | # Population | % Population |
| Asian | 22 | 0.7% |
| Black / African American | 0 | 0.0% |
| Hawaiian / Pacific | 0 | 0.0% |
| Hispanic or Latino | 13 | 0.4% |
| Native / Alaskan | 57 | 1.9% |
| White / Caucasian | 2,845 | 95.8% |
| Two or more Races | 33 | 1.1% |
| Some other Race | 13 | 0.4% |
| Total | 2,970 | 100.0% |
Ancestry in Perkins County
The most populous ancestries reported in Perkins County are German (1,310 | 44.1%), Norwegian (750 | 25.3%), Irish (337 | 11.4%), American (295 | 9.9%), and English (211 | 7.1%), together accounting for 97.7% of all Perkins County residents.

| Ancestry | # Population | % Population |
| American | 295 | 9.9% |
| Austrian | 1 | 0.0% |
| British | 4 | 0.1% |
| Canadian | 5 | 0.2% |
| Czech | 38 | 1.3% |
| Danish | 30 | 1.0% |
| Dutch | 26 | 0.9% |
| English | 211 | 7.1% |
| Estonian | 2 | 0.1% |
| European | 7 | 0.2% |
| Finnish | 4 | 0.1% |
| French | 43 | 1.5% |
| French Canadian | 3 | 0.1% |
| German | 1,310 | 44.1% |
| Greek | 1 | 0.0% |
| Hungarian | 5 | 0.2% |
| Irish | 337 | 11.4% |
| Italian | 56 | 1.9% |
| Korean | 27 | 0.9% |
| Mexican | 13 | 0.4% |
| Native Hawaiian | 5 | 0.2% |
| Norwegian | 750 | 25.3% |
| Polish | 3 | 0.1% |
| Romanian | 3 | 0.1% |
| Russian | 40 | 1.3% |
| Scandinavian | 2 | 0.1% |
| Scotch-Irish | 46 | 1.5% |
| Scottish | 50 | 1.7% |
| Serbian | 5 | 0.2% |
| Sioux | 42 | 1.4% |
| Swedish | 61 | 2.1% |
| Swiss | 33 | 1.1% |
| Welsh | 51 | 1.7% | View All 33 Rows |
Immigrants in Perkins County
The most numerous immigrant groups reported in Perkins County came from Asia (22 | 0.7%), Philippines (22 | 0.7%), South Eastern Asia (22 | 0.7%), Europe (10 | 0.3%), and Germany (10 | 0.3%), together accounting for 2.9% of all Perkins County residents.

| Immigration Origin | # Population | % Population |
| Asia | 22 | 0.7% |
| Canada | 3 | 0.1% |
| Central America | 5 | 0.2% |
| Europe | 10 | 0.3% |
| Germany | 10 | 0.3% |
| Latin America | 5 | 0.2% |
| Mexico | 5 | 0.2% |
| Philippines | 22 | 0.7% |
| South Eastern Asia | 22 | 0.7% |
| Western Europe | 10 | 0.3% | View All 10 Rows |
Sex and Age in Perkins County
Sex and Age in Perkins County
The most populous age groups in Perkins County are 70 to 74 Years (115 | 7.7%) for men and 55 to 59 Years (137 | 9.3%) for women.

| Age Bracket | Male | Female |
| Under 5 Years | 105 (7.0%) | 87 (5.9%) |
| 5 to 9 Years | 75 (5.0%) | 103 (7.0%) |
| 10 to 14 Years | 93 (6.2%) | 105 (7.1%) |
| 15 to 19 Years | 61 (4.1%) | 122 (8.3%) |
| 20 to 24 Years | 98 (6.6%) | 20 (1.3%) |
| 25 to 29 Years | 78 (5.2%) | 57 (3.9%) |
| 30 to 34 Years | 56 (3.7%) | 55 (3.7%) |
| 35 to 39 Years | 102 (6.8%) | 107 (7.2%) |
| 40 to 44 Years | 72 (4.8%) | 75 (5.1%) |
| 45 to 49 Years | 82 (5.5%) | 93 (6.3%) |
| 50 to 54 Years | 77 (5.2%) | 86 (5.8%) |
| 55 to 59 Years | 95 (6.4%) | 137 (9.3%) |
| 60 to 64 Years | 113 (7.6%) | 51 (3.5%) |
| 65 to 69 Years | 77 (5.2%) | 98 (6.6%) |
| 70 to 74 Years | 115 (7.7%) | 69 (4.7%) |
| 75 to 79 Years | 55 (3.7%) | 83 (5.6%) |
| 80 to 84 Years | 37 (2.5%) | 40 (2.7%) |
| 85 Years and over | 101 (6.8%) | 90 (6.1%) |
| Total | 1,492 (100.0%) | 1,478 (100.0%) |
Families and Households in Perkins County
Median Family Size in Perkins County
The median family size in Perkins County is 2.88 persons per family, with married-couple families (694 | 82.6%) accounting for the largest median family size of 2.95 persons per family. On the other hand, single female/mother families (121 | 14.4%) represent the smallest median family size with 2.48 persons per family.

| Family Type | # Families | Family Size |
| Married-Couple | 694 (82.6%) | 2.95 |
| Single Male/Father | 25 (3.0%) | 2.84 |
| Single Female/Mother | 121 (14.4%) | 2.48 |
| Total Families | 840 (100.0%) | 2.88 |
Median Household Size in Perkins County
The median household size in Perkins County is 2.33 persons per household, with single male/father households (25 | 2.0%) accounting for the largest median household size of 3.24 persons per household. non-family households (397 | 32.1%) represent the smallest median household size with 1.08 persons per household.

| Household Type | # Households | Household Size |
| Married-Couple | 694 (56.1%) | 2.95 |
| Single Male/Father | 25 (2.0%) | 3.24 |
| Single Female/Mother | 121 (9.8%) | 2.68 |
| Non-family | 397 (32.1%) | 1.08 |
| Total Households | 1,237 (100.0%) | 2.33 |
Household Size by Marriage Status in Perkins County
Out of a total of 1,237 households in Perkins County, 840 (67.9%) are family households, while 397 (32.1%) are nonfamily households. The most numerous type of family households are 2-person households, comprising 487, and the most common type of nonfamily households are 1-person households, comprising 354.

| Household Size | Family Households | Nonfamily Households |
| 1-Person Households | - | 354 (28.6%) |
| 2-Person Households | 487 (39.4%) | 43 (3.5%) |
| 3-Person Households | 136 (11.0%) | 0 (0.0%) |
| 4-Person Households | 133 (10.7%) | 0 (0.0%) |
| 5-Person Households | 54 (4.4%) | 0 (0.0%) |
| 6-Person Households | 25 (2.0%) | 0 (0.0%) |
| 7+ Person Households | 5 (0.4%) | 0 (0.0%) |
| Total | 840 (67.9%) | 397 (32.1%) |
Female Fertility in Perkins County
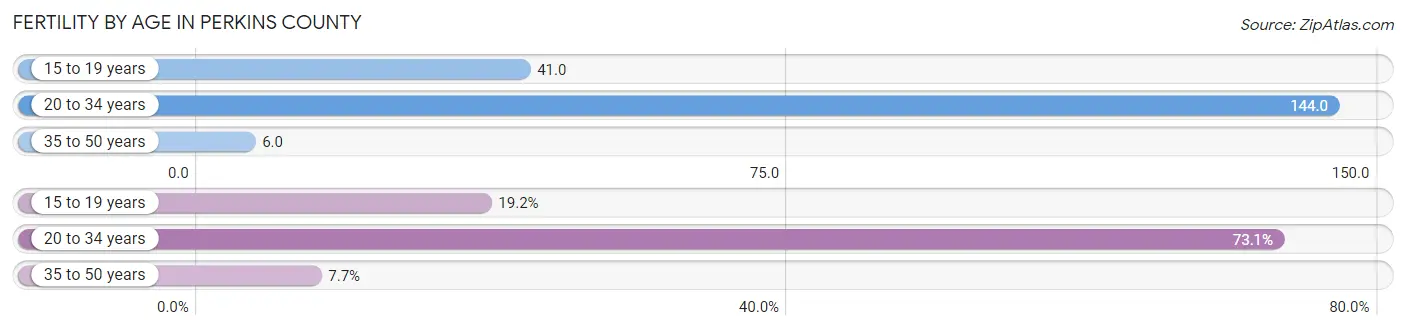
Fertility by Age in Perkins County
Average fertility rate in Perkins County is 46.0 births per 1,000 women. Women in the age bracket of 20 to 34 years have the highest fertility rate with 144.0 births per 1,000 women. Women in the age bracket of 20 to 34 years acount for 73.1% of all women with births.
| Age Bracket | Women with Births | Births / 1,000 Women |
| 15 to 19 years | 5 (19.2%) | 41.0 |
| 20 to 34 years | 19 (73.1%) | 144.0 |
| 35 to 50 years | 2 (7.7%) | 6.0 |
| Total | 26 (100.0%) | 46.0 |
Fertility by Age by Marriage Status in Perkins County
88.5% of women with births (26) in Perkins County are married. The highest percentage of unmarried women with births falls into 20 to 34 years age bracket with 15.8% of them unmarried at the time of birth, while the lowest percentage of unmarried women with births belong to 15 to 19 years age bracket with 0.0% of them unmarried.

| Age Bracket | Married | Unmarried |
| 15 to 19 years | 5 (100.0%) | 0 (0.0%) |
| 20 to 34 years | 16 (84.2%) | 3 (15.8%) |
| 35 to 50 years | 2 (100.0%) | 0 (0.0%) |
| Total | 23 (88.5%) | 3 (11.5%) |
Fertility by Education in Perkins County

| Educational Attainment | Women with Births | Births / 1,000 Women |
| Less than High School | 0 (0.0%) | 0.0 |
| High School Diploma | 17 (65.4%) | 215.0 |
| College or Associate's Degree | 1 (3.8%) | 4.0 |
| Bachelor's Degree | 8 (30.8%) | 76.0 |
| Graduate Degree | 0 (0.0%) | 0.0 |
| Total | 26 (100.0%) | 46.0 |
Fertility by Education by Marriage Status in Perkins County
11.5% of women with births in Perkins County are unmarried. Women with the educational attainment of college or associate's degree are most likely to be married with 100.0% of them married at childbirth, while women with the educational attainment of bachelor's degree are least likely to be married with 12.5% of them unmarried at childbirth.

| Educational Attainment | Married | Unmarried |
| Less than High School | 0 (0.0%) | 0 (0.0%) |
| High School Diploma | 15 (88.2%) | 2 (11.8%) |
| College or Associate's Degree | 1 (100.0%) | 0 (0.0%) |
| Bachelor's Degree | 7 (87.5%) | 1 (12.5%) |
| Graduate Degree | 0 (0.0%) | 0 (0.0%) |
| Total | 23 (88.5%) | 3 (11.5%) |
Income in Perkins County
Income Overview in Perkins County
Per Capita Income in Perkins County is $40,235, while median incomes of families and households are $80,263 and $64,410 respectively.
| Characteristic | Number | Measure |
| Per Capita Income | 2,970 | $40,235 |
| Median Family Income | 840 | $80,263 |
| Mean Family Income | 840 | $94,431 |
| Median Household Income | 1,237 | $64,410 |
| Mean Household Income | 1,237 | $92,552 |
| Income Deficit | 840 | $0 |
| Wage / Income Gap (%) | 2,970 | 39.82% |
| Wage / Income Gap ($) | 2,970 | 60.18¢ per $1 |
| Gini / Inequality Index | 2,970 | 0.50 |
Earnings by Sex in Perkins County
Average Earnings in Perkins County are $31,915, $45,000 for men and $27,083 for women, a difference of 39.8%.

| Sex | Number | Average Earnings |
| Male | 940 (54.0%) | $45,000 |
| Female | 801 (46.0%) | $27,083 |
| Total | 1,741 (100.0%) | $31,915 |
Earnings by Sex by Income Bracket in Perkins County
The most common earnings brackets in Perkins County are $75,000 to $99,999 for men (142 | 15.1%) and $2,500 to $4,999 for women (75 | 9.4%).

| Income | Male | Female |
| $2,499 or less | 36 (3.8%) | 33 (4.1%) |
| $2,500 to $4,999 | 10 (1.1%) | 75 (9.4%) |
| $5,000 to $7,499 | 63 (6.7%) | 70 (8.7%) |
| $7,500 to $9,999 | 7 (0.7%) | 44 (5.5%) |
| $10,000 to $12,499 | 39 (4.2%) | 32 (4.0%) |
| $12,500 to $14,999 | 52 (5.5%) | 27 (3.4%) |
| $15,000 to $17,499 | 59 (6.3%) | 40 (5.0%) |
| $17,500 to $19,999 | 12 (1.3%) | 29 (3.6%) |
| $20,000 to $22,499 | 13 (1.4%) | 12 (1.5%) |
| $22,500 to $24,999 | 25 (2.7%) | 26 (3.3%) |
| $25,000 to $29,999 | 62 (6.6%) | 57 (7.1%) |
| $30,000 to $34,999 | 32 (3.4%) | 71 (8.9%) |
| $35,000 to $39,999 | 8 (0.9%) | 24 (3.0%) |
| $40,000 to $44,999 | 52 (5.5%) | 61 (7.6%) |
| $45,000 to $49,999 | 33 (3.5%) | 32 (4.0%) |
| $50,000 to $54,999 | 75 (8.0%) | 26 (3.3%) |
| $55,000 to $64,999 | 54 (5.7%) | 69 (8.6%) |
| $65,000 to $74,999 | 58 (6.2%) | 26 (3.3%) |
| $75,000 to $99,999 | 142 (15.1%) | 20 (2.5%) |
| $100,000+ | 108 (11.5%) | 27 (3.4%) |
| Total | 940 (100.0%) | 801 (100.0%) |
Earnings by Sex by Educational Attainment in Perkins County
Average earnings in Perkins County are $50,598 for men and $29,702 for women, a difference of 41.3%. Men with an educational attainment of bachelor's degree enjoy the highest average annual earnings of $67,500, while those with high school diploma education earn the least with $49,250. Women with an educational attainment of graduate degree earn the most with the average annual earnings of $55,625, while those with high school diploma education have the smallest earnings of $18,750.

| Educational Attainment | Male Income | Female Income |
| Less than High School | - | - |
| High School Diploma | $49,250 | $18,750 |
| College or Associate's Degree | $50,581 | $29,526 |
| Bachelor's Degree | $67,500 | $44,271 |
| Graduate Degree | - | - |
| Total | $50,598 | $29,702 |
Family Income in Perkins County
Family Income Brackets in Perkins County
According to the Perkins County family income data, there are 199 families falling into the $100,000 to $149,999 income range, which is the most common income bracket and makes up 23.7% of all families. Conversely, the $10,000 to $14,999 income bracket is the least frequent group with only 14 families (1.7%) belonging to this category.

| Income Bracket | # Families | % Families |
| Less than $10,000 | 15 | 1.8% |
| $10,000 to $14,999 | 14 | 1.7% |
| $15,000 to $24,999 | 49 | 5.8% |
| $25,000 to $34,999 | 60 | 7.1% |
| $35,000 to $49,999 | 118 | 14.0% |
| $50,000 to $74,999 | 126 | 15.0% |
| $75,000 to $99,999 | 150 | 17.9% |
| $100,000 to $149,999 | 199 | 23.7% |
| $150,000 to $199,999 | 52 | 6.2% |
| $200,000+ | 57 | 6.8% |
Family Income by Famaliy Size in Perkins County
5-person families (51 | 6.1%) account for the highest median family income in Perkins County with $145,625 per family, while 2-person families (496 | 59.1%) have the highest median income of $35,000 per family member.

| Income Bracket | # Families | Median Income |
| 2-Person Families | 496 (59.1%) | $70,000 |
| 3-Person Families | 134 (16.0%) | $77,813 |
| 4-Person Families | 129 (15.4%) | $91,771 |
| 5-Person Families | 51 (6.1%) | $145,625 |
| 6-Person Families | 25 (3.0%) | $0 |
| 7+ Person Families | 5 (0.6%) | $0 |
| Total | 840 (100.0%) | $80,263 |
Family Income by Number of Earners in Perkins County
The median family income in Perkins County is $80,263, with families comprising 3+ earners (66) having the highest median family income of $133,750, while families with 1 earner (219) have the lowest median family income of $39,836, accounting for 7.9% and 26.1% of families, respectively.

| Number of Earners | # Families | Median Income |
| No Earners | 134 (16.0%) | $46,875 |
| 1 Earner | 219 (26.1%) | $39,836 |
| 2 Earners | 421 (50.1%) | $93,875 |
| 3+ Earners | 66 (7.9%) | $133,750 |
| Total | 840 (100.0%) | $80,263 |
Household Income in Perkins County
Household Income Brackets in Perkins County
With 210 households falling in the category, the $100,000 to $149,999 income range is the most frequent in Perkins County, accounting for 17.0% of all households. In contrast, only 43 households (3.5%) fall into the less than $10,000 income bracket, making it the least populous group.

| Income Bracket | # Households | % Households |
| Less than $10,000 | 43 | 3.5% |
| $10,000 to $14,999 | 61 | 4.9% |
| $15,000 to $24,999 | 120 | 9.7% |
| $25,000 to $34,999 | 127 | 10.3% |
| $35,000 to $49,999 | 150 | 12.1% |
| $50,000 to $74,999 | 192 | 15.5% |
| $75,000 to $99,999 | 199 | 16.1% |
| $100,000 to $149,999 | 210 | 17.0% |
| $150,000 to $199,999 | 49 | 4.0% |
| $200,000+ | 87 | 7.0% |
Household Income by Householder Age in Perkins County
The median household income in Perkins County is $64,410, with the highest median household income of $87,679 found in the 45 to 64 years age bracket for the primary householder. A total of 397 households (32.1%) fall into this category. Meanwhile, the 15 to 24 years age bracket for the primary householder has the lowest median household income of $28,750, with 50 households (4.0%) in this group.

| Income Bracket | # Households | Median Income |
| 15 to 24 Years | 50 (4.0%) | $28,750 |
| 25 to 44 Years | 303 (24.5%) | $63,125 |
| 45 to 64 Years | 397 (32.1%) | $87,679 |
| 65+ Years | 487 (39.4%) | $49,934 |
| Total | 1,237 (100.0%) | $64,410 |
Poverty in Perkins County
Income Below Poverty by Sex and Age in Perkins County
With 8.1% poverty level for males and 15.9% for females among the residents of Perkins County, 5 year old males and 5 year old females are the most vulnerable to poverty, with 6 males (25.0%) and 3 females (50.0%) in their respective age groups living below the poverty level.

| Age Bracket | Male | Female |
| Under 5 Years | 2 (1.9%) | 18 (20.7%) |
| 5 Years | 6 (25.0%) | 3 (50.0%) |
| 6 to 11 Years | 11 (12.9%) | 32 (24.6%) |
| 12 to 14 Years | 8 (13.6%) | 25 (35.7%) |
| 15 Years | 0 (0.0%) | 0 (0.0%) |
| 16 and 17 Years | 0 (0.0%) | 0 (0.0%) |
| 18 to 24 Years | 18 (14.9%) | 23 (23.7%) |
| 25 to 34 Years | 17 (12.7%) | 16 (14.3%) |
| 35 to 44 Years | 17 (9.8%) | 39 (21.4%) |
| 45 to 54 Years | 0 (0.0%) | 15 (8.5%) |
| 55 to 64 Years | 11 (5.3%) | 15 (8.1%) |
| 65 to 74 Years | 18 (9.4%) | 10 (6.1%) |
| 75 Years and over | 11 (6.2%) | 34 (17.6%) |
| Total | 119 (8.1%) | 230 (15.9%) |
Income Above Poverty by Sex and Age in Perkins County
According to the poverty statistics in Perkins County, males aged 15 years and females aged 15 years are the age groups that are most secure financially, with 100.0% of males and 100.0% of females in these age groups living above the poverty line.

| Age Bracket | Male | Female |
| Under 5 Years | 103 (98.1%) | 69 (79.3%) |
| 5 Years | 18 (75.0%) | 3 (50.0%) |
| 6 to 11 Years | 74 (87.1%) | 98 (75.4%) |
| 12 to 14 Years | 51 (86.4%) | 45 (64.3%) |
| 15 Years | 7 (100.0%) | 18 (100.0%) |
| 16 and 17 Years | 31 (100.0%) | 27 (100.0%) |
| 18 to 24 Years | 103 (85.1%) | 74 (76.3%) |
| 25 to 34 Years | 117 (87.3%) | 96 (85.7%) |
| 35 to 44 Years | 157 (90.2%) | 143 (78.6%) |
| 45 to 54 Years | 159 (100.0%) | 162 (91.5%) |
| 55 to 64 Years | 197 (94.7%) | 170 (91.9%) |
| 65 to 74 Years | 174 (90.6%) | 153 (93.9%) |
| 75 Years and over | 165 (93.8%) | 159 (82.4%) |
| Total | 1,356 (91.9%) | 1,217 (84.1%) |
Income Below Poverty Among Married-Couple Families in Perkins County
The poverty statistics for married-couple families in Perkins County show that 3.0% or 21 of the total 694 families live below the poverty line. Families with 1 or 2 children have the highest poverty rate of 4.8%, comprising of 7 families. On the other hand, families with 5 or more children have the lowest poverty rate of 0.0%, which includes 0 families.

| Children | Above Poverty | Below Poverty |
| No Children | 465 (97.3%) | 13 (2.7%) |
| 1 or 2 Children | 139 (95.2%) | 7 (4.8%) |
| 3 or 4 Children | 64 (98.5%) | 1 (1.5%) |
| 5 or more Children | 5 (100.0%) | 0 (0.0%) |
| Total | 673 (97.0%) | 21 (3.0%) |
Income Below Poverty Among Single-Parent Households in Perkins County
According to the poverty data in Perkins County, 20.0% or 5 single-father households and 37.2% or 45 single-mother households are living below the poverty line. Among single-father households, those with 1 or 2 children have the highest poverty rate, with 5 households (33.3%) experiencing poverty. Likewise, among single-mother households, those with 3 or 4 children have the highest poverty rate, with 4 households (100.0%) falling below the poverty line.

| Children | Single Father | Single Mother |
| No Children | 0 (0.0%) | 7 (43.8%) |
| 1 or 2 Children | 5 (33.3%) | 34 (33.7%) |
| 3 or 4 Children | 0 (0.0%) | 4 (100.0%) |
| 5 or more Children | 0 (0.0%) | 0 (0.0%) |
| Total | 5 (20.0%) | 45 (37.2%) |
Income Below Poverty Among Married-Couple vs Single-Parent Households in Perkins County
The poverty data for Perkins County shows that 21 of the married-couple family households (3.0%) and 50 of the single-parent households (34.3%) are living below the poverty level. Within the married-couple family households, those with 1 or 2 children have the highest poverty rate, with 7 households (4.8%) falling below the poverty line. Among the single-parent households, those with 3 or 4 children have the highest poverty rate, with 4 household (66.7%) living below poverty.

| Children | Married-Couple Families | Single-Parent Households |
| No Children | 13 (2.7%) | 7 (29.2%) |
| 1 or 2 Children | 7 (4.8%) | 39 (33.6%) |
| 3 or 4 Children | 1 (1.5%) | 4 (66.7%) |
| 5 or more Children | 0 (0.0%) | 0 (0.0%) |
| Total | 21 (3.0%) | 50 (34.3%) |
Employment Characteristics in Perkins County
Employment by Class of Employer in Perkins County
Among the 1,569 employed individuals in Perkins County, private company employees (708 | 45.1%), self-employed (not incorporated) (444 | 28.3%), and self-employed (incorporated) (154 | 9.8%) make up the most common classes of employment.

| Employer Class | # Employees | % Employees |
| Private Company Employees | 708 | 45.1% |
| Self-Employed (Incorporated) | 154 | 9.8% |
| Self-Employed (Not Incorporated) | 444 | 28.3% |
| Not-for-profit Organizations | 76 | 4.8% |
| Local Government Employees | 111 | 7.1% |
| State Government Employees | 24 | 1.5% |
| Federal Government Employees | 32 | 2.0% |
| Unpaid Family Workers | 20 | 1.3% |
| Total | 1,569 | 100.0% |
Employment Status by Age in Perkins County
According to the labor force statistics for Perkins County, out of the total population over 16 years of age (2,377), 69.4% or 1,650 individuals are in the labor force, with 4.2% or 69 of them unemployed. The age group with the highest labor force participation rate is 30 to 34 years, with 100.0% or 111 individuals in the labor force. Within the labor force, the 20 to 24 years age range has the highest percentage of unemployed individuals, with 47.7% or 52 of them being unemployed.

| Age Bracket | In Labor Force | Unemployed |
| 16 to 19 Years | 74 (46.8%) | 0 (0.0%) |
| 20 to 24 Years | 109 (92.4%) | 52 (47.7%) |
| 25 to 29 Years | 125 (92.6%) | 0 (0.0%) |
| 30 to 34 Years | 111 (100.0%) | 4 (3.6%) |
| 35 to 44 Years | 329 (92.4%) | 7 (2.1%) |
| 45 to 54 Years | 331 (97.9%) | 0 (0.0%) |
| 55 to 59 Years | 199 (85.8%) | 7 (3.5%) |
| 60 to 64 Years | 126 (76.8%) | 0 (0.0%) |
| 65 to 74 Years | 157 (43.7%) | 0 (0.0%) |
| 75 Years and over | 88 (21.7%) | 0 (0.0%) |
| Total | 1,650 (69.4%) | 69 (4.2%) |
Employment Status by Educational Attainment in Perkins County
According to labor force statistics for Perkins County, 91.4% of individuals (1,221) out of the total population between 25 and 64 years of age (1,336) are in the labor force, with 1.5% or 18 of them being unemployed. The group with the highest labor force participation rate are those with the educational attainment of bachelor's degree or higher, with 97.6% or 287 individuals in the labor force. Within the labor force, individuals with less than high school education have the highest percentage of unemployment, with 22.2% or 12 of them being unemployed.

| Educational Attainment | In Labor Force | Unemployed |
| Less than High School | 54 (94.7%) | 13 (22.2%) |
| High School Diploma | 397 (93.0%) | 6 (1.5%) |
| College / Associate Degree | 483 (86.6%) | 0 (0.0%) |
| Bachelor's Degree or higher | 287 (97.6%) | 0 (0.0%) |
| Total | 1,221 (91.4%) | 20 (1.5%) |
Employment Occupations by Sex in Perkins County
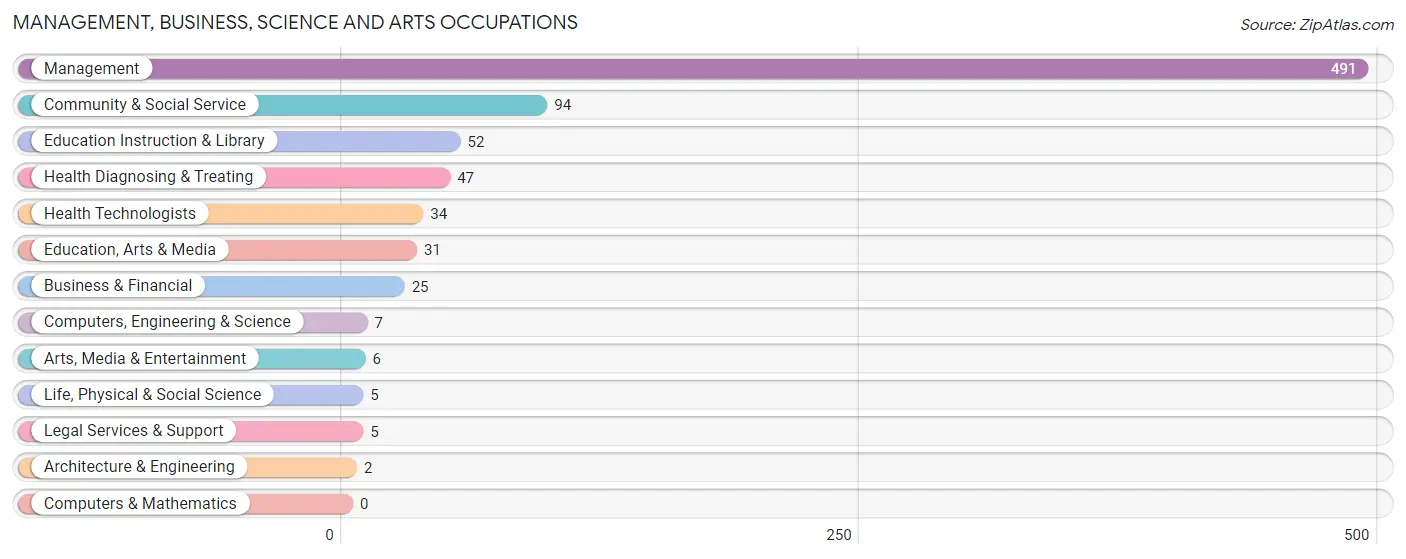
Management, Business, Science and Arts Occupations
The most common Management, Business, Science and Arts occupations in Perkins County are Management (491 | 31.1%), Community & Social Service (94 | 5.9%), Education Instruction & Library (52 | 3.3%), Health Diagnosing & Treating (47 | 3.0%), and Health Technologists (34 | 2.1%).
Management, Business, Science and Arts Occupations by Sex
Within the Management, Business, Science and Arts occupations in Perkins County, the most male-oriented occupations are Architecture & Engineering (100.0%), Computers, Engineering & Science (85.7%), and Life, Physical & Social Science (80.0%), while the most female-oriented occupations are Legal Services & Support (100.0%), Education Instruction & Library (90.4%), and Community & Social Service (84.0%).

| Occupation | Male | Female |
| Management | 387 (78.8%) | 104 (21.2%) |
| Business & Financial | 10 (40.0%) | 15 (60.0%) |
| Computers, Engineering & Science | 6 (85.7%) | 1 (14.3%) |
| Computers & Mathematics | 0 (0.0%) | 0 (0.0%) |
| Architecture & Engineering | 2 (100.0%) | 0 (0.0%) |
| Life, Physical & Social Science | 4 (80.0%) | 1 (20.0%) |
| Community & Social Service | 15 (16.0%) | 79 (84.0%) |
| Education, Arts & Media | 7 (22.6%) | 24 (77.4%) |
| Legal Services & Support | 0 (0.0%) | 5 (100.0%) |
| Education Instruction & Library | 5 (9.6%) | 47 (90.4%) |
| Arts, Media & Entertainment | 3 (50.0%) | 3 (50.0%) |
| Health Diagnosing & Treating | 10 (21.3%) | 37 (78.7%) |
| Health Technologists | 10 (29.4%) | 24 (70.6%) |
| Total (Category) | 428 (64.5%) | 236 (35.5%) |
| Total (Overall) | 825 (52.2%) | 754 (47.7%) |
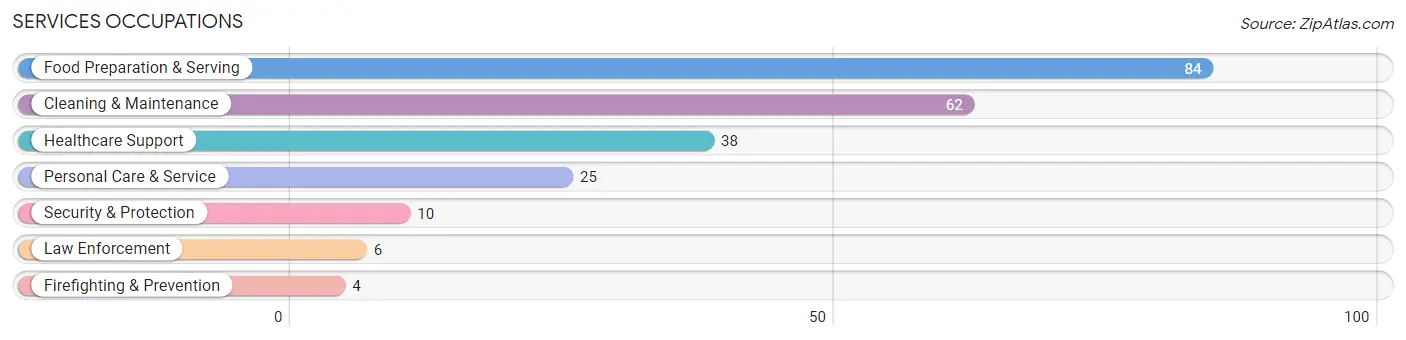
Services Occupations
The most common Services occupations in Perkins County are Food Preparation & Serving (84 | 5.3%), Cleaning & Maintenance (62 | 3.9%), Healthcare Support (38 | 2.4%), Personal Care & Service (25 | 1.6%), and Security & Protection (10 | 0.6%).
Services Occupations by Sex
Within the Services occupations in Perkins County, the most male-oriented occupations are Firefighting & Prevention (100.0%), Security & Protection (90.0%), and Law Enforcement (83.3%), while the most female-oriented occupations are Personal Care & Service (88.0%), Healthcare Support (86.8%), and Cleaning & Maintenance (72.6%).

| Occupation | Male | Female |
| Healthcare Support | 5 (13.2%) | 33 (86.8%) |
| Security & Protection | 9 (90.0%) | 1 (10.0%) |
| Firefighting & Prevention | 4 (100.0%) | 0 (0.0%) |
| Law Enforcement | 5 (83.3%) | 1 (16.7%) |
| Food Preparation & Serving | 27 (32.1%) | 57 (67.9%) |
| Cleaning & Maintenance | 17 (27.4%) | 45 (72.6%) |
| Personal Care & Service | 3 (12.0%) | 22 (88.0%) |
| Total (Category) | 61 (27.9%) | 158 (72.2%) |
| Total (Overall) | 825 (52.2%) | 754 (47.7%) |
Sales and Office Occupations
The most common Sales and Office occupations in Perkins County are Office & Administration (174 | 11.0%), and Sales & Related (93 | 5.9%).

Sales and Office Occupations by Sex

| Occupation | Male | Female |
| Sales & Related | 37 (39.8%) | 56 (60.2%) |
| Office & Administration | 16 (9.2%) | 158 (90.8%) |
| Total (Category) | 53 (19.9%) | 214 (80.1%) |
| Total (Overall) | 825 (52.2%) | 754 (47.7%) |
Natural Resources, Construction and Maintenance Occupations
The most common Natural Resources, Construction and Maintenance occupations in Perkins County are Farming, Fishing & Forestry (95 | 6.0%), Construction & Extraction (93 | 5.9%), and Installation, Maintenance & Repair (65 | 4.1%).

Natural Resources, Construction and Maintenance Occupations by Sex

| Occupation | Male | Female |
| Farming, Fishing & Forestry | 37 (39.0%) | 58 (61.1%) |
| Construction & Extraction | 87 (93.5%) | 6 (6.5%) |
| Installation, Maintenance & Repair | 59 (90.8%) | 6 (9.2%) |
| Total (Category) | 183 (72.3%) | 70 (27.7%) |
| Total (Overall) | 825 (52.2%) | 754 (47.7%) |
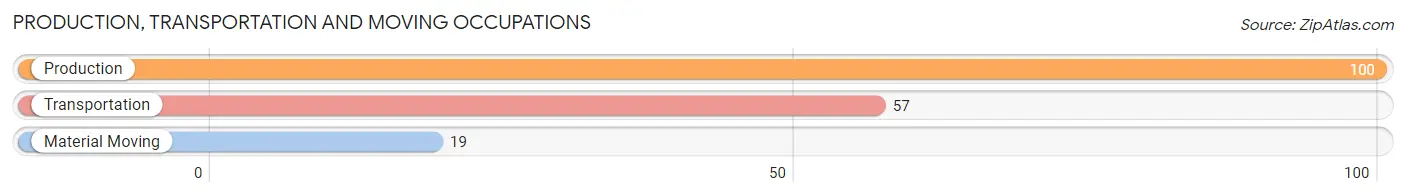
Production, Transportation and Moving Occupations
The most common Production, Transportation and Moving occupations in Perkins County are Production (100 | 6.3%), Transportation (57 | 3.6%), and Material Moving (19 | 1.2%).
Production, Transportation and Moving Occupations by Sex
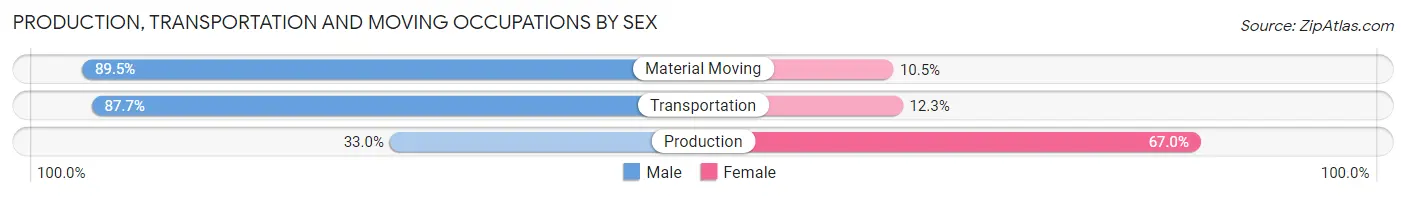
| Occupation | Male | Female |
| Production | 33 (33.0%) | 67 (67.0%) |
| Transportation | 50 (87.7%) | 7 (12.3%) |
| Material Moving | 17 (89.5%) | 2 (10.5%) |
| Total (Category) | 100 (56.8%) | 76 (43.2%) |
| Total (Overall) | 825 (52.2%) | 754 (47.7%) |
Employment Industries by Sex in Perkins County
Employment Industries in Perkins County
The major employment industries in Perkins County include Agriculture, Fishing & Hunting (494 | 31.3%), Retail Trade (175 | 11.1%), Health Care & Social Assistance (141 | 8.9%), Manufacturing (121 | 7.7%), and Construction (108 | 6.8%).

Employment Industries by Sex in Perkins County
The Perkins County industries that see more men than women are Mining, Quarrying, & Extraction (100.0%), Utilities (95.0%), and Information (82.6%), whereas the industries that tend to have a higher number of women are Arts, Entertainment & Recreation (100.0%), Educational Services (96.4%), and Accommodation & Food Services (92.5%).

| Industry | Male | Female |
| Agriculture, Fishing & Hunting | 370 (74.9%) | 124 (25.1%) |
| Mining, Quarrying, & Extraction | 14 (100.0%) | 0 (0.0%) |
| Construction | 89 (82.4%) | 19 (17.6%) |
| Manufacturing | 36 (29.7%) | 85 (70.3%) |
| Wholesale Trade | 23 (82.1%) | 5 (17.9%) |
| Retail Trade | 76 (43.4%) | 99 (56.6%) |
| Transportation & Warehousing | 51 (64.6%) | 28 (35.4%) |
| Utilities | 19 (95.0%) | 1 (5.0%) |
| Information | 19 (82.6%) | 4 (17.4%) |
| Finance & Insurance | 8 (16.7%) | 40 (83.3%) |
| Real Estate, Rental & Leasing | 2 (50.0%) | 2 (50.0%) |
| Professional & Scientific | 6 (20.7%) | 23 (79.3%) |
| Enterprise Management | 0 (0.0%) | 0 (0.0%) |
| Administrative & Support | 3 (12.5%) | 21 (87.5%) |
| Educational Services | 3 (3.6%) | 80 (96.4%) |
| Health Care & Social Assistance | 36 (25.5%) | 105 (74.5%) |
| Arts, Entertainment & Recreation | 0 (0.0%) | 2 (100.0%) |
| Accommodation & Food Services | 5 (7.5%) | 62 (92.5%) |
| Public Administration | 17 (43.6%) | 22 (56.4%) |
| Total | 825 (52.2%) | 754 (47.7%) |
Education in Perkins County
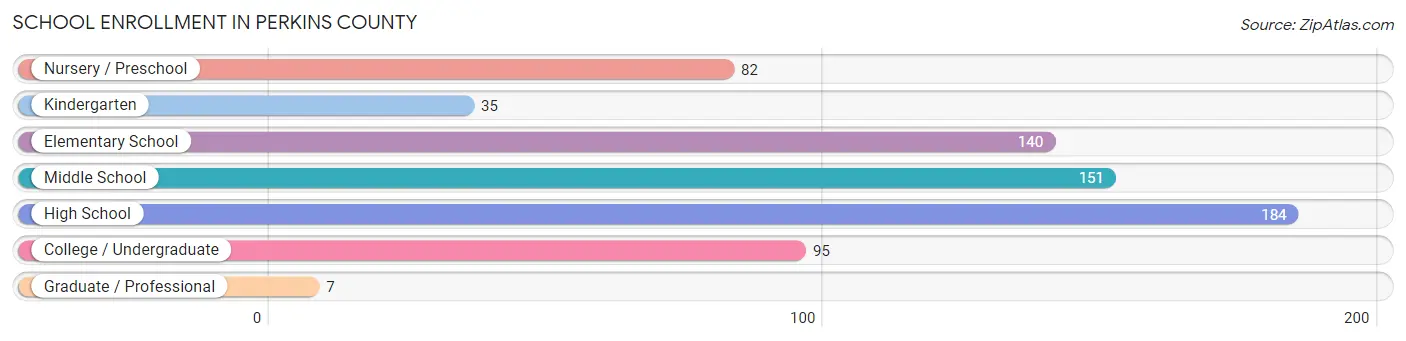
School Enrollment in Perkins County
The most common levels of schooling among the 694 students in Perkins County are high school (184 | 26.5%), middle school (151 | 21.8%), and elementary school (140 | 20.2%).
| School Level | # Students | % Students |
| Nursery / Preschool | 82 | 11.8% |
| Kindergarten | 35 | 5.0% |
| Elementary School | 140 | 20.2% |
| Middle School | 151 | 21.8% |
| High School | 184 | 26.5% |
| College / Undergraduate | 95 | 13.7% |
| Graduate / Professional | 7 | 1.0% |
| Total | 694 | 100.0% |
School Enrollment by Age by Funding Source in Perkins County
Out of a total of 694 students who are enrolled in schools in Perkins County, 81 (11.7%) attend a private institution, while the remaining 613 (88.3%) are enrolled in public schools. The age group of 25 to 34 year olds has the highest likelihood of being enrolled in private schools, with 5 (83.3% in the age bracket) enrolled. Conversely, the age group of 18 to 19 year olds has the lowest likelihood of being enrolled in a private school, with 95 (100.0% in the age bracket) attending a public institution.

| Age Bracket | Public School | Private School |
| 3 to 4 Year Olds | 37 (67.3%) | 18 (32.7%) |
| 5 to 9 Year Old | 149 (83.7%) | 29 (16.3%) |
| 10 to 14 Year Olds | 194 (98.0%) | 4 (2.0%) |
| 15 to 17 Year Olds | 82 (98.8%) | 1 (1.2%) |
| 18 to 19 Year Olds | 95 (100.0%) | 0 (0.0%) |
| 20 to 24 Year Olds | 36 (83.7%) | 7 (16.3%) |
| 25 to 34 Year Olds | 1 (16.7%) | 5 (83.3%) |
| 35 Years and over | 19 (52.8%) | 17 (47.2%) |
| Total | 613 (88.3%) | 81 (11.7%) |
Educational Attainment by Field of Study in Perkins County
Education (176 | 38.9%), business (65 | 14.3%), bio, nature & agricultural (40 | 8.8%), engineering (40 | 8.8%), and arts & humanities (35 | 7.7%) are the most common fields of study among 453 individuals in Perkins County who have obtained a bachelor's degree or higher.

| Field of Study | # Graduates | % Graduates |
| Computers & Mathematics | 5 | 1.1% |
| Bio, Nature & Agricultural | 40 | 8.8% |
| Physical & Health Sciences | 19 | 4.2% |
| Psychology | 16 | 3.5% |
| Social Sciences | 8 | 1.8% |
| Engineering | 40 | 8.8% |
| Multidisciplinary Studies | 7 | 1.5% |
| Science & Technology | 18 | 4.0% |
| Business | 65 | 14.3% |
| Education | 176 | 38.9% |
| Literature & Languages | 4 | 0.9% |
| Liberal Arts & History | 5 | 1.1% |
| Visual & Performing Arts | 2 | 0.4% |
| Communications | 13 | 2.9% |
| Arts & Humanities | 35 | 7.7% |
| Total | 453 | 100.0% |
Transportation & Commute in Perkins County
Vehicle Availability by Sex in Perkins County
The most prevalent vehicle ownership categories in Perkins County are males with 2 vehicles (294, accounting for 36.3%) and females with 2 vehicles (259, making up 39.7%).
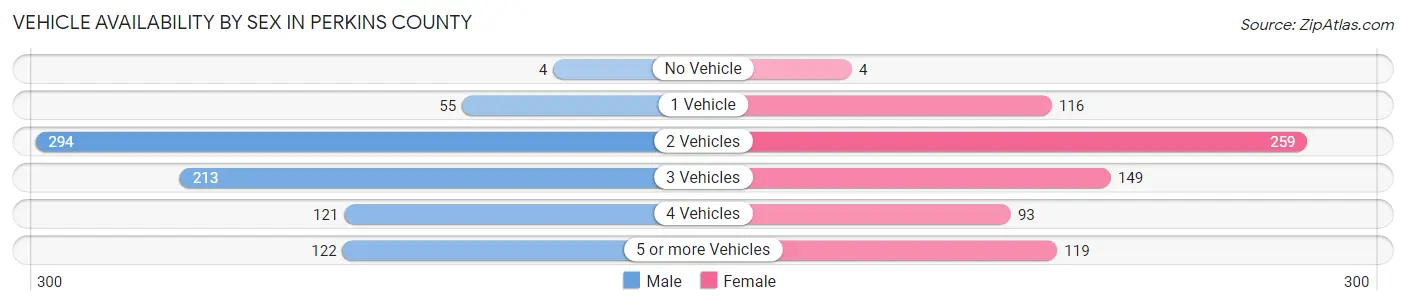
| Vehicles Available | Male | Female |
| No Vehicle | 4 (0.5%) | 4 (0.5%) |
| 1 Vehicle | 55 (6.8%) | 116 (15.7%) |
| 2 Vehicles | 294 (36.3%) | 259 (35.0%) |
| 3 Vehicles | 213 (26.3%) | 149 (20.1%) |
| 4 Vehicles | 121 (15.0%) | 93 (12.6%) |
| 5 or more Vehicles | 122 (15.1%) | 119 (16.1%) |
| Total | 809 (100.0%) | 740 (100.0%) |
Commute Time in Perkins County
The most frequently occuring commute durations in Perkins County are 10 to 14 minutes (286 commuters, 26.2%), 5 to 9 minutes (278 commuters, 25.5%), and less than 5 minutes (201 commuters, 18.4%).

| Commute Time | # Commuters | % Commuters |
| Less than 5 Minutes | 201 | 18.4% |
| 5 to 9 Minutes | 278 | 25.5% |
| 10 to 14 Minutes | 286 | 26.2% |
| 15 to 19 Minutes | 77 | 7.1% |
| 20 to 24 Minutes | 66 | 6.1% |
| 25 to 29 Minutes | 45 | 4.1% |
| 30 to 34 Minutes | 19 | 1.7% |
| 35 to 39 Minutes | 4 | 0.4% |
| 40 to 44 Minutes | 27 | 2.5% |
| 45 to 59 Minutes | 28 | 2.6% |
| 60 to 89 Minutes | 16 | 1.5% |
| 90 or more Minutes | 43 | 3.9% |
Commute Time by Sex in Perkins County
The most common commute times in Perkins County are 5 to 9 minutes (142 commuters, 27.0%) for males and 10 to 14 minutes (204 commuters, 36.2%) for females.
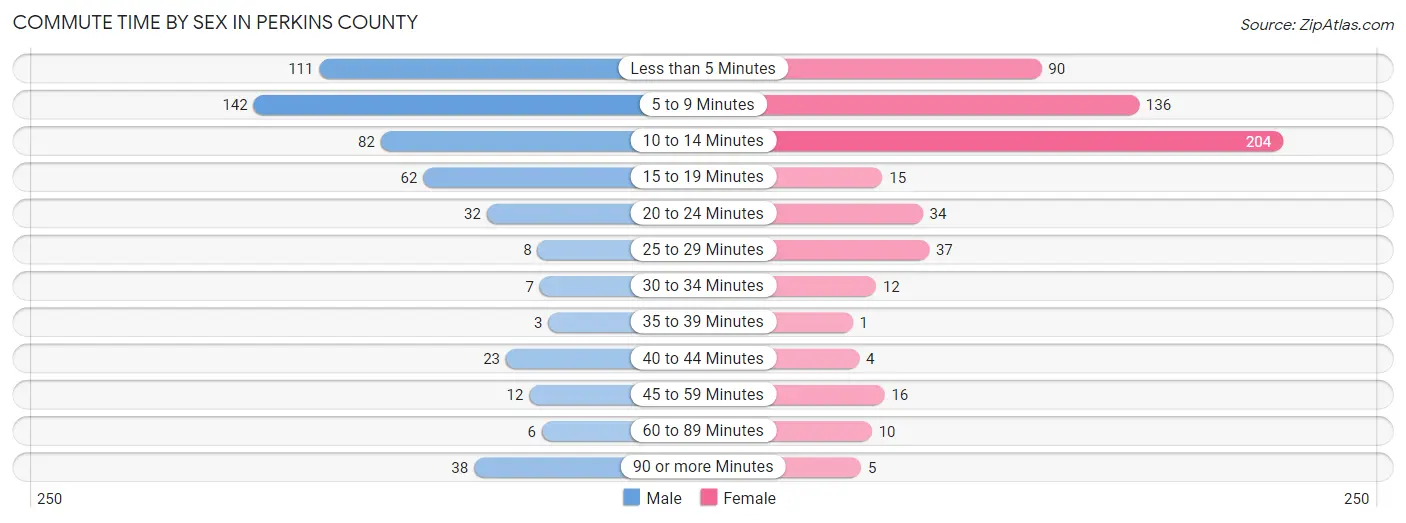
| Commute Time | Male | Female |
| Less than 5 Minutes | 111 (21.1%) | 90 (16.0%) |
| 5 to 9 Minutes | 142 (27.0%) | 136 (24.1%) |
| 10 to 14 Minutes | 82 (15.6%) | 204 (36.2%) |
| 15 to 19 Minutes | 62 (11.8%) | 15 (2.7%) |
| 20 to 24 Minutes | 32 (6.1%) | 34 (6.0%) |
| 25 to 29 Minutes | 8 (1.5%) | 37 (6.6%) |
| 30 to 34 Minutes | 7 (1.3%) | 12 (2.1%) |
| 35 to 39 Minutes | 3 (0.6%) | 1 (0.2%) |
| 40 to 44 Minutes | 23 (4.4%) | 4 (0.7%) |
| 45 to 59 Minutes | 12 (2.3%) | 16 (2.8%) |
| 60 to 89 Minutes | 6 (1.1%) | 10 (1.8%) |
| 90 or more Minutes | 38 (7.2%) | 5 (0.9%) |
Time of Departure to Work by Sex in Perkins County
The most frequent times of departure to work in Perkins County are 7:00 AM to 7:29 AM (104, 19.8%) for males and 7:30 AM to 7:59 AM (274, 48.6%) for females.

| Time of Departure | Male | Female |
| 12:00 AM to 4:59 AM | 6 (1.1%) | 6 (1.1%) |
| 5:00 AM to 5:29 AM | 17 (3.2%) | 9 (1.6%) |
| 5:30 AM to 5:59 AM | 13 (2.5%) | 8 (1.4%) |
| 6:00 AM to 6:29 AM | 62 (11.8%) | 18 (3.2%) |
| 6:30 AM to 6:59 AM | 100 (19.0%) | 47 (8.3%) |
| 7:00 AM to 7:29 AM | 104 (19.8%) | 51 (9.0%) |
| 7:30 AM to 7:59 AM | 99 (18.8%) | 274 (48.6%) |
| 8:00 AM to 8:29 AM | 52 (9.9%) | 52 (9.2%) |
| 8:30 AM to 8:59 AM | 13 (2.5%) | 41 (7.3%) |
| 9:00 AM to 9:59 AM | 20 (3.8%) | 9 (1.6%) |
| 10:00 AM to 10:59 AM | 4 (0.8%) | 8 (1.4%) |
| 11:00 AM to 11:59 AM | 0 (0.0%) | 3 (0.5%) |
| 12:00 PM to 3:59 PM | 32 (6.1%) | 34 (6.0%) |
| 4:00 PM to 11:59 PM | 4 (0.8%) | 4 (0.7%) |
| Total | 526 (100.0%) | 564 (100.0%) |
Housing Occupancy in Perkins County
Occupancy by Ownership in Perkins County
Of the total 1,237 dwellings in Perkins County, owner-occupied units account for 971 (78.5%), while renter-occupied units make up 266 (21.5%).
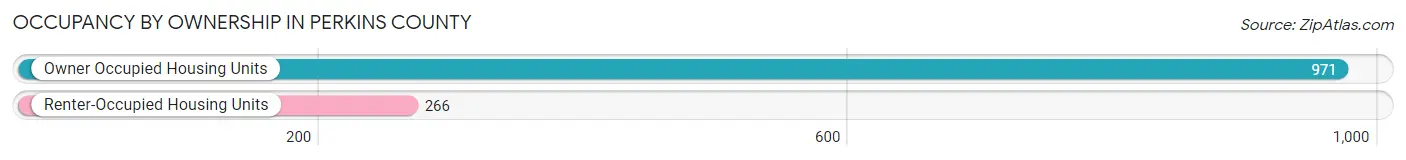
| Occupancy | # Housing Units | % Housing Units |
| Owner Occupied Housing Units | 971 | 78.5% |
| Renter-Occupied Housing Units | 266 | 21.5% |
| Total Occupied Housing Units | 1,237 | 100.0% |
Occupancy by Household Size in Perkins County

| Household Size | # Housing Units | % Housing Units |
| 1-Person Household | 354 | 28.6% |
| 2-Person Household | 530 | 42.8% |
| 3-Person Household | 136 | 11.0% |
| 4+ Person Household | 217 | 17.5% |
| Total Housing Units | 1,237 | 100.0% |
Occupancy by Ownership by Household Size in Perkins County

| Household Size | Owner-occupied | Renter-occupied |
| 1-Person Household | 235 (66.4%) | 119 (33.6%) |
| 2-Person Household | 451 (85.1%) | 79 (14.9%) |
| 3-Person Household | 99 (72.8%) | 37 (27.2%) |
| 4+ Person Household | 186 (85.7%) | 31 (14.3%) |
| Total Housing Units | 971 (78.5%) | 266 (21.5%) |
Occupancy by Educational Attainment in Perkins County

| Household Size | Owner-occupied | Renter-occupied |
| Less than High School | 49 (72.1%) | 19 (27.9%) |
| High School Diploma | 324 (83.3%) | 65 (16.7%) |
| College/Associate Degree | 365 (73.9%) | 129 (26.1%) |
| Bachelor's Degree or higher | 233 (81.5%) | 53 (18.5%) |
Occupancy by Age of Householder in Perkins County
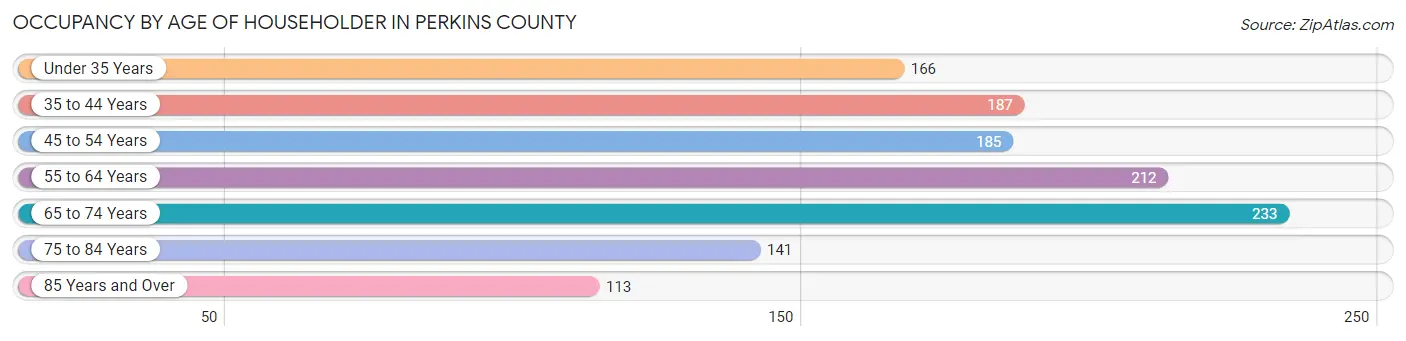
| Age Bracket | # Households | % Households |
| Under 35 Years | 166 | 13.4% |
| 35 to 44 Years | 187 | 15.1% |
| 45 to 54 Years | 185 | 15.0% |
| 55 to 64 Years | 212 | 17.1% |
| 65 to 74 Years | 233 | 18.8% |
| 75 to 84 Years | 141 | 11.4% |
| 85 Years and Over | 113 | 9.1% |
| Total | 1,237 | 100.0% |
Housing Finances in Perkins County
Median Income by Occupancy in Perkins County
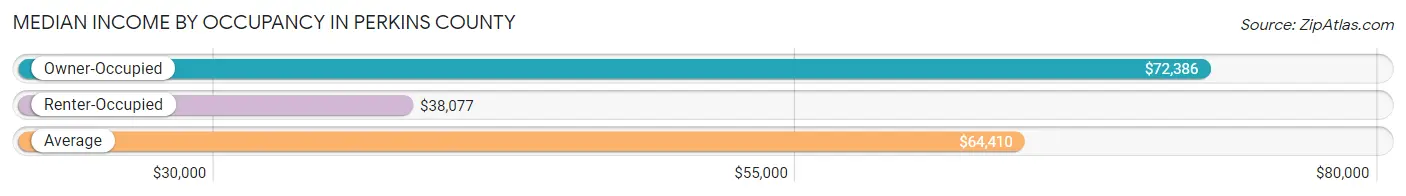
| Occupancy Type | # Households | Median Income |
| Owner-Occupied | 971 (78.5%) | $72,386 |
| Renter-Occupied | 266 (21.5%) | $38,077 |
| Average | 1,237 (100.0%) | $64,410 |
Occupancy by Householder Income Bracket in Perkins County
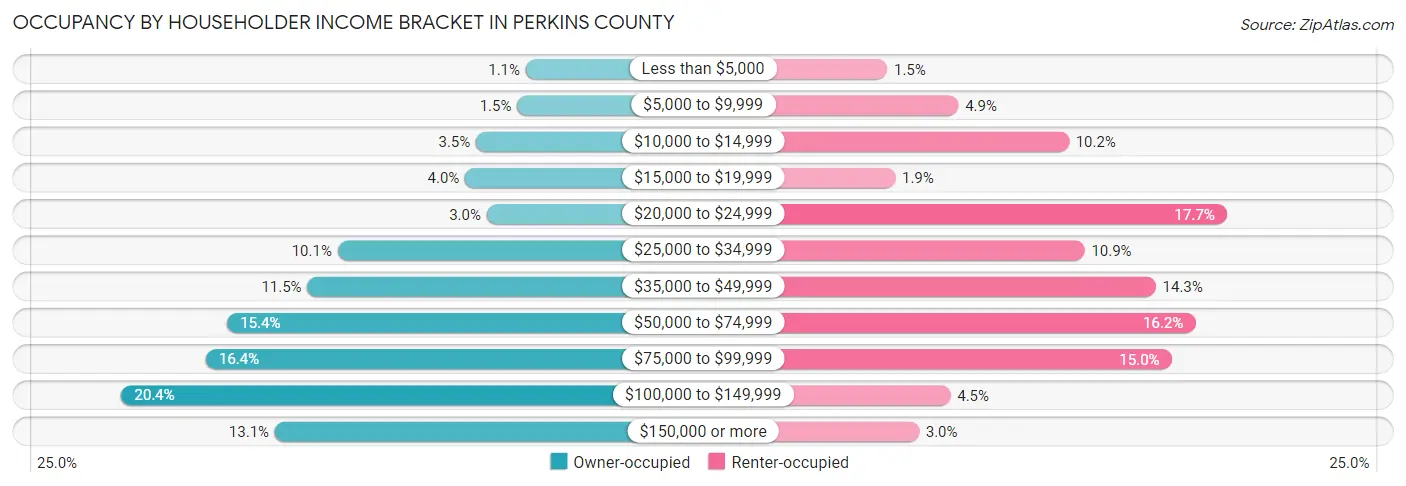
| Income Bracket | Owner-occupied | Renter-occupied |
| Less than $5,000 | 11 (1.1%) | 4 (1.5%) |
| $5,000 to $9,999 | 15 (1.5%) | 13 (4.9%) |
| $10,000 to $14,999 | 34 (3.5%) | 27 (10.2%) |
| $15,000 to $19,999 | 39 (4.0%) | 5 (1.9%) |
| $20,000 to $24,999 | 29 (3.0%) | 47 (17.7%) |
| $25,000 to $34,999 | 98 (10.1%) | 29 (10.9%) |
| $35,000 to $49,999 | 112 (11.5%) | 38 (14.3%) |
| $50,000 to $74,999 | 149 (15.3%) | 43 (16.2%) |
| $75,000 to $99,999 | 159 (16.4%) | 40 (15.0%) |
| $100,000 to $149,999 | 198 (20.4%) | 12 (4.5%) |
| $150,000 or more | 127 (13.1%) | 8 (3.0%) |
| Total | 971 (100.0%) | 266 (100.0%) |
Monthly Housing Cost Tiers in Perkins County

| Monthly Cost | Owner-occupied | Renter-occupied |
| Less than $300 | 80 (8.2%) | 12 (4.5%) |
| $300 to $499 | 273 (28.1%) | 16 (6.0%) |
| $500 to $799 | 263 (27.1%) | 69 (25.9%) |
| $800 to $999 | 131 (13.5%) | 36 (13.5%) |
| $1,000 to $1,499 | 156 (16.1%) | 34 (12.8%) |
| $1,500 to $1,999 | 26 (2.7%) | 0 (0.0%) |
| $2,000 to $2,499 | 28 (2.9%) | 0 (0.0%) |
| $2,500 to $2,999 | 12 (1.2%) | 0 (0.0%) |
| $3,000 or more | 2 (0.2%) | 0 (0.0%) |
| Total | 971 (100.0%) | 266 (100.0%) |
Physical Housing Characteristics in Perkins County
Housing Structures in Perkins County

| Structure Type | # Housing Units | % Housing Units |
| Single Unit, Detached | 971 | 78.5% |
| Single Unit, Attached | 2 | 0.2% |
| 2 Unit Apartments | 0 | 0.0% |
| 3 or 4 Unit Apartments | 36 | 2.9% |
| 5 to 9 Unit Apartments | 0 | 0.0% |
| 10 or more Apartments | 57 | 4.6% |
| Mobile Home / Other | 171 | 13.8% |
| Total | 1,237 | 100.0% |
Housing Structures by Occupancy in Perkins County

| Structure Type | Owner-occupied | Renter-occupied |
| Single Unit, Detached | 817 (84.1%) | 154 (15.9%) |
| Single Unit, Attached | 2 (100.0%) | 0 (0.0%) |
| 2 Unit Apartments | 0 (0.0%) | 0 (0.0%) |
| 3 or 4 Unit Apartments | 0 (0.0%) | 36 (100.0%) |
| 5 to 9 Unit Apartments | 0 (0.0%) | 0 (0.0%) |
| 10 or more Apartments | 0 (0.0%) | 57 (100.0%) |
| Mobile Home / Other | 152 (88.9%) | 19 (11.1%) |
| Total | 971 (78.5%) | 266 (21.5%) |
Housing Structures by Number of Rooms in Perkins County

| Number of Rooms | Owner-occupied | Renter-occupied |
| 1 Room | 2 (0.2%) | 16 (6.0%) |
| 2 or 3 Rooms | 26 (2.7%) | 46 (17.3%) |
| 4 or 5 Rooms | 285 (29.3%) | 110 (41.3%) |
| 6 or 7 Rooms | 304 (31.3%) | 61 (22.9%) |
| 8 or more Rooms | 354 (36.5%) | 33 (12.4%) |
| Total | 971 (100.0%) | 266 (100.0%) |
Housing Structure by Heating Type in Perkins County

| Heating Type | Owner-occupied | Renter-occupied |
| Utility Gas | 31 (3.2%) | 9 (3.4%) |
| Bottled, Tank, or LP Gas | 533 (54.9%) | 110 (41.3%) |
| Electricity | 269 (27.7%) | 141 (53.0%) |
| Fuel Oil or Kerosene | 77 (7.9%) | 4 (1.5%) |
| Coal or Coke | 12 (1.2%) | 0 (0.0%) |
| All other Fuels | 46 (4.7%) | 2 (0.7%) |
| No Fuel Used | 3 (0.3%) | 0 (0.0%) |
| Total | 971 (100.0%) | 266 (100.0%) |
Household Vehicle Usage in Perkins County

| Vehicles per Household | Owner-occupied | Renter-occupied |
| No Vehicle | 25 (2.6%) | 17 (6.4%) |
| 1 Vehicle | 139 (14.3%) | 111 (41.7%) |
| 2 Vehicles | 352 (36.2%) | 92 (34.6%) |
| 3 or more Vehicles | 455 (46.9%) | 46 (17.3%) |
| Total | 971 (100.0%) | 266 (100.0%) |
Real Estate & Mortgages in Perkins County
Real Estate and Mortgage Overview in Perkins County
| Characteristic | Without Mortgage | With Mortgage |
| Housing Units | 704 | 267 |
| Median Property Value | $102,200 | $121,600 |
| Median Household Income | $67,273 | $18 |
| Monthly Housing Costs | $500 | $2 |
| Real Estate Taxes | $1,328 | $5 |
Property Value by Mortgage Status in Perkins County
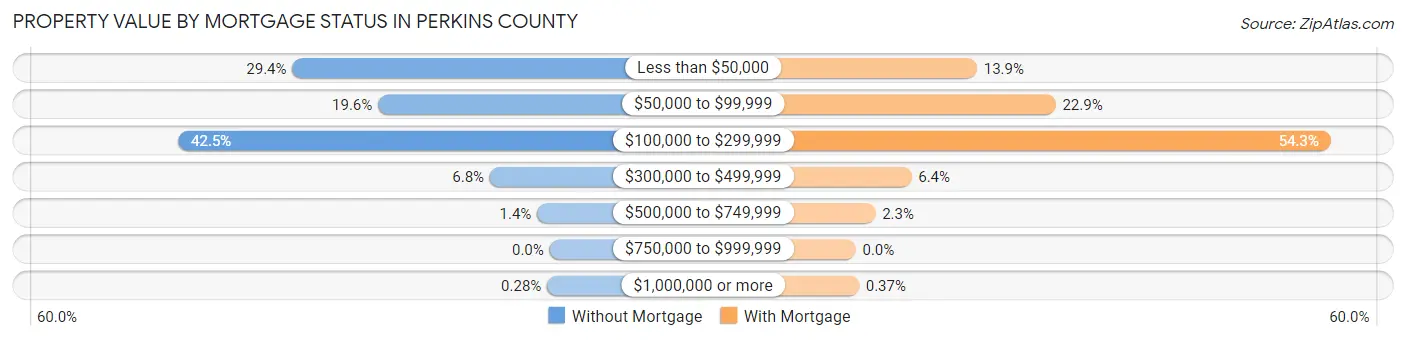
| Property Value | Without Mortgage | With Mortgage |
| Less than $50,000 | 207 (29.4%) | 37 (13.9%) |
| $50,000 to $99,999 | 138 (19.6%) | 61 (22.9%) |
| $100,000 to $299,999 | 299 (42.5%) | 145 (54.3%) |
| $300,000 to $499,999 | 48 (6.8%) | 17 (6.4%) |
| $500,000 to $749,999 | 10 (1.4%) | 6 (2.2%) |
| $750,000 to $999,999 | 0 (0.0%) | 0 (0.0%) |
| $1,000,000 or more | 2 (0.3%) | 1 (0.4%) |
| Total | 704 (100.0%) | 267 (100.0%) |
Household Income by Mortgage Status in Perkins County

| Household Income | Without Mortgage | With Mortgage |
| Less than $10,000 | 14 (2.0%) | 0 (0.0%) |
| $10,000 to $24,999 | 71 (10.1%) | 12 (4.5%) |
| $25,000 to $34,999 | 90 (12.8%) | 31 (11.6%) |
| $35,000 to $49,999 | 68 (9.7%) | 8 (3.0%) |
| $50,000 to $74,999 | 129 (18.3%) | 44 (16.5%) |
| $75,000 to $99,999 | 108 (15.3%) | 20 (7.5%) |
| $100,000 to $149,999 | 115 (16.3%) | 51 (19.1%) |
| $150,000 or more | 109 (15.5%) | 83 (31.1%) |
| Total | 704 (100.0%) | 267 (100.0%) |
Property Value to Household Income Ratio in Perkins County

| Value-to-Income Ratio | Without Mortgage | With Mortgage |
| Less than 2.0x | 464 (65.9%) | 85,893 (32,169.7%) |
| 2.0x to 2.9x | 127 (18.0%) | 173 (64.8%) |
| 3.0x to 3.9x | 42 (6.0%) | 22 (8.2%) |
| 4.0x or more | 71 (10.1%) | 15 (5.6%) |
| Total | 704 (100.0%) | 267 (100.0%) |
Real Estate Taxes by Mortgage Status in Perkins County
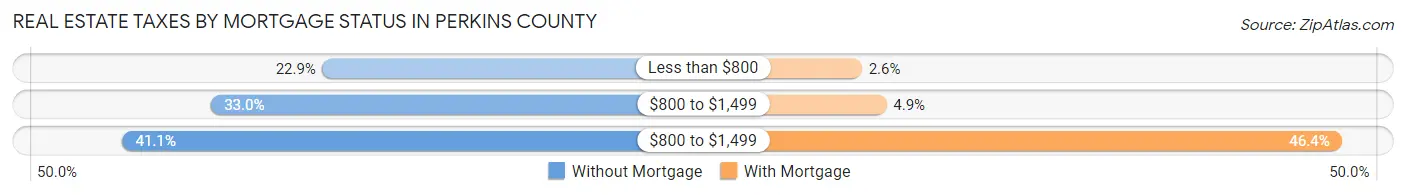
| Property Taxes | Without Mortgage | With Mortgage |
| Less than $800 | 161 (22.9%) | 7 (2.6%) |
| $800 to $1,499 | 232 (33.0%) | 13 (4.9%) |
| $800 to $1,499 | 289 (41.0%) | 124 (46.4%) |
| Total | 704 (100.0%) | 267 (100.0%) |
Health & Disability in Perkins County
Health Insurance Coverage by Age in Perkins County
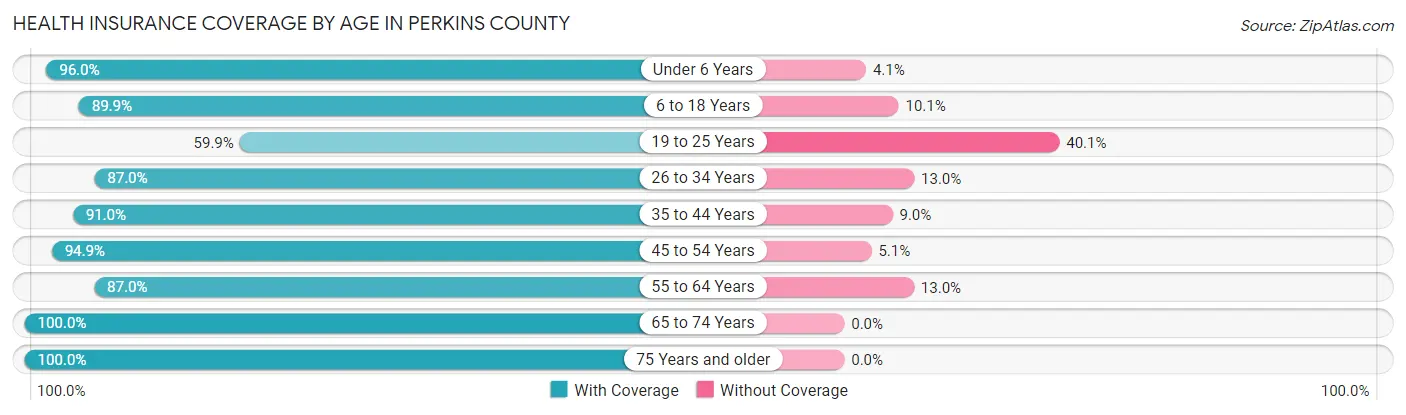
| Age Bracket | With Coverage | Without Coverage |
| Under 6 Years | 213 (96.0%) | 9 (4.1%) |
| 6 to 18 Years | 453 (89.9%) | 51 (10.1%) |
| 19 to 25 Years | 118 (59.9%) | 79 (40.1%) |
| 26 to 34 Years | 167 (87.0%) | 25 (13.0%) |
| 35 to 44 Years | 324 (91.0%) | 32 (9.0%) |
| 45 to 54 Years | 319 (94.9%) | 17 (5.1%) |
| 55 to 64 Years | 342 (87.0%) | 51 (13.0%) |
| 65 to 74 Years | 355 (100.0%) | 0 (0.0%) |
| 75 Years and older | 369 (100.0%) | 0 (0.0%) |
| Total | 2,660 (91.0%) | 264 (9.0%) |
Health Insurance Coverage by Citizenship Status in Perkins County

| Citizenship Status | With Coverage | Without Coverage |
| Native Born | 213 (96.0%) | 9 (4.1%) |
| Foreign Born, Citizen | 453 (89.9%) | 51 (10.1%) |
| Foreign Born, not a Citizen | 118 (59.9%) | 79 (40.1%) |
Health Insurance Coverage by Household Income in Perkins County

| Household Income | With Coverage | Without Coverage |
| Under $25,000 | 238 (67.8%) | 113 (32.2%) |
| $25,000 to $49,999 | 463 (84.6%) | 84 (15.4%) |
| $50,000 to $74,999 | 390 (90.9%) | 39 (9.1%) |
| $75,000 to $99,999 | 486 (99.6%) | 2 (0.4%) |
| $100,000 and over | 1,038 (97.6%) | 26 (2.4%) |
Public vs Private Health Insurance Coverage by Age in Perkins County

| Age Bracket | Public Insurance | Private Insurance |
| Under 6 | 45 (20.3%) | 168 (75.7%) |
| 6 to 18 Years | 80 (15.9%) | 404 (80.2%) |
| 19 to 25 Years | 9 (4.6%) | 109 (55.3%) |
| 25 to 34 Years | 28 (14.6%) | 141 (73.4%) |
| 35 to 44 Years | 68 (19.1%) | 263 (73.9%) |
| 45 to 54 Years | 11 (3.3%) | 314 (93.4%) |
| 55 to 64 Years | 29 (7.4%) | 316 (80.4%) |
| 65 to 74 Years | 354 (99.7%) | 197 (55.5%) |
| 75 Years and over | 369 (100.0%) | 253 (68.6%) |
| Total | 993 (34.0%) | 2,165 (74.0%) |
Disability Status by Sex by Age in Perkins County

| Age Bracket | Male | Female |
| Under 5 Years | 0 (0.0%) | 0 (0.0%) |
| 5 to 17 Years | 9 (4.4%) | 1 (0.4%) |
| 18 to 34 Years | 20 (7.8%) | 3 (1.4%) |
| 35 to 64 Years | 54 (10.0%) | 46 (8.5%) |
| 65 to 74 Years | 77 (40.1%) | 21 (12.9%) |
| 75 Years and over | 65 (36.9%) | 79 (40.9%) |
Disability Class by Sex by Age in Perkins County
Disability Class: Hearing Difficulty
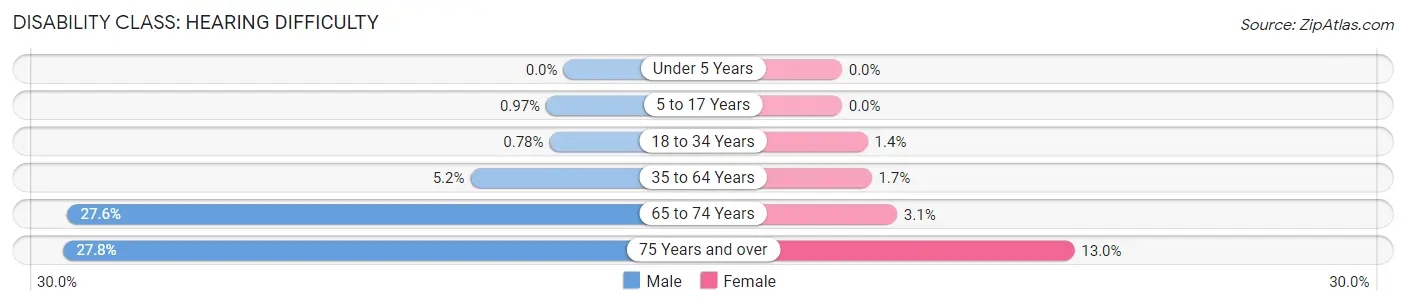
| Age Bracket | Male | Female |
| Under 5 Years | 0 (0.0%) | 0 (0.0%) |
| 5 to 17 Years | 2 (1.0%) | 0 (0.0%) |
| 18 to 34 Years | 2 (0.8%) | 3 (1.4%) |
| 35 to 64 Years | 28 (5.2%) | 9 (1.7%) |
| 65 to 74 Years | 53 (27.6%) | 5 (3.1%) |
| 75 Years and over | 49 (27.8%) | 25 (13.0%) |
Disability Class: Vision Difficulty

| Age Bracket | Male | Female |
| Under 5 Years | 0 (0.0%) | 0 (0.0%) |
| 5 to 17 Years | 4 (1.9%) | 0 (0.0%) |
| 18 to 34 Years | 2 (0.8%) | 3 (1.4%) |
| 35 to 64 Years | 5 (0.9%) | 8 (1.5%) |
| 65 to 74 Years | 6 (3.1%) | 2 (1.2%) |
| 75 Years and over | 5 (2.8%) | 8 (4.2%) |
Disability Class: Cognitive Difficulty

| Age Bracket | Male | Female |
| 5 to 17 Years | 3 (1.5%) | 1 (0.4%) |
| 18 to 34 Years | 11 (4.3%) | 0 (0.0%) |
| 35 to 64 Years | 22 (4.1%) | 27 (5.0%) |
| 65 to 74 Years | 12 (6.2%) | 1 (0.6%) |
| 75 Years and over | 2 (1.1%) | 6 (3.1%) |
Disability Class: Ambulatory Difficulty

| Age Bracket | Male | Female |
| 5 to 17 Years | 0 (0.0%) | 0 (0.0%) |
| 18 to 34 Years | 2 (0.8%) | 0 (0.0%) |
| 35 to 64 Years | 7 (1.3%) | 18 (3.3%) |
| 65 to 74 Years | 30 (15.6%) | 19 (11.7%) |
| 75 Years and over | 29 (16.5%) | 55 (28.5%) |
Disability Class: Self-Care Difficulty

| Age Bracket | Male | Female |
| 5 to 17 Years | 0 (0.0%) | 0 (0.0%) |
| 18 to 34 Years | 2 (0.8%) | 0 (0.0%) |
| 35 to 64 Years | 7 (1.3%) | 7 (1.3%) |
| 65 to 74 Years | 11 (5.7%) | 13 (8.0%) |
| 75 Years and over | 12 (6.8%) | 3 (1.5%) |
Technology Access in Perkins County
Computing Device Access in Perkins County

| Device Type | # Households | % Households |
| Desktop or Laptop | 1,005 | 81.2% |
| Smartphone | 916 | 74.1% |
| Tablet | 623 | 50.4% |
| No Computing Device | 101 | 8.2% |
| Total | 1,237 | 100.0% |
Internet Access in Perkins County

| Internet Type | # Households | % Households |
| Dial-Up Internet | 4 | 0.3% |
| Broadband Home | 963 | 77.8% |
| Cellular Data Only | 81 | 6.6% |
| Satellite Internet | 38 | 3.1% |
| No Internet | 160 | 12.9% |
| Total | 1,237 | 100.0% |
Perkins County Summary
Perkins County, South Dakota is located in the western part of the state, and is bordered by Harding, Butte, Meade, and Ziebach counties. It is part of the Great Plains region of the United States, and is home to a population of just over 3,000 people. The county seat is Bison, and the largest city is Lemmon.
History
Perkins County was established in 1883, and was named after the first governor of South Dakota, John L. Perkins. The county was originally part of the Cheyenne River Indian Reservation, and was opened to white settlement in 1883. The first settlers arrived in the area in 1884, and the county was officially organized in 1885.
The county was primarily used for ranching and farming, and the population grew steadily throughout the late 19th and early 20th centuries. The county was also home to several small mining operations, and the town of Bison was established in 1887.
Geography
Perkins County covers an area of 1,845 square miles, and is located in the western part of South Dakota. The county is bordered by Harding, Butte, Meade, and Ziebach counties. The terrain is mostly flat, with rolling hills in the east and south. The county is part of the Great Plains region of the United States, and is home to a variety of wildlife, including deer, antelope, and prairie dogs.
The county is home to several small lakes, including Lake Oahe, Lake Sharpe, and Lake Francis Case. The county is also home to several rivers, including the Cheyenne River, the White River, and the Grand River.
Economy
The economy of Perkins County is primarily based on agriculture and ranching. The county is home to several large cattle ranches, and the county is also home to several small farms. The county is also home to several small businesses, including restaurants, stores, and other services.
The county is also home to several oil and gas wells, and the county is home to several small mining operations. The county is also home to several wind farms, and the county is home to several renewable energy projects.
Demographics
As of the 2010 census, the population of Perkins County was 3,072. The population is primarily white (96.2%), with a small Native American population (1.3%). The median household income is $45,938, and the median age is 44.7 years.
The county is home to several small towns, including Bison, Lemmon, and Faith. The county is also home to several small unincorporated communities, including Prairie City, Prairie View, and Prairie Center. The county is also home to several small Native American reservations, including the Cheyenne River Indian Reservation and the Standing Rock Indian Reservation.
Common Questions
What is the Total Population of Perkins County?
Total Population of Perkins County is 2,970.
What is the Total Male Population of Perkins County?
Total Male Population of Perkins County is 1,492.
What is the Total Female Population of Perkins County?
Total Female Population of Perkins County is 1,478.
What is the Ratio of Males per 100 Females in Perkins County?
There are 100.95 Males per 100 Females in Perkins County.
What is the Ratio of Females per 100 Males in Perkins County?
There are 99.06 Females per 100 Males in Perkins County.
What is the Median Population Age in Perkins County?
Median Population Age in Perkins County is 45.4 Years.
What is the Average Family Size in Perkins County
Average Family Size in Perkins County is 2.9 People.
What is the Average Household Size in Perkins County
Average Household Size in Perkins County is 2.3 People.
What is Per Capita Income in Perkins County?
Per Capita income in Perkins County is $40,235.
What is the Median Family Income in Perkins County?
Median Family Income in Perkins County is $80,263.
What is the Median Household income in Perkins County?
Median Household Income in Perkins County is $64,410.
What is Income or Wage Gap in Perkins County?
Income or Wage Gap in Perkins County is 39.8%.
Women in Perkins County earn 60.2 cents for every dollar earned by a man.
What is Inequality or Gini Index in Perkins County?
Inequality or Gini Index in Perkins County is 0.50.
How Large is the Labor Force in Perkins County?
There are 1,650 People in the Labor Forcein in Perkins County.
What is the Percentage of People in the Labor Force in Perkins County?
69.4% of People are in the Labor Force in Perkins County.
What is the Unemployment Rate in Perkins County?
Unemployment Rate in Perkins County is 4.2%.