Pennington County, SD
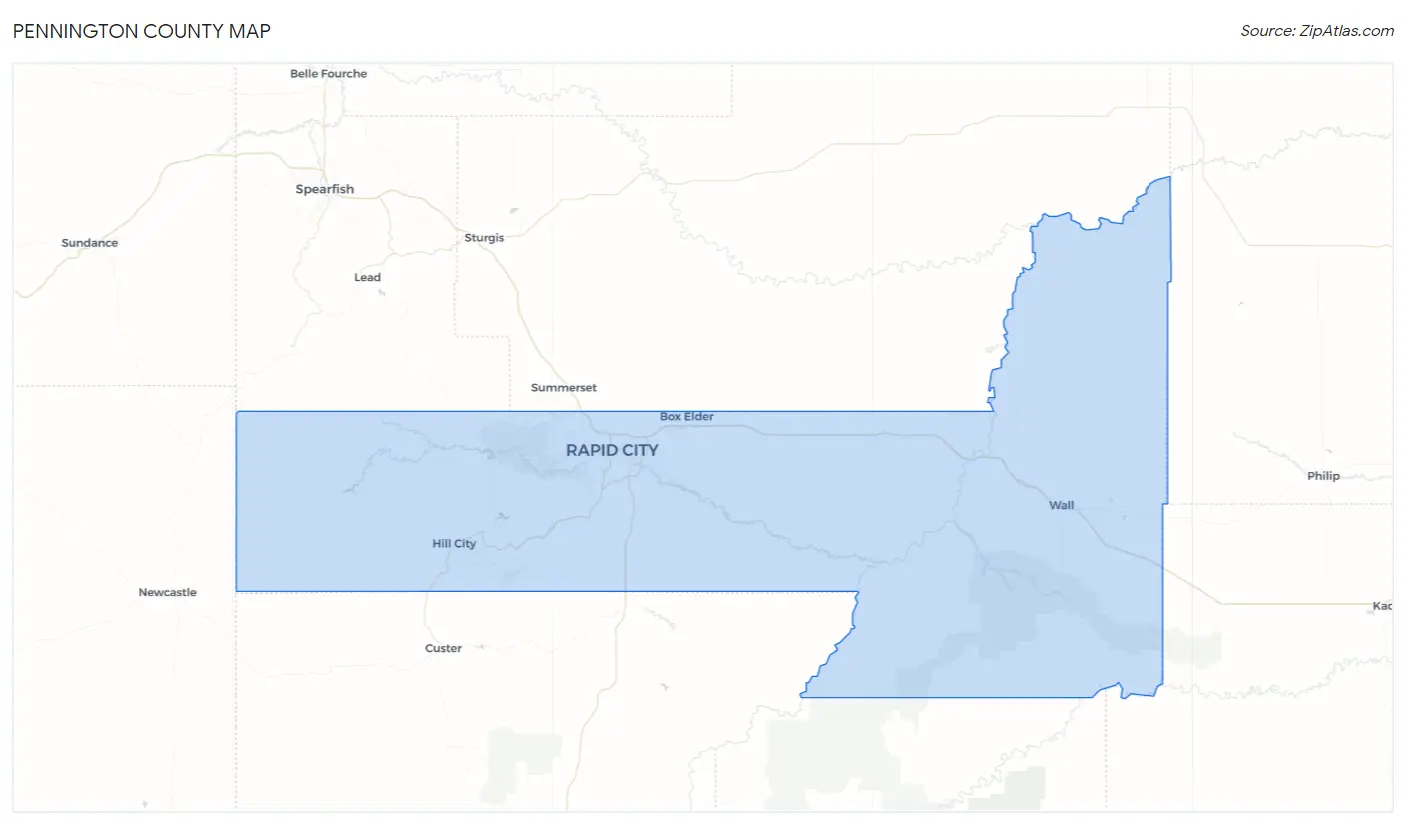
Pennington County Map
Pennington County Overview
110,386
TOTAL POPULATION
56,398
MALE POPULATION
53,988
FEMALE POPULATION
104.46
MALES / 100 FEMALES
95.73
FEMALES / 100 MALES
39.6
MEDIAN AGE
3.0
AVG FAMILY SIZE
2.4
AVG HOUSEHOLD SIZE
$38,951
PER CAPITA INCOME
$85,972
AVG FAMILY INCOME
$67,823
AVG HOUSEHOLD INCOME
20.8%
WAGE / INCOME GAP [ % ]
79.2¢/ $1
WAGE / INCOME GAP [ $ ]
$10,971
FAMILY INCOME DEFICIT
0.47
INEQUALITY / GINI INDEX
57,450
LABOR FORCE [ PEOPLE ]
64.9%
PERCENT IN LABOR FORCE
3.5%
UNEMPLOYMENT RATE
Pennington County Area Codes
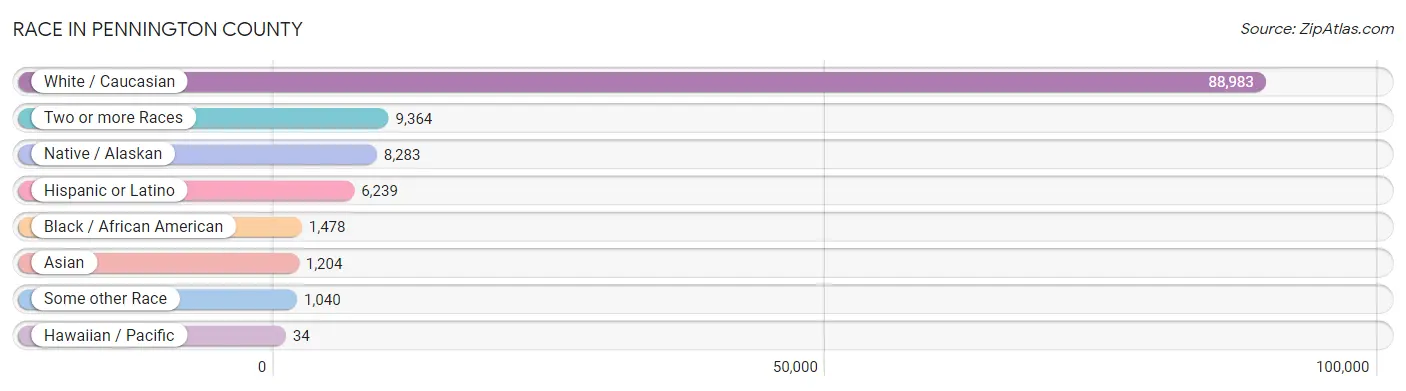
Race in Pennington County
The most populous races in Pennington County are White / Caucasian (88,983 | 80.6%), Two or more Races (9,364 | 8.5%), and Native / Alaskan (8,283 | 7.5%).
| Race | # Population | % Population |
| Asian | 1,204 | 1.1% |
| Black / African American | 1,478 | 1.3% |
| Hawaiian / Pacific | 34 | 0.0% |
| Hispanic or Latino | 6,239 | 5.7% |
| Native / Alaskan | 8,283 | 7.5% |
| White / Caucasian | 88,983 | 80.6% |
| Two or more Races | 9,364 | 8.5% |
| Some other Race | 1,040 | 0.9% |
| Total | 110,386 | 100.0% |
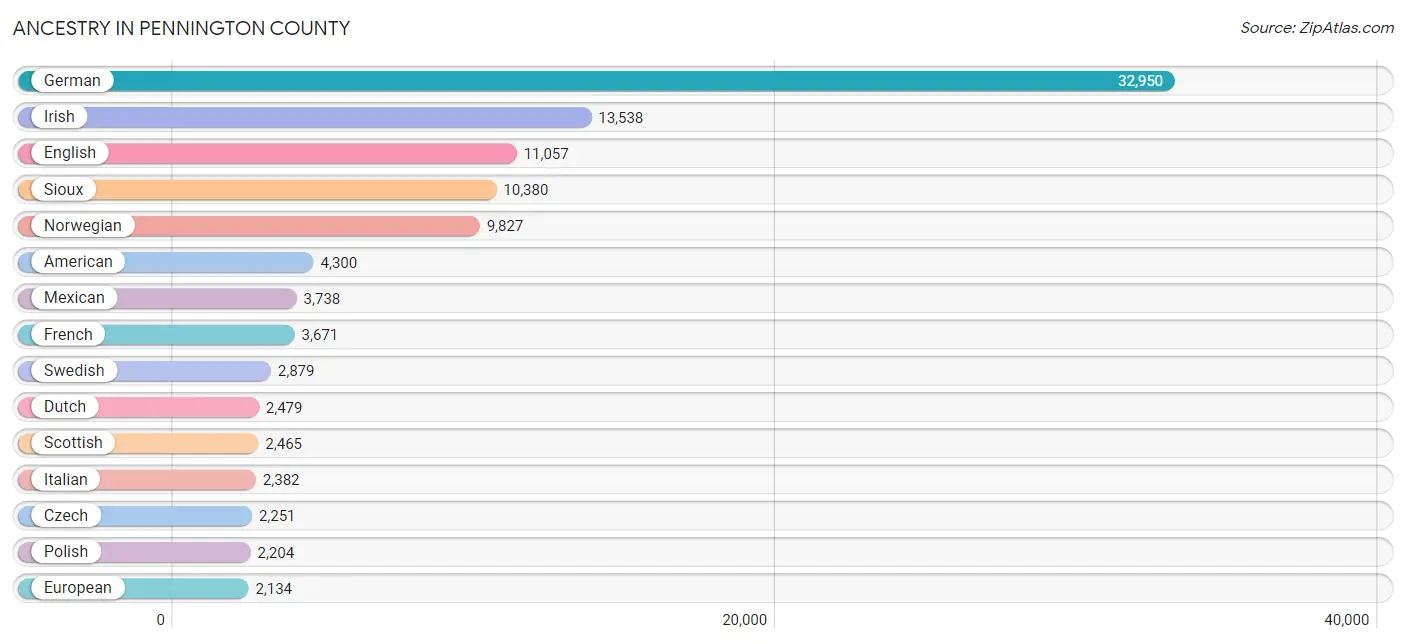
Ancestry in Pennington County
The most populous ancestries reported in Pennington County are German (32,950 | 29.8%), Irish (13,538 | 12.3%), English (11,057 | 10.0%), Sioux (10,380 | 9.4%), and Norwegian (9,827 | 8.9%), together accounting for 70.4% of all Pennington County residents.
| Ancestry | # Population | % Population |
| African | 65 | 0.1% |
| Alaska Native | 93 | 0.1% |
| Albanian | 133 | 0.1% |
| Alsatian | 46 | 0.0% |
| American | 4,300 | 3.9% |
| Arab | 367 | 0.3% |
| Arapaho | 54 | 0.1% |
| Argentinean | 56 | 0.1% |
| Austrian | 110 | 0.1% |
| Basque | 23 | 0.0% |
| Belgian | 69 | 0.1% |
| Bhutanese | 317 | 0.3% |
| Blackfeet | 108 | 0.1% |
| British | 512 | 0.5% |
| Bulgarian | 6 | 0.0% |
| Burmese | 265 | 0.2% |
| Canadian | 303 | 0.3% |
| Celtic | 22 | 0.0% |
| Central American | 329 | 0.3% |
| Central American Indian | 23 | 0.0% |
| Cherokee | 334 | 0.3% |
| Cheyenne | 108 | 0.1% |
| Chickasaw | 10 | 0.0% |
| Chippewa | 98 | 0.1% |
| Choctaw | 48 | 0.0% |
| Colombian | 18 | 0.0% |
| Comanche | 10 | 0.0% |
| Croatian | 14 | 0.0% |
| Cuban | 44 | 0.0% |
| Czech | 2,251 | 2.0% |
| Czechoslovakian | 173 | 0.2% |
| Danish | 1,821 | 1.7% |
| Dutch | 2,479 | 2.2% |
| Eastern European | 224 | 0.2% |
| Egyptian | 104 | 0.1% |
| English | 11,057 | 10.0% |
| Ethiopian | 74 | 0.1% |
| European | 2,134 | 1.9% |
| Fijian | 12 | 0.0% |
| Finnish | 527 | 0.5% |
| French | 3,671 | 3.3% |
| French Canadian | 388 | 0.4% |
| German | 32,950 | 29.8% |
| German Russian | 32 | 0.0% |
| Greek | 398 | 0.4% |
| Guamanian / Chamorro | 49 | 0.0% |
| Guatemalan | 37 | 0.0% |
| Haitian | 151 | 0.1% |
| Honduran | 72 | 0.1% |
| Hungarian | 245 | 0.2% |
| Icelander | 33 | 0.0% |
| Indian (Asian) | 191 | 0.2% |
| Indonesian | 67 | 0.1% |
| Iranian | 35 | 0.0% |
| Irish | 13,538 | 12.3% |
| Iroquois | 22 | 0.0% |
| Italian | 2,382 | 2.2% |
| Jamaican | 71 | 0.1% |
| Kenyan | 25 | 0.0% |
| Korean | 998 | 0.9% |
| Laotian | 33 | 0.0% |
| Latvian | 20 | 0.0% |
| Lebanese | 145 | 0.1% |
| Lithuanian | 191 | 0.2% |
| Luxembourger | 38 | 0.0% |
| Mexican | 3,738 | 3.4% |
| Mexican American Indian | 23 | 0.0% |
| Native Hawaiian | 54 | 0.1% |
| Navajo | 177 | 0.2% |
| New Zealander | 9 | 0.0% |
| Nicaraguan | 127 | 0.1% |
| Nigerian | 39 | 0.0% |
| Northern European | 272 | 0.3% |
| Norwegian | 9,827 | 8.9% |
| Okinawan | 28 | 0.0% |
| Ottawa | 9 | 0.0% |
| Pakistani | 73 | 0.1% |
| Palestinian | 33 | 0.0% |
| Pennsylvania German | 109 | 0.1% |
| Peruvian | 150 | 0.1% |
| Polish | 2,204 | 2.0% |
| Portuguese | 134 | 0.1% |
| Potawatomi | 32 | 0.0% |
| Puerto Rican | 953 | 0.9% |
| Romanian | 34 | 0.0% |
| Russian | 999 | 0.9% |
| Salvadoran | 93 | 0.1% |
| Scandinavian | 1,508 | 1.4% |
| Scotch-Irish | 1,088 | 1.0% |
| Scottish | 2,465 | 2.2% |
| Seminole | 28 | 0.0% |
| Serbian | 16 | 0.0% |
| Sioux | 10,380 | 9.4% |
| Slavic | 4 | 0.0% |
| Slovak | 113 | 0.1% |
| Slovene | 31 | 0.0% |
| Somali | 1 | 0.0% |
| South American | 224 | 0.2% |
| Spaniard | 196 | 0.2% |
| Spanish | 334 | 0.3% |
| Sri Lankan | 31 | 0.0% |
| Subsaharan African | 232 | 0.2% |
| Sudanese | 28 | 0.0% |
| Swedish | 2,879 | 2.6% |
| Swiss | 354 | 0.3% |
| Thai | 116 | 0.1% |
| Tlingit-Haida | 26 | 0.0% |
| Turkish | 65 | 0.1% |
| Ukrainian | 83 | 0.1% |
| Vietnamese | 20 | 0.0% |
| Welsh | 868 | 0.8% | View All 111 Rows |
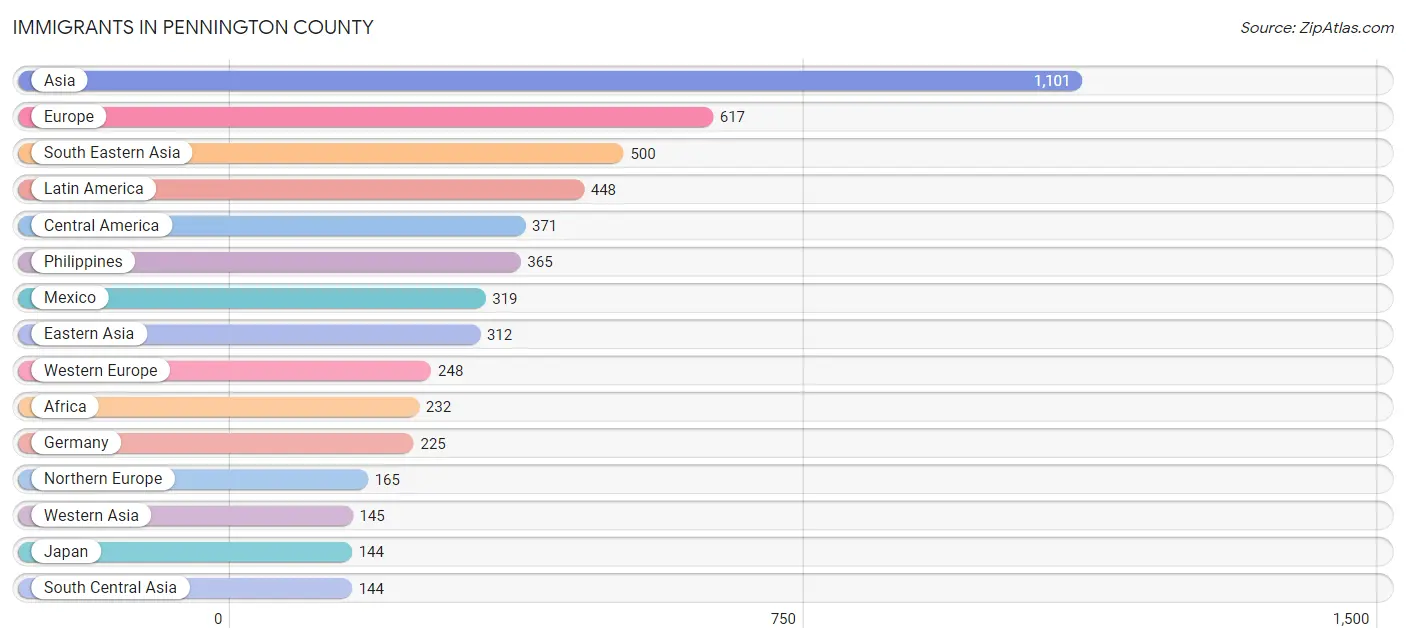
Immigrants in Pennington County
The most numerous immigrant groups reported in Pennington County came from Asia (1,101 | 1.0%), Europe (617 | 0.6%), South Eastern Asia (500 | 0.4%), Latin America (448 | 0.4%), and Central America (371 | 0.3%), together accounting for 2.8% of all Pennington County residents.
| Immigration Origin | # Population | % Population |
| Africa | 232 | 0.2% |
| Albania | 42 | 0.0% |
| Asia | 1,101 | 1.0% |
| Bangladesh | 20 | 0.0% |
| Canada | 55 | 0.1% |
| Caribbean | 77 | 0.1% |
| Central America | 371 | 0.3% |
| China | 49 | 0.0% |
| Eastern Africa | 106 | 0.1% |
| Eastern Asia | 312 | 0.3% |
| Eastern Europe | 111 | 0.1% |
| Egypt | 104 | 0.1% |
| El Salvador | 42 | 0.0% |
| England | 120 | 0.1% |
| Ethiopia | 78 | 0.1% |
| Europe | 617 | 0.6% |
| France | 7 | 0.0% |
| Germany | 225 | 0.2% |
| Honduras | 4 | 0.0% |
| Hungary | 4 | 0.0% |
| India | 47 | 0.0% |
| Indonesia | 15 | 0.0% |
| Iran | 9 | 0.0% |
| Iraq | 114 | 0.1% |
| Italy | 9 | 0.0% |
| Jamaica | 71 | 0.1% |
| Japan | 144 | 0.1% |
| Kenya | 28 | 0.0% |
| Korea | 119 | 0.1% |
| Latin America | 448 | 0.4% |
| Mexico | 319 | 0.3% |
| Nepal | 68 | 0.1% |
| Nigeria | 14 | 0.0% |
| Northern Africa | 104 | 0.1% |
| Northern Europe | 165 | 0.2% |
| Panama | 6 | 0.0% |
| Philippines | 365 | 0.3% |
| Poland | 32 | 0.0% |
| Portugal | 29 | 0.0% |
| Russia | 18 | 0.0% |
| Scotland | 13 | 0.0% |
| South Central Asia | 144 | 0.1% |
| South Eastern Asia | 500 | 0.4% |
| Southern Europe | 93 | 0.1% |
| Spain | 55 | 0.1% |
| Switzerland | 16 | 0.0% |
| Thailand | 61 | 0.1% |
| Turkey | 31 | 0.0% |
| Ukraine | 15 | 0.0% |
| Western Africa | 22 | 0.0% |
| Western Asia | 145 | 0.1% |
| Western Europe | 248 | 0.2% | View All 52 Rows |
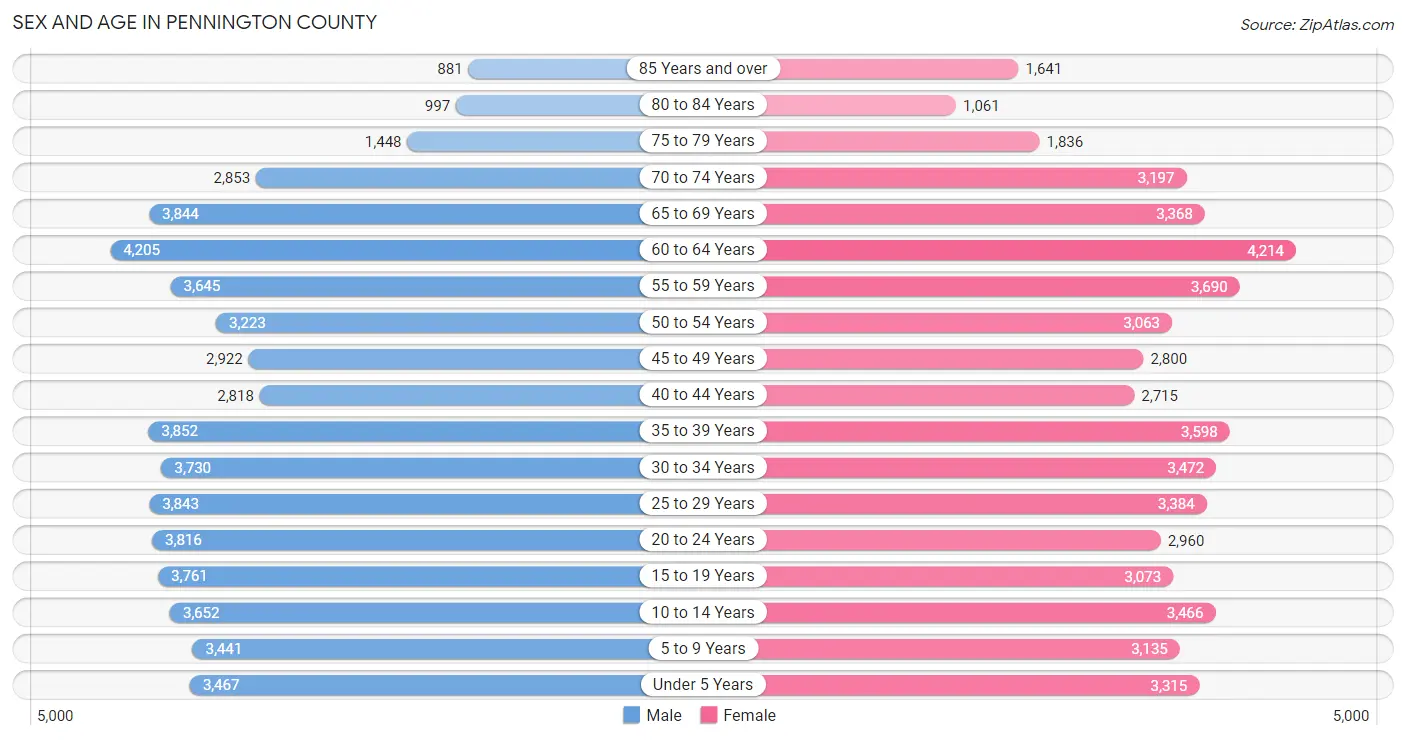
Sex and Age in Pennington County
Sex and Age in Pennington County
The most populous age groups in Pennington County are 60 to 64 Years (4,205 | 7.5%) for men and 60 to 64 Years (4,214 | 7.8%) for women.
| Age Bracket | Male | Female |
| Under 5 Years | 3,467 (6.1%) | 3,315 (6.1%) |
| 5 to 9 Years | 3,441 (6.1%) | 3,135 (5.8%) |
| 10 to 14 Years | 3,652 (6.5%) | 3,466 (6.4%) |
| 15 to 19 Years | 3,761 (6.7%) | 3,073 (5.7%) |
| 20 to 24 Years | 3,816 (6.8%) | 2,960 (5.5%) |
| 25 to 29 Years | 3,843 (6.8%) | 3,384 (6.3%) |
| 30 to 34 Years | 3,730 (6.6%) | 3,472 (6.4%) |
| 35 to 39 Years | 3,852 (6.8%) | 3,598 (6.7%) |
| 40 to 44 Years | 2,818 (5.0%) | 2,715 (5.0%) |
| 45 to 49 Years | 2,922 (5.2%) | 2,800 (5.2%) |
| 50 to 54 Years | 3,223 (5.7%) | 3,063 (5.7%) |
| 55 to 59 Years | 3,645 (6.5%) | 3,690 (6.8%) |
| 60 to 64 Years | 4,205 (7.5%) | 4,214 (7.8%) |
| 65 to 69 Years | 3,844 (6.8%) | 3,368 (6.2%) |
| 70 to 74 Years | 2,853 (5.1%) | 3,197 (5.9%) |
| 75 to 79 Years | 1,448 (2.6%) | 1,836 (3.4%) |
| 80 to 84 Years | 997 (1.8%) | 1,061 (2.0%) |
| 85 Years and over | 881 (1.6%) | 1,641 (3.0%) |
| Total | 56,398 (100.0%) | 53,988 (100.0%) |
Families and Households in Pennington County
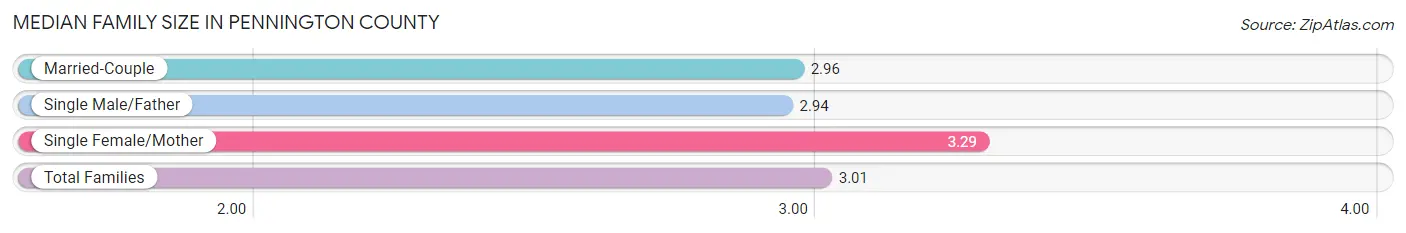
Median Family Size in Pennington County
The median family size in Pennington County is 3.01 persons per family, with single female/mother families (4,029 | 15.1%) accounting for the largest median family size of 3.29 persons per family. On the other hand, single male/father families (1,839 | 6.9%) represent the smallest median family size with 2.94 persons per family.
| Family Type | # Families | Family Size |
| Married-Couple | 20,853 (78.0%) | 2.96 |
| Single Male/Father | 1,839 (6.9%) | 2.94 |
| Single Female/Mother | 4,029 (15.1%) | 3.29 |
| Total Families | 26,721 (100.0%) | 3.01 |
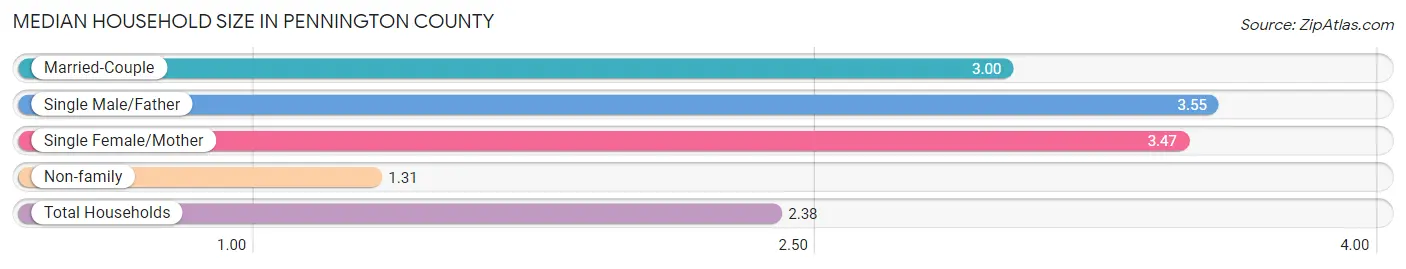
Median Household Size in Pennington County
The median household size in Pennington County is 2.38 persons per household, with single male/father households (1,839 | 4.1%) accounting for the largest median household size of 3.55 persons per household. non-family households (18,108 | 40.4%) represent the smallest median household size with 1.31 persons per household.
| Household Type | # Households | Household Size |
| Married-Couple | 20,853 (46.5%) | 3.00 |
| Single Male/Father | 1,839 (4.1%) | 3.55 |
| Single Female/Mother | 4,029 (9.0%) | 3.47 |
| Non-family | 18,108 (40.4%) | 1.31 |
| Total Households | 44,829 (100.0%) | 2.38 |
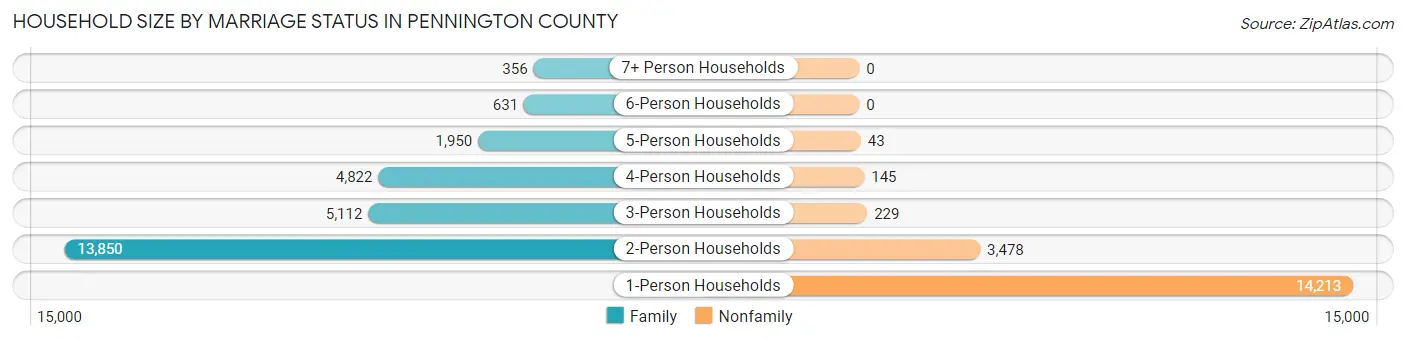
Household Size by Marriage Status in Pennington County
Out of a total of 44,829 households in Pennington County, 26,721 (59.6%) are family households, while 18,108 (40.4%) are nonfamily households. The most numerous type of family households are 2-person households, comprising 13,850, and the most common type of nonfamily households are 1-person households, comprising 14,213.
| Household Size | Family Households | Nonfamily Households |
| 1-Person Households | - | 14,213 (31.7%) |
| 2-Person Households | 13,850 (30.9%) | 3,478 (7.8%) |
| 3-Person Households | 5,112 (11.4%) | 229 (0.5%) |
| 4-Person Households | 4,822 (10.8%) | 145 (0.3%) |
| 5-Person Households | 1,950 (4.3%) | 43 (0.1%) |
| 6-Person Households | 631 (1.4%) | 0 (0.0%) |
| 7+ Person Households | 356 (0.8%) | 0 (0.0%) |
| Total | 26,721 (59.6%) | 18,108 (40.4%) |
Female Fertility in Pennington County
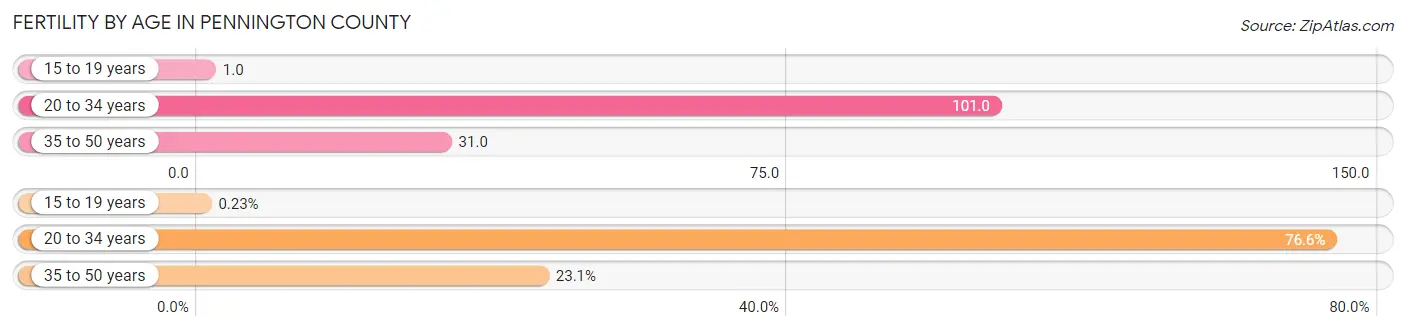
Fertility by Age in Pennington County
Average fertility rate in Pennington County is 58.0 births per 1,000 women. Women in the age bracket of 20 to 34 years have the highest fertility rate with 101.0 births per 1,000 women. Women in the age bracket of 20 to 34 years acount for 76.6% of all women with births.
| Age Bracket | Women with Births | Births / 1,000 Women |
| 15 to 19 years | 3 (0.2%) | 1.0 |
| 20 to 34 years | 994 (76.6%) | 101.0 |
| 35 to 50 years | 300 (23.1%) | 31.0 |
| Total | 1,297 (100.0%) | 58.0 |
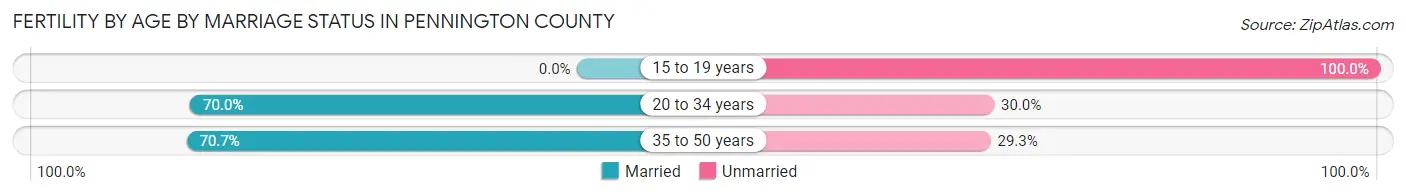
Fertility by Age by Marriage Status in Pennington County
70.0% of women with births (1,297) in Pennington County are married. The highest percentage of unmarried women with births falls into 15 to 19 years age bracket with 100.0% of them unmarried at the time of birth, while the lowest percentage of unmarried women with births belong to 35 to 50 years age bracket with 29.3% of them unmarried.
| Age Bracket | Married | Unmarried |
| 15 to 19 years | 0 (0.0%) | 3 (100.0%) |
| 20 to 34 years | 696 (70.0%) | 298 (30.0%) |
| 35 to 50 years | 212 (70.7%) | 88 (29.3%) |
| Total | 908 (70.0%) | 389 (30.0%) |
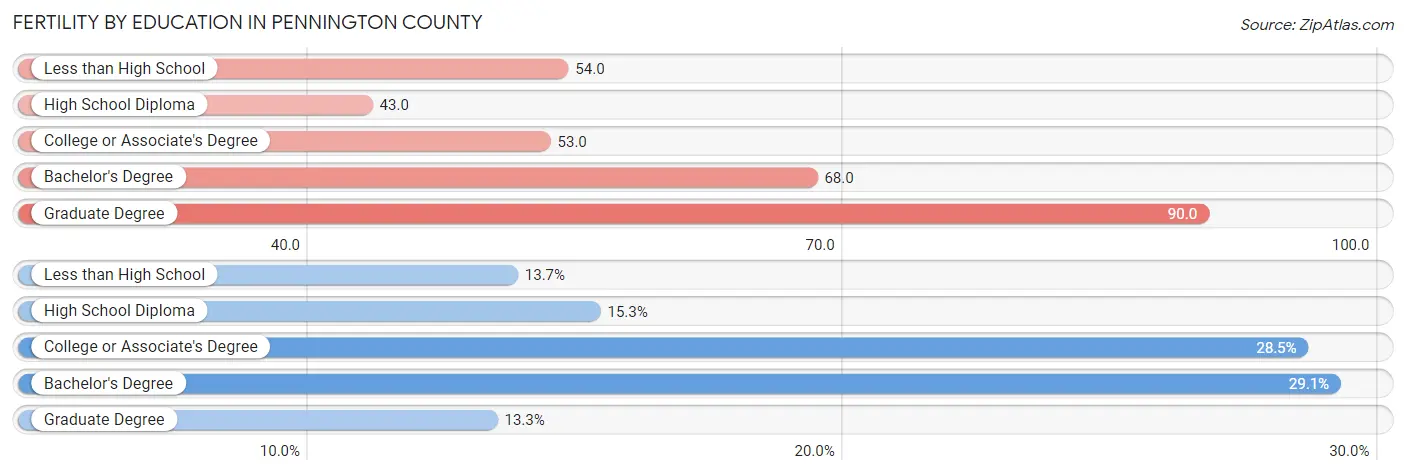
Fertility by Education in Pennington County
Average fertility rate in Pennington County is 58.0 births per 1,000 women. Women with the education attainment of graduate degree have the highest fertility rate of 90.0 births per 1,000 women, while women with the education attainment of high school diploma have the lowest fertility at 43.0 births per 1,000 women. Women with the education attainment of bachelor's degree represent 29.1% of all women with births.
| Educational Attainment | Women with Births | Births / 1,000 Women |
| Less than High School | 178 (13.7%) | 54.0 |
| High School Diploma | 198 (15.3%) | 43.0 |
| College or Associate's Degree | 370 (28.5%) | 53.0 |
| Bachelor's Degree | 378 (29.1%) | 68.0 |
| Graduate Degree | 173 (13.3%) | 90.0 |
| Total | 1,297 (100.0%) | 58.0 |
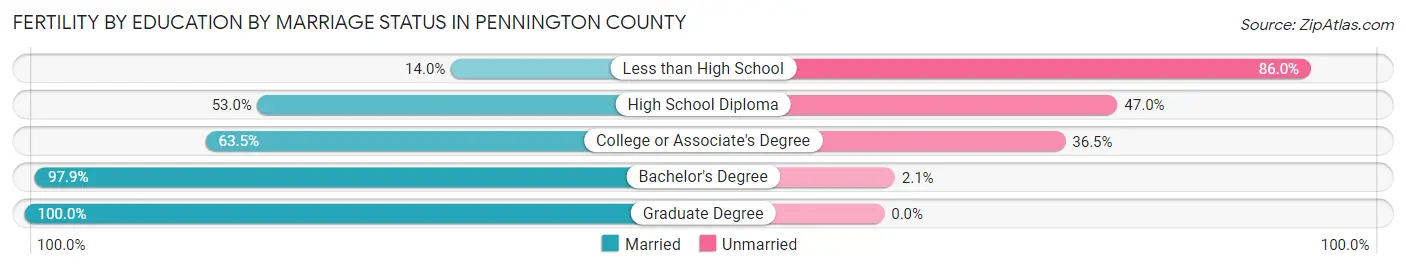
Fertility by Education by Marriage Status in Pennington County
30.0% of women with births in Pennington County are unmarried. Women with the educational attainment of graduate degree are most likely to be married with 100.0% of them married at childbirth, while women with the educational attainment of less than high school are least likely to be married with 86.0% of them unmarried at childbirth.
| Educational Attainment | Married | Unmarried |
| Less than High School | 25 (14.0%) | 153 (86.0%) |
| High School Diploma | 105 (53.0%) | 93 (47.0%) |
| College or Associate's Degree | 235 (63.5%) | 135 (36.5%) |
| Bachelor's Degree | 370 (97.9%) | 8 (2.1%) |
| Graduate Degree | 173 (100.0%) | 0 (0.0%) |
| Total | 908 (70.0%) | 389 (30.0%) |
Income in Pennington County
Income Overview in Pennington County
Per Capita Income in Pennington County is $38,951, while median incomes of families and households are $85,972 and $67,823 respectively.
| Characteristic | Number | Measure |
| Per Capita Income | 110,386 | $38,951 |
| Median Family Income | 26,721 | $85,972 |
| Mean Family Income | 26,721 | $114,356 |
| Median Household Income | 44,829 | $67,823 |
| Mean Household Income | 44,829 | $92,323 |
| Income Deficit | 26,721 | $10,971 |
| Wage / Income Gap (%) | 110,386 | 20.76% |
| Wage / Income Gap ($) | 110,386 | 79.24¢ per $1 |
| Gini / Inequality Index | 110,386 | 0.47 |
Earnings by Sex in Pennington County
Average Earnings in Pennington County are $36,611, $41,380 for men and $32,790 for women, a difference of 20.8%.
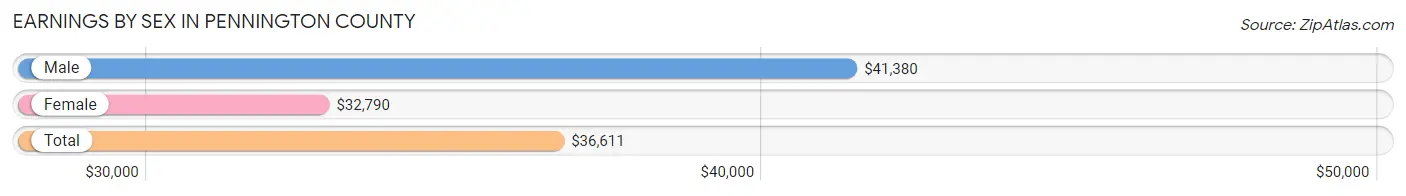
| Sex | Number | Average Earnings |
| Male | 33,641 (54.2%) | $41,380 |
| Female | 28,461 (45.8%) | $32,790 |
| Total | 62,102 (100.0%) | $36,611 |
Earnings by Sex by Income Bracket in Pennington County
The most common earnings brackets in Pennington County are $100,000+ for men (4,658 | 13.9%) and $35,000 to $39,999 for women (2,225 | 7.8%).
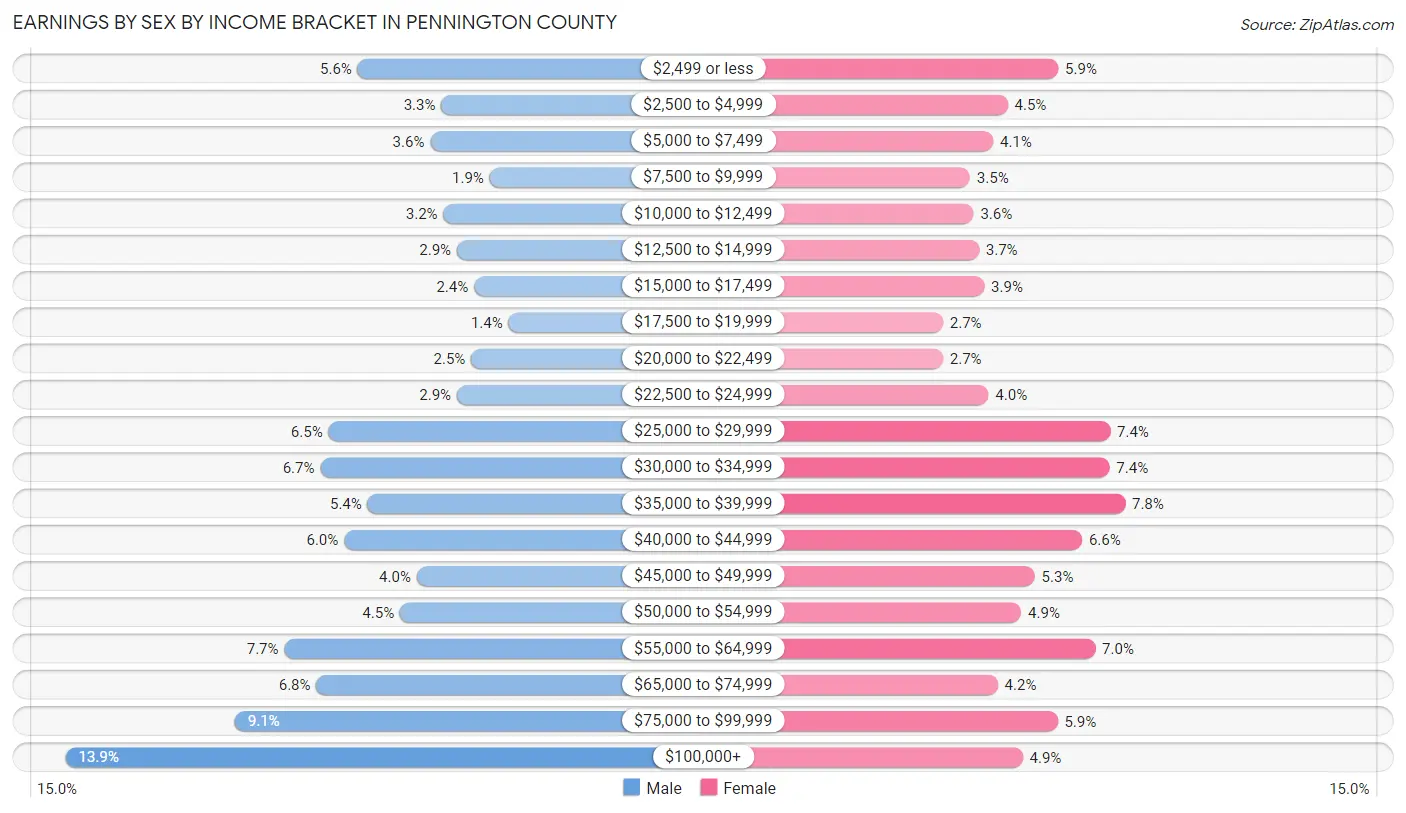
| Income | Male | Female |
| $2,499 or less | 1,896 (5.6%) | 1,690 (5.9%) |
| $2,500 to $4,999 | 1,106 (3.3%) | 1,287 (4.5%) |
| $5,000 to $7,499 | 1,211 (3.6%) | 1,169 (4.1%) |
| $7,500 to $9,999 | 650 (1.9%) | 985 (3.5%) |
| $10,000 to $12,499 | 1,085 (3.2%) | 1,013 (3.6%) |
| $12,500 to $14,999 | 960 (2.9%) | 1,055 (3.7%) |
| $15,000 to $17,499 | 797 (2.4%) | 1,100 (3.9%) |
| $17,500 to $19,999 | 471 (1.4%) | 768 (2.7%) |
| $20,000 to $22,499 | 825 (2.5%) | 768 (2.7%) |
| $22,500 to $24,999 | 958 (2.9%) | 1,132 (4.0%) |
| $25,000 to $29,999 | 2,173 (6.5%) | 2,106 (7.4%) |
| $30,000 to $34,999 | 2,252 (6.7%) | 2,100 (7.4%) |
| $35,000 to $39,999 | 1,804 (5.4%) | 2,225 (7.8%) |
| $40,000 to $44,999 | 2,025 (6.0%) | 1,880 (6.6%) |
| $45,000 to $49,999 | 1,340 (4.0%) | 1,502 (5.3%) |
| $50,000 to $54,999 | 1,496 (4.4%) | 1,394 (4.9%) |
| $55,000 to $64,999 | 2,589 (7.7%) | 1,987 (7.0%) |
| $65,000 to $74,999 | 2,287 (6.8%) | 1,207 (4.2%) |
| $75,000 to $99,999 | 3,058 (9.1%) | 1,686 (5.9%) |
| $100,000+ | 4,658 (13.9%) | 1,407 (4.9%) |
| Total | 33,641 (100.0%) | 28,461 (100.0%) |
Earnings by Sex by Educational Attainment in Pennington County
Average earnings in Pennington County are $49,023 for men and $36,904 for women, a difference of 24.7%. Men with an educational attainment of graduate degree enjoy the highest average annual earnings of $99,911, while those with less than high school education earn the least with $33,788. Women with an educational attainment of graduate degree earn the most with the average annual earnings of $63,969, while those with less than high school education have the smallest earnings of $24,396.
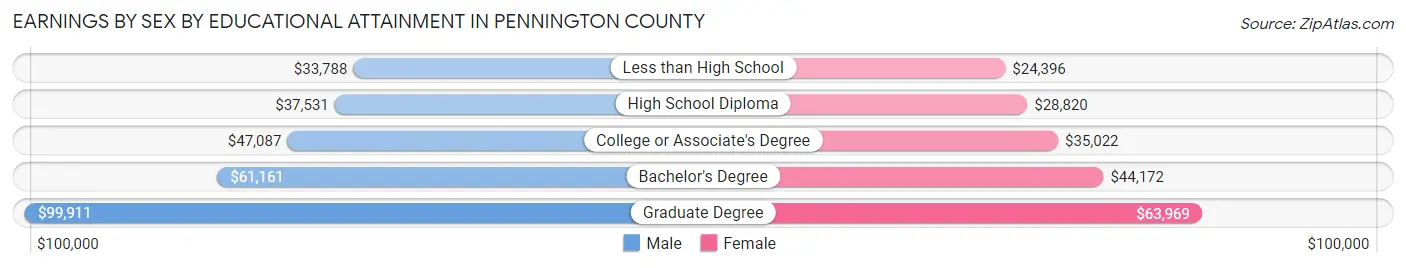
| Educational Attainment | Male Income | Female Income |
| Less than High School | $33,788 | $24,396 |
| High School Diploma | $37,531 | $28,820 |
| College or Associate's Degree | $47,087 | $35,022 |
| Bachelor's Degree | $61,161 | $44,172 |
| Graduate Degree | $99,911 | $63,969 |
| Total | $49,023 | $36,904 |
Family Income in Pennington County
Family Income Brackets in Pennington County
According to the Pennington County family income data, there are 5,745 families falling into the $100,000 to $149,999 income range, which is the most common income bracket and makes up 21.5% of all families. Conversely, the $10,000 to $14,999 income bracket is the least frequent group with only 374 families (1.4%) belonging to this category.
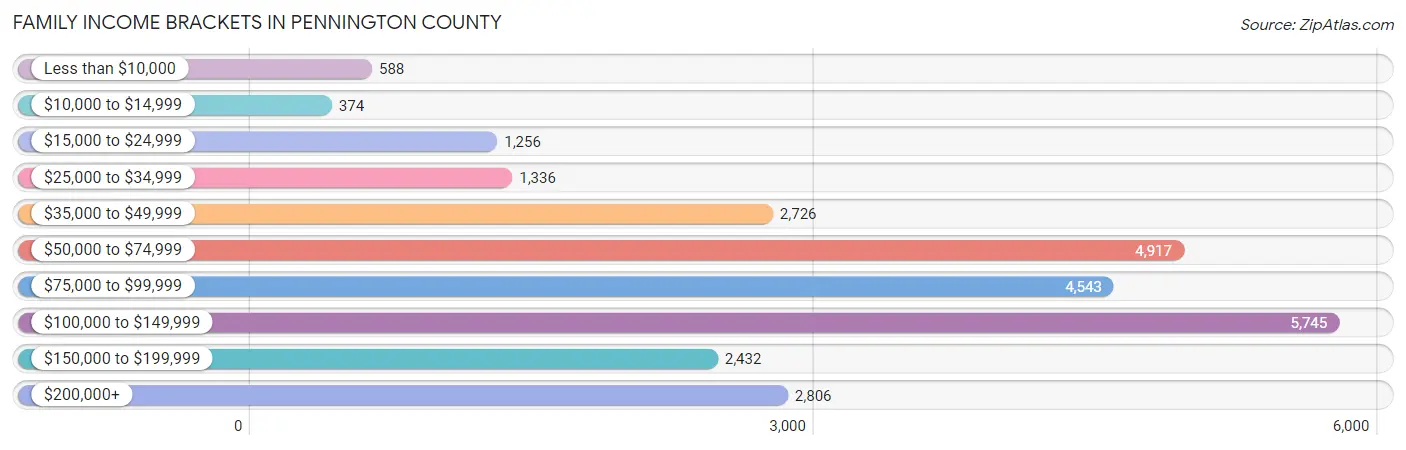
| Income Bracket | # Families | % Families |
| Less than $10,000 | 588 | 2.2% |
| $10,000 to $14,999 | 374 | 1.4% |
| $15,000 to $24,999 | 1,256 | 4.7% |
| $25,000 to $34,999 | 1,336 | 5.0% |
| $35,000 to $49,999 | 2,726 | 10.2% |
| $50,000 to $74,999 | 4,917 | 18.4% |
| $75,000 to $99,999 | 4,543 | 17.0% |
| $100,000 to $149,999 | 5,745 | 21.5% |
| $150,000 to $199,999 | 2,432 | 9.1% |
| $200,000+ | 2,806 | 10.5% |
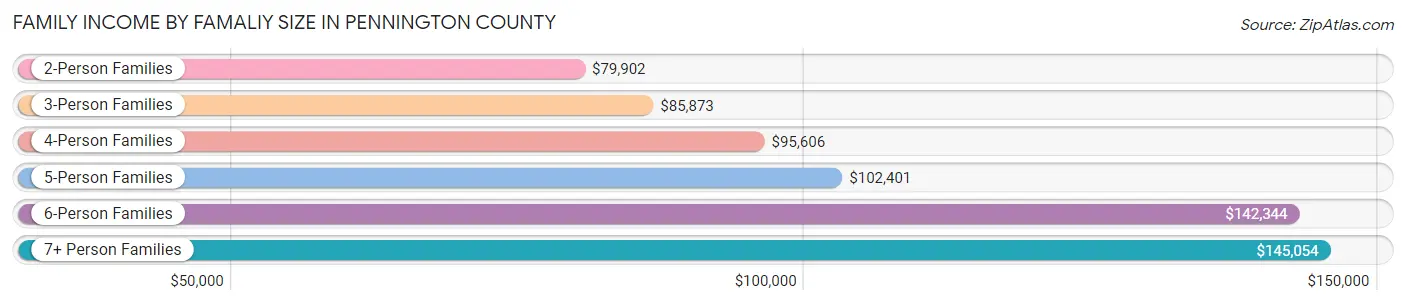
Family Income by Famaliy Size in Pennington County
7+ person families (249 | 0.9%) account for the highest median family income in Pennington County with $145,054 per family, while 2-person families (14,505 | 54.3%) have the highest median income of $39,951 per family member.
| Income Bracket | # Families | Median Income |
| 2-Person Families | 14,505 (54.3%) | $79,902 |
| 3-Person Families | 5,030 (18.8%) | $85,873 |
| 4-Person Families | 4,641 (17.4%) | $95,606 |
| 5-Person Families | 1,752 (6.6%) | $102,401 |
| 6-Person Families | 544 (2.0%) | $142,344 |
| 7+ Person Families | 249 (0.9%) | $145,054 |
| Total | 26,721 (100.0%) | $85,972 |
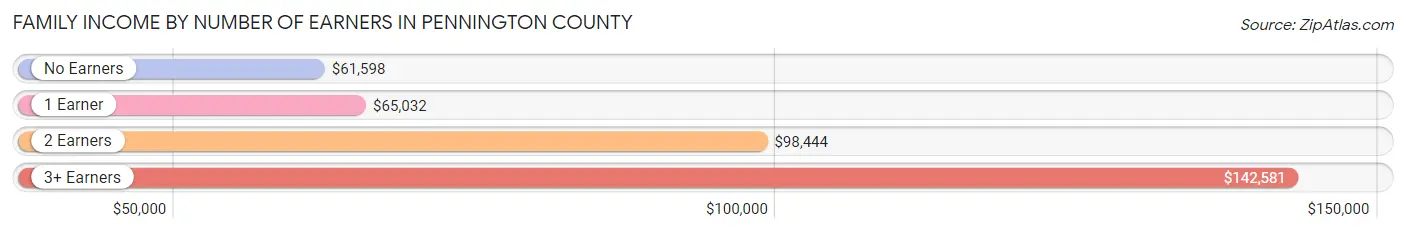
Family Income by Number of Earners in Pennington County
The median family income in Pennington County is $85,972, with families comprising 3+ earners (2,822) having the highest median family income of $142,581, while families with no earners (4,398) have the lowest median family income of $61,598, accounting for 10.6% and 16.5% of families, respectively.
| Number of Earners | # Families | Median Income |
| No Earners | 4,398 (16.5%) | $61,598 |
| 1 Earner | 7,078 (26.5%) | $65,032 |
| 2 Earners | 12,423 (46.5%) | $98,444 |
| 3+ Earners | 2,822 (10.6%) | $142,581 |
| Total | 26,721 (100.0%) | $85,972 |
Household Income in Pennington County
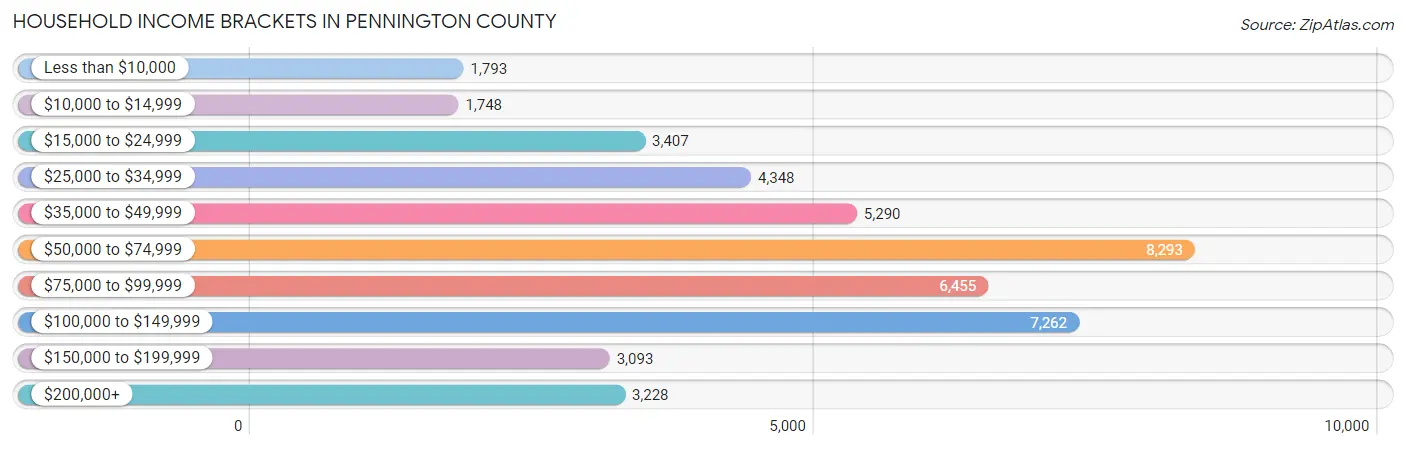
Household Income Brackets in Pennington County
With 8,293 households falling in the category, the $50,000 to $74,999 income range is the most frequent in Pennington County, accounting for 18.5% of all households. In contrast, only 1,748 households (3.9%) fall into the $10,000 to $14,999 income bracket, making it the least populous group.
| Income Bracket | # Households | % Households |
| Less than $10,000 | 1,793 | 4.0% |
| $10,000 to $14,999 | 1,748 | 3.9% |
| $15,000 to $24,999 | 3,407 | 7.6% |
| $25,000 to $34,999 | 4,348 | 9.7% |
| $35,000 to $49,999 | 5,290 | 11.8% |
| $50,000 to $74,999 | 8,293 | 18.5% |
| $75,000 to $99,999 | 6,455 | 14.4% |
| $100,000 to $149,999 | 7,262 | 16.2% |
| $150,000 to $199,999 | 3,093 | 6.9% |
| $200,000+ | 3,228 | 7.2% |
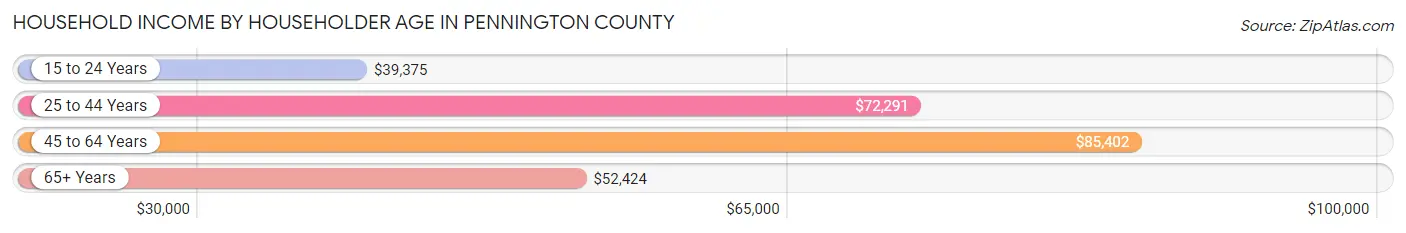
Household Income by Householder Age in Pennington County
The median household income in Pennington County is $67,823, with the highest median household income of $85,402 found in the 45 to 64 years age bracket for the primary householder. A total of 15,560 households (34.7%) fall into this category. Meanwhile, the 15 to 24 years age bracket for the primary householder has the lowest median household income of $39,375, with 2,433 households (5.4%) in this group.
| Income Bracket | # Households | Median Income |
| 15 to 24 Years | 2,433 (5.4%) | $39,375 |
| 25 to 44 Years | 13,549 (30.2%) | $72,291 |
| 45 to 64 Years | 15,560 (34.7%) | $85,402 |
| 65+ Years | 13,287 (29.6%) | $52,424 |
| Total | 44,829 (100.0%) | $67,823 |
Poverty in Pennington County
Income Below Poverty by Sex and Age in Pennington County
With 10.2% poverty level for males and 14.4% for females among the residents of Pennington County, 5 year old males and under 5 year old females are the most vulnerable to poverty, with 162 males (27.6%) and 757 females (23.5%) in their respective age groups living below the poverty level.
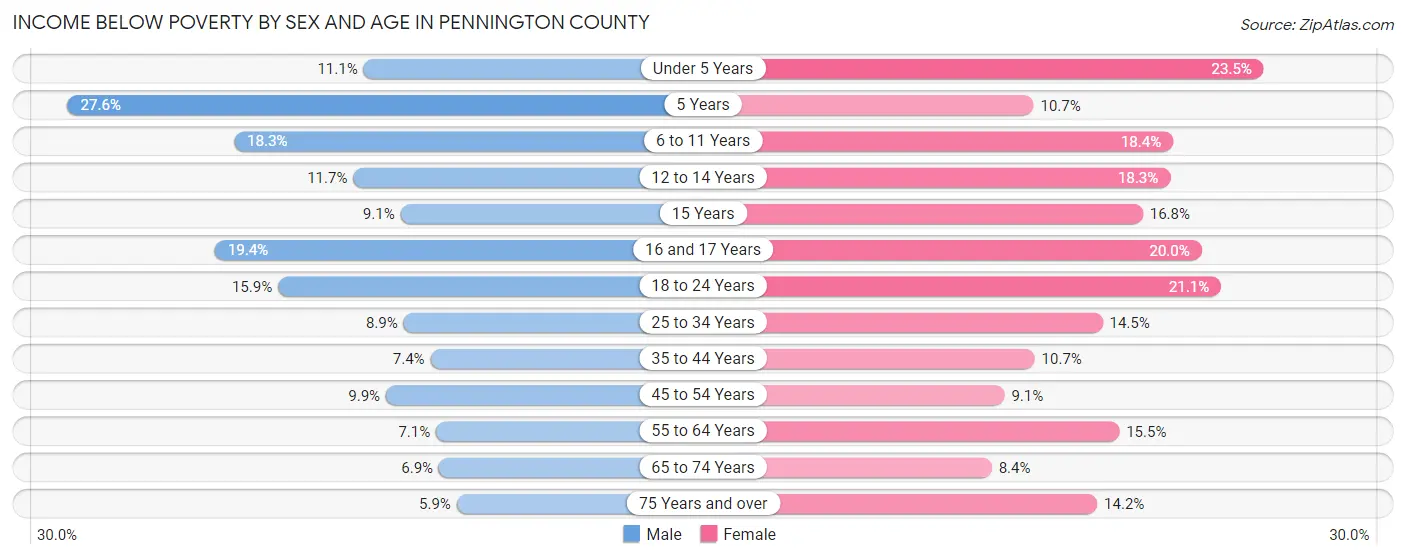
| Age Bracket | Male | Female |
| Under 5 Years | 370 (11.1%) | 757 (23.5%) |
| 5 Years | 162 (27.6%) | 90 (10.7%) |
| 6 to 11 Years | 800 (18.3%) | 654 (18.4%) |
| 12 to 14 Years | 242 (11.7%) | 356 (18.3%) |
| 15 Years | 76 (9.1%) | 90 (16.8%) |
| 16 and 17 Years | 260 (19.4%) | 275 (20.0%) |
| 18 to 24 Years | 743 (15.9%) | 818 (21.1%) |
| 25 to 34 Years | 642 (8.9%) | 987 (14.5%) |
| 35 to 44 Years | 472 (7.4%) | 672 (10.7%) |
| 45 to 54 Years | 593 (9.9%) | 528 (9.1%) |
| 55 to 64 Years | 553 (7.1%) | 1,216 (15.4%) |
| 65 to 74 Years | 460 (6.9%) | 542 (8.4%) |
| 75 Years and over | 186 (5.9%) | 594 (14.2%) |
| Total | 5,559 (10.2%) | 7,579 (14.4%) |
Income Above Poverty by Sex and Age in Pennington County
According to the poverty statistics in Pennington County, males aged 75 years and over and females aged 65 to 74 years are the age groups that are most secure financially, with 94.1% of males and 91.6% of females in these age groups living above the poverty line.
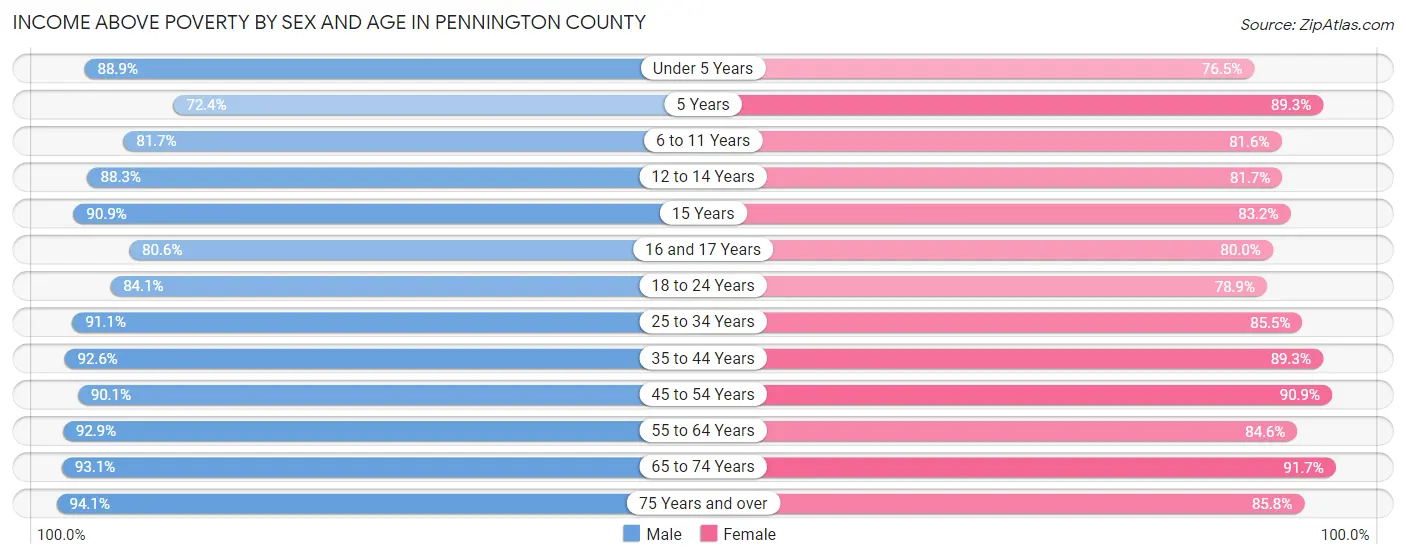
| Age Bracket | Male | Female |
| Under 5 Years | 2,953 (88.9%) | 2,465 (76.5%) |
| 5 Years | 425 (72.4%) | 753 (89.3%) |
| 6 to 11 Years | 3,564 (81.7%) | 2,893 (81.6%) |
| 12 to 14 Years | 1,826 (88.3%) | 1,591 (81.7%) |
| 15 Years | 762 (90.9%) | 447 (83.2%) |
| 16 and 17 Years | 1,080 (80.6%) | 1,098 (80.0%) |
| 18 to 24 Years | 3,932 (84.1%) | 3,056 (78.9%) |
| 25 to 34 Years | 6,569 (91.1%) | 5,809 (85.5%) |
| 35 to 44 Years | 5,903 (92.6%) | 5,584 (89.3%) |
| 45 to 54 Years | 5,408 (90.1%) | 5,299 (90.9%) |
| 55 to 64 Years | 7,249 (92.9%) | 6,654 (84.6%) |
| 65 to 74 Years | 6,175 (93.1%) | 5,946 (91.6%) |
| 75 Years and over | 2,944 (94.1%) | 3,582 (85.8%) |
| Total | 48,790 (89.8%) | 45,177 (85.6%) |
Income Below Poverty Among Married-Couple Families in Pennington County
The poverty statistics for married-couple families in Pennington County show that 2.9% or 606 of the total 20,853 families live below the poverty line. Families with 5 or more children have the highest poverty rate of 30.4%, comprising of 48 families. On the other hand, families with 1 or 2 children have the lowest poverty rate of 2.0%, which includes 114 families.
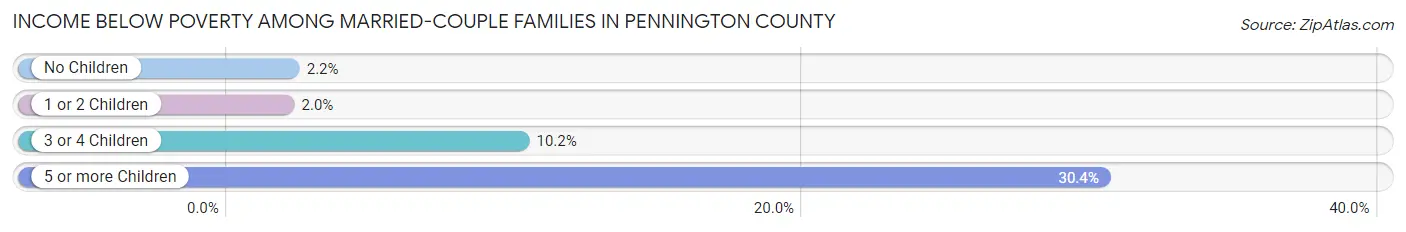
| Children | Above Poverty | Below Poverty |
| No Children | 13,088 (97.9%) | 287 (2.1%) |
| 1 or 2 Children | 5,659 (98.0%) | 114 (2.0%) |
| 3 or 4 Children | 1,390 (89.8%) | 157 (10.2%) |
| 5 or more Children | 110 (69.6%) | 48 (30.4%) |
| Total | 20,247 (97.1%) | 606 (2.9%) |
Income Below Poverty Among Single-Parent Households in Pennington County
According to the poverty data in Pennington County, 11.5% or 212 single-father households and 30.5% or 1,231 single-mother households are living below the poverty line. Among single-father households, those with 3 or 4 children have the highest poverty rate, with 40 households (20.4%) experiencing poverty. Likewise, among single-mother households, those with 3 or 4 children have the highest poverty rate, with 475 households (71.8%) falling below the poverty line.
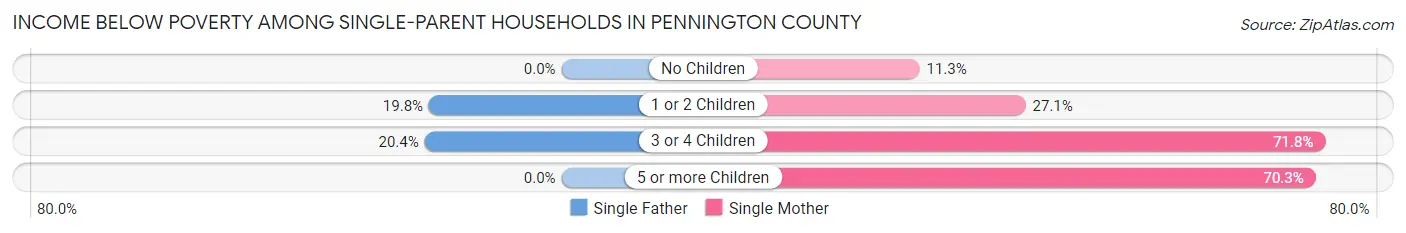
| Children | Single Father | Single Mother |
| No Children | 0 (0.0%) | 132 (11.3%) |
| 1 or 2 Children | 172 (19.8%) | 579 (27.1%) |
| 3 or 4 Children | 40 (20.4%) | 475 (71.8%) |
| 5 or more Children | 0 (0.0%) | 45 (70.3%) |
| Total | 212 (11.5%) | 1,231 (30.5%) |
Income Below Poverty Among Married-Couple vs Single-Parent Households in Pennington County
The poverty data for Pennington County shows that 606 of the married-couple family households (2.9%) and 1,443 of the single-parent households (24.6%) are living below the poverty level. Within the married-couple family households, those with 5 or more children have the highest poverty rate, with 48 households (30.4%) falling below the poverty line. Among the single-parent households, those with 5 or more children have the highest poverty rate, with 45 household (70.3%) living below poverty.
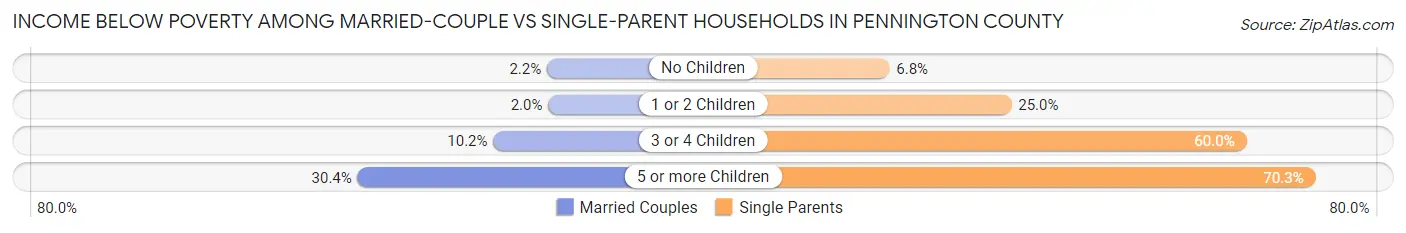
| Children | Married-Couple Families | Single-Parent Households |
| No Children | 287 (2.1%) | 132 (6.8%) |
| 1 or 2 Children | 114 (2.0%) | 751 (25.0%) |
| 3 or 4 Children | 157 (10.2%) | 515 (60.0%) |
| 5 or more Children | 48 (30.4%) | 45 (70.3%) |
| Total | 606 (2.9%) | 1,443 (24.6%) |
Employment Characteristics in Pennington County
Employment by Class of Employer in Pennington County
Among the 54,623 employed individuals in Pennington County, private company employees (32,286 | 59.1%), not-for-profit organizations (6,398 | 11.7%), and local government employees (4,033 | 7.4%) make up the most common classes of employment.
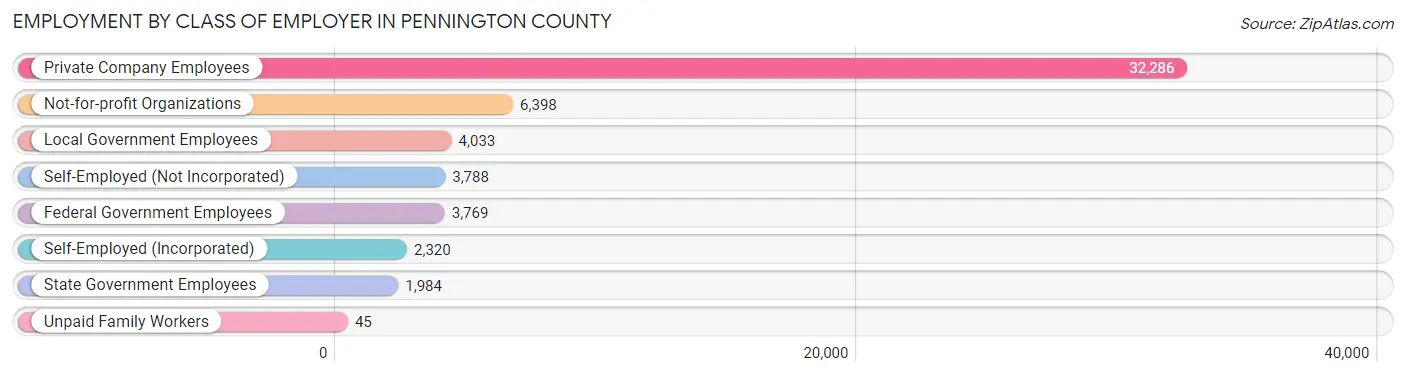
| Employer Class | # Employees | % Employees |
| Private Company Employees | 32,286 | 59.1% |
| Self-Employed (Incorporated) | 2,320 | 4.3% |
| Self-Employed (Not Incorporated) | 3,788 | 6.9% |
| Not-for-profit Organizations | 6,398 | 11.7% |
| Local Government Employees | 4,033 | 7.4% |
| State Government Employees | 1,984 | 3.6% |
| Federal Government Employees | 3,769 | 6.9% |
| Unpaid Family Workers | 45 | 0.1% |
| Total | 54,623 | 100.0% |
Employment Status by Age in Pennington County
According to the labor force statistics for Pennington County, out of the total population over 16 years of age (88,521), 64.9% or 57,450 individuals are in the labor force, with 3.5% or 2,011 of them unemployed. The age group with the highest labor force participation rate is 30 to 34 years, with 85.9% or 6,187 individuals in the labor force. Within the labor force, the 16 to 19 years age range has the highest percentage of unemployed individuals, with 14.1% or 432 of them being unemployed.
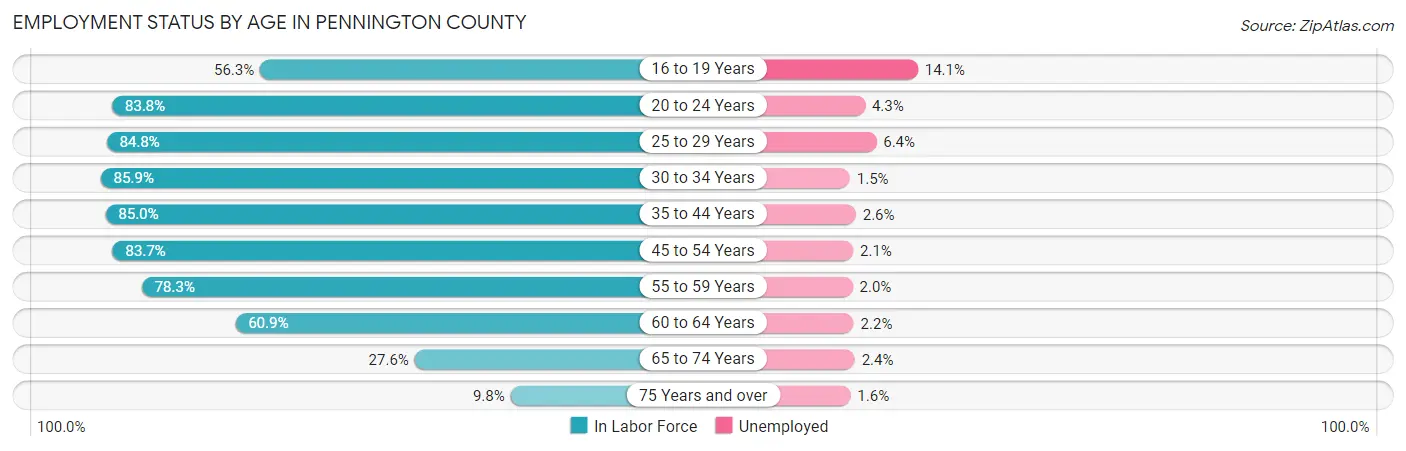
| Age Bracket | In Labor Force | Unemployed |
| 16 to 19 Years | 3,066 (56.3%) | 432 (14.1%) |
| 20 to 24 Years | 5,678 (83.8%) | 244 (4.3%) |
| 25 to 29 Years | 6,128 (84.8%) | 392 (6.4%) |
| 30 to 34 Years | 6,187 (85.9%) | 93 (1.5%) |
| 35 to 44 Years | 11,036 (85.0%) | 287 (2.6%) |
| 45 to 54 Years | 10,051 (83.7%) | 211 (2.1%) |
| 55 to 59 Years | 5,743 (78.3%) | 115 (2.0%) |
| 60 to 64 Years | 5,127 (60.9%) | 113 (2.2%) |
| 65 to 74 Years | 3,660 (27.6%) | 88 (2.4%) |
| 75 Years and over | 771 (9.8%) | 12 (1.6%) |
| Total | 57,450 (64.9%) | 2,011 (3.5%) |
Employment Status by Educational Attainment in Pennington County
According to labor force statistics for Pennington County, 80.3% of individuals (44,305) out of the total population between 25 and 64 years of age (55,174) are in the labor force, with 2.7% or 1,196 of them being unemployed. The group with the highest labor force participation rate are those with the educational attainment of bachelor's degree or higher, with 88.6% or 16,458 individuals in the labor force. Within the labor force, individuals with less than high school education have the highest percentage of unemployment, with 5.2% or 102 of them being unemployed.
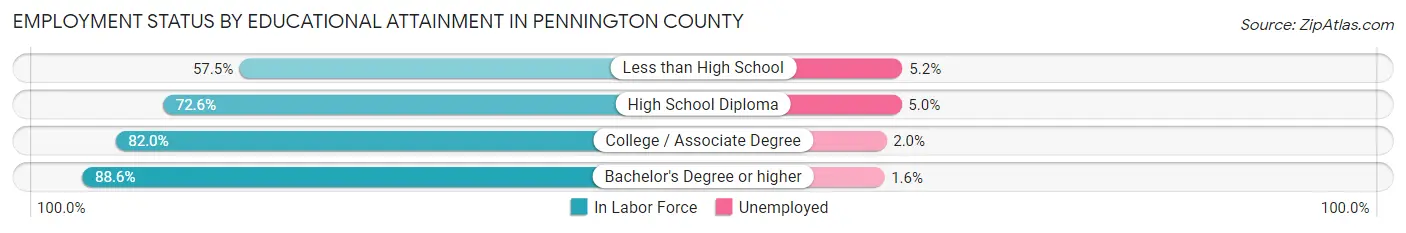
| Educational Attainment | In Labor Force | Unemployed |
| Less than High School | 1,967 (57.5%) | 178 (5.2%) |
| High School Diploma | 10,518 (72.6%) | 724 (5.0%) |
| College / Associate Degree | 15,325 (82.0%) | 374 (2.0%) |
| Bachelor's Degree or higher | 16,458 (88.6%) | 297 (1.6%) |
| Total | 44,305 (80.3%) | 1,490 (2.7%) |
Employment Occupations by Sex in Pennington County
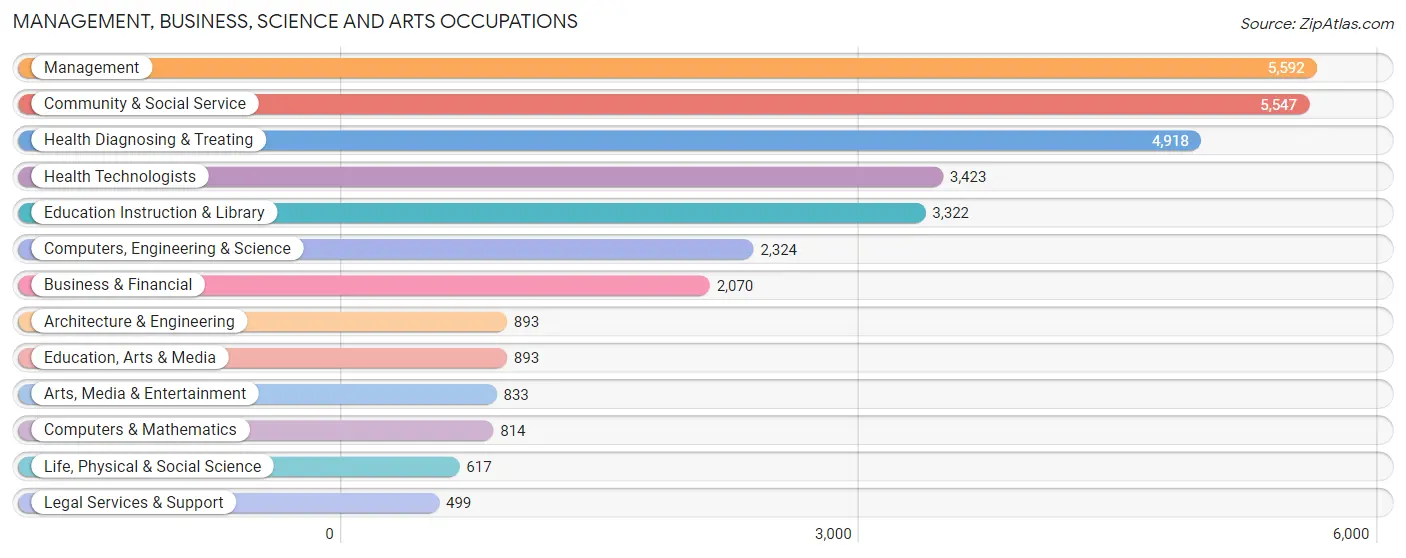
Management, Business, Science and Arts Occupations
The most common Management, Business, Science and Arts occupations in Pennington County are Management (5,592 | 10.3%), Community & Social Service (5,547 | 10.2%), Health Diagnosing & Treating (4,918 | 9.1%), Health Technologists (3,423 | 6.3%), and Education Instruction & Library (3,322 | 6.1%).
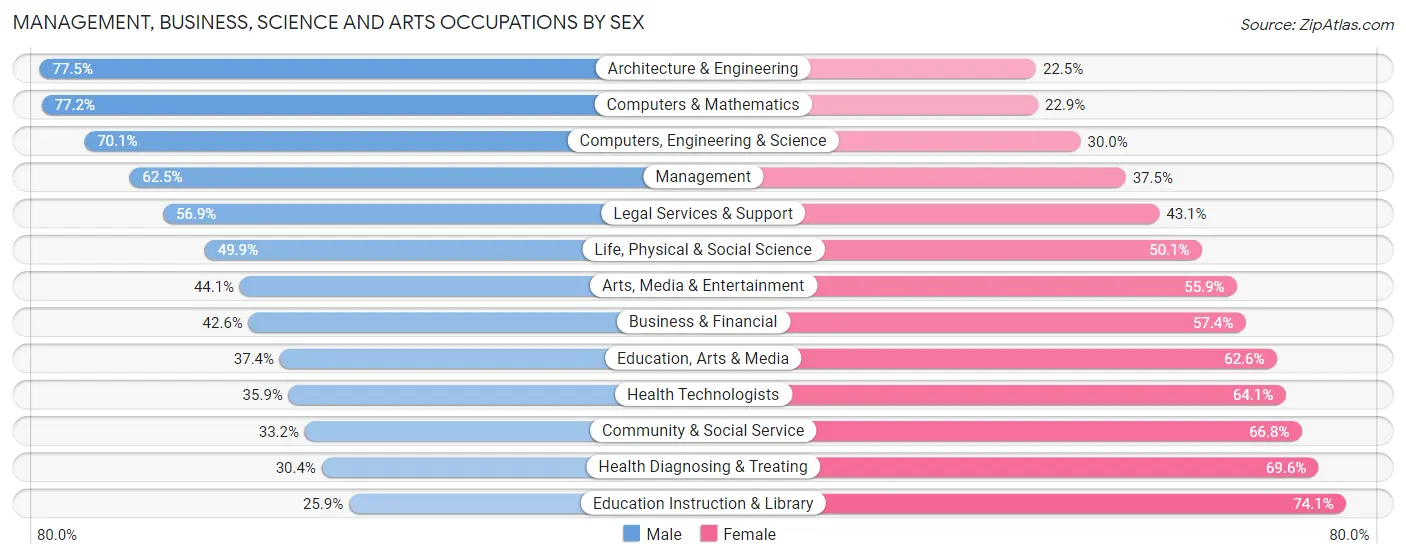
Management, Business, Science and Arts Occupations by Sex
Within the Management, Business, Science and Arts occupations in Pennington County, the most male-oriented occupations are Architecture & Engineering (77.5%), Computers & Mathematics (77.1%), and Computers, Engineering & Science (70.1%), while the most female-oriented occupations are Education Instruction & Library (74.1%), Health Diagnosing & Treating (69.6%), and Community & Social Service (66.8%).
| Occupation | Male | Female |
| Management | 3,496 (62.5%) | 2,096 (37.5%) |
| Business & Financial | 882 (42.6%) | 1,188 (57.4%) |
| Computers, Engineering & Science | 1,628 (70.1%) | 696 (29.9%) |
| Computers & Mathematics | 628 (77.1%) | 186 (22.9%) |
| Architecture & Engineering | 692 (77.5%) | 201 (22.5%) |
| Life, Physical & Social Science | 308 (49.9%) | 309 (50.1%) |
| Community & Social Service | 1,844 (33.2%) | 3,703 (66.8%) |
| Education, Arts & Media | 334 (37.4%) | 559 (62.6%) |
| Legal Services & Support | 284 (56.9%) | 215 (43.1%) |
| Education Instruction & Library | 859 (25.9%) | 2,463 (74.1%) |
| Arts, Media & Entertainment | 367 (44.1%) | 466 (55.9%) |
| Health Diagnosing & Treating | 1,496 (30.4%) | 3,422 (69.6%) |
| Health Technologists | 1,230 (35.9%) | 2,193 (64.1%) |
| Total (Category) | 9,346 (45.7%) | 11,105 (54.3%) |
| Total (Overall) | 28,502 (52.5%) | 25,808 (47.5%) |
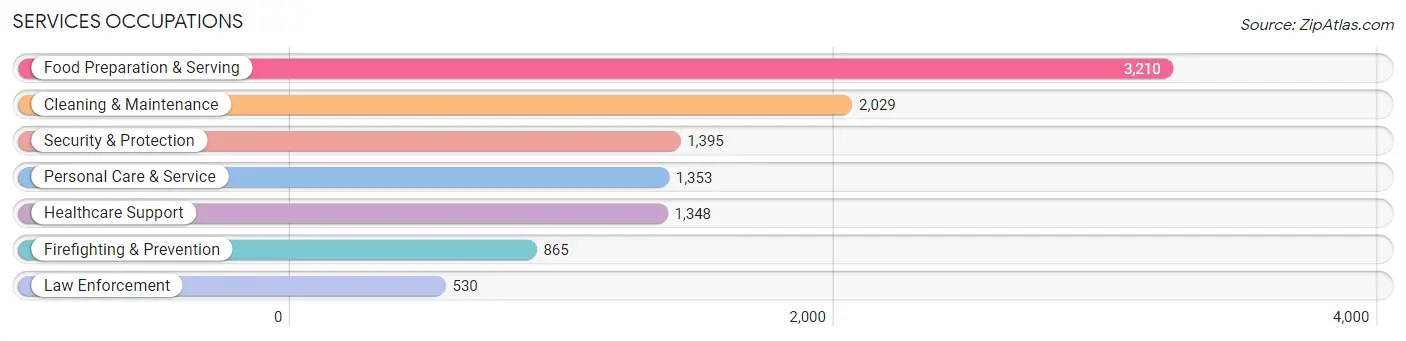
Services Occupations
The most common Services occupations in Pennington County are Food Preparation & Serving (3,210 | 5.9%), Cleaning & Maintenance (2,029 | 3.7%), Security & Protection (1,395 | 2.6%), Personal Care & Service (1,353 | 2.5%), and Healthcare Support (1,348 | 2.5%).
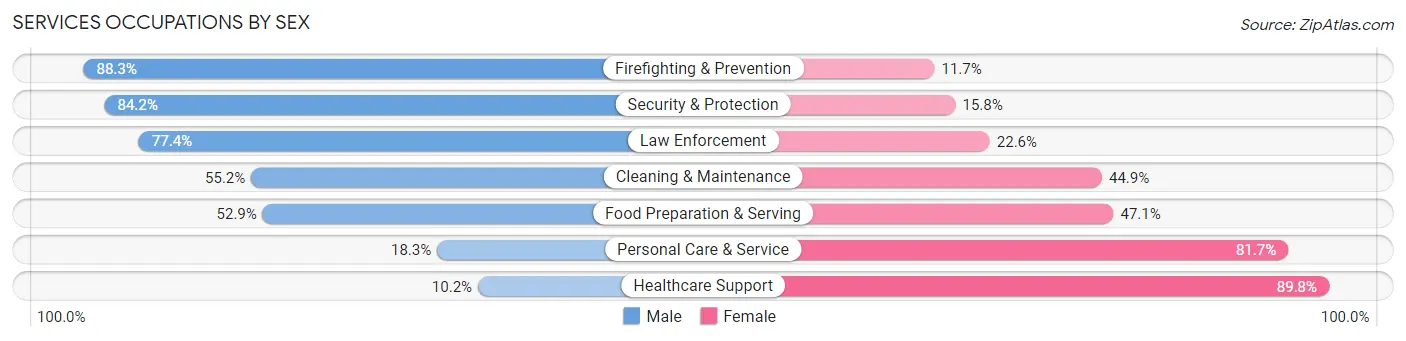
Services Occupations by Sex
Within the Services occupations in Pennington County, the most male-oriented occupations are Firefighting & Prevention (88.3%), Security & Protection (84.2%), and Law Enforcement (77.4%), while the most female-oriented occupations are Healthcare Support (89.8%), Personal Care & Service (81.7%), and Food Preparation & Serving (47.1%).
| Occupation | Male | Female |
| Healthcare Support | 138 (10.2%) | 1,210 (89.8%) |
| Security & Protection | 1,174 (84.2%) | 221 (15.8%) |
| Firefighting & Prevention | 764 (88.3%) | 101 (11.7%) |
| Law Enforcement | 410 (77.4%) | 120 (22.6%) |
| Food Preparation & Serving | 1,697 (52.9%) | 1,513 (47.1%) |
| Cleaning & Maintenance | 1,119 (55.1%) | 910 (44.9%) |
| Personal Care & Service | 248 (18.3%) | 1,105 (81.7%) |
| Total (Category) | 4,376 (46.9%) | 4,959 (53.1%) |
| Total (Overall) | 28,502 (52.5%) | 25,808 (47.5%) |
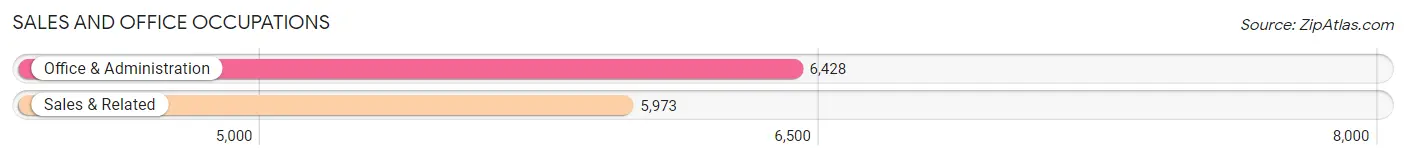
Sales and Office Occupations
The most common Sales and Office occupations in Pennington County are Office & Administration (6,428 | 11.8%), and Sales & Related (5,973 | 11.0%).
Sales and Office Occupations by Sex
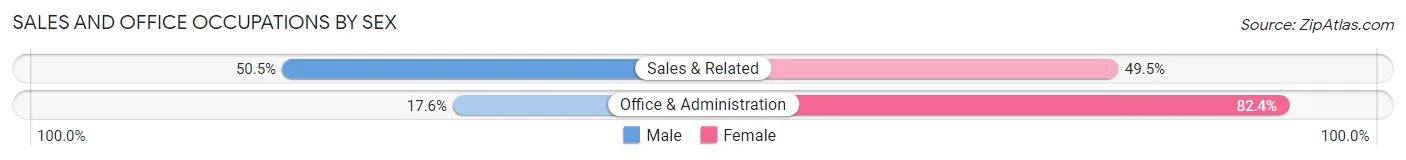
| Occupation | Male | Female |
| Sales & Related | 3,017 (50.5%) | 2,956 (49.5%) |
| Office & Administration | 1,134 (17.6%) | 5,294 (82.4%) |
| Total (Category) | 4,151 (33.5%) | 8,250 (66.5%) |
| Total (Overall) | 28,502 (52.5%) | 25,808 (47.5%) |
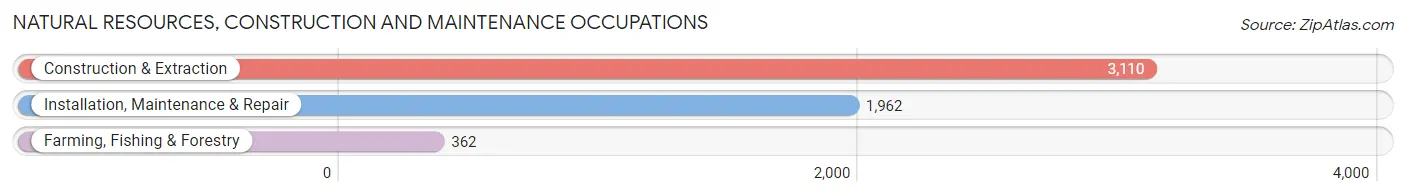
Natural Resources, Construction and Maintenance Occupations
The most common Natural Resources, Construction and Maintenance occupations in Pennington County are Construction & Extraction (3,110 | 5.7%), Installation, Maintenance & Repair (1,962 | 3.6%), and Farming, Fishing & Forestry (362 | 0.7%).
Natural Resources, Construction and Maintenance Occupations by Sex
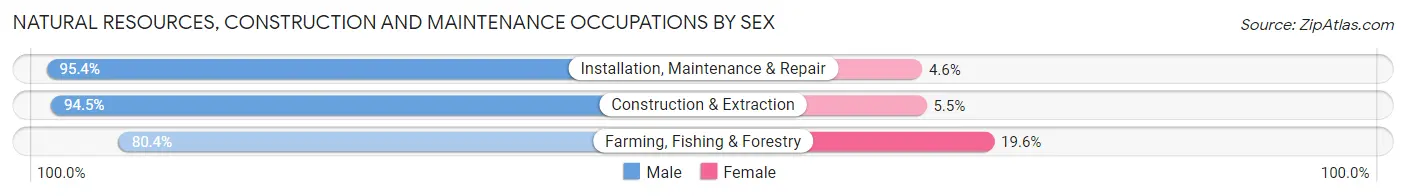
| Occupation | Male | Female |
| Farming, Fishing & Forestry | 291 (80.4%) | 71 (19.6%) |
| Construction & Extraction | 2,938 (94.5%) | 172 (5.5%) |
| Installation, Maintenance & Repair | 1,872 (95.4%) | 90 (4.6%) |
| Total (Category) | 5,101 (93.9%) | 333 (6.1%) |
| Total (Overall) | 28,502 (52.5%) | 25,808 (47.5%) |
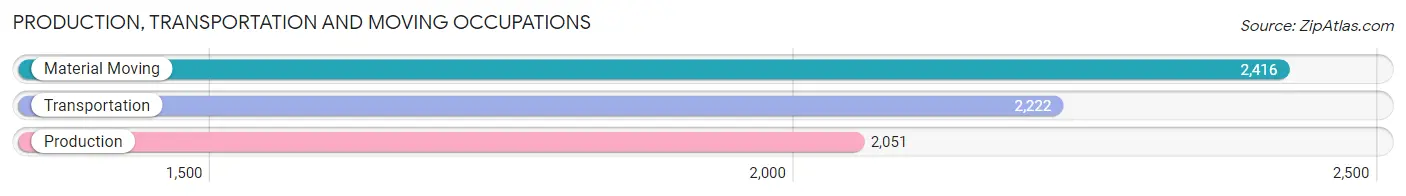
Production, Transportation and Moving Occupations
The most common Production, Transportation and Moving occupations in Pennington County are Material Moving (2,416 | 4.4%), Transportation (2,222 | 4.1%), and Production (2,051 | 3.8%).
Production, Transportation and Moving Occupations by Sex
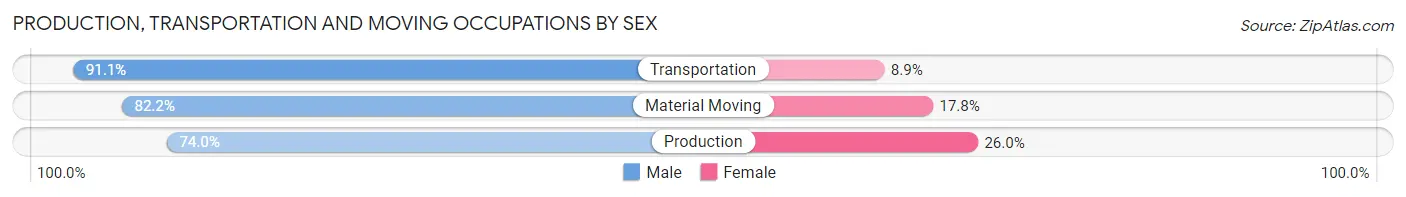
| Occupation | Male | Female |
| Production | 1,517 (74.0%) | 534 (26.0%) |
| Transportation | 2,025 (91.1%) | 197 (8.9%) |
| Material Moving | 1,986 (82.2%) | 430 (17.8%) |
| Total (Category) | 5,528 (82.6%) | 1,161 (17.4%) |
| Total (Overall) | 28,502 (52.5%) | 25,808 (47.5%) |
Employment Industries by Sex in Pennington County
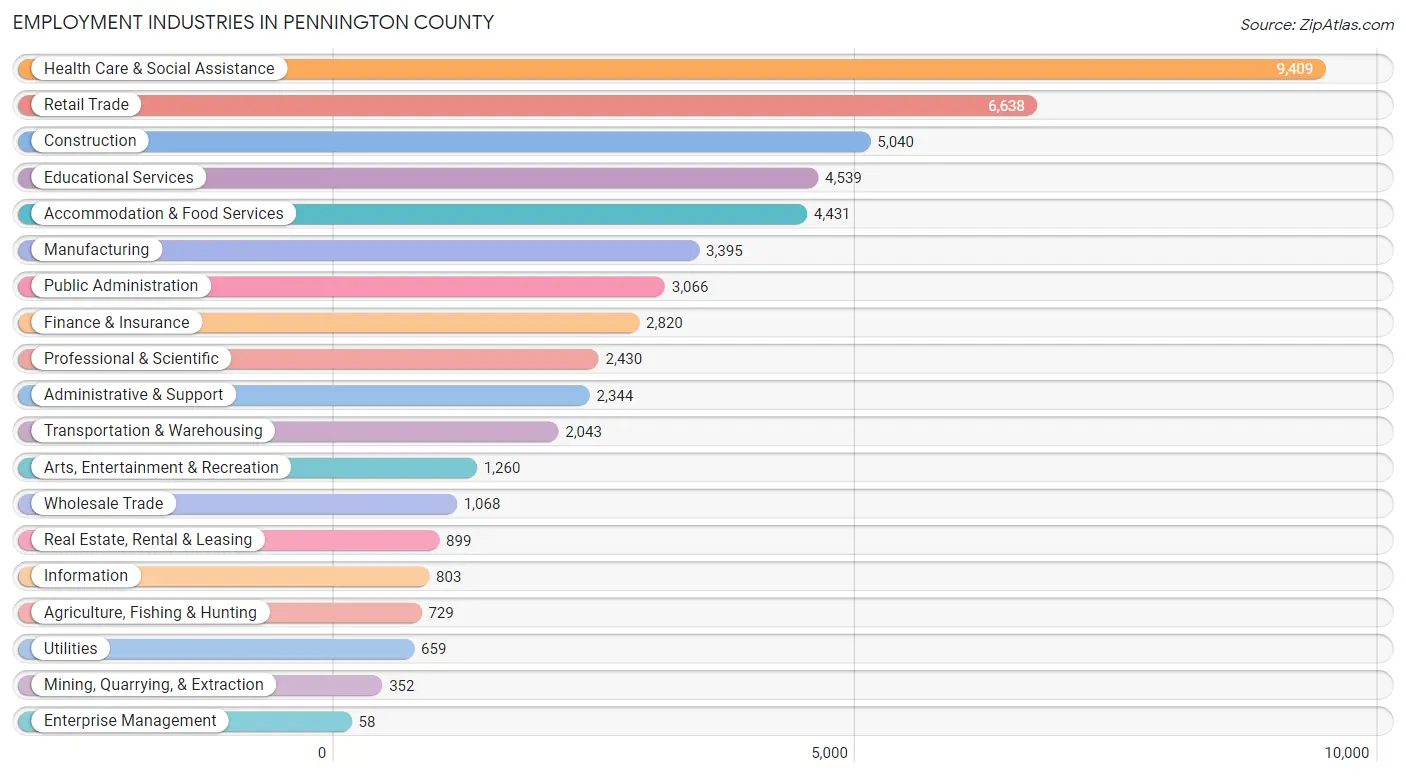
Employment Industries in Pennington County
The major employment industries in Pennington County include Health Care & Social Assistance (9,409 | 17.3%), Retail Trade (6,638 | 12.2%), Construction (5,040 | 9.3%), Educational Services (4,539 | 8.4%), and Accommodation & Food Services (4,431 | 8.2%).
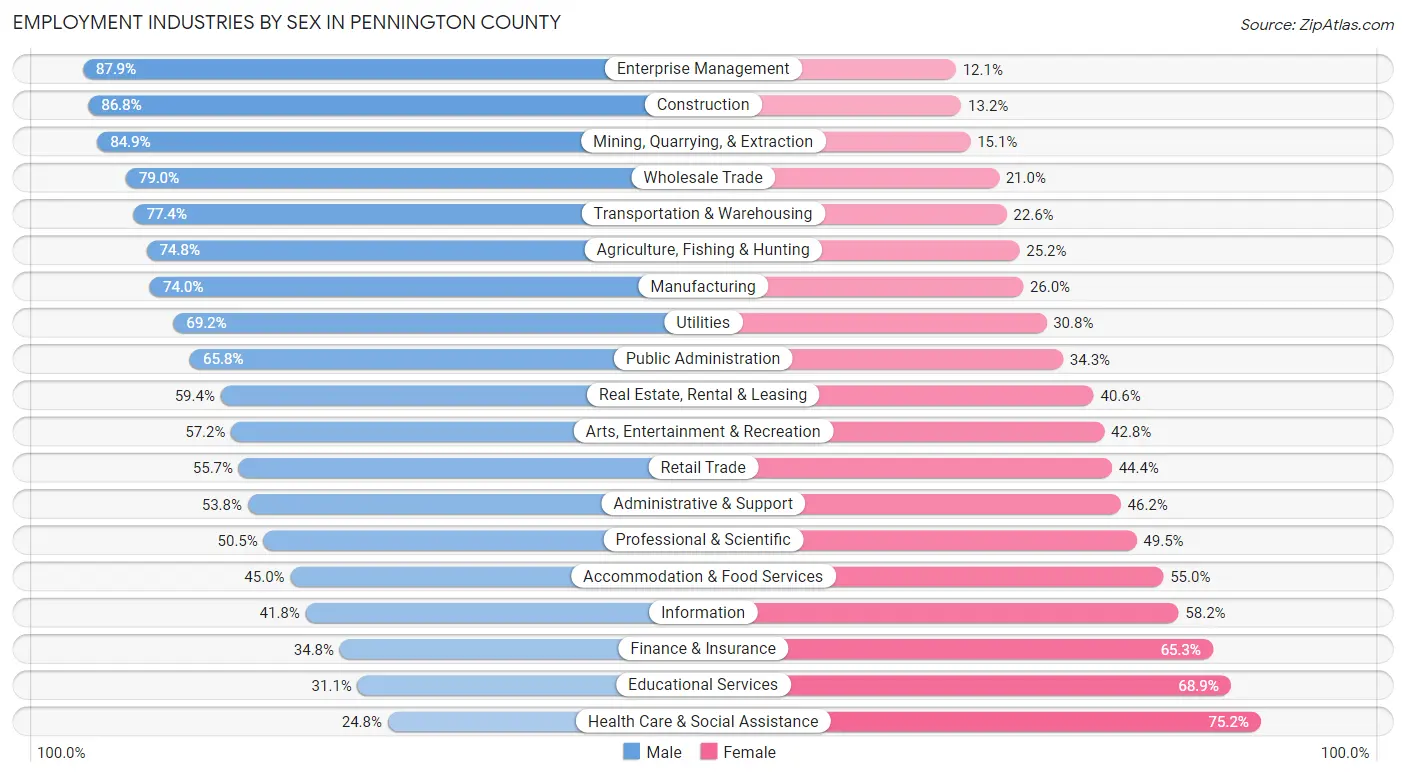
Employment Industries by Sex in Pennington County
The Pennington County industries that see more men than women are Enterprise Management (87.9%), Construction (86.8%), and Mining, Quarrying, & Extraction (84.9%), whereas the industries that tend to have a higher number of women are Health Care & Social Assistance (75.2%), Educational Services (68.9%), and Finance & Insurance (65.2%).
| Industry | Male | Female |
| Agriculture, Fishing & Hunting | 545 (74.8%) | 184 (25.2%) |
| Mining, Quarrying, & Extraction | 299 (84.9%) | 53 (15.1%) |
| Construction | 4,375 (86.8%) | 665 (13.2%) |
| Manufacturing | 2,513 (74.0%) | 882 (26.0%) |
| Wholesale Trade | 844 (79.0%) | 224 (21.0%) |
| Retail Trade | 3,694 (55.6%) | 2,944 (44.4%) |
| Transportation & Warehousing | 1,582 (77.4%) | 461 (22.6%) |
| Utilities | 456 (69.2%) | 203 (30.8%) |
| Information | 336 (41.8%) | 467 (58.2%) |
| Finance & Insurance | 980 (34.7%) | 1,840 (65.2%) |
| Real Estate, Rental & Leasing | 534 (59.4%) | 365 (40.6%) |
| Professional & Scientific | 1,228 (50.5%) | 1,202 (49.5%) |
| Enterprise Management | 51 (87.9%) | 7 (12.1%) |
| Administrative & Support | 1,261 (53.8%) | 1,083 (46.2%) |
| Educational Services | 1,410 (31.1%) | 3,129 (68.9%) |
| Health Care & Social Assistance | 2,335 (24.8%) | 7,074 (75.2%) |
| Arts, Entertainment & Recreation | 721 (57.2%) | 539 (42.8%) |
| Accommodation & Food Services | 1,993 (45.0%) | 2,438 (55.0%) |
| Public Administration | 2,016 (65.7%) | 1,050 (34.3%) |
| Total | 28,502 (52.5%) | 25,808 (47.5%) |
Education in Pennington County
School Enrollment in Pennington County
The most common levels of schooling among the 24,966 students in Pennington County are middle school (5,727 | 22.9%), elementary school (5,317 | 21.3%), and high school (5,122 | 20.5%).
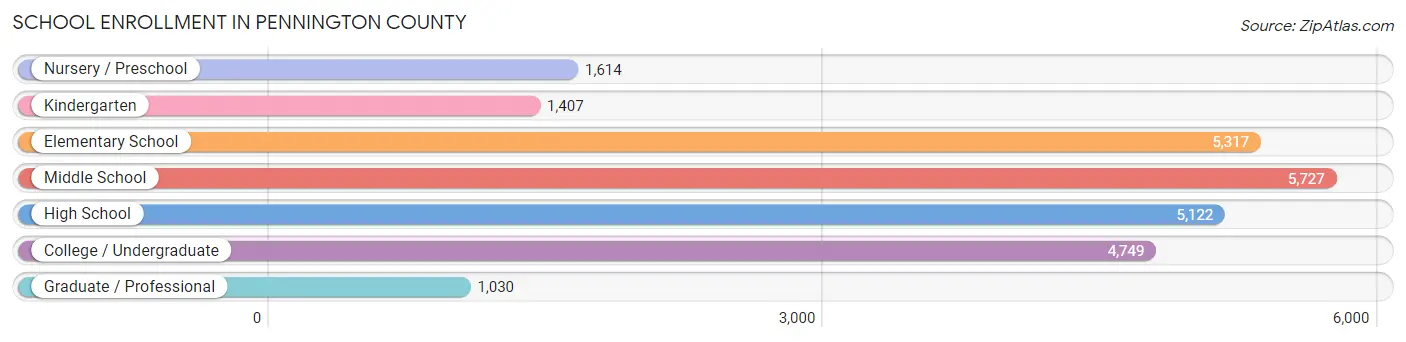
| School Level | # Students | % Students |
| Nursery / Preschool | 1,614 | 6.5% |
| Kindergarten | 1,407 | 5.6% |
| Elementary School | 5,317 | 21.3% |
| Middle School | 5,727 | 22.9% |
| High School | 5,122 | 20.5% |
| College / Undergraduate | 4,749 | 19.0% |
| Graduate / Professional | 1,030 | 4.1% |
| Total | 24,966 | 100.0% |
School Enrollment by Age by Funding Source in Pennington County
Out of a total of 24,966 students who are enrolled in schools in Pennington County, 4,144 (16.6%) attend a private institution, while the remaining 20,822 (83.4%) are enrolled in public schools. The age group of 3 to 4 year olds has the highest likelihood of being enrolled in private schools, with 464 (47.3% in the age bracket) enrolled. Conversely, the age group of 20 to 24 year olds has the lowest likelihood of being enrolled in a private school, with 1,695 (92.1% in the age bracket) attending a public institution.
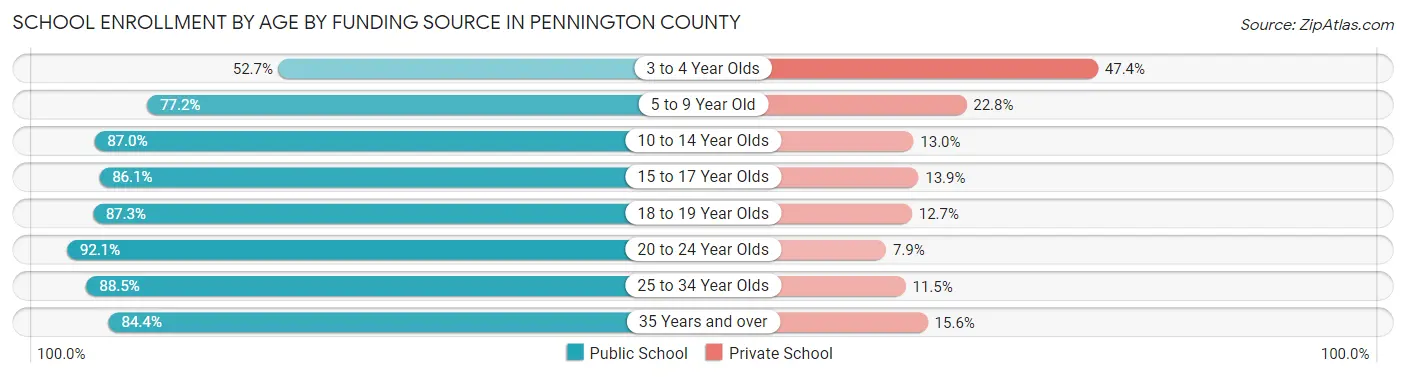
| Age Bracket | Public School | Private School |
| 3 to 4 Year Olds | 516 (52.6%) | 464 (47.3%) |
| 5 to 9 Year Old | 4,827 (77.2%) | 1,429 (22.8%) |
| 10 to 14 Year Olds | 6,073 (87.0%) | 906 (13.0%) |
| 15 to 17 Year Olds | 3,482 (86.1%) | 562 (13.9%) |
| 18 to 19 Year Olds | 1,548 (87.3%) | 225 (12.7%) |
| 20 to 24 Year Olds | 1,695 (92.1%) | 145 (7.9%) |
| 25 to 34 Year Olds | 1,544 (88.5%) | 201 (11.5%) |
| 35 Years and over | 1,138 (84.4%) | 211 (15.6%) |
| Total | 20,822 (83.4%) | 4,144 (16.6%) |
Educational Attainment by Field of Study in Pennington County
Business (4,584 | 16.3%), education (4,332 | 15.4%), science & technology (3,459 | 12.3%), engineering (2,299 | 8.2%), and social sciences (2,174 | 7.7%) are the most common fields of study among 28,105 individuals in Pennington County who have obtained a bachelor's degree or higher.
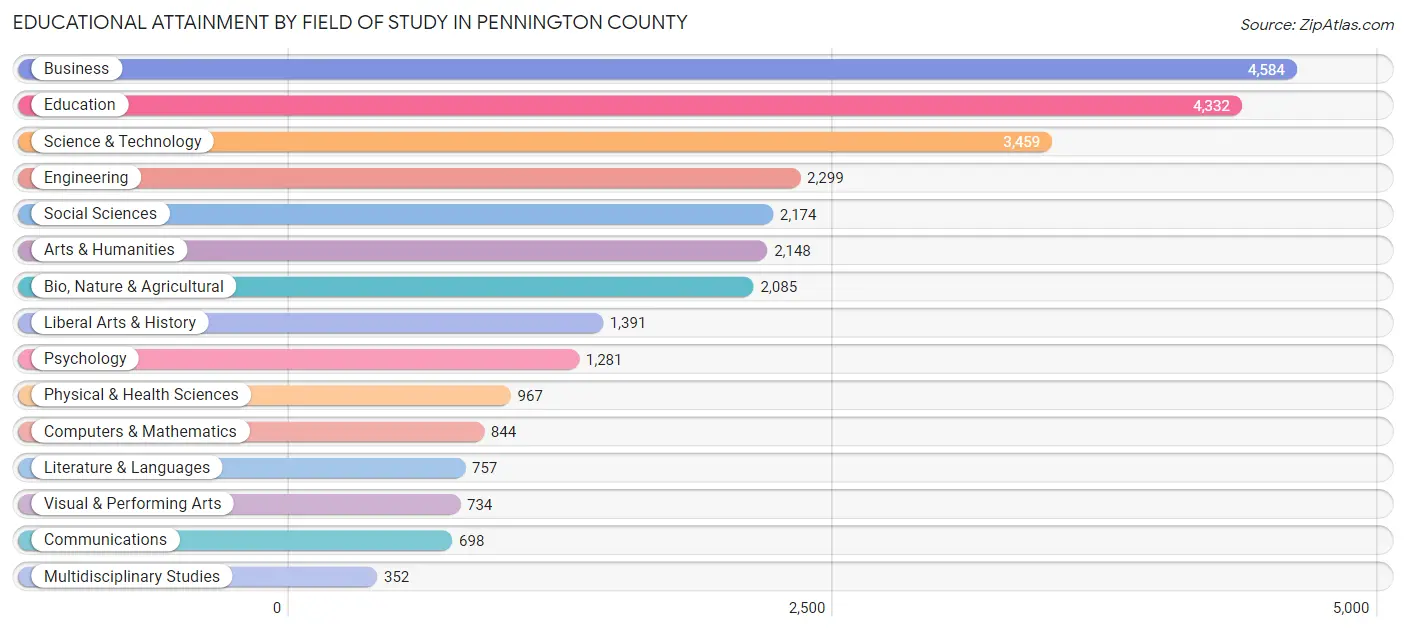
| Field of Study | # Graduates | % Graduates |
| Computers & Mathematics | 844 | 3.0% |
| Bio, Nature & Agricultural | 2,085 | 7.4% |
| Physical & Health Sciences | 967 | 3.4% |
| Psychology | 1,281 | 4.6% |
| Social Sciences | 2,174 | 7.7% |
| Engineering | 2,299 | 8.2% |
| Multidisciplinary Studies | 352 | 1.3% |
| Science & Technology | 3,459 | 12.3% |
| Business | 4,584 | 16.3% |
| Education | 4,332 | 15.4% |
| Literature & Languages | 757 | 2.7% |
| Liberal Arts & History | 1,391 | 5.0% |
| Visual & Performing Arts | 734 | 2.6% |
| Communications | 698 | 2.5% |
| Arts & Humanities | 2,148 | 7.6% |
| Total | 28,105 | 100.0% |
Transportation & Commute in Pennington County
Vehicle Availability by Sex in Pennington County
The most prevalent vehicle ownership categories in Pennington County are males with 2 vehicles (11,104, accounting for 38.6%) and females with 2 vehicles (9,277, making up 44.0%).
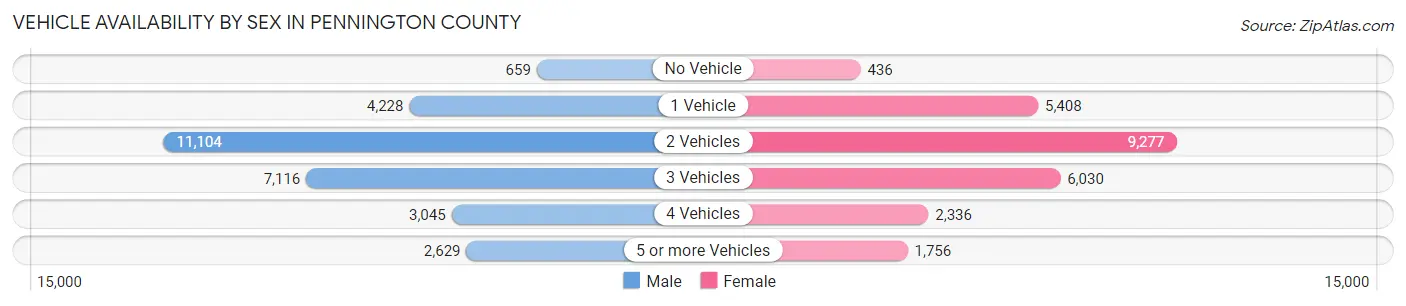
| Vehicles Available | Male | Female |
| No Vehicle | 659 (2.3%) | 436 (1.7%) |
| 1 Vehicle | 4,228 (14.7%) | 5,408 (21.4%) |
| 2 Vehicles | 11,104 (38.6%) | 9,277 (36.7%) |
| 3 Vehicles | 7,116 (24.7%) | 6,030 (23.9%) |
| 4 Vehicles | 3,045 (10.6%) | 2,336 (9.2%) |
| 5 or more Vehicles | 2,629 (9.1%) | 1,756 (7.0%) |
| Total | 28,781 (100.0%) | 25,243 (100.0%) |
Commute Time in Pennington County
The most frequently occuring commute durations in Pennington County are 15 to 19 minutes (13,034 commuters, 26.1%), 10 to 14 minutes (11,034 commuters, 22.1%), and 20 to 24 minutes (7,927 commuters, 15.9%).
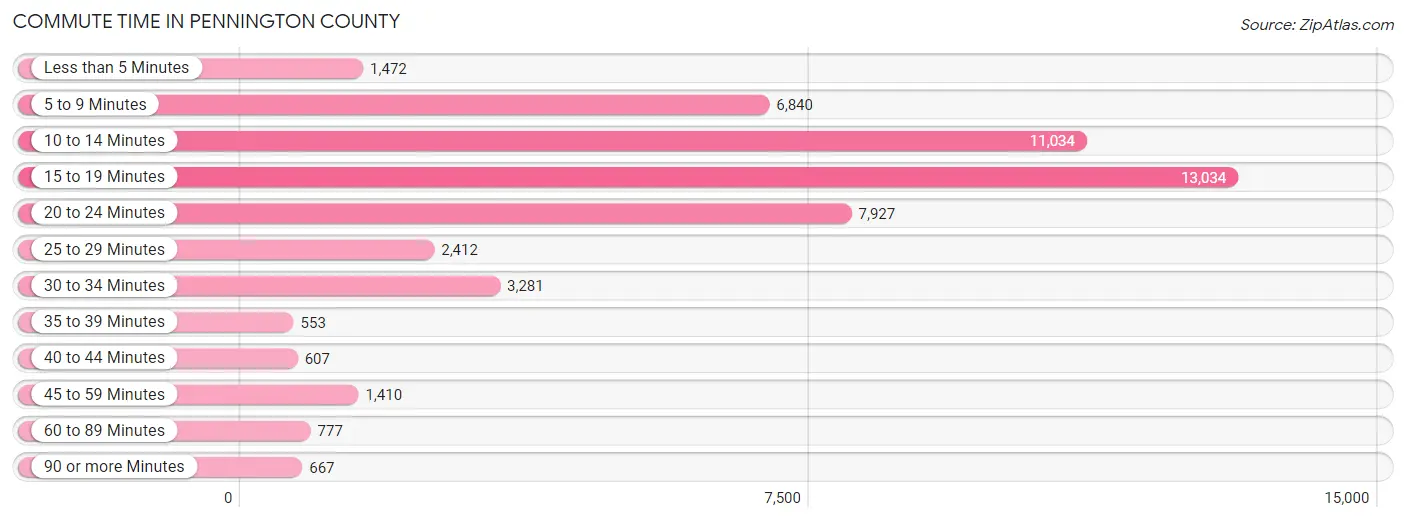
| Commute Time | # Commuters | % Commuters |
| Less than 5 Minutes | 1,472 | 2.9% |
| 5 to 9 Minutes | 6,840 | 13.7% |
| 10 to 14 Minutes | 11,034 | 22.1% |
| 15 to 19 Minutes | 13,034 | 26.1% |
| 20 to 24 Minutes | 7,927 | 15.9% |
| 25 to 29 Minutes | 2,412 | 4.8% |
| 30 to 34 Minutes | 3,281 | 6.6% |
| 35 to 39 Minutes | 553 | 1.1% |
| 40 to 44 Minutes | 607 | 1.2% |
| 45 to 59 Minutes | 1,410 | 2.8% |
| 60 to 89 Minutes | 777 | 1.5% |
| 90 or more Minutes | 667 | 1.3% |
Commute Time by Sex in Pennington County
The most common commute times in Pennington County are 15 to 19 minutes (7,062 commuters, 26.1%) for males and 15 to 19 minutes (5,972 commuters, 26.1%) for females.
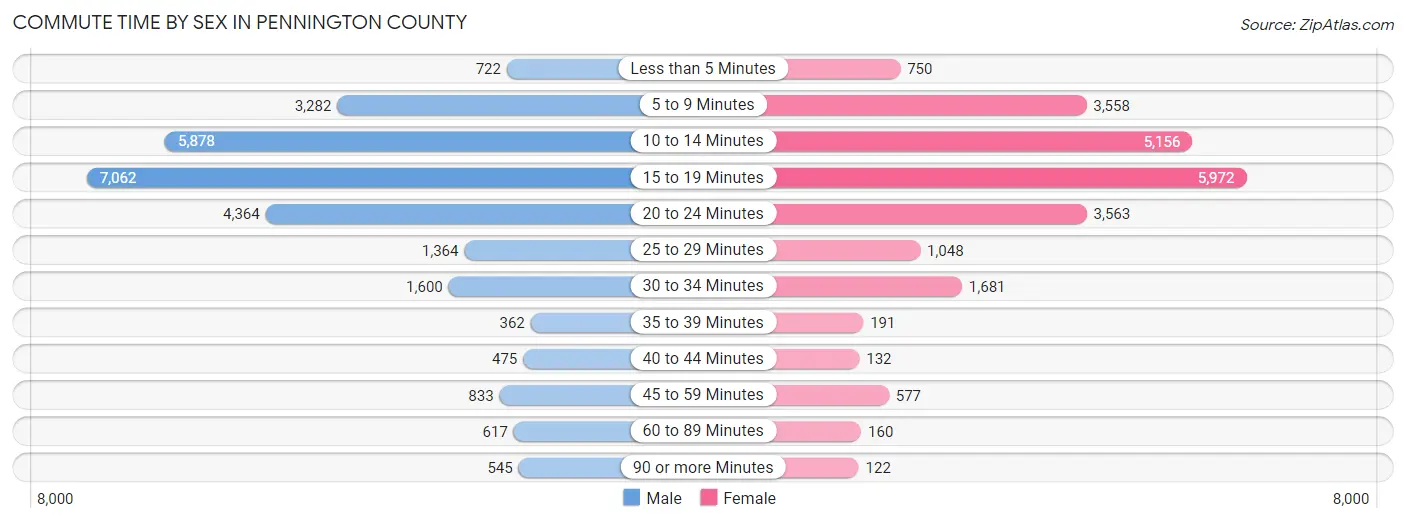
| Commute Time | Male | Female |
| Less than 5 Minutes | 722 (2.7%) | 750 (3.3%) |
| 5 to 9 Minutes | 3,282 (12.1%) | 3,558 (15.5%) |
| 10 to 14 Minutes | 5,878 (21.7%) | 5,156 (22.5%) |
| 15 to 19 Minutes | 7,062 (26.1%) | 5,972 (26.1%) |
| 20 to 24 Minutes | 4,364 (16.1%) | 3,563 (15.5%) |
| 25 to 29 Minutes | 1,364 (5.0%) | 1,048 (4.6%) |
| 30 to 34 Minutes | 1,600 (5.9%) | 1,681 (7.3%) |
| 35 to 39 Minutes | 362 (1.3%) | 191 (0.8%) |
| 40 to 44 Minutes | 475 (1.8%) | 132 (0.6%) |
| 45 to 59 Minutes | 833 (3.1%) | 577 (2.5%) |
| 60 to 89 Minutes | 617 (2.3%) | 160 (0.7%) |
| 90 or more Minutes | 545 (2.0%) | 122 (0.5%) |
Time of Departure to Work by Sex in Pennington County
The most frequent times of departure to work in Pennington County are 7:00 AM to 7:29 AM (4,318, 15.9%) for males and 7:00 AM to 7:29 AM (4,515, 19.7%) for females.
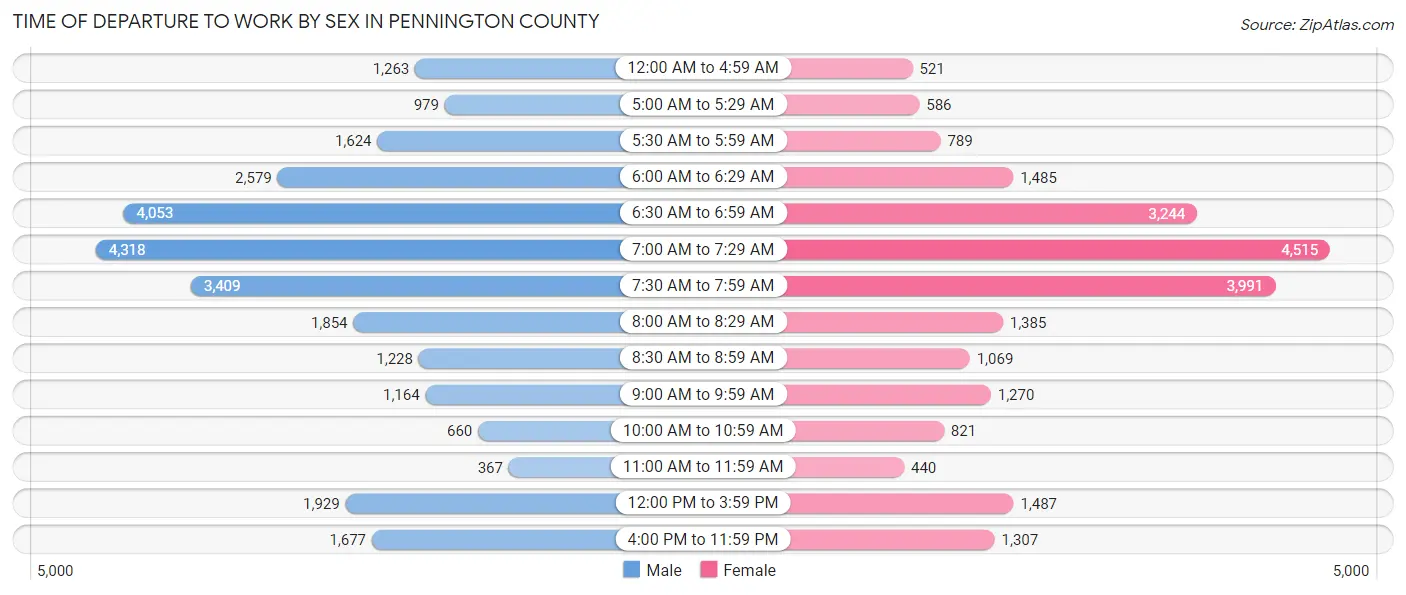
| Time of Departure | Male | Female |
| 12:00 AM to 4:59 AM | 1,263 (4.7%) | 521 (2.3%) |
| 5:00 AM to 5:29 AM | 979 (3.6%) | 586 (2.6%) |
| 5:30 AM to 5:59 AM | 1,624 (6.0%) | 789 (3.4%) |
| 6:00 AM to 6:29 AM | 2,579 (9.5%) | 1,485 (6.5%) |
| 6:30 AM to 6:59 AM | 4,053 (14.9%) | 3,244 (14.2%) |
| 7:00 AM to 7:29 AM | 4,318 (15.9%) | 4,515 (19.7%) |
| 7:30 AM to 7:59 AM | 3,409 (12.6%) | 3,991 (17.4%) |
| 8:00 AM to 8:29 AM | 1,854 (6.8%) | 1,385 (6.0%) |
| 8:30 AM to 8:59 AM | 1,228 (4.5%) | 1,069 (4.7%) |
| 9:00 AM to 9:59 AM | 1,164 (4.3%) | 1,270 (5.5%) |
| 10:00 AM to 10:59 AM | 660 (2.4%) | 821 (3.6%) |
| 11:00 AM to 11:59 AM | 367 (1.3%) | 440 (1.9%) |
| 12:00 PM to 3:59 PM | 1,929 (7.1%) | 1,487 (6.5%) |
| 4:00 PM to 11:59 PM | 1,677 (6.2%) | 1,307 (5.7%) |
| Total | 27,104 (100.0%) | 22,910 (100.0%) |
Housing Occupancy in Pennington County
Occupancy by Ownership in Pennington County
Of the total 44,829 dwellings in Pennington County, owner-occupied units account for 31,013 (69.2%), while renter-occupied units make up 13,816 (30.8%).
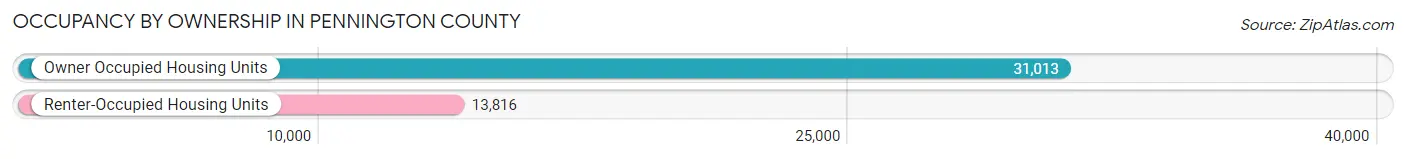
| Occupancy | # Housing Units | % Housing Units |
| Owner Occupied Housing Units | 31,013 | 69.2% |
| Renter-Occupied Housing Units | 13,816 | 30.8% |
| Total Occupied Housing Units | 44,829 | 100.0% |
Occupancy by Household Size in Pennington County
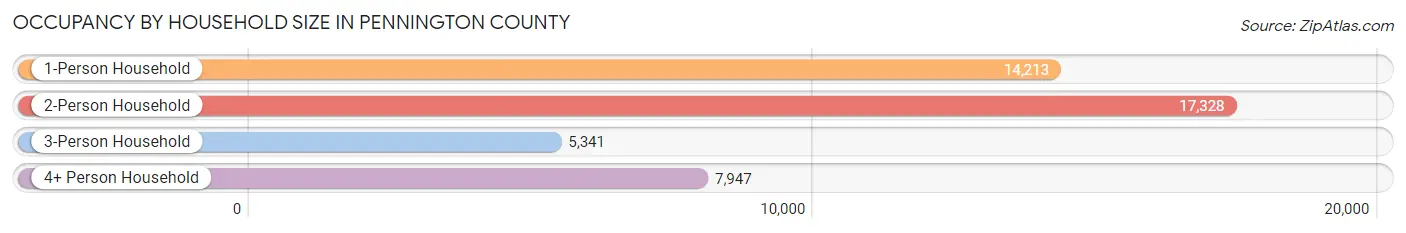
| Household Size | # Housing Units | % Housing Units |
| 1-Person Household | 14,213 | 31.7% |
| 2-Person Household | 17,328 | 38.7% |
| 3-Person Household | 5,341 | 11.9% |
| 4+ Person Household | 7,947 | 17.7% |
| Total Housing Units | 44,829 | 100.0% |
Occupancy by Ownership by Household Size in Pennington County
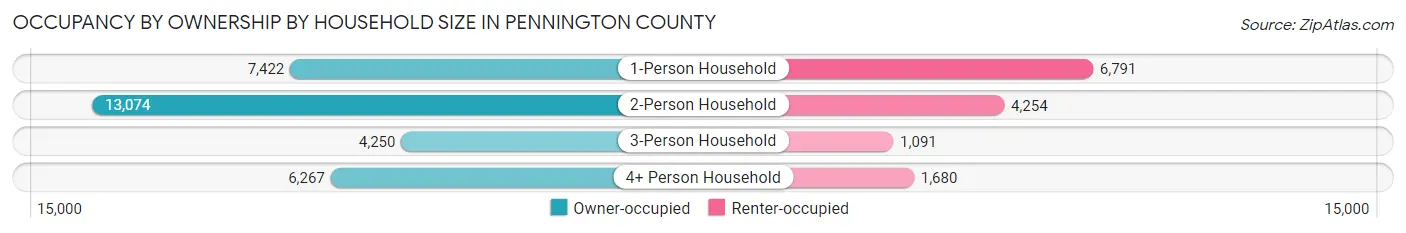
| Household Size | Owner-occupied | Renter-occupied |
| 1-Person Household | 7,422 (52.2%) | 6,791 (47.8%) |
| 2-Person Household | 13,074 (75.4%) | 4,254 (24.5%) |
| 3-Person Household | 4,250 (79.6%) | 1,091 (20.4%) |
| 4+ Person Household | 6,267 (78.9%) | 1,680 (21.1%) |
| Total Housing Units | 31,013 (69.2%) | 13,816 (30.8%) |
Occupancy by Educational Attainment in Pennington County
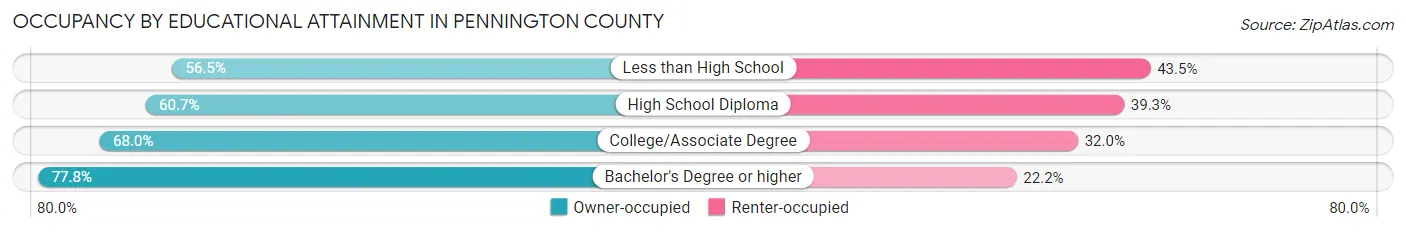
| Household Size | Owner-occupied | Renter-occupied |
| Less than High School | 1,116 (56.5%) | 858 (43.5%) |
| High School Diploma | 6,682 (60.7%) | 4,325 (39.3%) |
| College/Associate Degree | 10,834 (68.0%) | 5,091 (32.0%) |
| Bachelor's Degree or higher | 12,381 (77.8%) | 3,542 (22.2%) |
Occupancy by Age of Householder in Pennington County
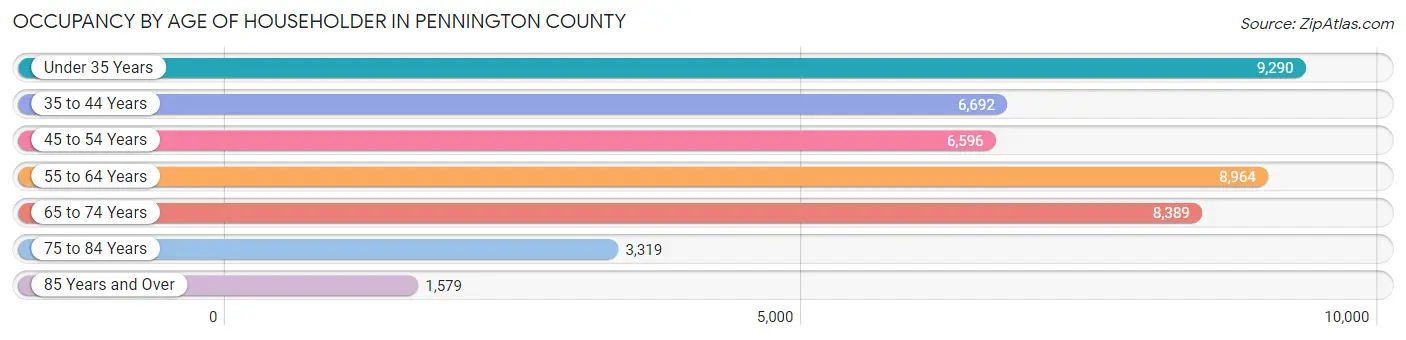
| Age Bracket | # Households | % Households |
| Under 35 Years | 9,290 | 20.7% |
| 35 to 44 Years | 6,692 | 14.9% |
| 45 to 54 Years | 6,596 | 14.7% |
| 55 to 64 Years | 8,964 | 20.0% |
| 65 to 74 Years | 8,389 | 18.7% |
| 75 to 84 Years | 3,319 | 7.4% |
| 85 Years and Over | 1,579 | 3.5% |
| Total | 44,829 | 100.0% |
Housing Finances in Pennington County
Median Income by Occupancy in Pennington County
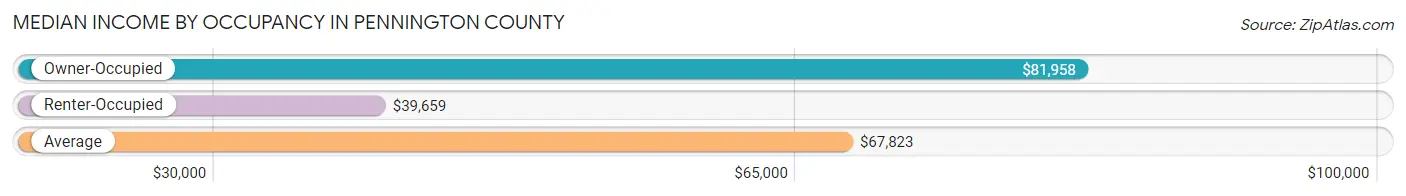
| Occupancy Type | # Households | Median Income |
| Owner-Occupied | 31,013 (69.2%) | $81,958 |
| Renter-Occupied | 13,816 (30.8%) | $39,659 |
| Average | 44,829 (100.0%) | $67,823 |
Occupancy by Householder Income Bracket in Pennington County
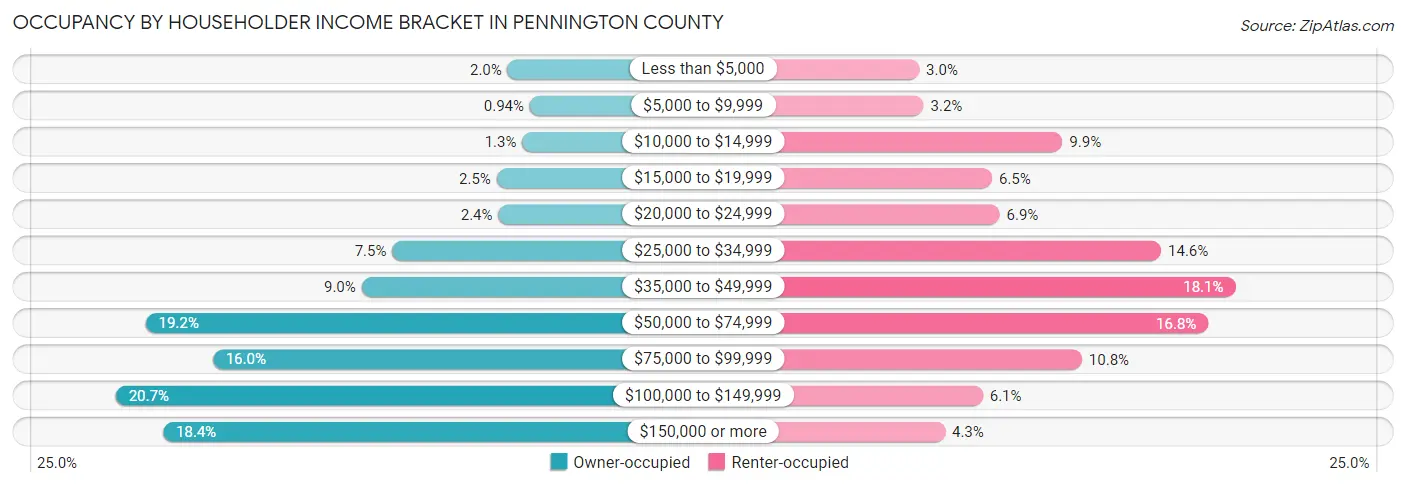
| Income Bracket | Owner-occupied | Renter-occupied |
| Less than $5,000 | 621 (2.0%) | 418 (3.0%) |
| $5,000 to $9,999 | 291 (0.9%) | 447 (3.2%) |
| $10,000 to $14,999 | 404 (1.3%) | 1,361 (9.9%) |
| $15,000 to $19,999 | 783 (2.5%) | 898 (6.5%) |
| $20,000 to $24,999 | 758 (2.4%) | 948 (6.9%) |
| $25,000 to $34,999 | 2,324 (7.5%) | 2,010 (14.5%) |
| $35,000 to $49,999 | 2,775 (8.9%) | 2,498 (18.1%) |
| $50,000 to $74,999 | 5,968 (19.2%) | 2,320 (16.8%) |
| $75,000 to $99,999 | 4,974 (16.0%) | 1,490 (10.8%) |
| $100,000 to $149,999 | 6,406 (20.7%) | 837 (6.1%) |
| $150,000 or more | 5,709 (18.4%) | 589 (4.3%) |
| Total | 31,013 (100.0%) | 13,816 (100.0%) |
Monthly Housing Cost Tiers in Pennington County
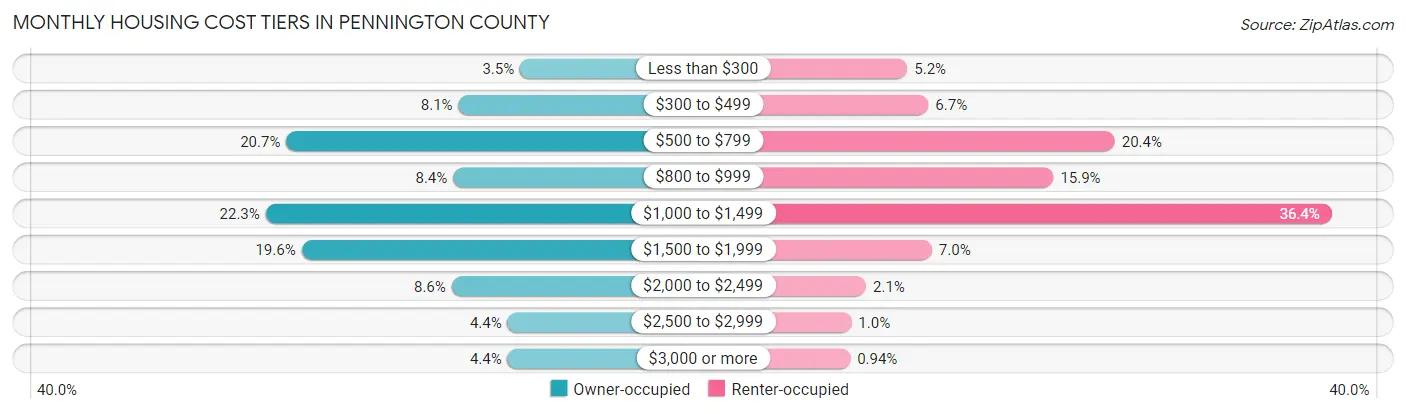
| Monthly Cost | Owner-occupied | Renter-occupied |
| Less than $300 | 1,089 (3.5%) | 711 (5.1%) |
| $300 to $499 | 2,497 (8.1%) | 926 (6.7%) |
| $500 to $799 | 6,428 (20.7%) | 2,823 (20.4%) |
| $800 to $999 | 2,617 (8.4%) | 2,198 (15.9%) |
| $1,000 to $1,499 | 6,900 (22.3%) | 5,029 (36.4%) |
| $1,500 to $1,999 | 6,083 (19.6%) | 962 (7.0%) |
| $2,000 to $2,499 | 2,652 (8.6%) | 291 (2.1%) |
| $2,500 to $2,999 | 1,373 (4.4%) | 142 (1.0%) |
| $3,000 or more | 1,374 (4.4%) | 130 (0.9%) |
| Total | 31,013 (100.0%) | 13,816 (100.0%) |
Physical Housing Characteristics in Pennington County
Housing Structures in Pennington County
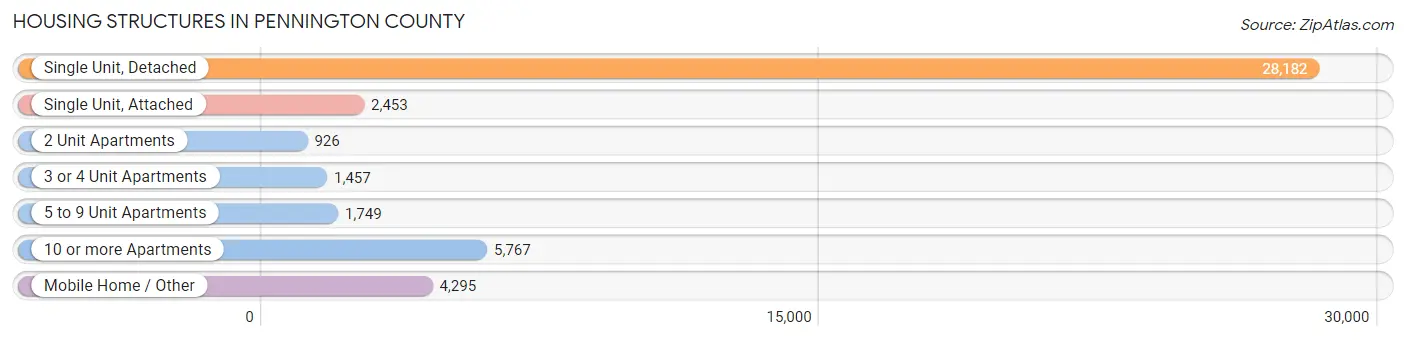
| Structure Type | # Housing Units | % Housing Units |
| Single Unit, Detached | 28,182 | 62.9% |
| Single Unit, Attached | 2,453 | 5.5% |
| 2 Unit Apartments | 926 | 2.1% |
| 3 or 4 Unit Apartments | 1,457 | 3.3% |
| 5 to 9 Unit Apartments | 1,749 | 3.9% |
| 10 or more Apartments | 5,767 | 12.9% |
| Mobile Home / Other | 4,295 | 9.6% |
| Total | 44,829 | 100.0% |
Housing Structures by Occupancy in Pennington County
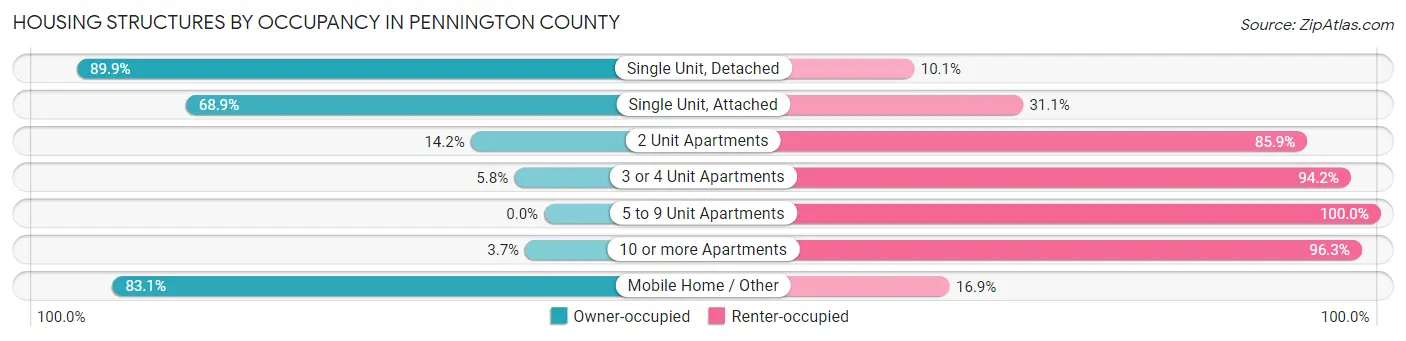
| Structure Type | Owner-occupied | Renter-occupied |
| Single Unit, Detached | 25,328 (89.9%) | 2,854 (10.1%) |
| Single Unit, Attached | 1,691 (68.9%) | 762 (31.1%) |
| 2 Unit Apartments | 131 (14.1%) | 795 (85.9%) |
| 3 or 4 Unit Apartments | 84 (5.8%) | 1,373 (94.2%) |
| 5 to 9 Unit Apartments | 0 (0.0%) | 1,749 (100.0%) |
| 10 or more Apartments | 211 (3.7%) | 5,556 (96.3%) |
| Mobile Home / Other | 3,568 (83.1%) | 727 (16.9%) |
| Total | 31,013 (69.2%) | 13,816 (30.8%) |
Housing Structures by Number of Rooms in Pennington County
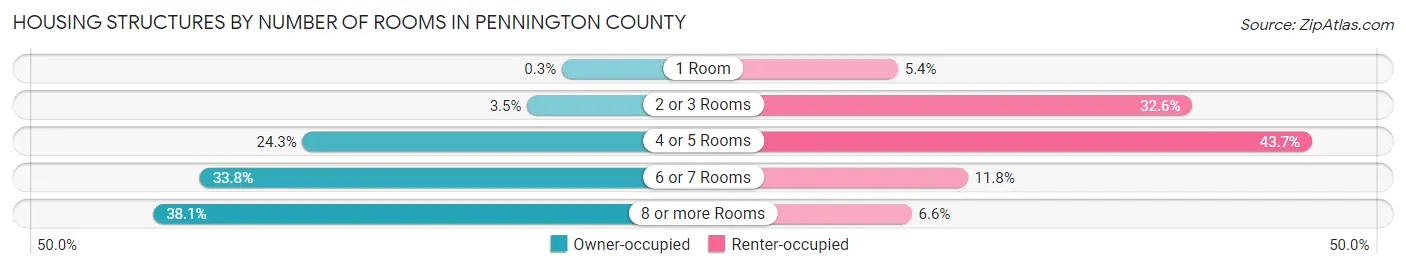
| Number of Rooms | Owner-occupied | Renter-occupied |
| 1 Room | 93 (0.3%) | 739 (5.3%) |
| 2 or 3 Rooms | 1,088 (3.5%) | 4,501 (32.6%) |
| 4 or 5 Rooms | 7,533 (24.3%) | 6,030 (43.6%) |
| 6 or 7 Rooms | 10,482 (33.8%) | 1,630 (11.8%) |
| 8 or more Rooms | 11,817 (38.1%) | 916 (6.6%) |
| Total | 31,013 (100.0%) | 13,816 (100.0%) |
Housing Structure by Heating Type in Pennington County
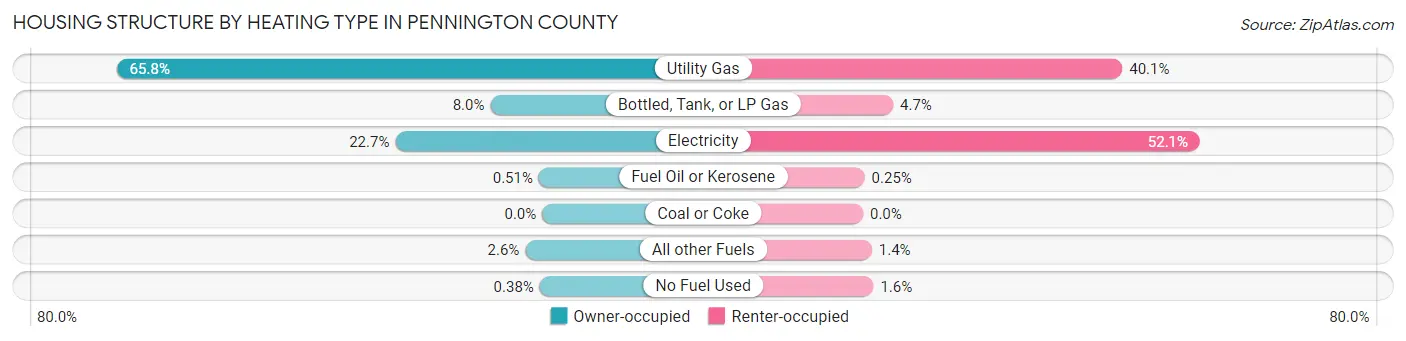
| Heating Type | Owner-occupied | Renter-occupied |
| Utility Gas | 20,403 (65.8%) | 5,537 (40.1%) |
| Bottled, Tank, or LP Gas | 2,483 (8.0%) | 643 (4.6%) |
| Electricity | 7,040 (22.7%) | 7,192 (52.1%) |
| Fuel Oil or Kerosene | 159 (0.5%) | 34 (0.3%) |
| Coal or Coke | 0 (0.0%) | 0 (0.0%) |
| All other Fuels | 809 (2.6%) | 188 (1.4%) |
| No Fuel Used | 119 (0.4%) | 222 (1.6%) |
| Total | 31,013 (100.0%) | 13,816 (100.0%) |
Household Vehicle Usage in Pennington County
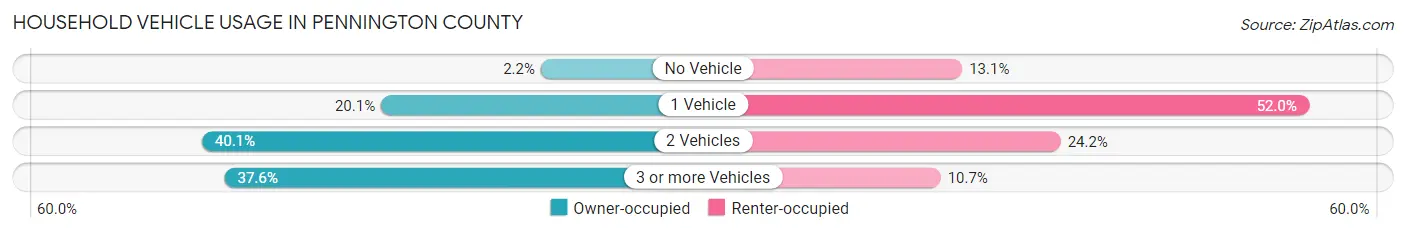
| Vehicles per Household | Owner-occupied | Renter-occupied |
| No Vehicle | 676 (2.2%) | 1,816 (13.1%) |
| 1 Vehicle | 6,227 (20.1%) | 7,178 (51.9%) |
| 2 Vehicles | 12,450 (40.1%) | 3,340 (24.2%) |
| 3 or more Vehicles | 11,660 (37.6%) | 1,482 (10.7%) |
| Total | 31,013 (100.0%) | 13,816 (100.0%) |
Real Estate & Mortgages in Pennington County
Real Estate and Mortgage Overview in Pennington County
| Characteristic | Without Mortgage | With Mortgage |
| Housing Units | 12,487 | 18,526 |
| Median Property Value | $222,500 | $262,400 |
| Median Household Income | $66,343 | $3,852 |
| Monthly Housing Costs | $634 | $1,374 |
| Real Estate Taxes | $2,854 | $238 |
Property Value by Mortgage Status in Pennington County
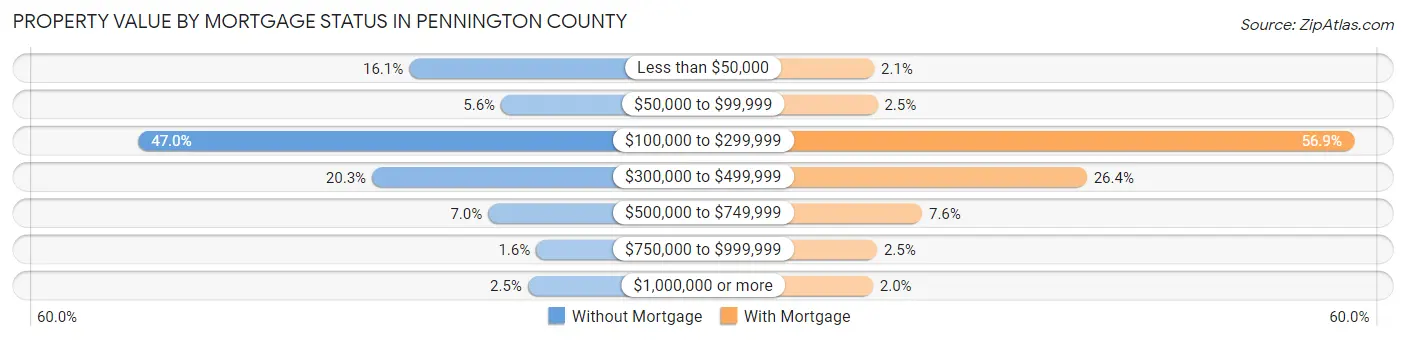
| Property Value | Without Mortgage | With Mortgage |
| Less than $50,000 | 2,005 (16.1%) | 392 (2.1%) |
| $50,000 to $99,999 | 694 (5.6%) | 464 (2.5%) |
| $100,000 to $299,999 | 5,869 (47.0%) | 10,547 (56.9%) |
| $300,000 to $499,999 | 2,536 (20.3%) | 4,894 (26.4%) |
| $500,000 to $749,999 | 878 (7.0%) | 1,408 (7.6%) |
| $750,000 to $999,999 | 193 (1.5%) | 454 (2.5%) |
| $1,000,000 or more | 312 (2.5%) | 367 (2.0%) |
| Total | 12,487 (100.0%) | 18,526 (100.0%) |
Household Income by Mortgage Status in Pennington County
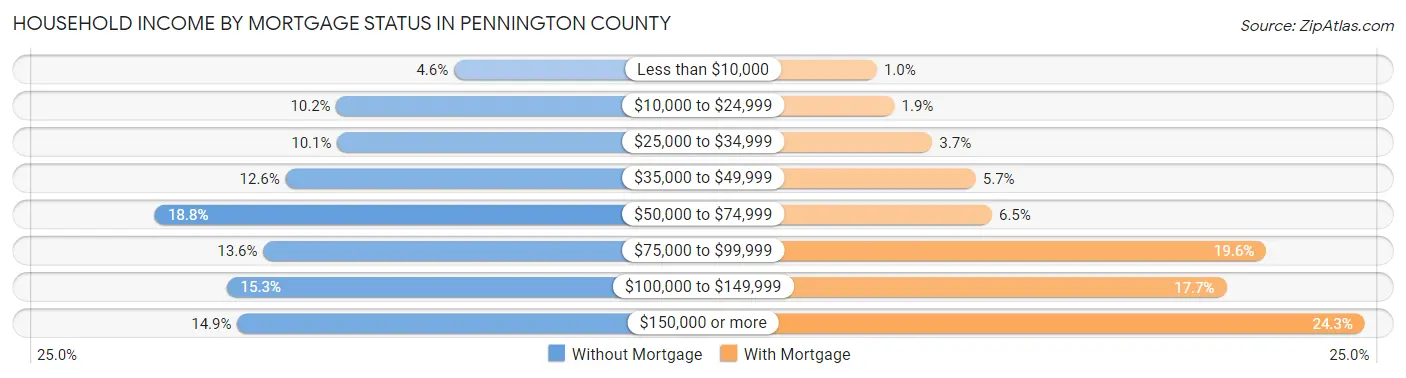
| Household Income | Without Mortgage | With Mortgage |
| Less than $10,000 | 568 (4.5%) | 189 (1.0%) |
| $10,000 to $24,999 | 1,267 (10.2%) | 344 (1.9%) |
| $25,000 to $34,999 | 1,263 (10.1%) | 678 (3.7%) |
| $35,000 to $49,999 | 1,570 (12.6%) | 1,061 (5.7%) |
| $50,000 to $74,999 | 2,346 (18.8%) | 1,205 (6.5%) |
| $75,000 to $99,999 | 1,702 (13.6%) | 3,622 (19.6%) |
| $100,000 to $149,999 | 1,914 (15.3%) | 3,272 (17.7%) |
| $150,000 or more | 1,857 (14.9%) | 4,492 (24.2%) |
| Total | 12,487 (100.0%) | 18,526 (100.0%) |
Property Value to Household Income Ratio in Pennington County
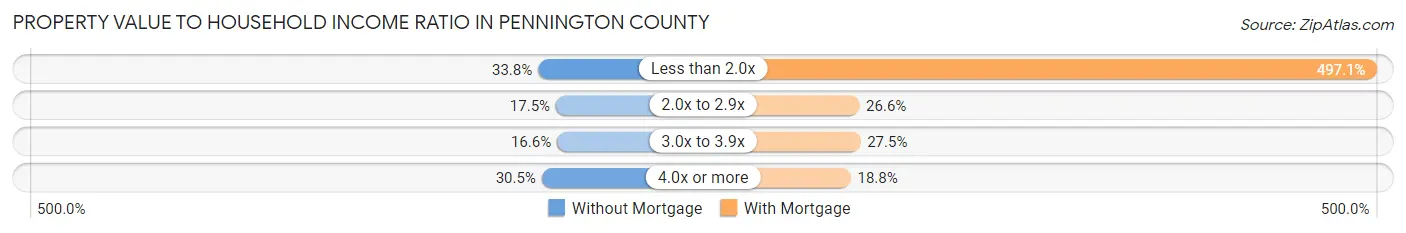
| Value-to-Income Ratio | Without Mortgage | With Mortgage |
| Less than 2.0x | 4,221 (33.8%) | 92,095 (497.1%) |
| 2.0x to 2.9x | 2,189 (17.5%) | 4,920 (26.6%) |
| 3.0x to 3.9x | 2,069 (16.6%) | 5,100 (27.5%) |
| 4.0x or more | 3,802 (30.4%) | 3,474 (18.8%) |
| Total | 12,487 (100.0%) | 18,526 (100.0%) |
Real Estate Taxes by Mortgage Status in Pennington County
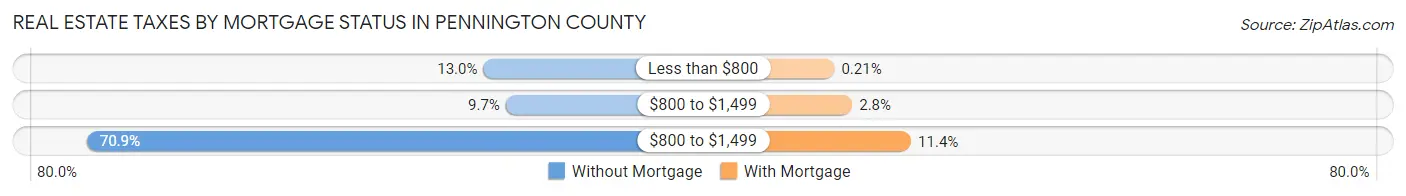
| Property Taxes | Without Mortgage | With Mortgage |
| Less than $800 | 1,621 (13.0%) | 38 (0.2%) |
| $800 to $1,499 | 1,212 (9.7%) | 520 (2.8%) |
| $800 to $1,499 | 8,854 (70.9%) | 2,113 (11.4%) |
| Total | 12,487 (100.0%) | 18,526 (100.0%) |
Health & Disability in Pennington County
Health Insurance Coverage by Age in Pennington County
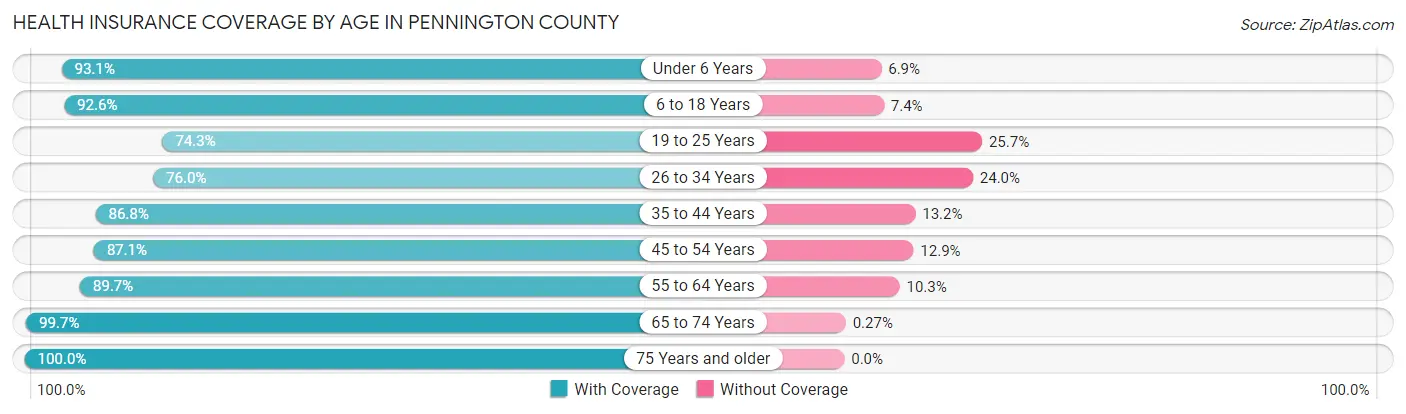
| Age Bracket | With Coverage | Without Coverage |
| Under 6 Years | 7,645 (93.1%) | 567 (6.9%) |
| 6 to 18 Years | 16,282 (92.6%) | 1,297 (7.4%) |
| 19 to 25 Years | 6,733 (74.3%) | 2,326 (25.7%) |
| 26 to 34 Years | 9,256 (76.0%) | 2,919 (24.0%) |
| 35 to 44 Years | 10,673 (86.8%) | 1,629 (13.2%) |
| 45 to 54 Years | 10,230 (87.1%) | 1,514 (12.9%) |
| 55 to 64 Years | 14,056 (89.7%) | 1,616 (10.3%) |
| 65 to 74 Years | 13,088 (99.7%) | 35 (0.3%) |
| 75 Years and older | 7,306 (100.0%) | 0 (0.0%) |
| Total | 95,269 (88.9%) | 11,903 (11.1%) |
Health Insurance Coverage by Citizenship Status in Pennington County
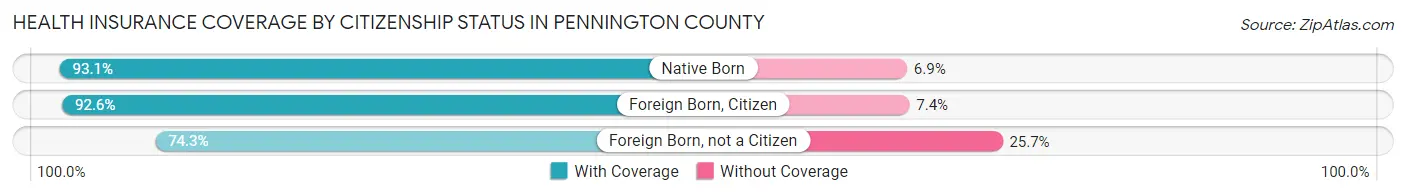
| Citizenship Status | With Coverage | Without Coverage |
| Native Born | 7,645 (93.1%) | 567 (6.9%) |
| Foreign Born, Citizen | 16,282 (92.6%) | 1,297 (7.4%) |
| Foreign Born, not a Citizen | 6,733 (74.3%) | 2,326 (25.7%) |
Health Insurance Coverage by Household Income in Pennington County
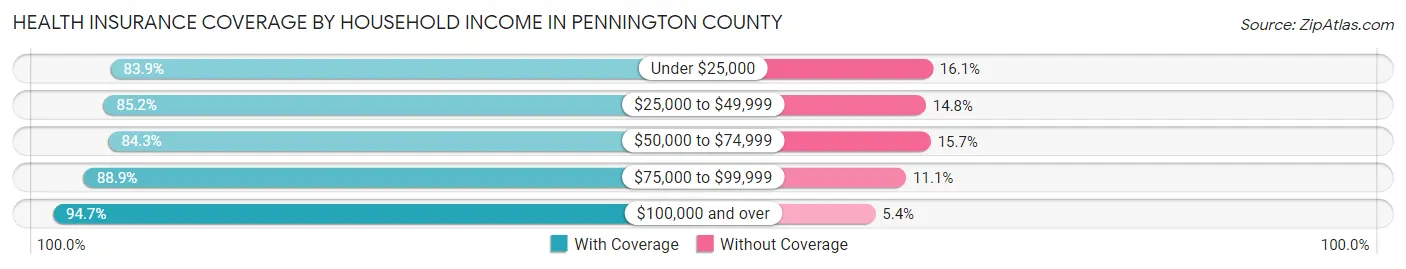
| Household Income | With Coverage | Without Coverage |
| Under $25,000 | 9,992 (83.9%) | 1,922 (16.1%) |
| $25,000 to $49,999 | 15,247 (85.2%) | 2,650 (14.8%) |
| $50,000 to $74,999 | 15,746 (84.3%) | 2,936 (15.7%) |
| $75,000 to $99,999 | 14,151 (88.9%) | 1,771 (11.1%) |
| $100,000 and over | 38,886 (94.7%) | 2,200 (5.3%) |
Public vs Private Health Insurance Coverage by Age in Pennington County
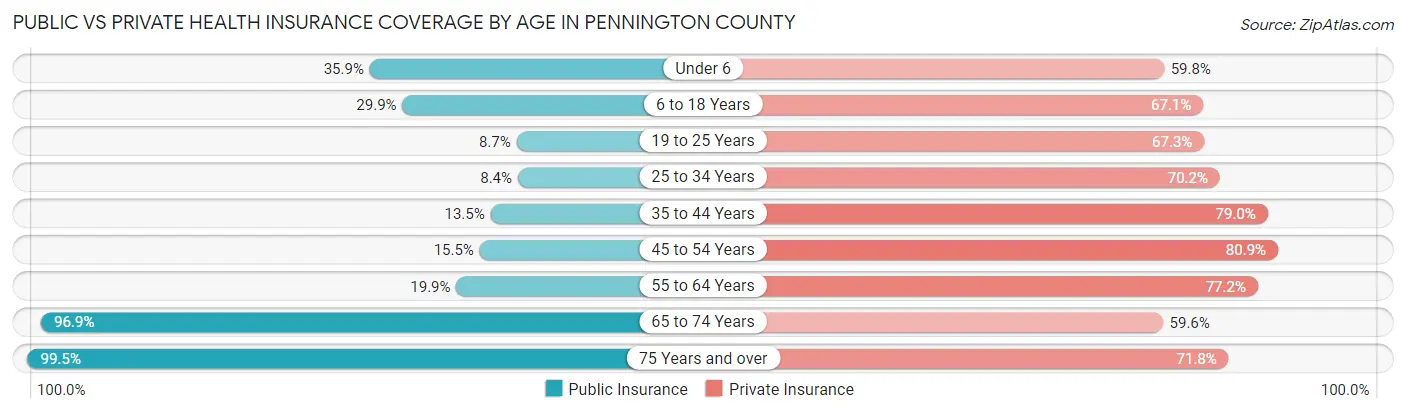
| Age Bracket | Public Insurance | Private Insurance |
| Under 6 | 2,951 (35.9%) | 4,907 (59.8%) |
| 6 to 18 Years | 5,251 (29.9%) | 11,789 (67.1%) |
| 19 to 25 Years | 787 (8.7%) | 6,092 (67.2%) |
| 25 to 34 Years | 1,027 (8.4%) | 8,542 (70.2%) |
| 35 to 44 Years | 1,662 (13.5%) | 9,723 (79.0%) |
| 45 to 54 Years | 1,824 (15.5%) | 9,506 (80.9%) |
| 55 to 64 Years | 3,112 (19.9%) | 12,099 (77.2%) |
| 65 to 74 Years | 12,721 (96.9%) | 7,815 (59.6%) |
| 75 Years and over | 7,266 (99.5%) | 5,246 (71.8%) |
| Total | 36,601 (34.2%) | 75,719 (70.7%) |
Disability Status by Sex by Age in Pennington County
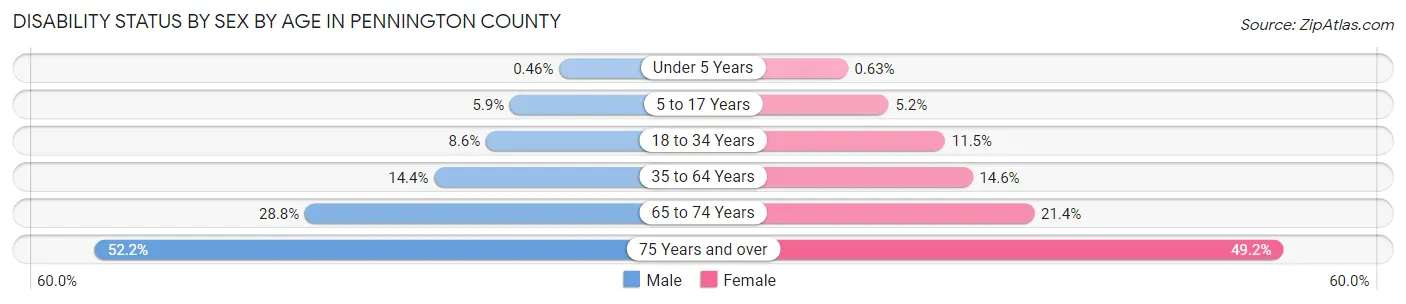
| Age Bracket | Male | Female |
| Under 5 Years | 16 (0.5%) | 21 (0.6%) |
| 5 to 17 Years | 548 (5.9%) | 442 (5.2%) |
| 18 to 34 Years | 1,007 (8.6%) | 1,238 (11.5%) |
| 35 to 64 Years | 2,841 (14.4%) | 2,902 (14.5%) |
| 65 to 74 Years | 1,908 (28.8%) | 1,389 (21.4%) |
| 75 Years and over | 1,633 (52.2%) | 2,053 (49.2%) |
Disability Class by Sex by Age in Pennington County
Disability Class: Hearing Difficulty
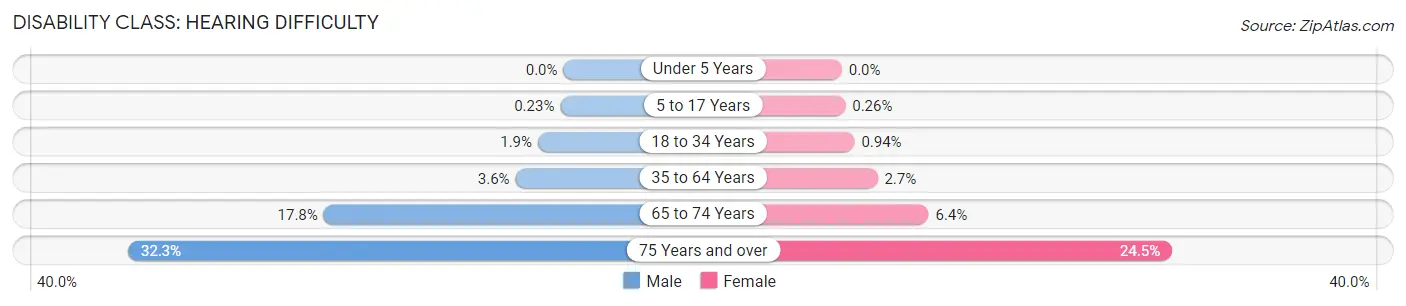
| Age Bracket | Male | Female |
| Under 5 Years | 0 (0.0%) | 0 (0.0%) |
| 5 to 17 Years | 21 (0.2%) | 22 (0.3%) |
| 18 to 34 Years | 221 (1.9%) | 101 (0.9%) |
| 35 to 64 Years | 703 (3.6%) | 528 (2.6%) |
| 65 to 74 Years | 1,181 (17.8%) | 418 (6.4%) |
| 75 Years and over | 1,012 (32.3%) | 1,024 (24.5%) |
Disability Class: Vision Difficulty
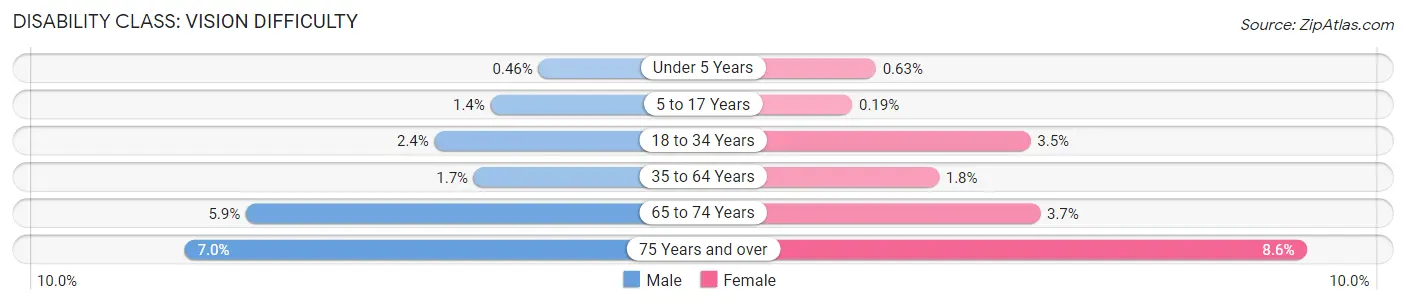
| Age Bracket | Male | Female |
| Under 5 Years | 16 (0.5%) | 21 (0.6%) |
| 5 to 17 Years | 125 (1.3%) | 16 (0.2%) |
| 18 to 34 Years | 280 (2.4%) | 378 (3.5%) |
| 35 to 64 Years | 328 (1.7%) | 360 (1.8%) |
| 65 to 74 Years | 391 (5.9%) | 239 (3.7%) |
| 75 Years and over | 220 (7.0%) | 360 (8.6%) |
Disability Class: Cognitive Difficulty
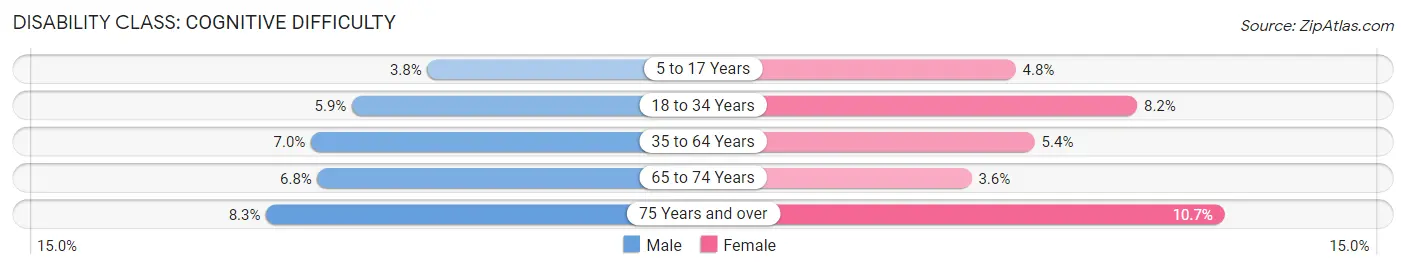
| Age Bracket | Male | Female |
| 5 to 17 Years | 349 (3.8%) | 412 (4.8%) |
| 18 to 34 Years | 688 (5.9%) | 887 (8.2%) |
| 35 to 64 Years | 1,388 (7.0%) | 1,071 (5.4%) |
| 65 to 74 Years | 454 (6.8%) | 234 (3.6%) |
| 75 Years and over | 259 (8.3%) | 445 (10.7%) |
Disability Class: Ambulatory Difficulty
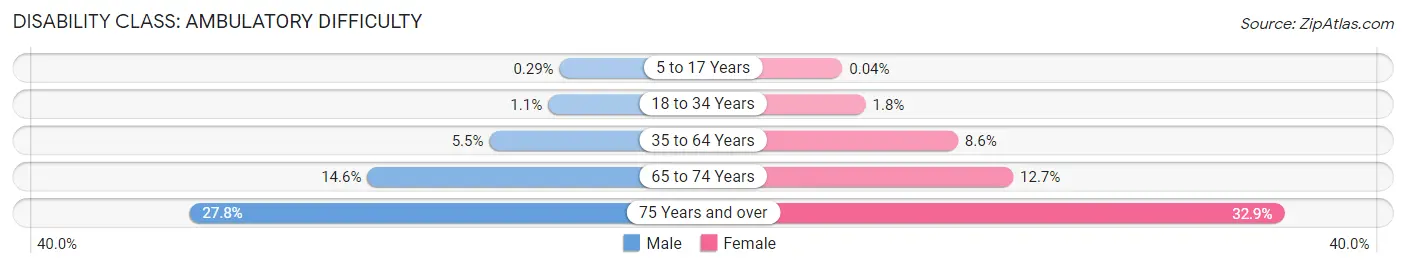
| Age Bracket | Male | Female |
| 5 to 17 Years | 27 (0.3%) | 3 (0.0%) |
| 18 to 34 Years | 133 (1.1%) | 191 (1.8%) |
| 35 to 64 Years | 1,088 (5.5%) | 1,720 (8.6%) |
| 65 to 74 Years | 966 (14.6%) | 825 (12.7%) |
| 75 Years and over | 869 (27.8%) | 1,372 (32.9%) |
Disability Class: Self-Care Difficulty
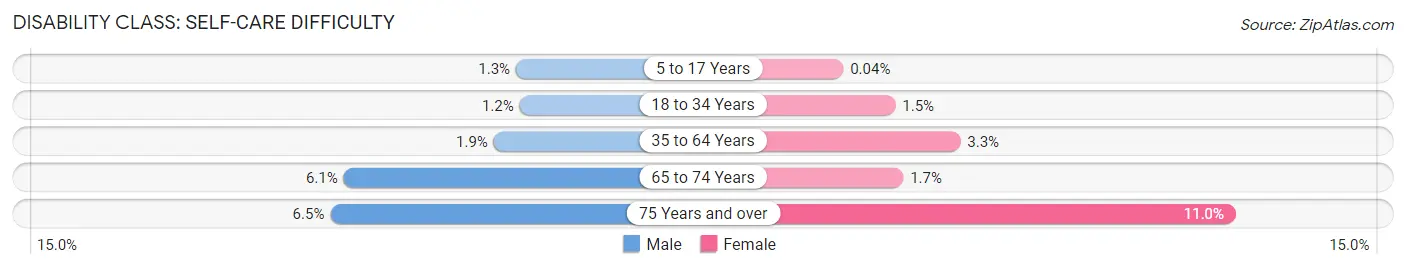
| Age Bracket | Male | Female |
| 5 to 17 Years | 122 (1.3%) | 3 (0.0%) |
| 18 to 34 Years | 143 (1.2%) | 161 (1.5%) |
| 35 to 64 Years | 384 (1.9%) | 659 (3.3%) |
| 65 to 74 Years | 406 (6.1%) | 111 (1.7%) |
| 75 Years and over | 203 (6.5%) | 458 (11.0%) |
Technology Access in Pennington County
Computing Device Access in Pennington County
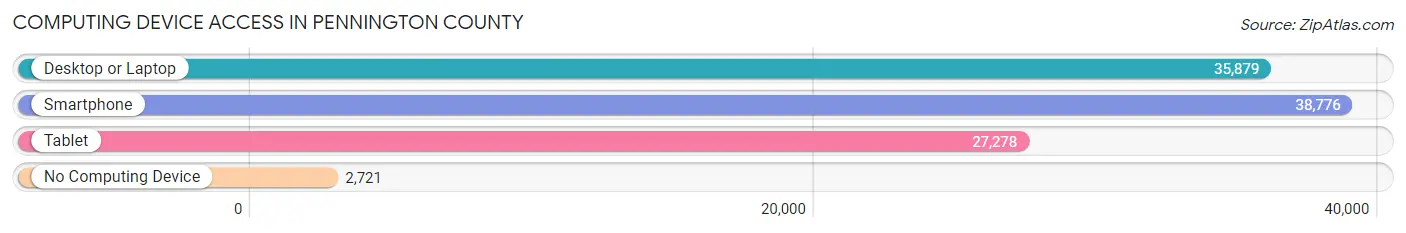
| Device Type | # Households | % Households |
| Desktop or Laptop | 35,879 | 80.0% |
| Smartphone | 38,776 | 86.5% |
| Tablet | 27,278 | 60.9% |
| No Computing Device | 2,721 | 6.1% |
| Total | 44,829 | 100.0% |
Internet Access in Pennington County
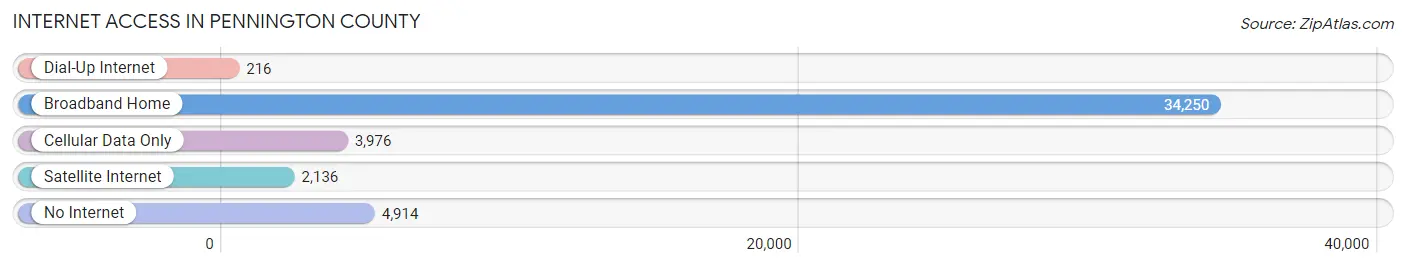
| Internet Type | # Households | % Households |
| Dial-Up Internet | 216 | 0.5% |
| Broadband Home | 34,250 | 76.4% |
| Cellular Data Only | 3,976 | 8.9% |
| Satellite Internet | 2,136 | 4.8% |
| No Internet | 4,914 | 11.0% |
| Total | 44,829 | 100.0% |
Pennington County Summary
Pennington County is located in the southwestern corner of South Dakota, and is the second most populous county in the state. It is bordered by the states of Wyoming and Nebraska, and is part of the Black Hills region. The county seat is Rapid City, which is the second largest city in South Dakota. Pennington County is home to Mount Rushmore National Memorial, Badlands National Park, and Wind Cave National Park.
History
Pennington County was established in 1875, and was named after John L. Pennington, who was the first governor of Dakota Territory. The county was originally part of the Great Sioux Reservation, and was opened to settlement in 1889. The county was initially populated by homesteaders, and the population grew rapidly in the early 1900s.
The county was home to several Native American tribes, including the Lakota, Cheyenne, and Arapaho. The area was also home to the Minneconjou Sioux, who were relocated to the area in 1876. The county was also home to the Ghost Dance movement, which was a religious movement that sought to restore the traditional ways of the Native Americans.
Geography
Pennington County covers an area of 2,845 square miles, and is located in the Black Hills region of South Dakota. The county is bordered by the states of Wyoming and Nebraska, and is home to several mountain ranges, including the Black Hills, the Badlands, and the Bear Lodge Mountains. The county is also home to several rivers, including the Cheyenne, Belle Fourche, and White Rivers.
The county has a semi-arid climate, with hot summers and cold winters. The average annual temperature is 48°F, and the average annual precipitation is 17.5 inches.
Economy
The economy of Pennington County is largely based on tourism, agriculture, and mining. Tourism is the largest industry in the county, and is driven by the presence of Mount Rushmore National Memorial, Badlands National Park, and Wind Cave National Park. Agriculture is also an important part of the economy, and the county is home to several large farms and ranches. Mining is also an important part of the economy, and the county is home to several gold, silver, and uranium mines.
Demographics
As of the 2010 census, Pennington County had a population of 100,948. The population is predominantly white (90.2%), with small percentages of Native American (3.2%), African American (2.2%), Asian (1.2%), and other races (3.2%). The median household income is $50,945, and the median home value is $179,400. The county has a poverty rate of 11.2%, and the unemployment rate is 3.7%.
Common Questions
What is the Total Population of Pennington County?
Total Population of Pennington County is 110,386.
What is the Total Male Population of Pennington County?
Total Male Population of Pennington County is 56,398.
What is the Total Female Population of Pennington County?
Total Female Population of Pennington County is 53,988.
What is the Ratio of Males per 100 Females in Pennington County?
There are 104.46 Males per 100 Females in Pennington County.
What is the Ratio of Females per 100 Males in Pennington County?
There are 95.73 Females per 100 Males in Pennington County.
What is the Median Population Age in Pennington County?
Median Population Age in Pennington County is 39.6 Years.
What is the Average Family Size in Pennington County
Average Family Size in Pennington County is 3.0 People.
What is the Average Household Size in Pennington County
Average Household Size in Pennington County is 2.4 People.
What is Per Capita Income in Pennington County?
Per Capita income in Pennington County is $38,951.
What is the Median Family Income in Pennington County?
Median Family Income in Pennington County is $85,972.
What is the Median Household income in Pennington County?
Median Household Income in Pennington County is $67,823.
What is Income or Wage Gap in Pennington County?
Income or Wage Gap in Pennington County is 20.8%.
Women in Pennington County earn 79.2 cents for every dollar earned by a man.
What is Family Income Deficit in Pennington County?
Family Income Deficit in Pennington County is $10,971.
Families that are below poverty line in Pennington County earn $10,971 less on average than the poverty threshold level.
What is Inequality or Gini Index in Pennington County?
Inequality or Gini Index in Pennington County is 0.47.
How Large is the Labor Force in Pennington County?
There are 57,450 People in the Labor Forcein in Pennington County.
What is the Percentage of People in the Labor Force in Pennington County?
64.9% of People are in the Labor Force in Pennington County.
What is the Unemployment Rate in Pennington County?
Unemployment Rate in Pennington County is 3.5%.