Oglala Lakota County, SD
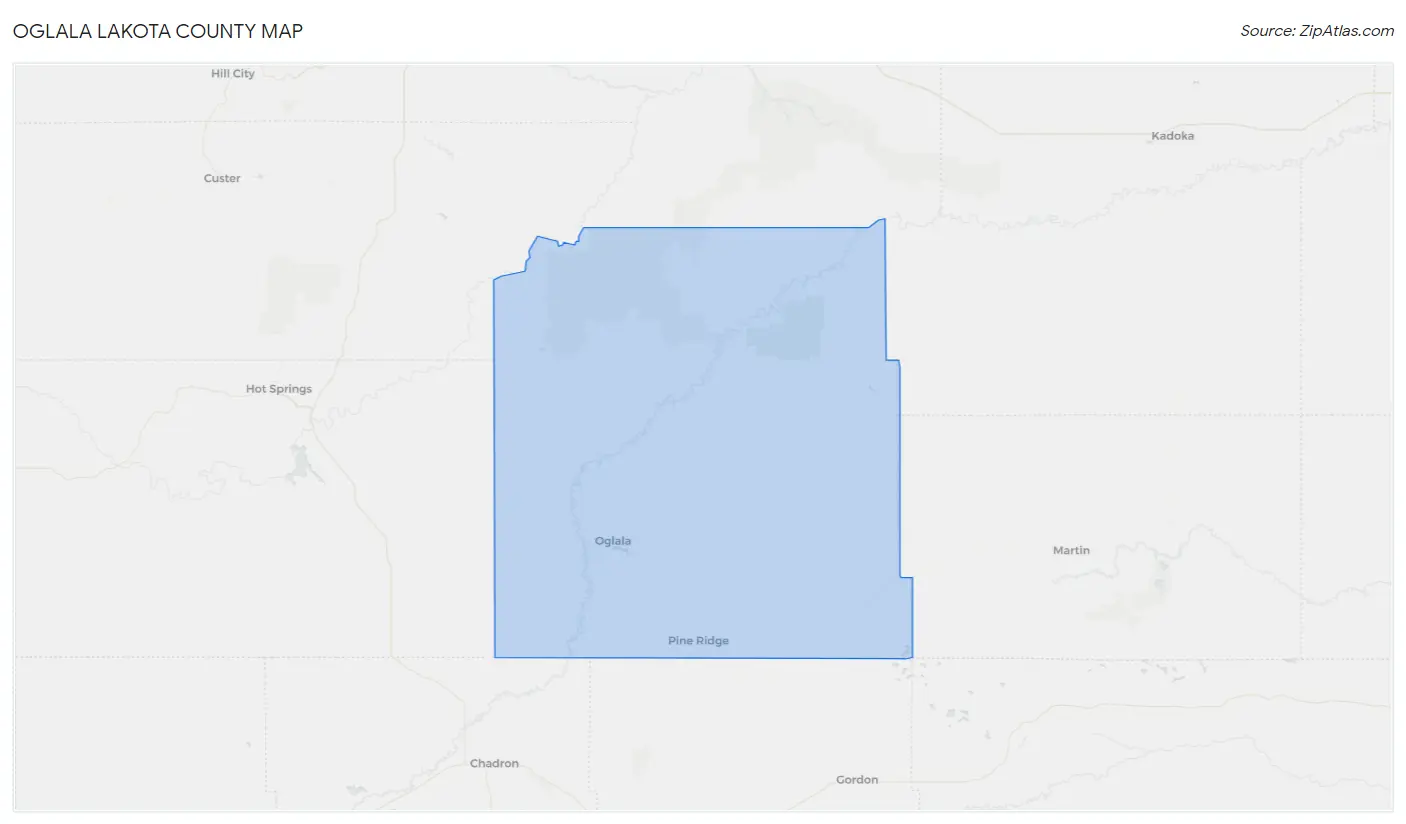
Oglala Lakota County Map
Oglala Lakota County Overview
13,695
TOTAL POPULATION
6,886
MALE POPULATION
6,809
FEMALE POPULATION
101.13
MALES / 100 FEMALES
98.88
FEMALES / 100 MALES
26.3
MEDIAN AGE
5.5
AVG FAMILY SIZE
5.0
AVG HOUSEHOLD SIZE
$10,955
PER CAPITA INCOME
$33,578
AVG FAMILY INCOME
$32,279
AVG HOUSEHOLD INCOME
14.2%
WAGE / INCOME GAP [ % ]
85.8¢/ $1
WAGE / INCOME GAP [ $ ]
$18,264
FAMILY INCOME DEFICIT
0.51
INEQUALITY / GINI INDEX
3,588
LABOR FORCE [ PEOPLE ]
39.0%
PERCENT IN LABOR FORCE
11.8%
UNEMPLOYMENT RATE
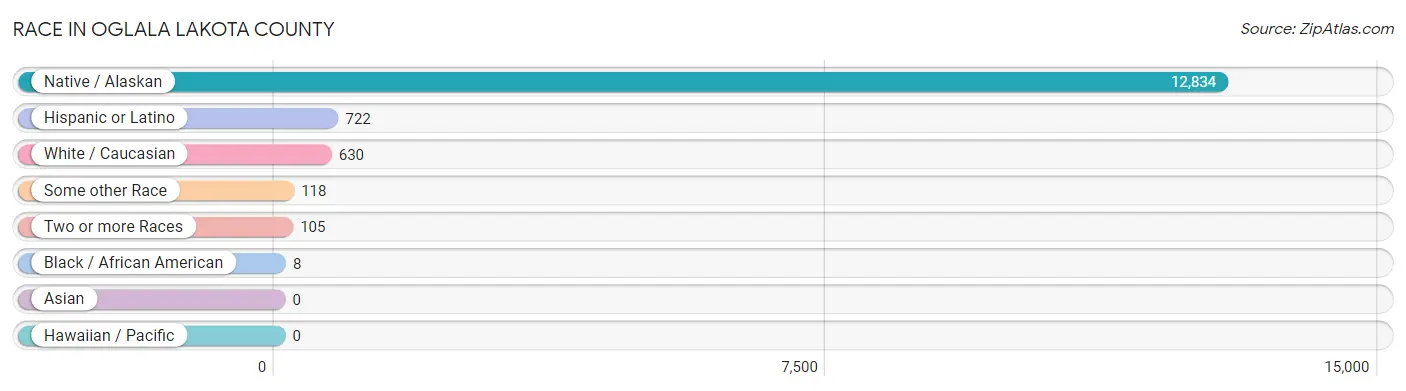
Race in Oglala Lakota County
The most populous races in Oglala Lakota County are Native / Alaskan (12,834 | 93.7%), Hispanic or Latino (722 | 5.3%), and White / Caucasian (630 | 4.6%).
| Race | # Population | % Population |
| Asian | 0 | 0.0% |
| Black / African American | 8 | 0.1% |
| Hawaiian / Pacific | 0 | 0.0% |
| Hispanic or Latino | 722 | 5.3% |
| Native / Alaskan | 12,834 | 93.7% |
| White / Caucasian | 630 | 4.6% |
| Two or more Races | 105 | 0.8% |
| Some other Race | 118 | 0.9% |
| Total | 13,695 | 100.0% |
Ancestry in Oglala Lakota County
The most populous ancestries reported in Oglala Lakota County are Sioux (8,309 | 60.7%), Mexican (596 | 4.3%), French (227 | 1.7%), American (218 | 1.6%), and German (172 | 1.3%), together accounting for 69.5% of all Oglala Lakota County residents.
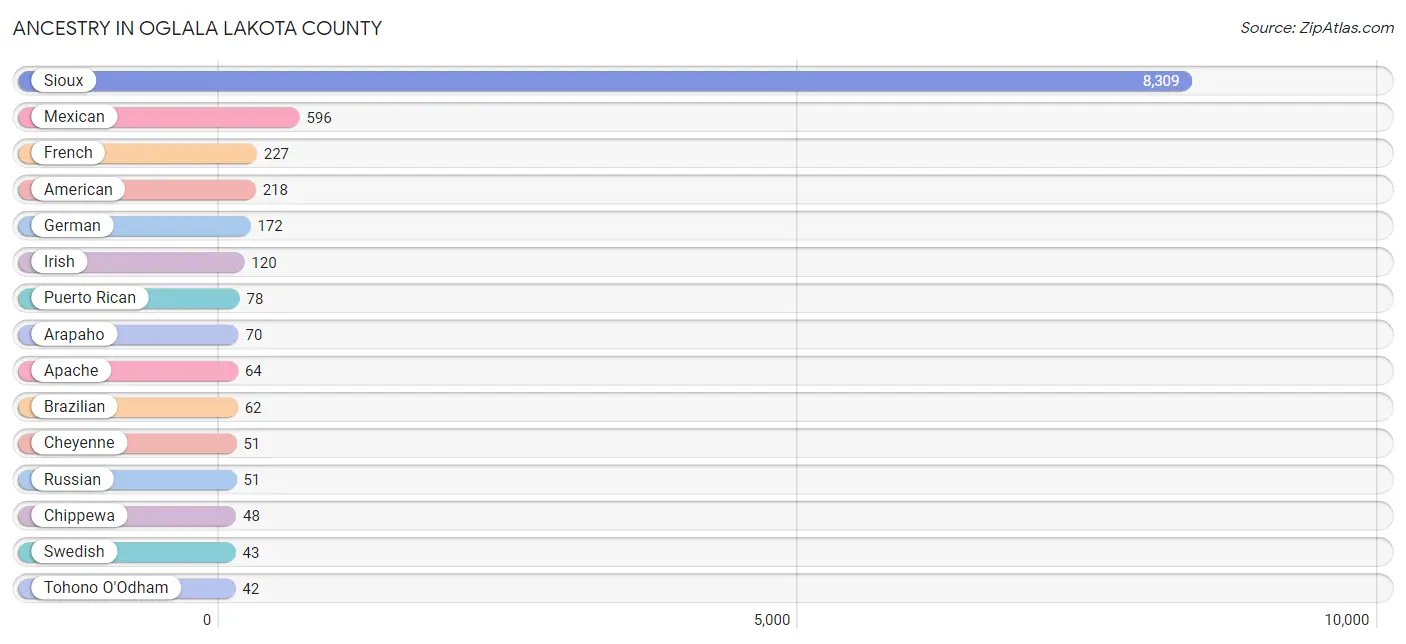
| Ancestry | # Population | % Population |
| American | 218 | 1.6% |
| Apache | 64 | 0.5% |
| Arapaho | 70 | 0.5% |
| Bhutanese | 15 | 0.1% |
| Brazilian | 62 | 0.4% |
| Burmese | 15 | 0.1% |
| Cheyenne | 51 | 0.4% |
| Chippewa | 48 | 0.4% |
| Czech | 9 | 0.1% |
| Danish | 40 | 0.3% |
| Dutch | 4 | 0.0% |
| English | 21 | 0.2% |
| French | 227 | 1.7% |
| German | 172 | 1.3% |
| Irish | 120 | 0.9% |
| Mexican | 596 | 4.3% |
| Norwegian | 28 | 0.2% |
| Polish | 8 | 0.1% |
| Pueblo | 5 | 0.0% |
| Puerto Rican | 78 | 0.6% |
| Russian | 51 | 0.4% |
| Scottish | 6 | 0.0% |
| Seminole | 10 | 0.1% |
| Sioux | 8,309 | 60.7% |
| Swedish | 43 | 0.3% |
| Tohono O'Odham | 42 | 0.3% |
| Ukrainian | 19 | 0.1% |
| Ute | 38 | 0.3% | View All 28 Rows |
Immigrants in Oglala Lakota County
The most numerous immigrant groups reported in Oglala Lakota County came from Europe (16 | 0.1%), France (16 | 0.1%), and Western Europe (16 | 0.1%), together accounting for 0.4% of all Oglala Lakota County residents.
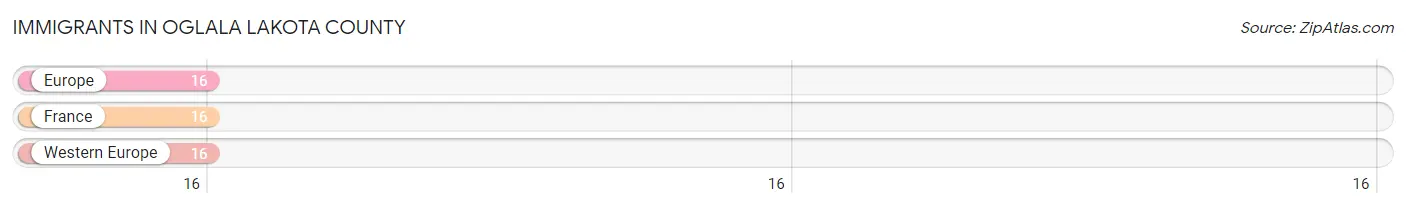
| Immigration Origin | # Population | % Population |
| Europe | 16 | 0.1% |
| France | 16 | 0.1% |
| Western Europe | 16 | 0.1% | View All 3 Rows |
Sex and Age in Oglala Lakota County
Sex and Age in Oglala Lakota County
The most populous age groups in Oglala Lakota County are 5 to 9 Years (832 | 12.1%) for men and 10 to 14 Years (796 | 11.7%) for women.
| Age Bracket | Male | Female |
| Under 5 Years | 693 (10.1%) | 548 (8.1%) |
| 5 to 9 Years | 832 (12.1%) | 625 (9.2%) |
| 10 to 14 Years | 814 (11.8%) | 796 (11.7%) |
| 15 to 19 Years | 588 (8.5%) | 588 (8.6%) |
| 20 to 24 Years | 618 (9.0%) | 599 (8.8%) |
| 25 to 29 Years | 525 (7.6%) | 460 (6.8%) |
| 30 to 34 Years | 463 (6.7%) | 467 (6.9%) |
| 35 to 39 Years | 488 (7.1%) | 466 (6.8%) |
| 40 to 44 Years | 235 (3.4%) | 298 (4.4%) |
| 45 to 49 Years | 296 (4.3%) | 315 (4.6%) |
| 50 to 54 Years | 391 (5.7%) | 416 (6.1%) |
| 55 to 59 Years | 277 (4.0%) | 313 (4.6%) |
| 60 to 64 Years | 289 (4.2%) | 270 (4.0%) |
| 65 to 69 Years | 282 (4.1%) | 245 (3.6%) |
| 70 to 74 Years | 32 (0.5%) | 133 (1.9%) |
| 75 to 79 Years | 0 (0.0%) | 119 (1.8%) |
| 80 to 84 Years | 56 (0.8%) | 54 (0.8%) |
| 85 Years and over | 7 (0.1%) | 97 (1.4%) |
| Total | 6,886 (100.0%) | 6,809 (100.0%) |
Families and Households in Oglala Lakota County
Median Family Size in Oglala Lakota County
The median family size in Oglala Lakota County is 5.51 persons per family, with married-couple families (604 | 27.5%) accounting for the largest median family size of 6.06 persons per family. On the other hand, single male/father families (285 | 13.0%) represent the smallest median family size with 3.37 persons per family.
| Family Type | # Families | Family Size |
| Married-Couple | 604 (27.5%) | 6.06 |
| Single Male/Father | 285 (13.0%) | 3.37 |
| Single Female/Mother | 1,307 (59.5%) | 5.73 |
| Total Families | 2,196 (100.0%) | 5.51 |
Median Household Size in Oglala Lakota County
The median household size in Oglala Lakota County is 4.99 persons per household, with married-couple households (604 | 22.5%) accounting for the largest median household size of 6.23 persons per household. non-family households (488 | 18.2%) represent the smallest median household size with 1.26 persons per household.
| Household Type | # Households | Household Size |
| Married-Couple | 604 (22.5%) | 6.23 |
| Single Male/Father | 285 (10.6%) | 3.50 |
| Single Female/Mother | 1,307 (48.7%) | 6.14 |
| Non-family | 488 (18.2%) | 1.26 |
| Total Households | 2,684 (100.0%) | 4.99 |
Household Size by Marriage Status in Oglala Lakota County
Out of a total of 2,684 households in Oglala Lakota County, 2,196 (81.8%) are family households, while 488 (18.2%) are nonfamily households. The most numerous type of family households are 7+ person households, comprising 552, and the most common type of nonfamily households are 1-person households, comprising 335.
| Household Size | Family Households | Nonfamily Households |
| 1-Person Households | - | 335 (12.5%) |
| 2-Person Households | 298 (11.1%) | 153 (5.7%) |
| 3-Person Households | 344 (12.8%) | 0 (0.0%) |
| 4-Person Households | 408 (15.2%) | 0 (0.0%) |
| 5-Person Households | 397 (14.8%) | 0 (0.0%) |
| 6-Person Households | 197 (7.3%) | 0 (0.0%) |
| 7+ Person Households | 552 (20.6%) | 0 (0.0%) |
| Total | 2,196 (81.8%) | 488 (18.2%) |
Female Fertility in Oglala Lakota County
Fertility by Age in Oglala Lakota County
Average fertility rate in Oglala Lakota County is 63.0 births per 1,000 women. Women in the age bracket of 20 to 34 years have the highest fertility rate with 91.0 births per 1,000 women. Women in the age bracket of 20 to 34 years acount for 65.9% of all women with births.
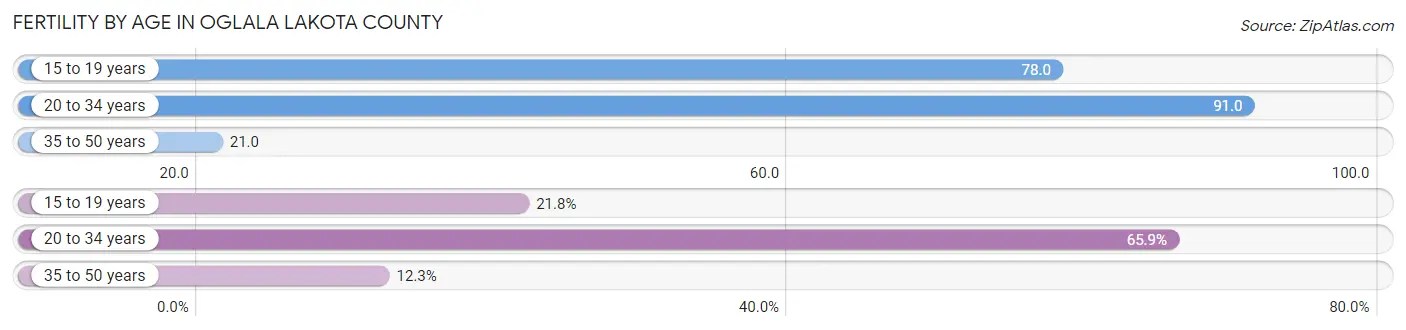
| Age Bracket | Women with Births | Births / 1,000 Women |
| 15 to 19 years | 46 (21.8%) | 78.0 |
| 20 to 34 years | 139 (65.9%) | 91.0 |
| 35 to 50 years | 26 (12.3%) | 21.0 |
| Total | 211 (100.0%) | 63.0 |
Fertility by Age by Marriage Status in Oglala Lakota County
29.4% of women with births (211) in Oglala Lakota County are married. The highest percentage of unmarried women with births falls into 15 to 19 years age bracket with 100.0% of them unmarried at the time of birth, while the lowest percentage of unmarried women with births belong to 20 to 34 years age bracket with 55.4% of them unmarried.
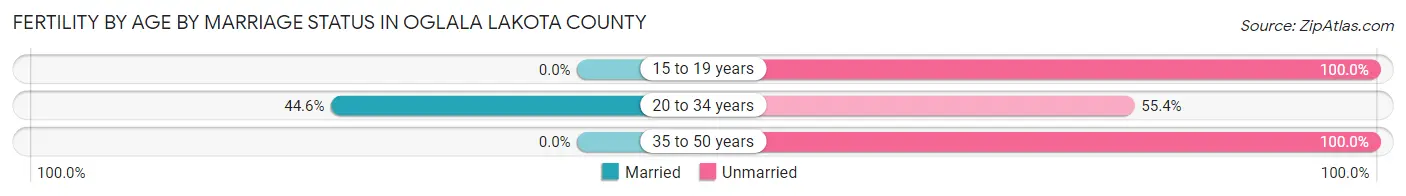
| Age Bracket | Married | Unmarried |
| 15 to 19 years | 0 (0.0%) | 46 (100.0%) |
| 20 to 34 years | 62 (44.6%) | 77 (55.4%) |
| 35 to 50 years | 0 (0.0%) | 26 (100.0%) |
| Total | 62 (29.4%) | 149 (70.6%) |
Fertility by Education in Oglala Lakota County
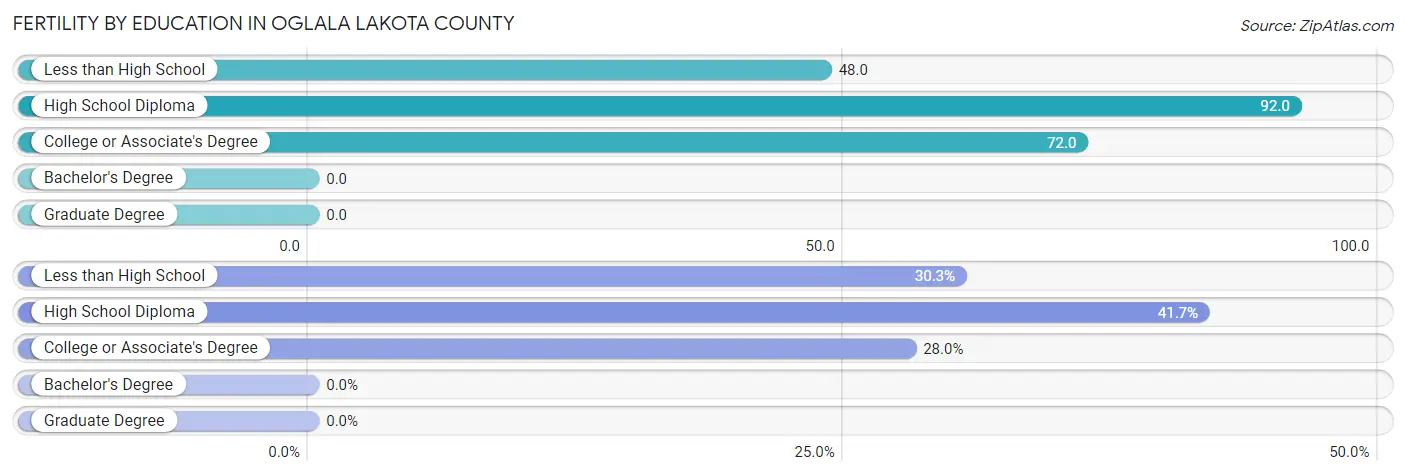
| Educational Attainment | Women with Births | Births / 1,000 Women |
| Less than High School | 64 (30.3%) | 48.0 |
| High School Diploma | 88 (41.7%) | 92.0 |
| College or Associate's Degree | 59 (28.0%) | 72.0 |
| Bachelor's Degree | 0 (0.0%) | 0.0 |
| Graduate Degree | 0 (0.0%) | 0.0 |
| Total | 211 (100.0%) | 63.0 |
Fertility by Education by Marriage Status in Oglala Lakota County
70.6% of women with births in Oglala Lakota County are unmarried. Women with the educational attainment of college or associate's degree are most likely to be married with 61.0% of them married at childbirth, while women with the educational attainment of less than high school are least likely to be married with 100.0% of them unmarried at childbirth.
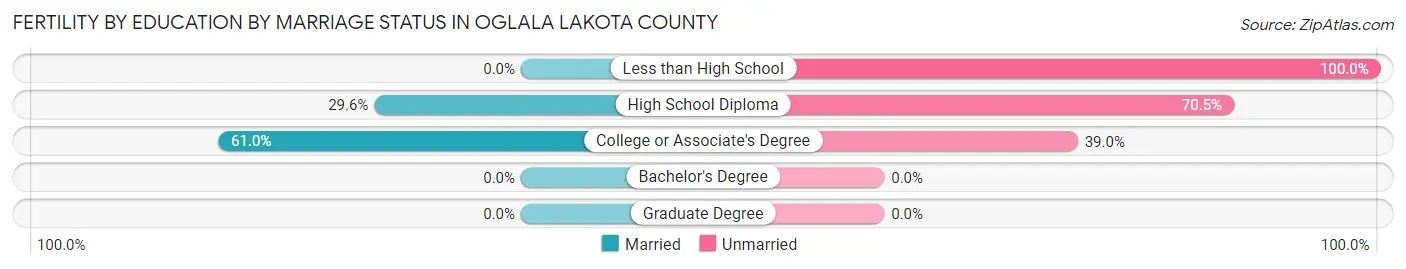
| Educational Attainment | Married | Unmarried |
| Less than High School | 0 (0.0%) | 64 (100.0%) |
| High School Diploma | 26 (29.5%) | 62 (70.5%) |
| College or Associate's Degree | 36 (61.0%) | 23 (39.0%) |
| Bachelor's Degree | 0 (0.0%) | 0 (0.0%) |
| Graduate Degree | 0 (0.0%) | 0 (0.0%) |
| Total | 62 (29.4%) | 149 (70.6%) |
Income in Oglala Lakota County
Income Overview in Oglala Lakota County
Per Capita Income in Oglala Lakota County is $10,955, while median incomes of families and households are $33,578 and $32,279 respectively.
| Characteristic | Number | Measure |
| Per Capita Income | 13,695 | $10,955 |
| Median Family Income | 2,196 | $33,578 |
| Mean Family Income | 2,196 | $50,041 |
| Median Household Income | 2,684 | $32,279 |
| Mean Household Income | 2,684 | $47,919 |
| Income Deficit | 2,196 | $18,264 |
| Wage / Income Gap (%) | 13,695 | 14.24% |
| Wage / Income Gap ($) | 13,695 | 85.76¢ per $1 |
| Gini / Inequality Index | 13,695 | 0.51 |
Earnings by Sex in Oglala Lakota County
Average Earnings in Oglala Lakota County are $30,492, $29,529 for men and $34,432 for women, a difference of 14.2%.
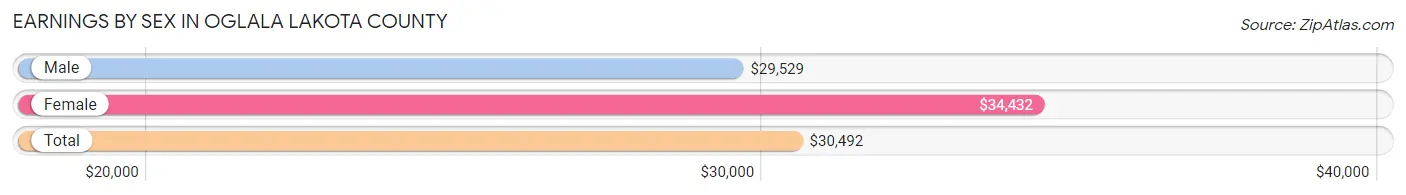
| Sex | Number | Average Earnings |
| Male | 1,711 (47.5%) | $29,529 |
| Female | 1,894 (52.5%) | $34,432 |
| Total | 3,605 (100.0%) | $30,492 |
Earnings by Sex by Income Bracket in Oglala Lakota County
The most common earnings brackets in Oglala Lakota County are $30,000 to $34,999 for men (322 | 18.8%) and $45,000 to $49,999 for women (241 | 12.7%).
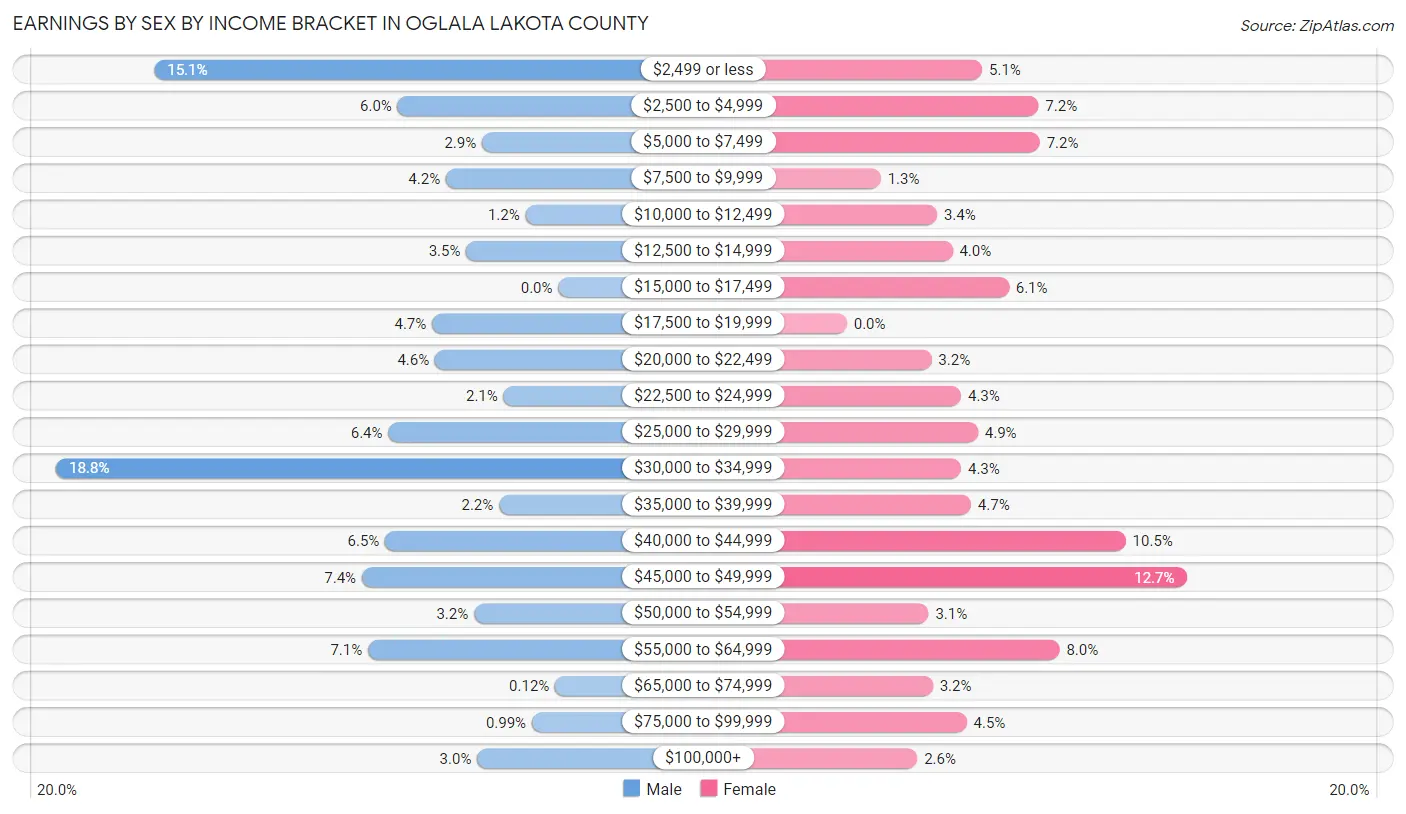
| Income | Male | Female |
| $2,499 or less | 259 (15.1%) | 96 (5.1%) |
| $2,500 to $4,999 | 103 (6.0%) | 136 (7.2%) |
| $5,000 to $7,499 | 49 (2.9%) | 137 (7.2%) |
| $7,500 to $9,999 | 72 (4.2%) | 24 (1.3%) |
| $10,000 to $12,499 | 21 (1.2%) | 64 (3.4%) |
| $12,500 to $14,999 | 59 (3.5%) | 75 (4.0%) |
| $15,000 to $17,499 | 0 (0.0%) | 115 (6.1%) |
| $17,500 to $19,999 | 81 (4.7%) | 0 (0.0%) |
| $20,000 to $22,499 | 79 (4.6%) | 60 (3.2%) |
| $22,500 to $24,999 | 35 (2.1%) | 81 (4.3%) |
| $25,000 to $29,999 | 109 (6.4%) | 93 (4.9%) |
| $30,000 to $34,999 | 322 (18.8%) | 81 (4.3%) |
| $35,000 to $39,999 | 38 (2.2%) | 88 (4.6%) |
| $40,000 to $44,999 | 111 (6.5%) | 198 (10.4%) |
| $45,000 to $49,999 | 126 (7.4%) | 241 (12.7%) |
| $50,000 to $54,999 | 54 (3.2%) | 58 (3.1%) |
| $55,000 to $64,999 | 122 (7.1%) | 151 (8.0%) |
| $65,000 to $74,999 | 2 (0.1%) | 61 (3.2%) |
| $75,000 to $99,999 | 17 (1.0%) | 85 (4.5%) |
| $100,000+ | 52 (3.0%) | 50 (2.6%) |
| Total | 1,711 (100.0%) | 1,894 (100.0%) |
Earnings by Sex by Educational Attainment in Oglala Lakota County
Average earnings in Oglala Lakota County are $30,729 for men and $39,068 for women, a difference of 21.3%. Men with an educational attainment of college or associate's degree enjoy the highest average annual earnings of $34,961, while those with less than high school education earn the least with $2,499. Women with an educational attainment of graduate degree earn the most with the average annual earnings of $70,536, while those with less than high school education have the smallest earnings of $5,531.
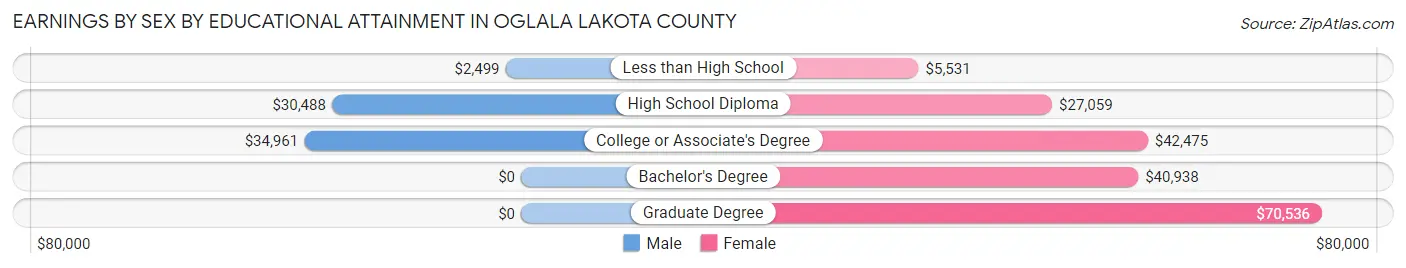
| Educational Attainment | Male Income | Female Income |
| Less than High School | $2,499 | $5,531 |
| High School Diploma | $30,488 | $27,059 |
| College or Associate's Degree | $34,961 | $42,475 |
| Bachelor's Degree | - | - |
| Graduate Degree | - | - |
| Total | $30,729 | $39,068 |
Family Income in Oglala Lakota County
Family Income Brackets in Oglala Lakota County
According to the Oglala Lakota County family income data, there are 393 families falling into the less than $10,000 income range, which is the most common income bracket and makes up 17.9% of all families. Conversely, the $200,000+ income bracket is the least frequent group with only 35 families (1.6%) belonging to this category.
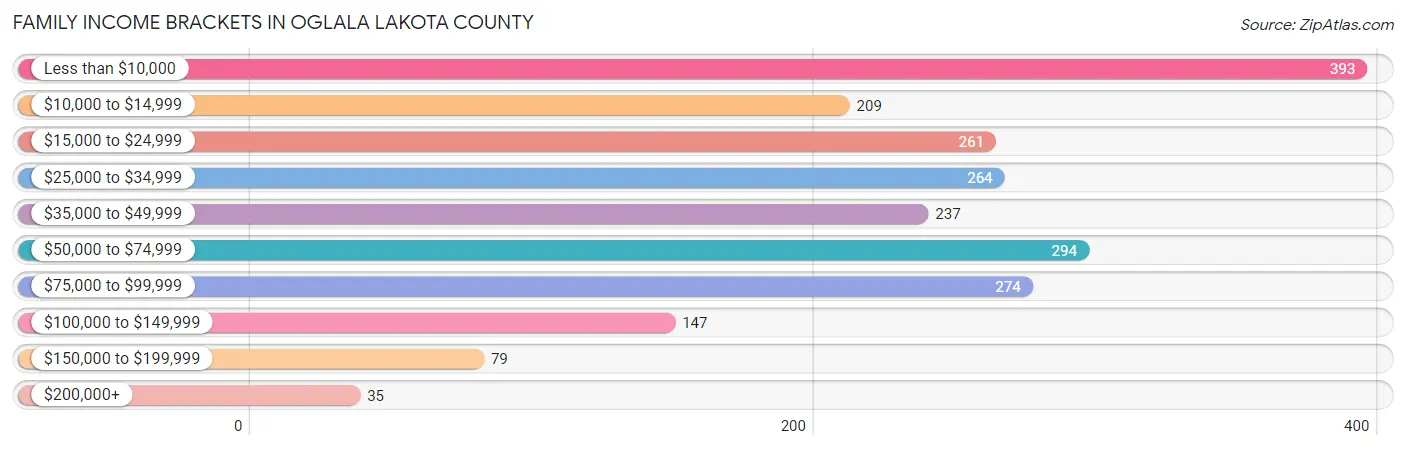
| Income Bracket | # Families | % Families |
| Less than $10,000 | 393 | 17.9% |
| $10,000 to $14,999 | 209 | 9.5% |
| $15,000 to $24,999 | 261 | 11.9% |
| $25,000 to $34,999 | 264 | 12.0% |
| $35,000 to $49,999 | 237 | 10.8% |
| $50,000 to $74,999 | 294 | 13.4% |
| $75,000 to $99,999 | 274 | 12.5% |
| $100,000 to $149,999 | 147 | 6.7% |
| $150,000 to $199,999 | 79 | 3.6% |
| $200,000+ | 35 | 1.6% |
Family Income by Famaliy Size in Oglala Lakota County
6-person families (242 | 11.0%) account for the highest median family income in Oglala Lakota County with $47,750 per family, while 5-person families (287 | 13.1%) have the highest median income of $8,481 per family member.
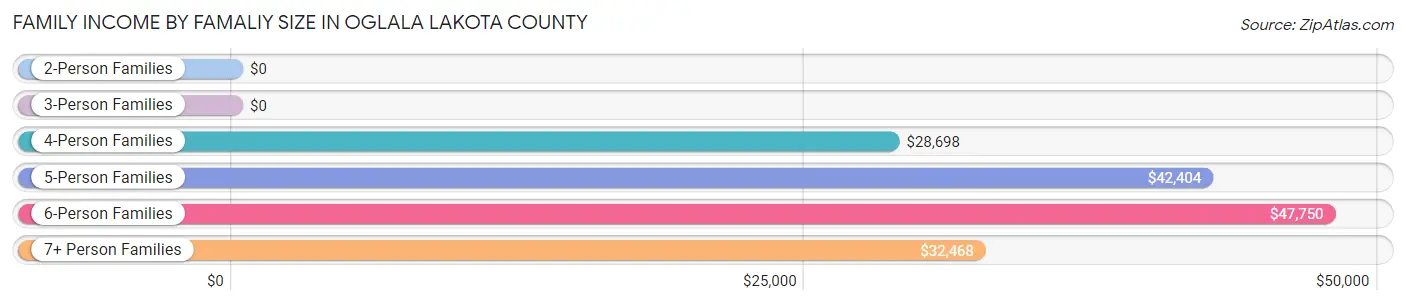
| Income Bracket | # Families | Median Income |
| 2-Person Families | 312 (14.2%) | $0 |
| 3-Person Families | 411 (18.7%) | $0 |
| 4-Person Families | 476 (21.7%) | $28,698 |
| 5-Person Families | 287 (13.1%) | $42,404 |
| 6-Person Families | 242 (11.0%) | $47,750 |
| 7+ Person Families | 468 (21.3%) | $32,468 |
| Total | 2,196 (100.0%) | $33,578 |
Family Income by Number of Earners in Oglala Lakota County
The median family income in Oglala Lakota County is $33,578, with families comprising 3+ earners (214) having the highest median family income of $118,311, while families with no earners (617) have the lowest median family income of $11,819, accounting for 9.7% and 28.1% of families, respectively.
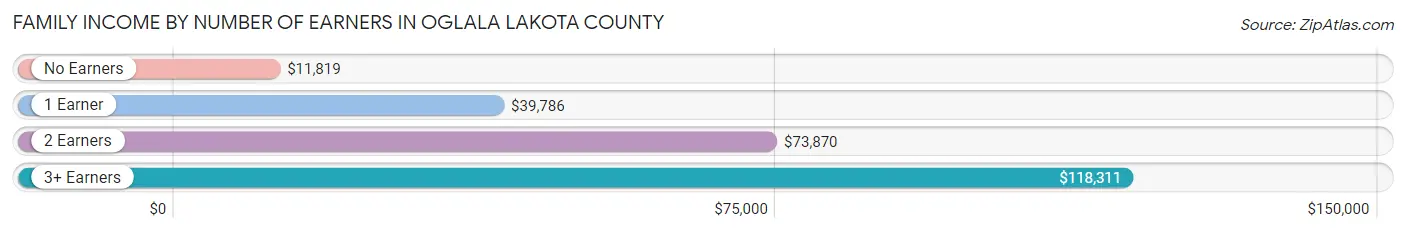
| Number of Earners | # Families | Median Income |
| No Earners | 617 (28.1%) | $11,819 |
| 1 Earner | 900 (41.0%) | $39,786 |
| 2 Earners | 465 (21.2%) | $73,870 |
| 3+ Earners | 214 (9.7%) | $118,311 |
| Total | 2,196 (100.0%) | $33,578 |
Household Income in Oglala Lakota County
Household Income Brackets in Oglala Lakota County
With 505 households falling in the category, the less than $10,000 income range is the most frequent in Oglala Lakota County, accounting for 18.8% of all households. In contrast, only 40 households (1.5%) fall into the $200,000+ income bracket, making it the least populous group.
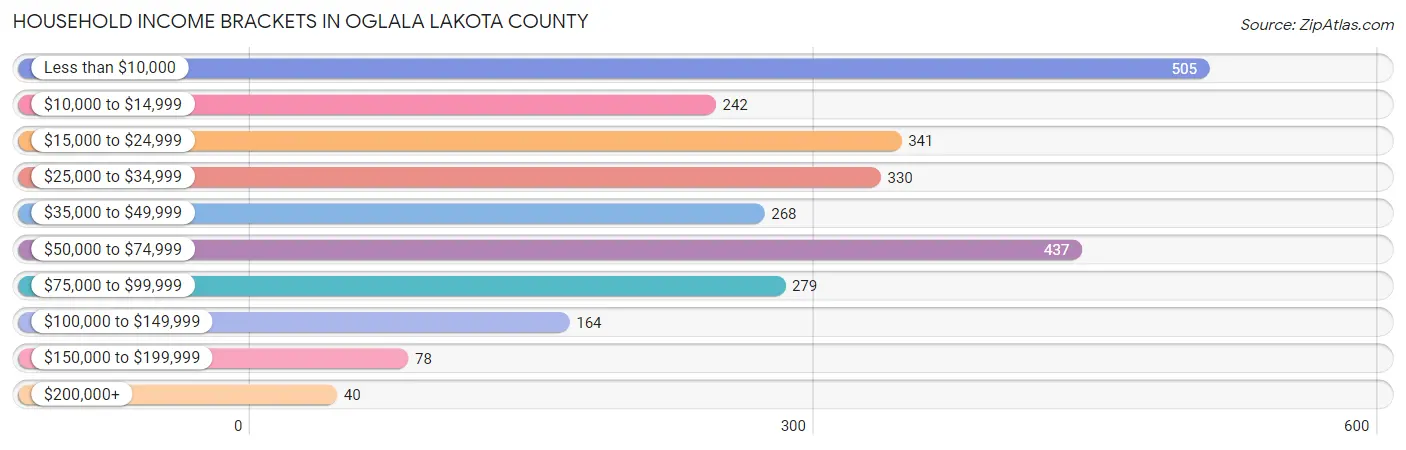
| Income Bracket | # Households | % Households |
| Less than $10,000 | 505 | 18.8% |
| $10,000 to $14,999 | 242 | 9.0% |
| $15,000 to $24,999 | 341 | 12.7% |
| $25,000 to $34,999 | 330 | 12.3% |
| $35,000 to $49,999 | 268 | 10.0% |
| $50,000 to $74,999 | 437 | 16.3% |
| $75,000 to $99,999 | 279 | 10.4% |
| $100,000 to $149,999 | 164 | 6.1% |
| $150,000 to $199,999 | 78 | 2.9% |
| $200,000+ | 40 | 1.5% |
Household Income by Householder Age in Oglala Lakota County
The median household income in Oglala Lakota County is $32,279, with the highest median household income of $47,930 found in the 45 to 64 years age bracket for the primary householder. A total of 1,249 households (46.5%) fall into this category. Meanwhile, the 15 to 24 years age bracket for the primary householder has the lowest median household income of $0, with 66 households (2.5%) in this group.
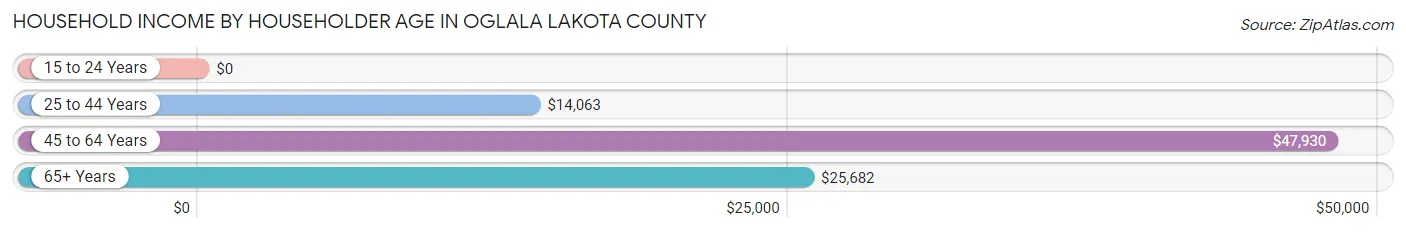
| Income Bracket | # Households | Median Income |
| 15 to 24 Years | 66 (2.5%) | $0 |
| 25 to 44 Years | 635 (23.7%) | $14,063 |
| 45 to 64 Years | 1,249 (46.5%) | $47,930 |
| 65+ Years | 734 (27.4%) | $25,682 |
| Total | 2,684 (100.0%) | $32,279 |
Poverty in Oglala Lakota County
Income Below Poverty by Sex and Age in Oglala Lakota County
With 56.5% poverty level for males and 55.0% for females among the residents of Oglala Lakota County, 6 to 11 year old males and 75 year old and over females are the most vulnerable to poverty, with 738 males (71.7%) and 208 females (79.7%) in their respective age groups living below the poverty level.
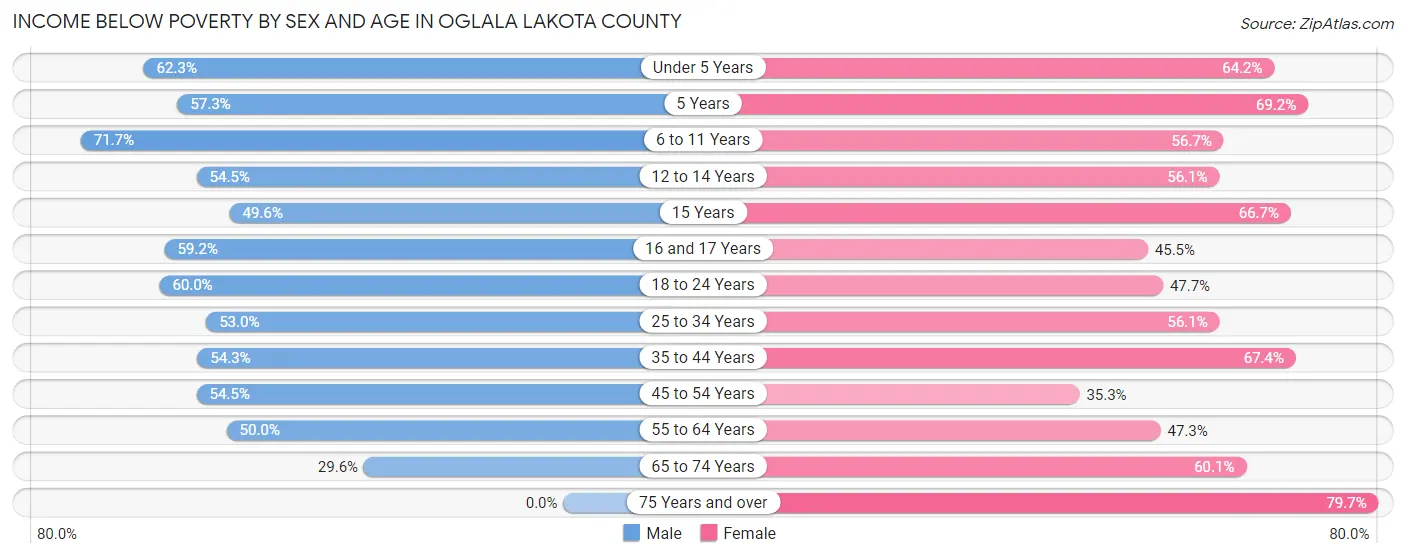
| Age Bracket | Male | Female |
| Under 5 Years | 432 (62.3%) | 352 (64.2%) |
| 5 Years | 102 (57.3%) | 54 (69.2%) |
| 6 to 11 Years | 738 (71.7%) | 368 (56.7%) |
| 12 to 14 Years | 214 (54.4%) | 389 (56.0%) |
| 15 Years | 57 (49.6%) | 48 (66.7%) |
| 16 and 17 Years | 151 (59.2%) | 135 (45.5%) |
| 18 to 24 Years | 478 (60.0%) | 382 (47.7%) |
| 25 to 34 Years | 518 (53.0%) | 520 (56.1%) |
| 35 to 44 Years | 382 (54.3%) | 515 (67.4%) |
| 45 to 54 Years | 366 (54.5%) | 258 (35.3%) |
| 55 to 64 Years | 283 (50.0%) | 276 (47.3%) |
| 65 to 74 Years | 93 (29.6%) | 227 (60.1%) |
| 75 Years and over | 0 (0.0%) | 208 (79.7%) |
| Total | 3,814 (56.5%) | 3,732 (55.0%) |
Income Above Poverty by Sex and Age in Oglala Lakota County
According to the poverty statistics in Oglala Lakota County, males aged 75 years and over and females aged 45 to 54 years are the age groups that are most secure financially, with 100.0% of males and 64.7% of females in these age groups living above the poverty line.
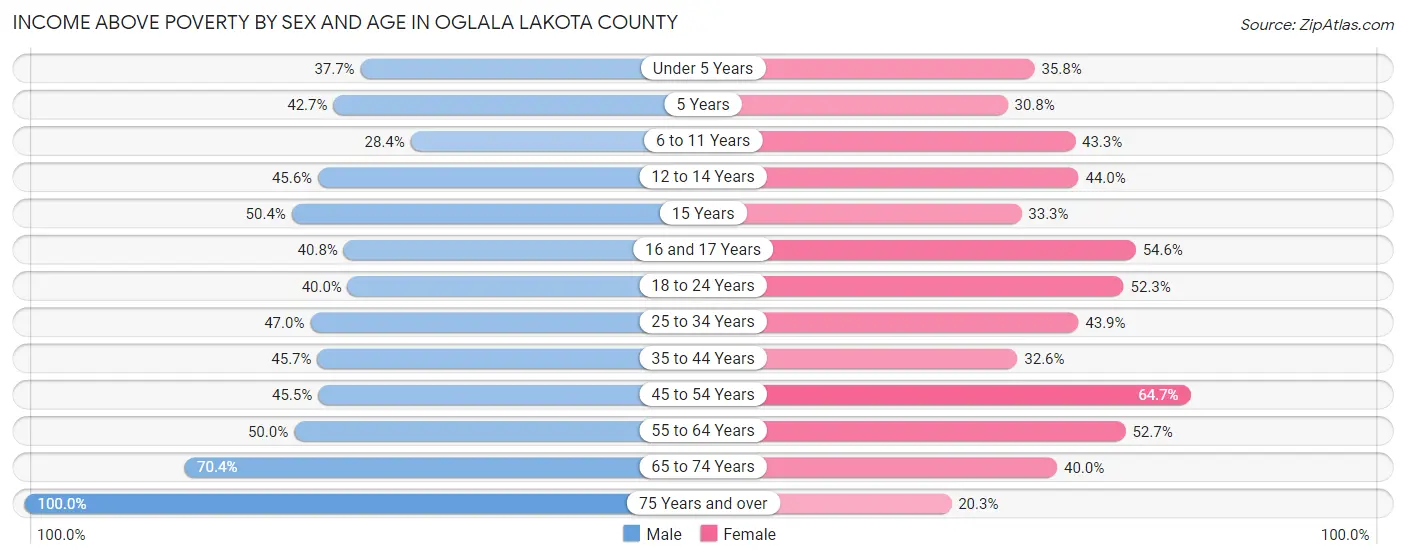
| Age Bracket | Male | Female |
| Under 5 Years | 261 (37.7%) | 196 (35.8%) |
| 5 Years | 76 (42.7%) | 24 (30.8%) |
| 6 to 11 Years | 292 (28.3%) | 281 (43.3%) |
| 12 to 14 Years | 179 (45.6%) | 305 (44.0%) |
| 15 Years | 58 (50.4%) | 24 (33.3%) |
| 16 and 17 Years | 104 (40.8%) | 162 (54.5%) |
| 18 to 24 Years | 319 (40.0%) | 419 (52.3%) |
| 25 to 34 Years | 459 (47.0%) | 407 (43.9%) |
| 35 to 44 Years | 321 (45.7%) | 249 (32.6%) |
| 45 to 54 Years | 306 (45.5%) | 473 (64.7%) |
| 55 to 64 Years | 283 (50.0%) | 307 (52.7%) |
| 65 to 74 Years | 221 (70.4%) | 151 (40.0%) |
| 75 Years and over | 53 (100.0%) | 53 (20.3%) |
| Total | 2,932 (43.5%) | 3,051 (45.0%) |
Income Below Poverty Among Married-Couple Families in Oglala Lakota County
The poverty statistics for married-couple families in Oglala Lakota County show that 29.1% or 176 of the total 604 families live below the poverty line. Families with 5 or more children have the highest poverty rate of 80.4%, comprising of 45 families. On the other hand, families with no children have the lowest poverty rate of 0.0%, which includes 0 families.
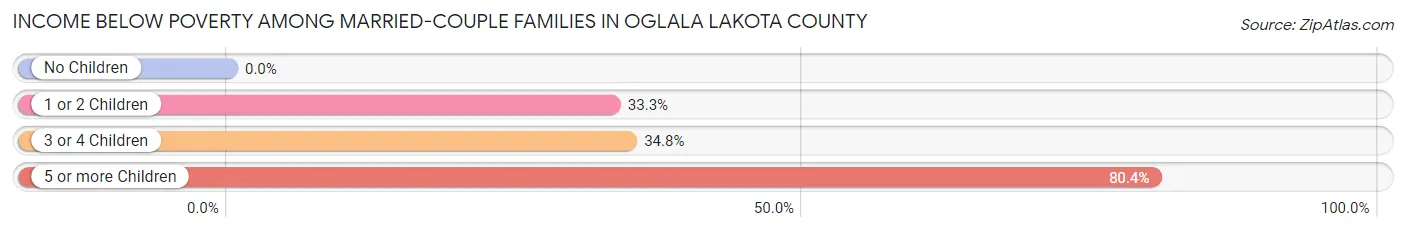
| Children | Above Poverty | Below Poverty |
| No Children | 165 (100.0%) | 0 (0.0%) |
| 1 or 2 Children | 98 (66.7%) | 49 (33.3%) |
| 3 or 4 Children | 154 (65.2%) | 82 (34.7%) |
| 5 or more Children | 11 (19.6%) | 45 (80.4%) |
| Total | 428 (70.9%) | 176 (29.1%) |
Income Below Poverty Among Single-Parent Households in Oglala Lakota County
According to the poverty data in Oglala Lakota County, 60.0% or 171 single-father households and 60.1% or 785 single-mother households are living below the poverty line. Among single-father households, those with 3 or 4 children have the highest poverty rate, with 4 households (100.0%) experiencing poverty. Likewise, among single-mother households, those with 5 or more children have the highest poverty rate, with 160 households (83.8%) falling below the poverty line.
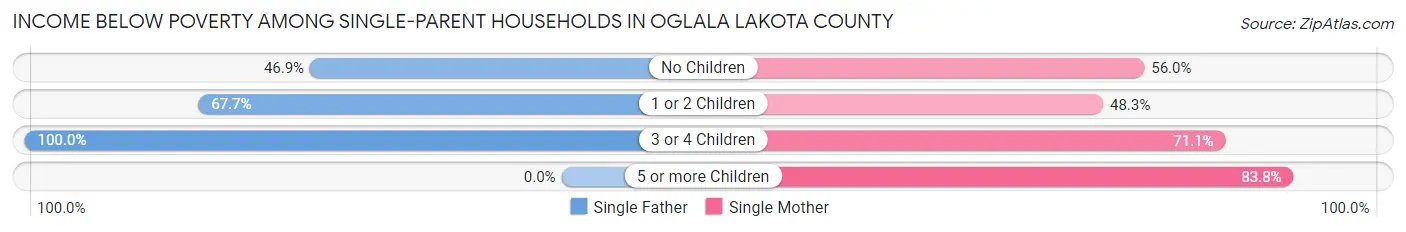
| Children | Single Father | Single Mother |
| No Children | 52 (46.9%) | 126 (56.0%) |
| 1 or 2 Children | 115 (67.6%) | 285 (48.3%) |
| 3 or 4 Children | 4 (100.0%) | 214 (71.1%) |
| 5 or more Children | 0 (0.0%) | 160 (83.8%) |
| Total | 171 (60.0%) | 785 (60.1%) |
Income Below Poverty Among Married-Couple vs Single-Parent Households in Oglala Lakota County
The poverty data for Oglala Lakota County shows that 176 of the married-couple family households (29.1%) and 956 of the single-parent households (60.1%) are living below the poverty level. Within the married-couple family households, those with 5 or more children have the highest poverty rate, with 45 households (80.4%) falling below the poverty line. Among the single-parent households, those with 5 or more children have the highest poverty rate, with 160 household (83.8%) living below poverty.
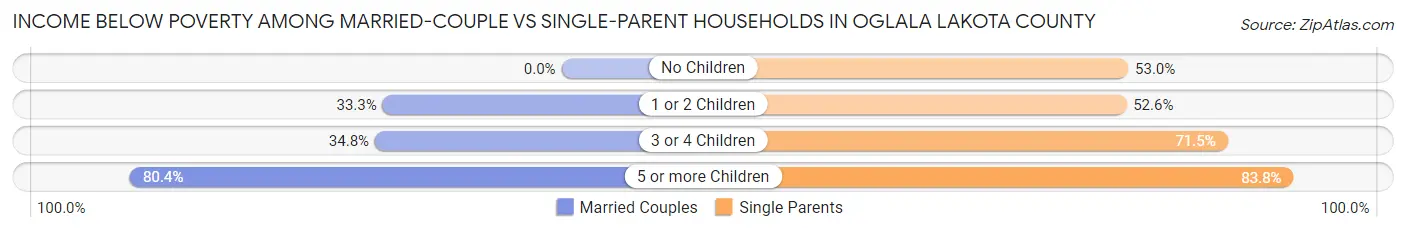
| Children | Married-Couple Families | Single-Parent Households |
| No Children | 0 (0.0%) | 178 (53.0%) |
| 1 or 2 Children | 49 (33.3%) | 400 (52.6%) |
| 3 or 4 Children | 82 (34.7%) | 218 (71.5%) |
| 5 or more Children | 45 (80.4%) | 160 (83.8%) |
| Total | 176 (29.1%) | 956 (60.1%) |
Employment Characteristics in Oglala Lakota County
Employment by Class of Employer in Oglala Lakota County
Among the 3,123 employed individuals in Oglala Lakota County, local government employees (1,297 | 41.5%), private company employees (840 | 26.9%), and federal government employees (488 | 15.6%) make up the most common classes of employment.
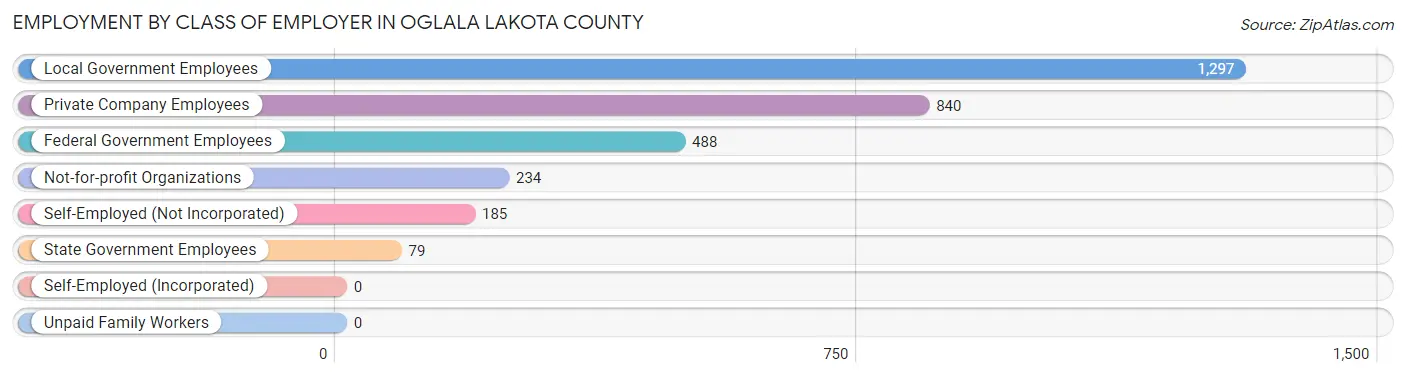
| Employer Class | # Employees | % Employees |
| Private Company Employees | 840 | 26.9% |
| Self-Employed (Incorporated) | 0 | 0.0% |
| Self-Employed (Not Incorporated) | 185 | 5.9% |
| Not-for-profit Organizations | 234 | 7.5% |
| Local Government Employees | 1,297 | 41.5% |
| State Government Employees | 79 | 2.5% |
| Federal Government Employees | 488 | 15.6% |
| Unpaid Family Workers | 0 | 0.0% |
| Total | 3,123 | 100.0% |
Employment Status by Age in Oglala Lakota County
According to the labor force statistics for Oglala Lakota County, out of the total population over 16 years of age (9,200), 39.0% or 3,588 individuals are in the labor force, with 11.8% or 423 of them unemployed. The age group with the highest labor force participation rate is 45 to 54 years, with 51.2% or 726 individuals in the labor force. Within the labor force, the 75 years and over age range has the highest percentage of unemployed individuals, with 100.0% or 30 of them being unemployed.
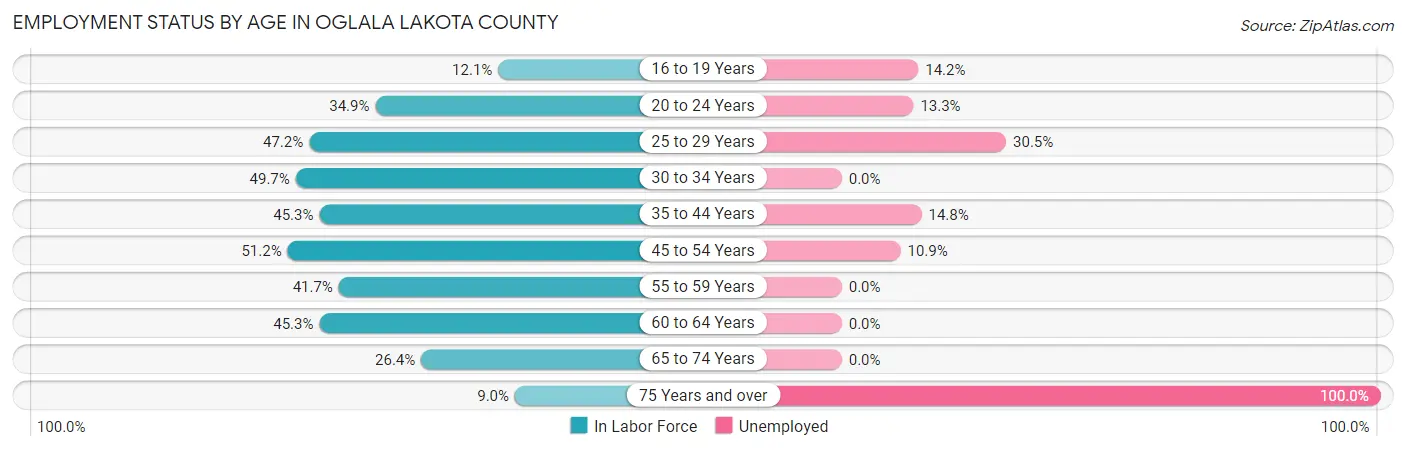
| Age Bracket | In Labor Force | Unemployed |
| 16 to 19 Years | 120 (12.1%) | 17 (14.2%) |
| 20 to 24 Years | 425 (34.9%) | 57 (13.3%) |
| 25 to 29 Years | 465 (47.2%) | 142 (30.5%) |
| 30 to 34 Years | 462 (49.7%) | 0 (0.0%) |
| 35 to 44 Years | 674 (45.3%) | 100 (14.8%) |
| 45 to 54 Years | 726 (51.2%) | 79 (10.9%) |
| 55 to 59 Years | 246 (41.7%) | 0 (0.0%) |
| 60 to 64 Years | 253 (45.3%) | 0 (0.0%) |
| 65 to 74 Years | 183 (26.4%) | 0 (0.0%) |
| 75 Years and over | 30 (9.0%) | 30 (100.0%) |
| Total | 3,588 (39.0%) | 423 (11.8%) |
Employment Status by Educational Attainment in Oglala Lakota County
According to labor force statistics for Oglala Lakota County, 47.3% of individuals (2,823) out of the total population between 25 and 64 years of age (5,969) are in the labor force, with 11.4% or 322 of them being unemployed. The group with the highest labor force participation rate are those with the educational attainment of bachelor's degree or higher, with 81.4% or 373 individuals in the labor force. Within the labor force, individuals with less than high school education have the highest percentage of unemployment, with 16.4% or 69 of them being unemployed.
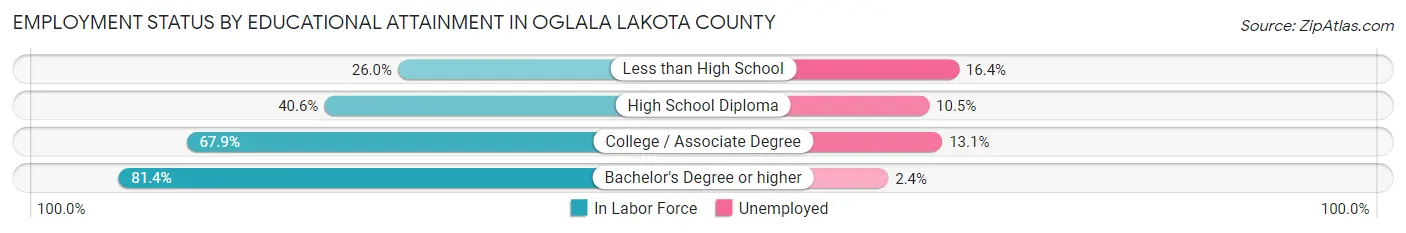
| Educational Attainment | In Labor Force | Unemployed |
| Less than High School | 420 (26.0%) | 265 (16.4%) |
| High School Diploma | 911 (40.6%) | 236 (10.5%) |
| College / Associate Degree | 1,121 (67.9%) | 216 (13.1%) |
| Bachelor's Degree or higher | 373 (81.4%) | 11 (2.4%) |
| Total | 2,823 (47.3%) | 680 (11.4%) |
Employment Occupations by Sex in Oglala Lakota County
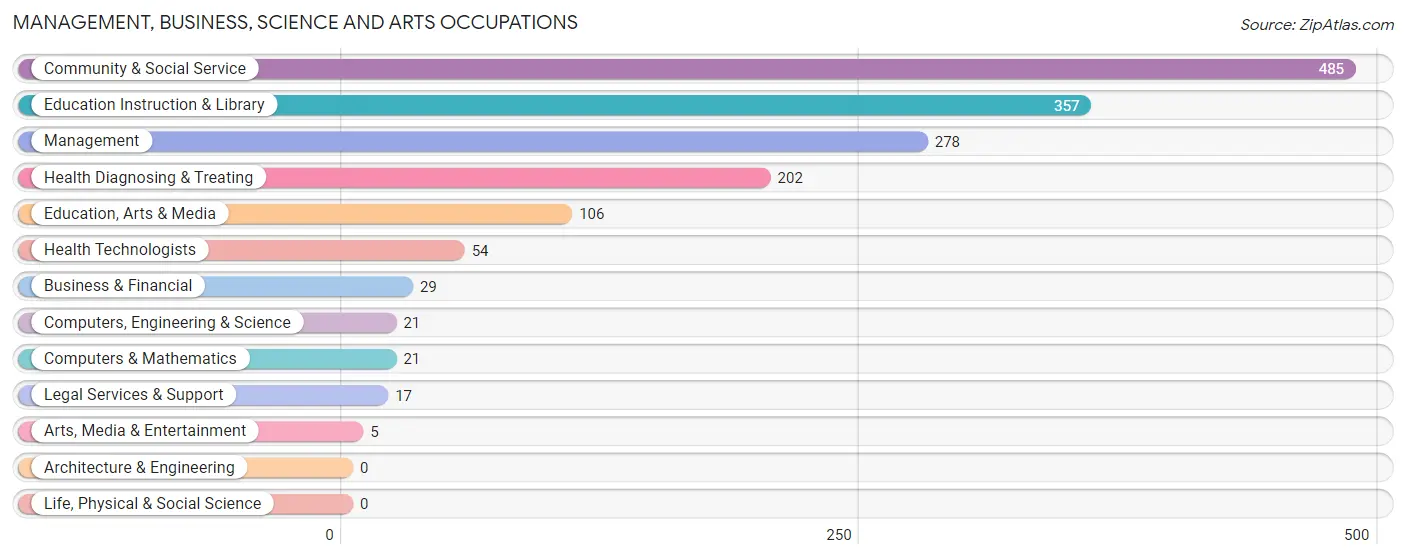
Management, Business, Science and Arts Occupations
The most common Management, Business, Science and Arts occupations in Oglala Lakota County are Community & Social Service (485 | 15.5%), Education Instruction & Library (357 | 11.4%), Management (278 | 8.9%), Health Diagnosing & Treating (202 | 6.4%), and Education, Arts & Media (106 | 3.4%).
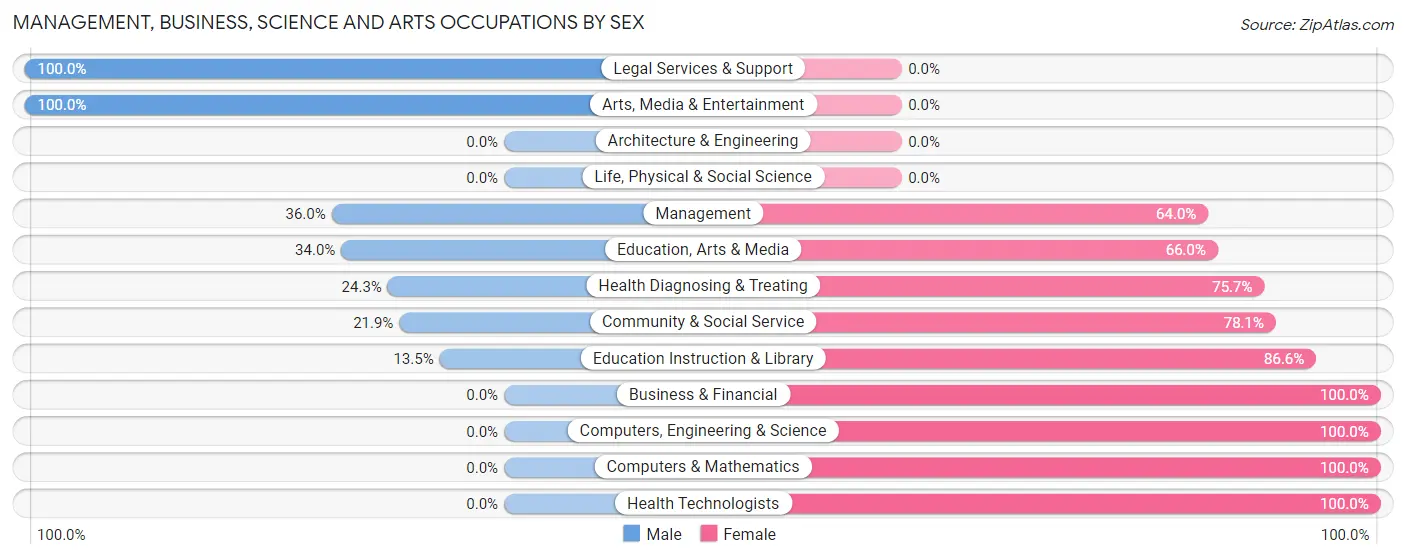
Management, Business, Science and Arts Occupations by Sex
Within the Management, Business, Science and Arts occupations in Oglala Lakota County, the most male-oriented occupations are Legal Services & Support (100.0%), Arts, Media & Entertainment (100.0%), and Management (36.0%), while the most female-oriented occupations are Business & Financial (100.0%), Computers, Engineering & Science (100.0%), and Computers & Mathematics (100.0%).
| Occupation | Male | Female |
| Management | 100 (36.0%) | 178 (64.0%) |
| Business & Financial | 0 (0.0%) | 29 (100.0%) |
| Computers, Engineering & Science | 0 (0.0%) | 21 (100.0%) |
| Computers & Mathematics | 0 (0.0%) | 21 (100.0%) |
| Architecture & Engineering | 0 (0.0%) | 0 (0.0%) |
| Life, Physical & Social Science | 0 (0.0%) | 0 (0.0%) |
| Community & Social Service | 106 (21.9%) | 379 (78.1%) |
| Education, Arts & Media | 36 (34.0%) | 70 (66.0%) |
| Legal Services & Support | 17 (100.0%) | 0 (0.0%) |
| Education Instruction & Library | 48 (13.5%) | 309 (86.6%) |
| Arts, Media & Entertainment | 5 (100.0%) | 0 (0.0%) |
| Health Diagnosing & Treating | 49 (24.3%) | 153 (75.7%) |
| Health Technologists | 0 (0.0%) | 54 (100.0%) |
| Total (Category) | 255 (25.1%) | 760 (74.9%) |
| Total (Overall) | 1,412 (45.0%) | 1,725 (55.0%) |
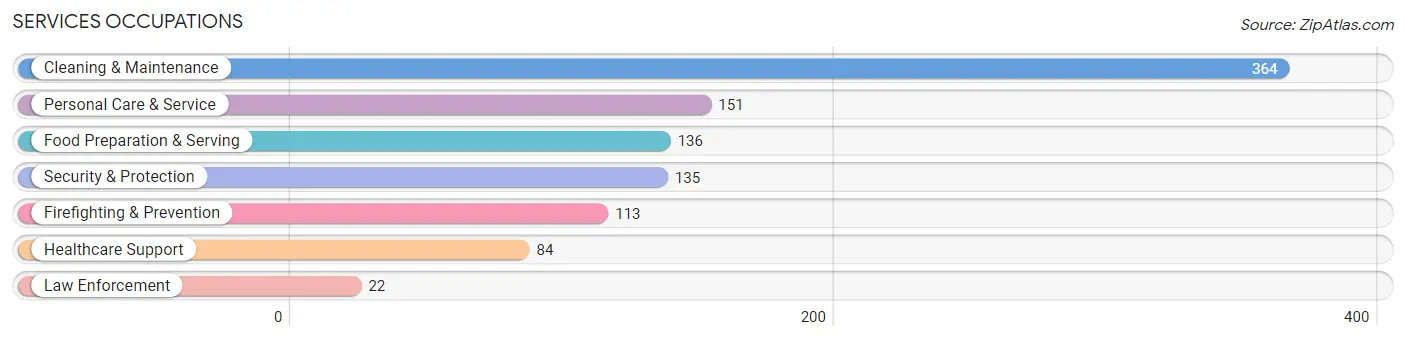
Services Occupations
The most common Services occupations in Oglala Lakota County are Cleaning & Maintenance (364 | 11.6%), Personal Care & Service (151 | 4.8%), Food Preparation & Serving (136 | 4.3%), Security & Protection (135 | 4.3%), and Firefighting & Prevention (113 | 3.6%).
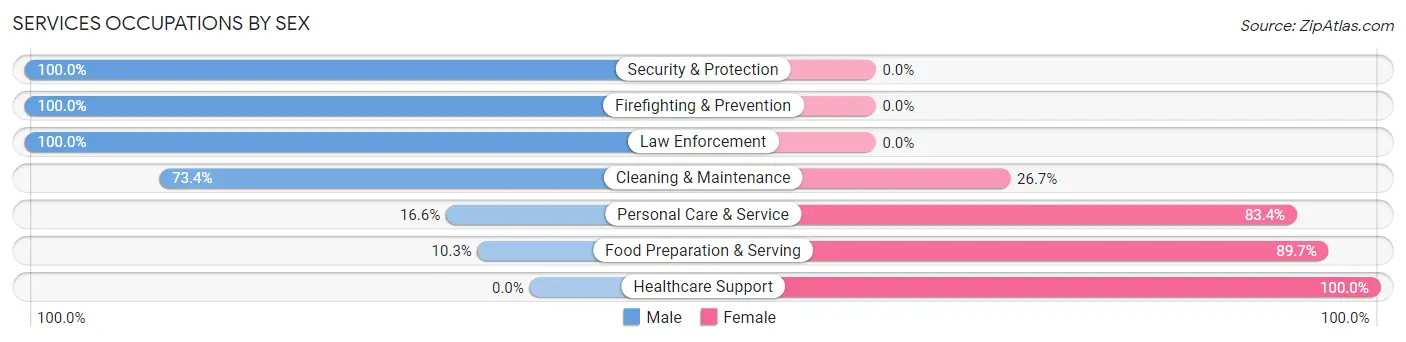
Services Occupations by Sex
Within the Services occupations in Oglala Lakota County, the most male-oriented occupations are Security & Protection (100.0%), Firefighting & Prevention (100.0%), and Law Enforcement (100.0%), while the most female-oriented occupations are Healthcare Support (100.0%), Food Preparation & Serving (89.7%), and Personal Care & Service (83.4%).
| Occupation | Male | Female |
| Healthcare Support | 0 (0.0%) | 84 (100.0%) |
| Security & Protection | 135 (100.0%) | 0 (0.0%) |
| Firefighting & Prevention | 113 (100.0%) | 0 (0.0%) |
| Law Enforcement | 22 (100.0%) | 0 (0.0%) |
| Food Preparation & Serving | 14 (10.3%) | 122 (89.7%) |
| Cleaning & Maintenance | 267 (73.4%) | 97 (26.7%) |
| Personal Care & Service | 25 (16.6%) | 126 (83.4%) |
| Total (Category) | 441 (50.7%) | 429 (49.3%) |
| Total (Overall) | 1,412 (45.0%) | 1,725 (55.0%) |
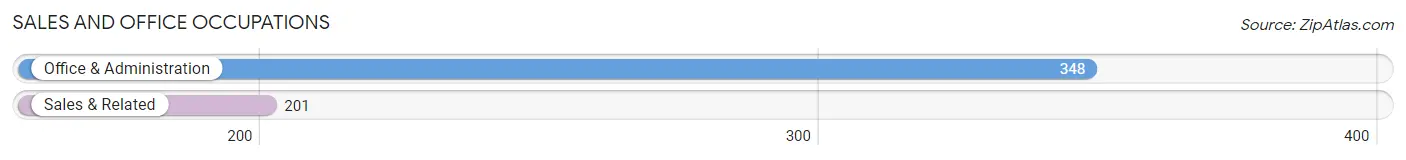
Sales and Office Occupations
The most common Sales and Office occupations in Oglala Lakota County are Office & Administration (348 | 11.1%), and Sales & Related (201 | 6.4%).
Sales and Office Occupations by Sex
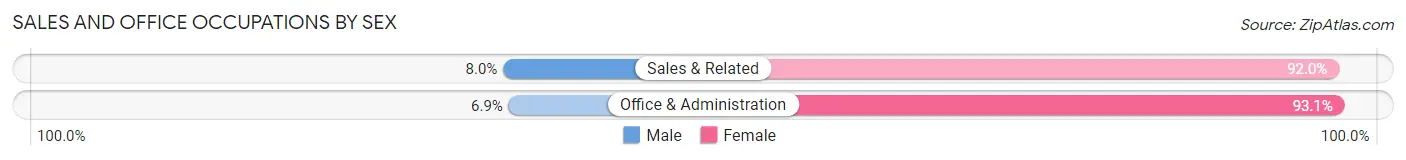
| Occupation | Male | Female |
| Sales & Related | 16 (8.0%) | 185 (92.0%) |
| Office & Administration | 24 (6.9%) | 324 (93.1%) |
| Total (Category) | 40 (7.3%) | 509 (92.7%) |
| Total (Overall) | 1,412 (45.0%) | 1,725 (55.0%) |
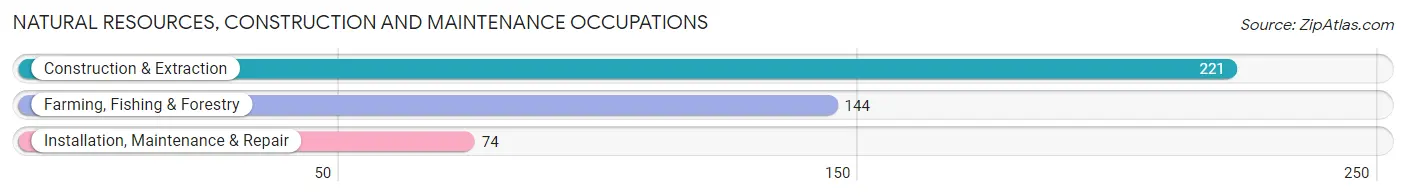
Natural Resources, Construction and Maintenance Occupations
The most common Natural Resources, Construction and Maintenance occupations in Oglala Lakota County are Construction & Extraction (221 | 7.0%), Farming, Fishing & Forestry (144 | 4.6%), and Installation, Maintenance & Repair (74 | 2.4%).
Natural Resources, Construction and Maintenance Occupations by Sex
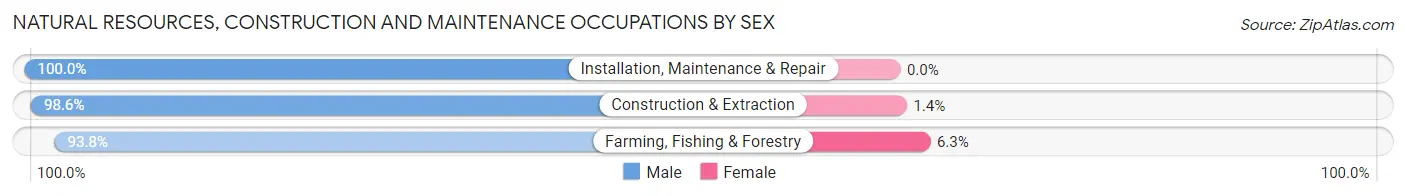
| Occupation | Male | Female |
| Farming, Fishing & Forestry | 135 (93.8%) | 9 (6.2%) |
| Construction & Extraction | 218 (98.6%) | 3 (1.4%) |
| Installation, Maintenance & Repair | 74 (100.0%) | 0 (0.0%) |
| Total (Category) | 427 (97.3%) | 12 (2.7%) |
| Total (Overall) | 1,412 (45.0%) | 1,725 (55.0%) |
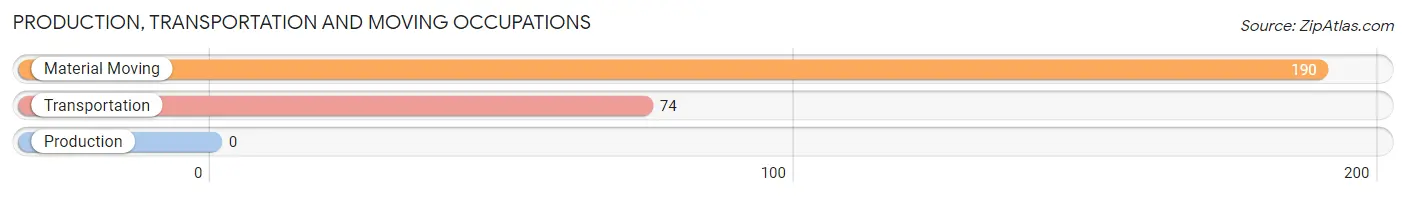
Production, Transportation and Moving Occupations
The most common Production, Transportation and Moving occupations in Oglala Lakota County are Material Moving (190 | 6.1%), and Transportation (74 | 2.4%).
Production, Transportation and Moving Occupations by Sex
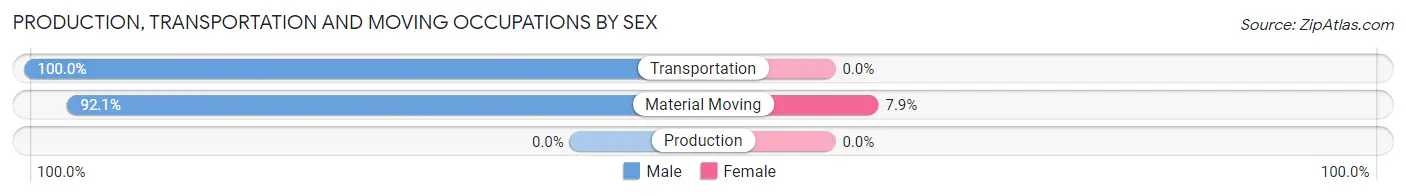
| Occupation | Male | Female |
| Production | 0 (0.0%) | 0 (0.0%) |
| Transportation | 74 (100.0%) | 0 (0.0%) |
| Material Moving | 175 (92.1%) | 15 (7.9%) |
| Total (Category) | 249 (94.3%) | 15 (5.7%) |
| Total (Overall) | 1,412 (45.0%) | 1,725 (55.0%) |
Employment Industries by Sex in Oglala Lakota County
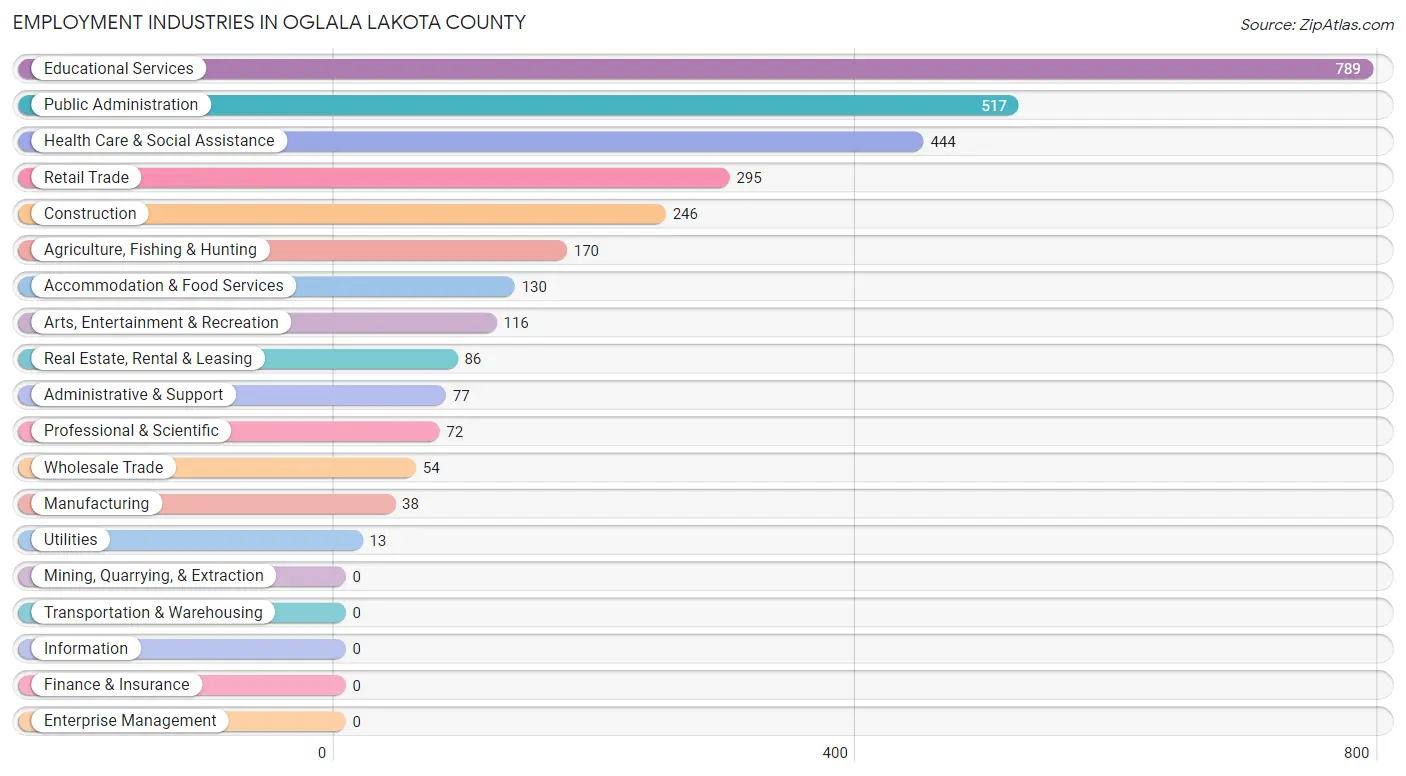
Employment Industries in Oglala Lakota County
The major employment industries in Oglala Lakota County include Educational Services (789 | 25.2%), Public Administration (517 | 16.5%), Health Care & Social Assistance (444 | 14.1%), Retail Trade (295 | 9.4%), and Construction (246 | 7.8%).
Employment Industries by Sex in Oglala Lakota County
The Oglala Lakota County industries that see more men than women are Manufacturing (100.0%), Wholesale Trade (100.0%), and Construction (98.8%), whereas the industries that tend to have a higher number of women are Utilities (100.0%), Accommodation & Food Services (79.2%), and Educational Services (77.1%).
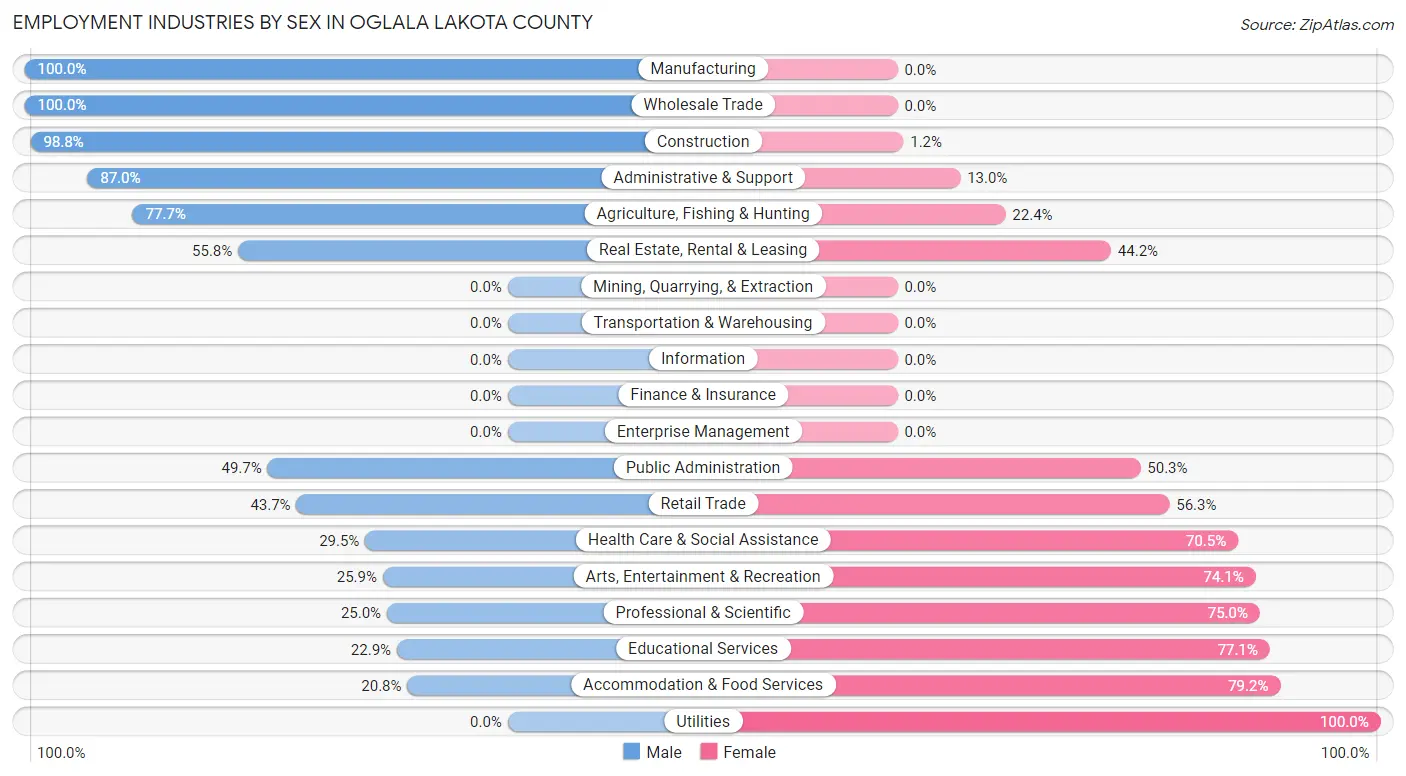
| Industry | Male | Female |
| Agriculture, Fishing & Hunting | 132 (77.6%) | 38 (22.4%) |
| Mining, Quarrying, & Extraction | 0 (0.0%) | 0 (0.0%) |
| Construction | 243 (98.8%) | 3 (1.2%) |
| Manufacturing | 38 (100.0%) | 0 (0.0%) |
| Wholesale Trade | 54 (100.0%) | 0 (0.0%) |
| Retail Trade | 129 (43.7%) | 166 (56.3%) |
| Transportation & Warehousing | 0 (0.0%) | 0 (0.0%) |
| Utilities | 0 (0.0%) | 13 (100.0%) |
| Information | 0 (0.0%) | 0 (0.0%) |
| Finance & Insurance | 0 (0.0%) | 0 (0.0%) |
| Real Estate, Rental & Leasing | 48 (55.8%) | 38 (44.2%) |
| Professional & Scientific | 18 (25.0%) | 54 (75.0%) |
| Enterprise Management | 0 (0.0%) | 0 (0.0%) |
| Administrative & Support | 67 (87.0%) | 10 (13.0%) |
| Educational Services | 181 (22.9%) | 608 (77.1%) |
| Health Care & Social Assistance | 131 (29.5%) | 313 (70.5%) |
| Arts, Entertainment & Recreation | 30 (25.9%) | 86 (74.1%) |
| Accommodation & Food Services | 27 (20.8%) | 103 (79.2%) |
| Public Administration | 257 (49.7%) | 260 (50.3%) |
| Total | 1,412 (45.0%) | 1,725 (55.0%) |
Education in Oglala Lakota County
School Enrollment in Oglala Lakota County
The most common levels of schooling among the 4,408 students in Oglala Lakota County are elementary school (1,220 | 27.7%), high school (1,165 | 26.4%), and middle school (1,146 | 26.0%).
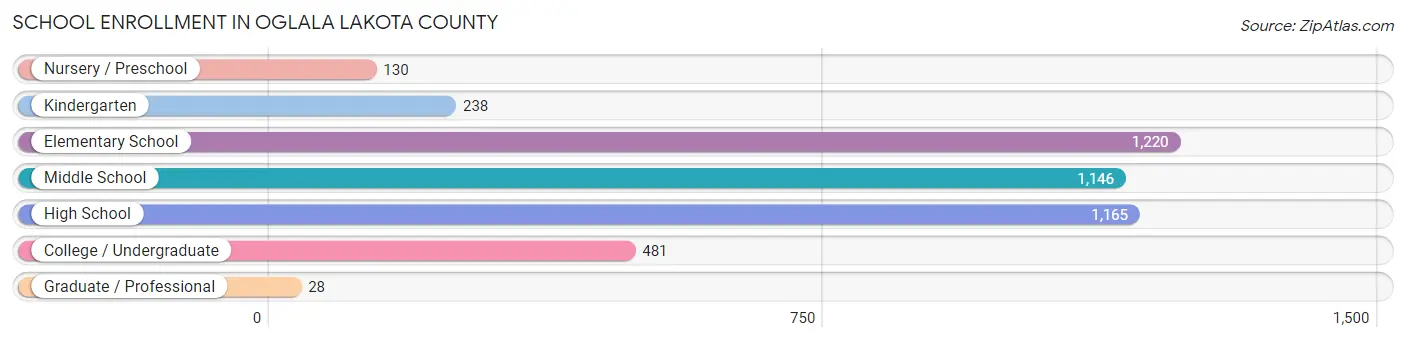
| School Level | # Students | % Students |
| Nursery / Preschool | 130 | 2.9% |
| Kindergarten | 238 | 5.4% |
| Elementary School | 1,220 | 27.7% |
| Middle School | 1,146 | 26.0% |
| High School | 1,165 | 26.4% |
| College / Undergraduate | 481 | 10.9% |
| Graduate / Professional | 28 | 0.6% |
| Total | 4,408 | 100.0% |
School Enrollment by Age by Funding Source in Oglala Lakota County
Out of a total of 4,408 students who are enrolled in schools in Oglala Lakota County, 591 (13.4%) attend a private institution, while the remaining 3,817 (86.6%) are enrolled in public schools. The age group of 5 to 9 year old has the highest likelihood of being enrolled in private schools, with 256 (21.2% in the age bracket) enrolled. Conversely, the age group of 3 to 4 year olds has the lowest likelihood of being enrolled in a private school, with 120 (100.0% in the age bracket) attending a public institution.
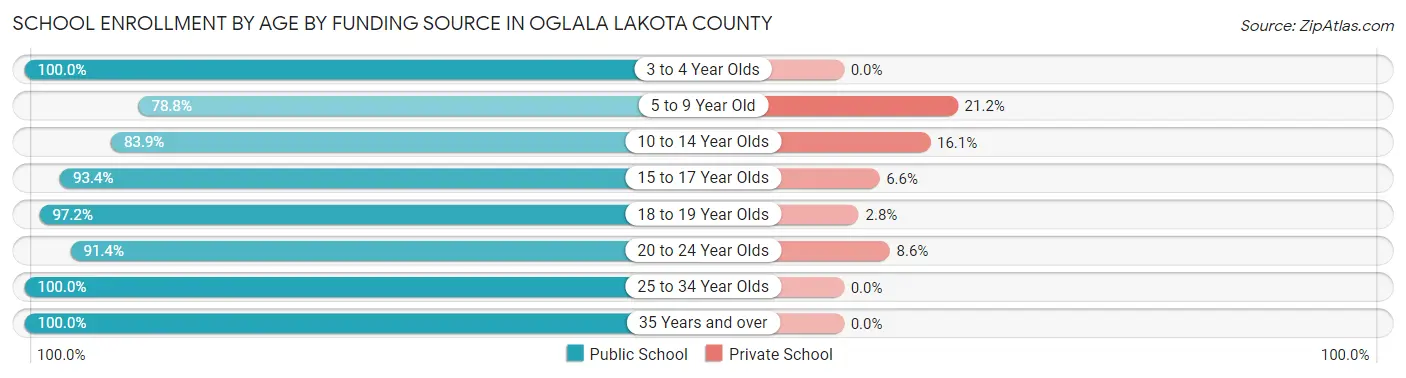
| Age Bracket | Public School | Private School |
| 3 to 4 Year Olds | 120 (100.0%) | 0 (0.0%) |
| 5 to 9 Year Old | 950 (78.8%) | 256 (21.2%) |
| 10 to 14 Year Olds | 1,309 (83.9%) | 251 (16.1%) |
| 15 to 17 Year Olds | 635 (93.4%) | 45 (6.6%) |
| 18 to 19 Year Olds | 315 (97.2%) | 9 (2.8%) |
| 20 to 24 Year Olds | 299 (91.4%) | 28 (8.6%) |
| 25 to 34 Year Olds | 149 (100.0%) | 0 (0.0%) |
| 35 Years and over | 42 (100.0%) | 0 (0.0%) |
| Total | 3,817 (86.6%) | 591 (13.4%) |
Educational Attainment by Field of Study in Oglala Lakota County
Education (267 | 46.4%), business (139 | 24.2%), arts & humanities (76 | 13.2%), science & technology (61 | 10.6%), and liberal arts & history (13 | 2.3%) are the most common fields of study among 575 individuals in Oglala Lakota County who have obtained a bachelor's degree or higher.
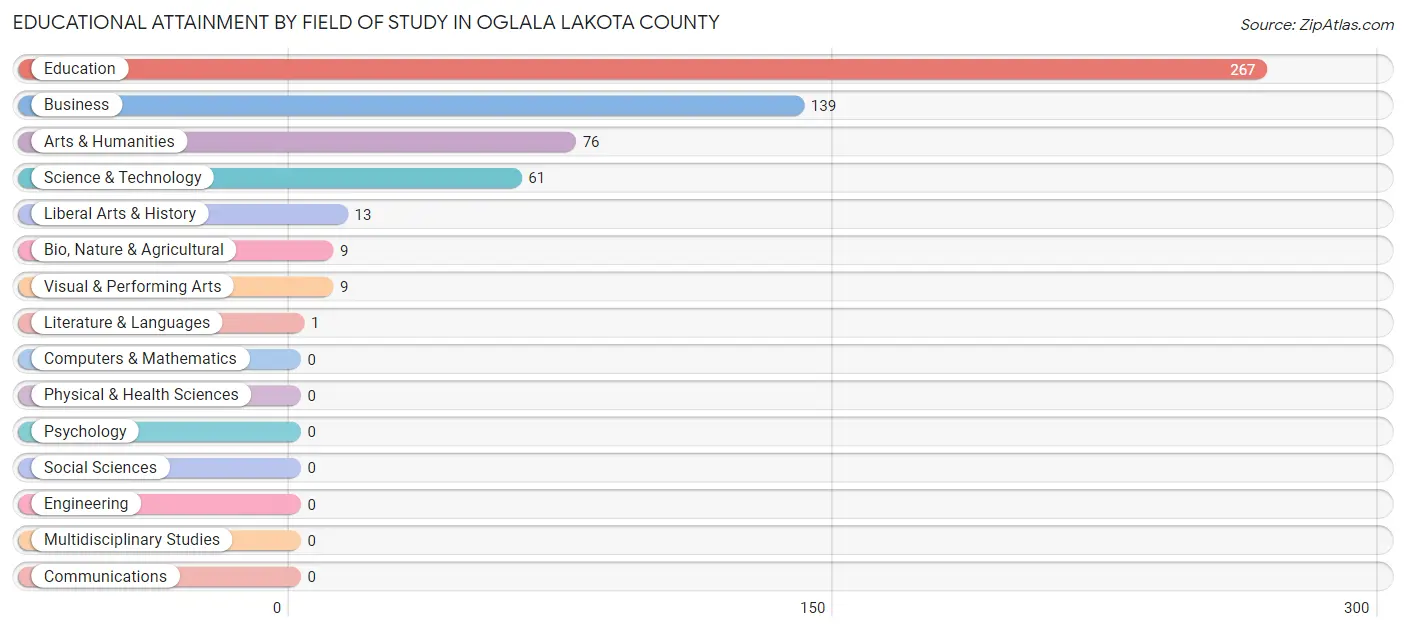
| Field of Study | # Graduates | % Graduates |
| Computers & Mathematics | 0 | 0.0% |
| Bio, Nature & Agricultural | 9 | 1.6% |
| Physical & Health Sciences | 0 | 0.0% |
| Psychology | 0 | 0.0% |
| Social Sciences | 0 | 0.0% |
| Engineering | 0 | 0.0% |
| Multidisciplinary Studies | 0 | 0.0% |
| Science & Technology | 61 | 10.6% |
| Business | 139 | 24.2% |
| Education | 267 | 46.4% |
| Literature & Languages | 1 | 0.2% |
| Liberal Arts & History | 13 | 2.3% |
| Visual & Performing Arts | 9 | 1.6% |
| Communications | 0 | 0.0% |
| Arts & Humanities | 76 | 13.2% |
| Total | 575 | 100.0% |
Transportation & Commute in Oglala Lakota County
Vehicle Availability by Sex in Oglala Lakota County
The most prevalent vehicle ownership categories in Oglala Lakota County are males with 2 vehicles (543, accounting for 39.4%) and females with 2 vehicles (624, making up 32.6%).
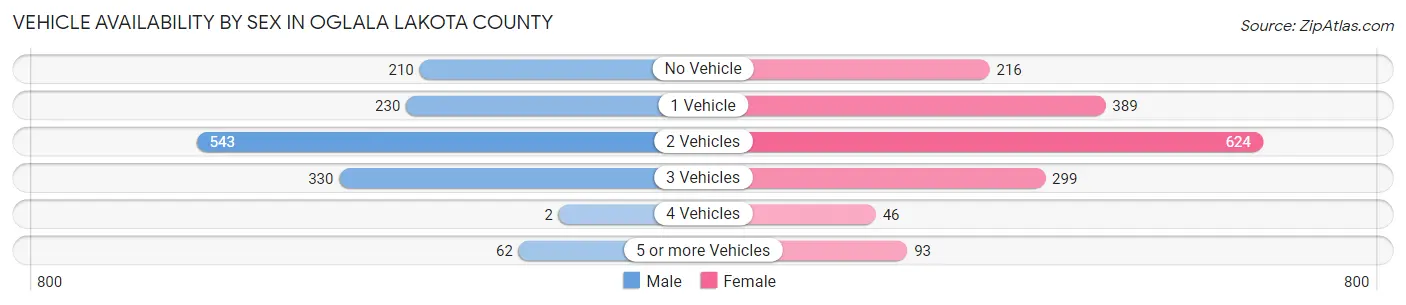
| Vehicles Available | Male | Female |
| No Vehicle | 210 (15.2%) | 216 (13.0%) |
| 1 Vehicle | 230 (16.7%) | 389 (23.3%) |
| 2 Vehicles | 543 (39.4%) | 624 (37.4%) |
| 3 Vehicles | 330 (24.0%) | 299 (17.9%) |
| 4 Vehicles | 2 (0.2%) | 46 (2.8%) |
| 5 or more Vehicles | 62 (4.5%) | 93 (5.6%) |
| Total | 1,377 (100.0%) | 1,667 (100.0%) |
Commute Time in Oglala Lakota County
The most frequently occuring commute durations in Oglala Lakota County are 5 to 9 minutes (723 commuters, 23.6%), 10 to 14 minutes (548 commuters, 17.9%), and less than 5 minutes (464 commuters, 15.1%).
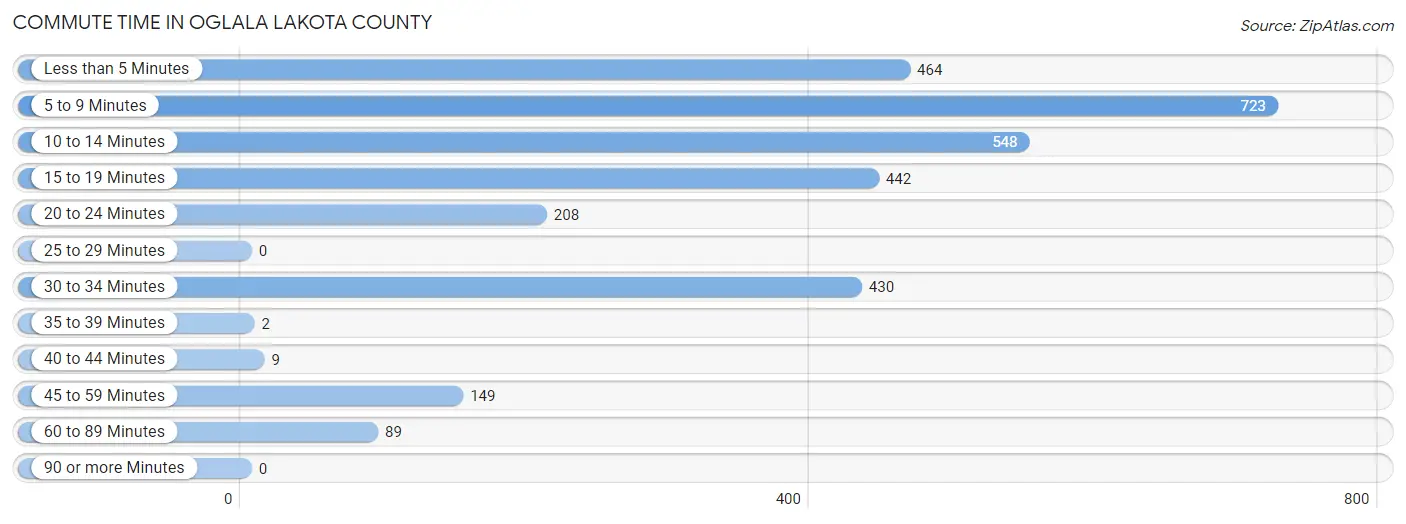
| Commute Time | # Commuters | % Commuters |
| Less than 5 Minutes | 464 | 15.1% |
| 5 to 9 Minutes | 723 | 23.6% |
| 10 to 14 Minutes | 548 | 17.9% |
| 15 to 19 Minutes | 442 | 14.4% |
| 20 to 24 Minutes | 208 | 6.8% |
| 25 to 29 Minutes | 0 | 0.0% |
| 30 to 34 Minutes | 430 | 14.0% |
| 35 to 39 Minutes | 2 | 0.1% |
| 40 to 44 Minutes | 9 | 0.3% |
| 45 to 59 Minutes | 149 | 4.9% |
| 60 to 89 Minutes | 89 | 2.9% |
| 90 or more Minutes | 0 | 0.0% |
Commute Time by Sex in Oglala Lakota County
The most common commute times in Oglala Lakota County are less than 5 minutes (297 commuters, 21.0%) for males and 5 to 9 minutes (487 commuters, 29.5%) for females.
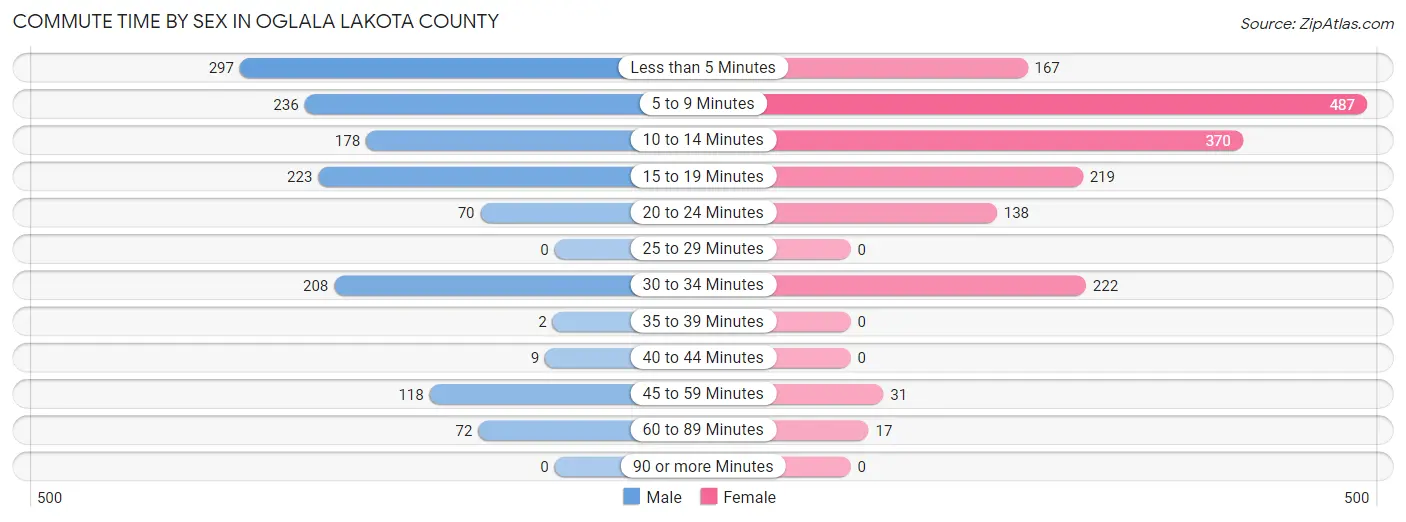
| Commute Time | Male | Female |
| Less than 5 Minutes | 297 (21.0%) | 167 (10.1%) |
| 5 to 9 Minutes | 236 (16.7%) | 487 (29.5%) |
| 10 to 14 Minutes | 178 (12.6%) | 370 (22.4%) |
| 15 to 19 Minutes | 223 (15.8%) | 219 (13.3%) |
| 20 to 24 Minutes | 70 (5.0%) | 138 (8.4%) |
| 25 to 29 Minutes | 0 (0.0%) | 0 (0.0%) |
| 30 to 34 Minutes | 208 (14.7%) | 222 (13.5%) |
| 35 to 39 Minutes | 2 (0.1%) | 0 (0.0%) |
| 40 to 44 Minutes | 9 (0.6%) | 0 (0.0%) |
| 45 to 59 Minutes | 118 (8.4%) | 31 (1.9%) |
| 60 to 89 Minutes | 72 (5.1%) | 17 (1.0%) |
| 90 or more Minutes | 0 (0.0%) | 0 (0.0%) |
Time of Departure to Work by Sex in Oglala Lakota County
The most frequent times of departure to work in Oglala Lakota County are 7:30 AM to 7:59 AM (304, 21.5%) for males and 7:30 AM to 7:59 AM (439, 26.6%) for females.
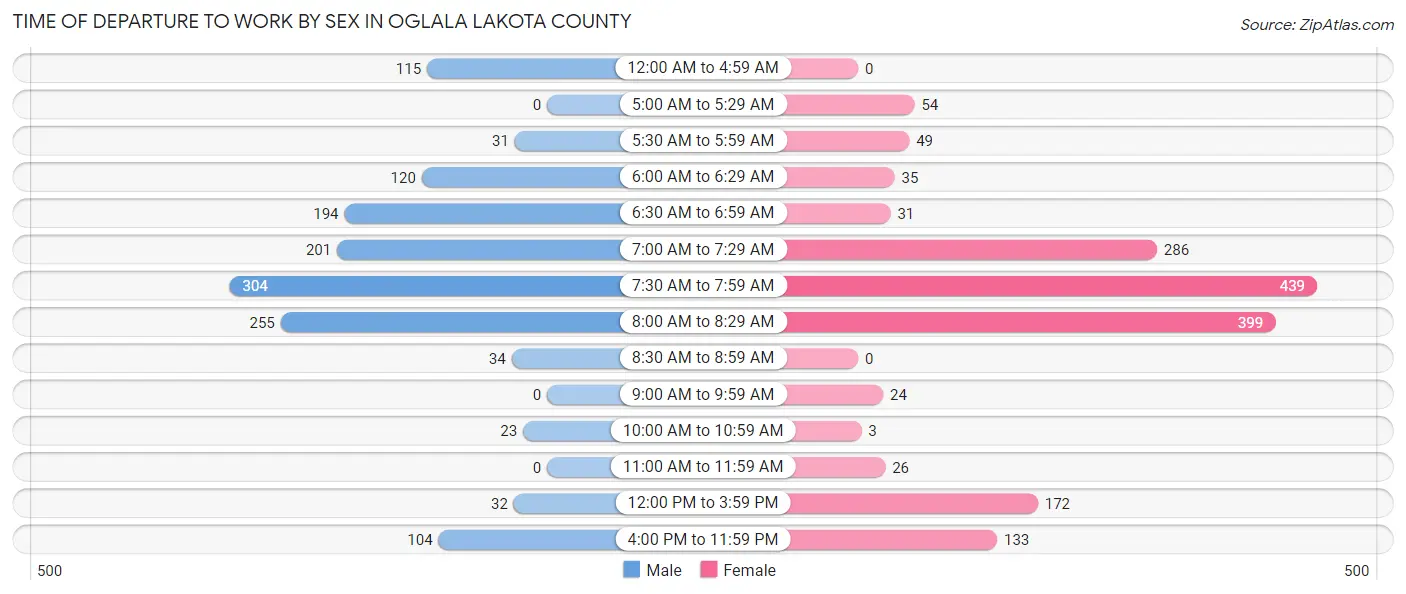
| Time of Departure | Male | Female |
| 12:00 AM to 4:59 AM | 115 (8.1%) | 0 (0.0%) |
| 5:00 AM to 5:29 AM | 0 (0.0%) | 54 (3.3%) |
| 5:30 AM to 5:59 AM | 31 (2.2%) | 49 (3.0%) |
| 6:00 AM to 6:29 AM | 120 (8.5%) | 35 (2.1%) |
| 6:30 AM to 6:59 AM | 194 (13.7%) | 31 (1.9%) |
| 7:00 AM to 7:29 AM | 201 (14.2%) | 286 (17.3%) |
| 7:30 AM to 7:59 AM | 304 (21.5%) | 439 (26.6%) |
| 8:00 AM to 8:29 AM | 255 (18.0%) | 399 (24.2%) |
| 8:30 AM to 8:59 AM | 34 (2.4%) | 0 (0.0%) |
| 9:00 AM to 9:59 AM | 0 (0.0%) | 24 (1.5%) |
| 10:00 AM to 10:59 AM | 23 (1.6%) | 3 (0.2%) |
| 11:00 AM to 11:59 AM | 0 (0.0%) | 26 (1.6%) |
| 12:00 PM to 3:59 PM | 32 (2.3%) | 172 (10.4%) |
| 4:00 PM to 11:59 PM | 104 (7.4%) | 133 (8.1%) |
| Total | 1,413 (100.0%) | 1,651 (100.0%) |
Housing Occupancy in Oglala Lakota County
Occupancy by Ownership in Oglala Lakota County
Of the total 2,684 dwellings in Oglala Lakota County, owner-occupied units account for 1,358 (50.6%), while renter-occupied units make up 1,326 (49.4%).
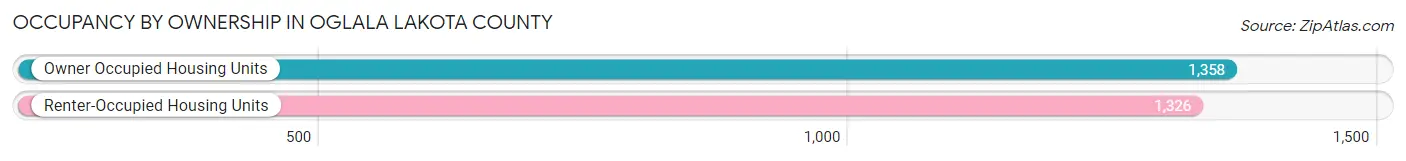
| Occupancy | # Housing Units | % Housing Units |
| Owner Occupied Housing Units | 1,358 | 50.6% |
| Renter-Occupied Housing Units | 1,326 | 49.4% |
| Total Occupied Housing Units | 2,684 | 100.0% |
Occupancy by Household Size in Oglala Lakota County
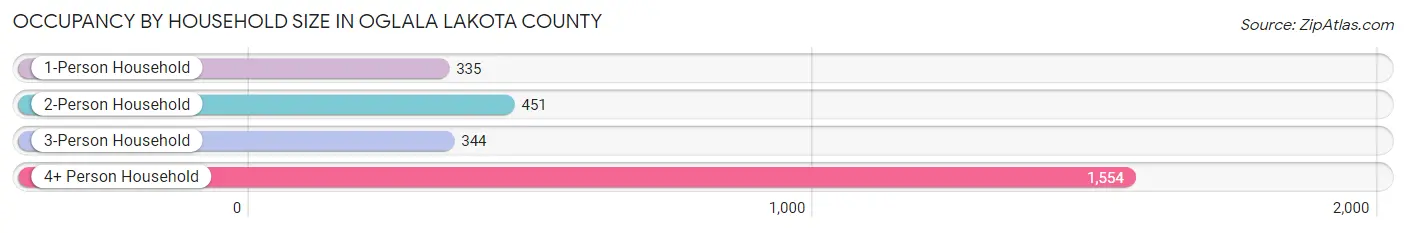
| Household Size | # Housing Units | % Housing Units |
| 1-Person Household | 335 | 12.5% |
| 2-Person Household | 451 | 16.8% |
| 3-Person Household | 344 | 12.8% |
| 4+ Person Household | 1,554 | 57.9% |
| Total Housing Units | 2,684 | 100.0% |
Occupancy by Ownership by Household Size in Oglala Lakota County
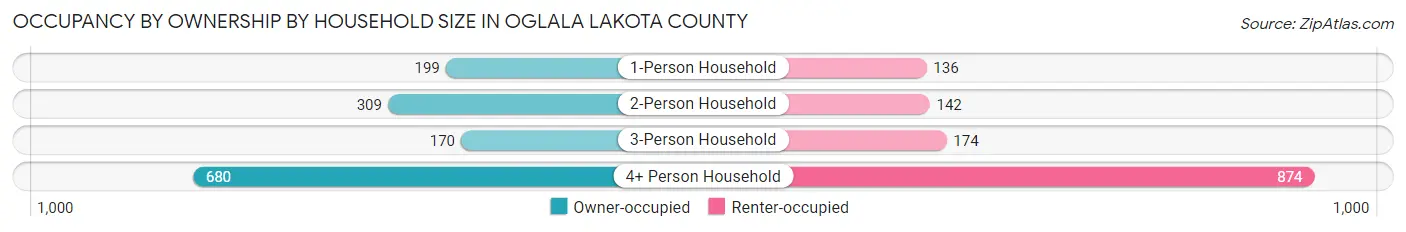
| Household Size | Owner-occupied | Renter-occupied |
| 1-Person Household | 199 (59.4%) | 136 (40.6%) |
| 2-Person Household | 309 (68.5%) | 142 (31.5%) |
| 3-Person Household | 170 (49.4%) | 174 (50.6%) |
| 4+ Person Household | 680 (43.8%) | 874 (56.2%) |
| Total Housing Units | 1,358 (50.6%) | 1,326 (49.4%) |
Occupancy by Educational Attainment in Oglala Lakota County
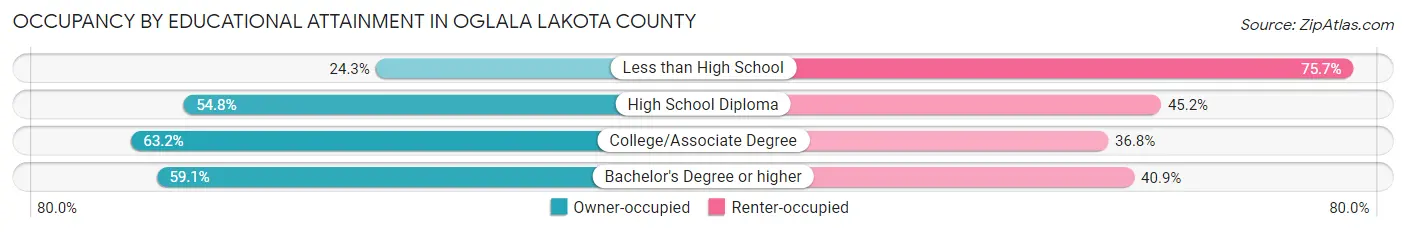
| Household Size | Owner-occupied | Renter-occupied |
| Less than High School | 173 (24.3%) | 538 (75.7%) |
| High School Diploma | 301 (54.8%) | 248 (45.2%) |
| College/Associate Degree | 653 (63.2%) | 380 (36.8%) |
| Bachelor's Degree or higher | 231 (59.1%) | 160 (40.9%) |
Occupancy by Age of Householder in Oglala Lakota County
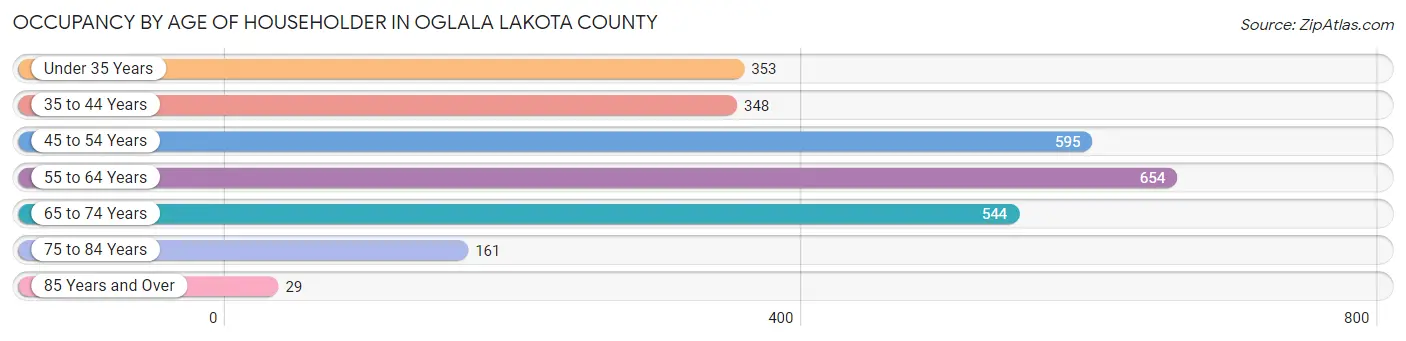
| Age Bracket | # Households | % Households |
| Under 35 Years | 353 | 13.2% |
| 35 to 44 Years | 348 | 13.0% |
| 45 to 54 Years | 595 | 22.2% |
| 55 to 64 Years | 654 | 24.4% |
| 65 to 74 Years | 544 | 20.3% |
| 75 to 84 Years | 161 | 6.0% |
| 85 Years and Over | 29 | 1.1% |
| Total | 2,684 | 100.0% |
Housing Finances in Oglala Lakota County
Median Income by Occupancy in Oglala Lakota County
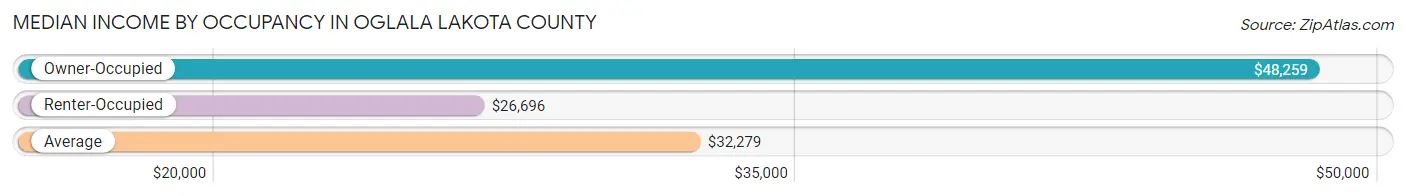
| Occupancy Type | # Households | Median Income |
| Owner-Occupied | 1,358 (50.6%) | $48,259 |
| Renter-Occupied | 1,326 (49.4%) | $26,696 |
| Average | 2,684 (100.0%) | $32,279 |
Occupancy by Householder Income Bracket in Oglala Lakota County
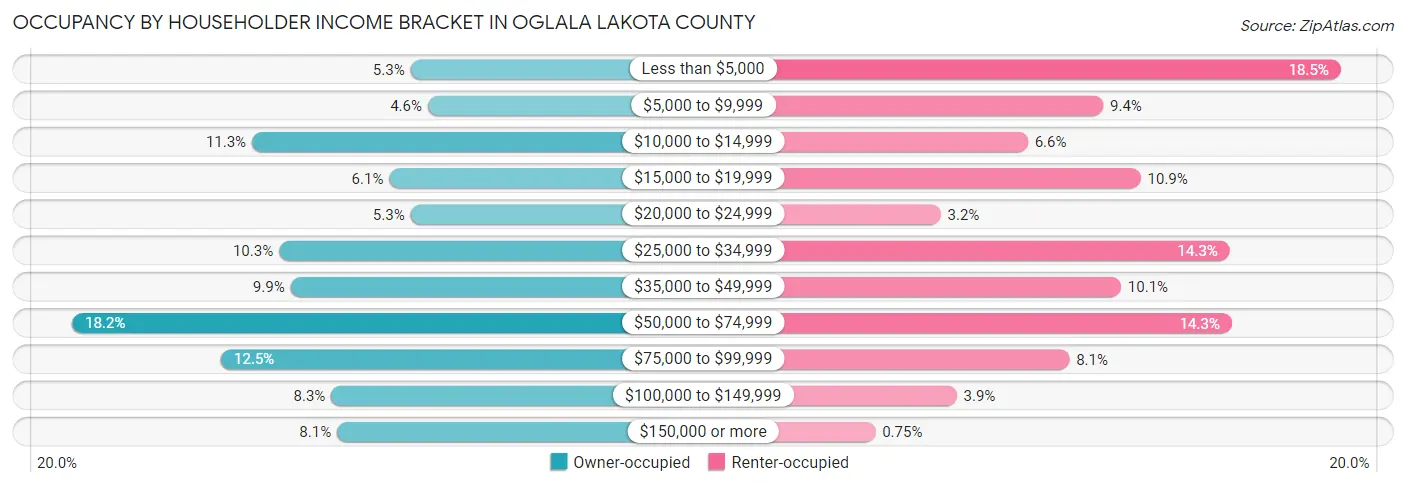
| Income Bracket | Owner-occupied | Renter-occupied |
| Less than $5,000 | 72 (5.3%) | 245 (18.5%) |
| $5,000 to $9,999 | 63 (4.6%) | 125 (9.4%) |
| $10,000 to $14,999 | 154 (11.3%) | 87 (6.6%) |
| $15,000 to $19,999 | 83 (6.1%) | 144 (10.9%) |
| $20,000 to $24,999 | 72 (5.3%) | 43 (3.2%) |
| $25,000 to $34,999 | 140 (10.3%) | 189 (14.2%) |
| $35,000 to $49,999 | 134 (9.9%) | 134 (10.1%) |
| $50,000 to $74,999 | 247 (18.2%) | 190 (14.3%) |
| $75,000 to $99,999 | 170 (12.5%) | 108 (8.1%) |
| $100,000 to $149,999 | 113 (8.3%) | 51 (3.8%) |
| $150,000 or more | 110 (8.1%) | 10 (0.7%) |
| Total | 1,358 (100.0%) | 1,326 (100.0%) |
Monthly Housing Cost Tiers in Oglala Lakota County
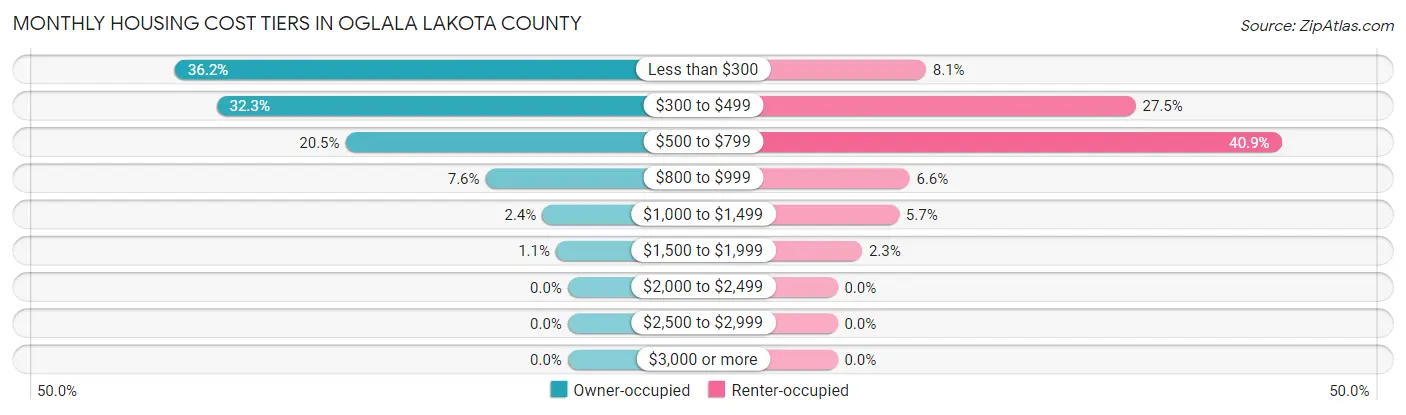
| Monthly Cost | Owner-occupied | Renter-occupied |
| Less than $300 | 491 (36.2%) | 108 (8.1%) |
| $300 to $499 | 439 (32.3%) | 364 (27.5%) |
| $500 to $799 | 278 (20.5%) | 542 (40.9%) |
| $800 to $999 | 103 (7.6%) | 88 (6.6%) |
| $1,000 to $1,499 | 32 (2.4%) | 75 (5.7%) |
| $1,500 to $1,999 | 15 (1.1%) | 30 (2.3%) |
| $2,000 to $2,499 | 0 (0.0%) | 0 (0.0%) |
| $2,500 to $2,999 | 0 (0.0%) | 0 (0.0%) |
| $3,000 or more | 0 (0.0%) | 0 (0.0%) |
| Total | 1,358 (100.0%) | 1,326 (100.0%) |
Physical Housing Characteristics in Oglala Lakota County
Housing Structures in Oglala Lakota County
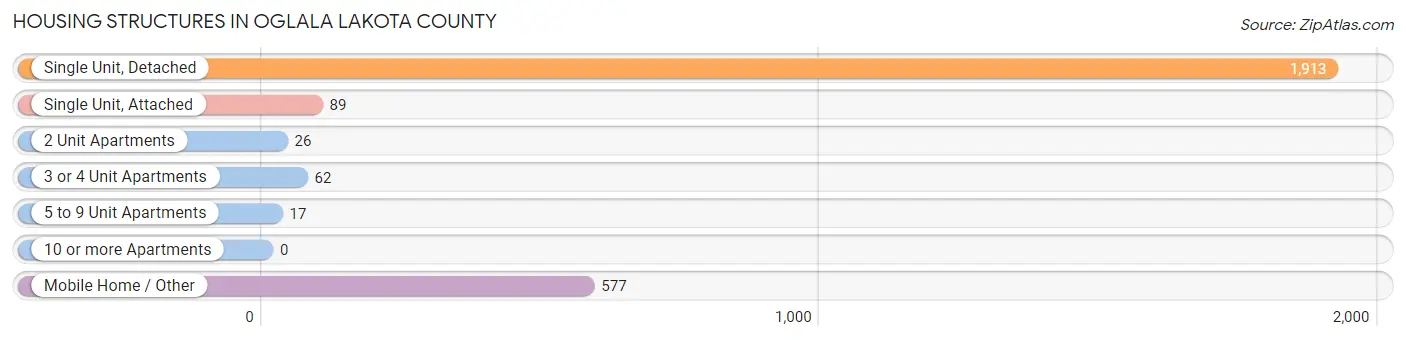
| Structure Type | # Housing Units | % Housing Units |
| Single Unit, Detached | 1,913 | 71.3% |
| Single Unit, Attached | 89 | 3.3% |
| 2 Unit Apartments | 26 | 1.0% |
| 3 or 4 Unit Apartments | 62 | 2.3% |
| 5 to 9 Unit Apartments | 17 | 0.6% |
| 10 or more Apartments | 0 | 0.0% |
| Mobile Home / Other | 577 | 21.5% |
| Total | 2,684 | 100.0% |
Housing Structures by Occupancy in Oglala Lakota County
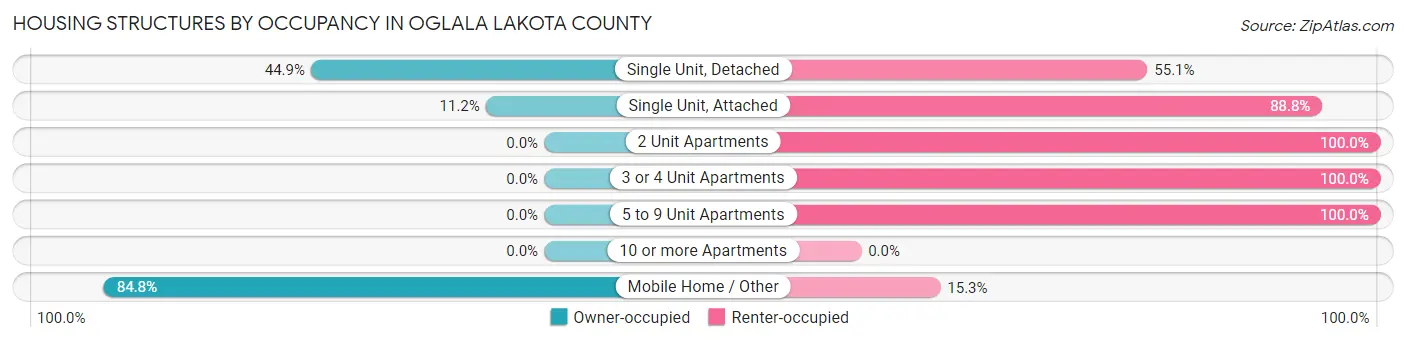
| Structure Type | Owner-occupied | Renter-occupied |
| Single Unit, Detached | 859 (44.9%) | 1,054 (55.1%) |
| Single Unit, Attached | 10 (11.2%) | 79 (88.8%) |
| 2 Unit Apartments | 0 (0.0%) | 26 (100.0%) |
| 3 or 4 Unit Apartments | 0 (0.0%) | 62 (100.0%) |
| 5 to 9 Unit Apartments | 0 (0.0%) | 17 (100.0%) |
| 10 or more Apartments | 0 (0.0%) | 0 (0.0%) |
| Mobile Home / Other | 489 (84.8%) | 88 (15.2%) |
| Total | 1,358 (50.6%) | 1,326 (49.4%) |
Housing Structures by Number of Rooms in Oglala Lakota County
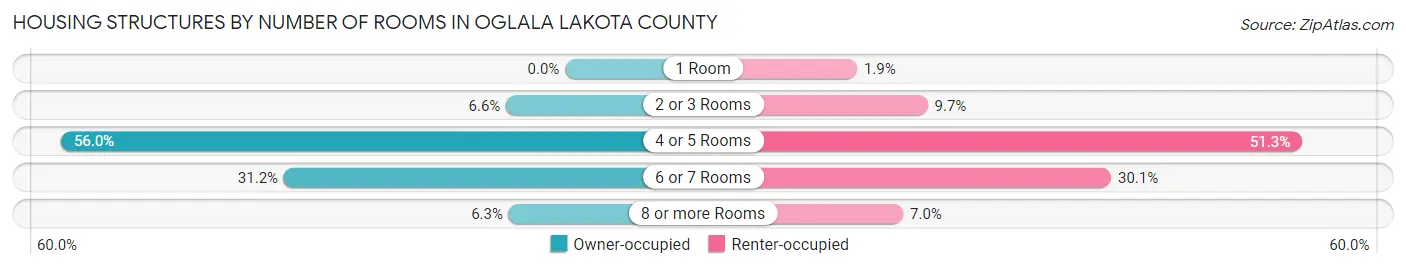
| Number of Rooms | Owner-occupied | Renter-occupied |
| 1 Room | 0 (0.0%) | 25 (1.9%) |
| 2 or 3 Rooms | 89 (6.6%) | 129 (9.7%) |
| 4 or 5 Rooms | 760 (56.0%) | 680 (51.3%) |
| 6 or 7 Rooms | 424 (31.2%) | 399 (30.1%) |
| 8 or more Rooms | 85 (6.3%) | 93 (7.0%) |
| Total | 1,358 (100.0%) | 1,326 (100.0%) |
Housing Structure by Heating Type in Oglala Lakota County
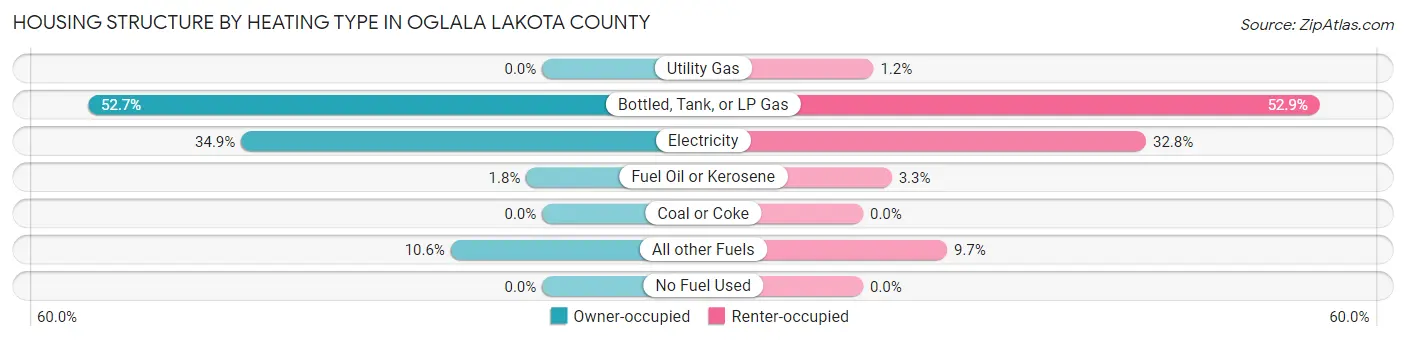
| Heating Type | Owner-occupied | Renter-occupied |
| Utility Gas | 0 (0.0%) | 16 (1.2%) |
| Bottled, Tank, or LP Gas | 715 (52.6%) | 702 (52.9%) |
| Electricity | 474 (34.9%) | 435 (32.8%) |
| Fuel Oil or Kerosene | 25 (1.8%) | 44 (3.3%) |
| Coal or Coke | 0 (0.0%) | 0 (0.0%) |
| All other Fuels | 144 (10.6%) | 129 (9.7%) |
| No Fuel Used | 0 (0.0%) | 0 (0.0%) |
| Total | 1,358 (100.0%) | 1,326 (100.0%) |
Household Vehicle Usage in Oglala Lakota County
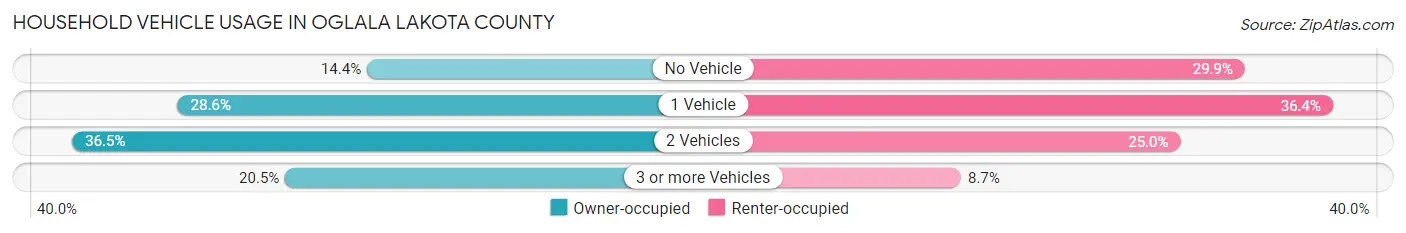
| Vehicles per Household | Owner-occupied | Renter-occupied |
| No Vehicle | 196 (14.4%) | 396 (29.9%) |
| 1 Vehicle | 388 (28.6%) | 483 (36.4%) |
| 2 Vehicles | 495 (36.4%) | 332 (25.0%) |
| 3 or more Vehicles | 279 (20.5%) | 115 (8.7%) |
| Total | 1,358 (100.0%) | 1,326 (100.0%) |
Real Estate & Mortgages in Oglala Lakota County
Real Estate and Mortgage Overview in Oglala Lakota County
| Characteristic | Without Mortgage | With Mortgage |
| Housing Units | 1,205 | 153 |
| Median Property Value | $41,500 | $68,000 |
| Median Household Income | $40,052 | $11 |
| Monthly Housing Costs | $391 | $0 |
| Real Estate Taxes | $199 | $122 |
Property Value by Mortgage Status in Oglala Lakota County
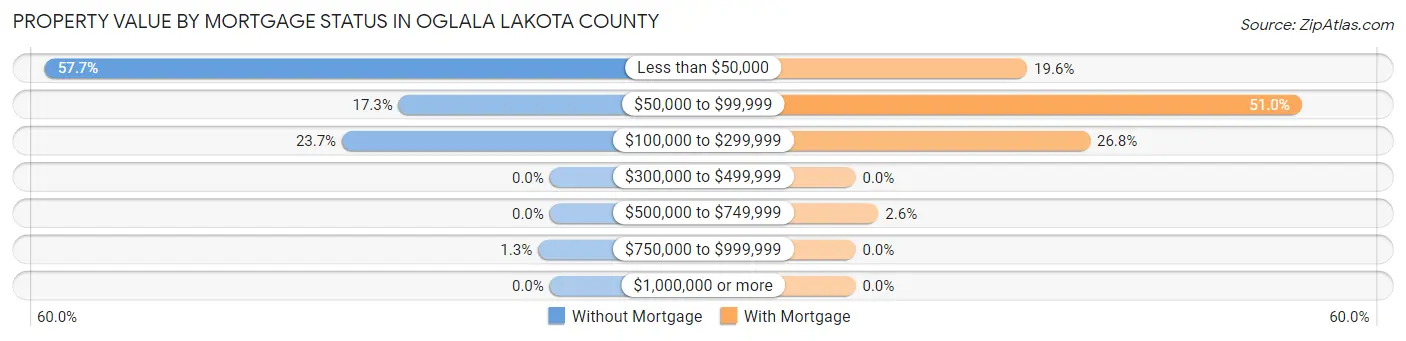
| Property Value | Without Mortgage | With Mortgage |
| Less than $50,000 | 695 (57.7%) | 30 (19.6%) |
| $50,000 to $99,999 | 208 (17.3%) | 78 (51.0%) |
| $100,000 to $299,999 | 286 (23.7%) | 41 (26.8%) |
| $300,000 to $499,999 | 0 (0.0%) | 0 (0.0%) |
| $500,000 to $749,999 | 0 (0.0%) | 4 (2.6%) |
| $750,000 to $999,999 | 16 (1.3%) | 0 (0.0%) |
| $1,000,000 or more | 0 (0.0%) | 0 (0.0%) |
| Total | 1,205 (100.0%) | 153 (100.0%) |
Household Income by Mortgage Status in Oglala Lakota County
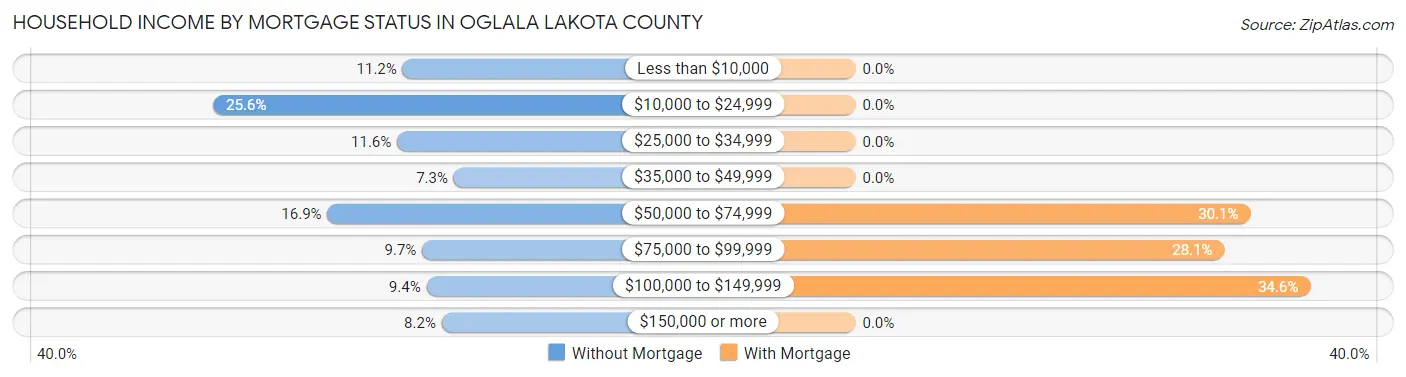
| Household Income | Without Mortgage | With Mortgage |
| Less than $10,000 | 135 (11.2%) | 0 (0.0%) |
| $10,000 to $24,999 | 309 (25.6%) | 0 (0.0%) |
| $25,000 to $34,999 | 140 (11.6%) | 0 (0.0%) |
| $35,000 to $49,999 | 88 (7.3%) | 0 (0.0%) |
| $50,000 to $74,999 | 204 (16.9%) | 46 (30.1%) |
| $75,000 to $99,999 | 117 (9.7%) | 43 (28.1%) |
| $100,000 to $149,999 | 113 (9.4%) | 53 (34.6%) |
| $150,000 or more | 99 (8.2%) | 0 (0.0%) |
| Total | 1,205 (100.0%) | 153 (100.0%) |
Property Value to Household Income Ratio in Oglala Lakota County
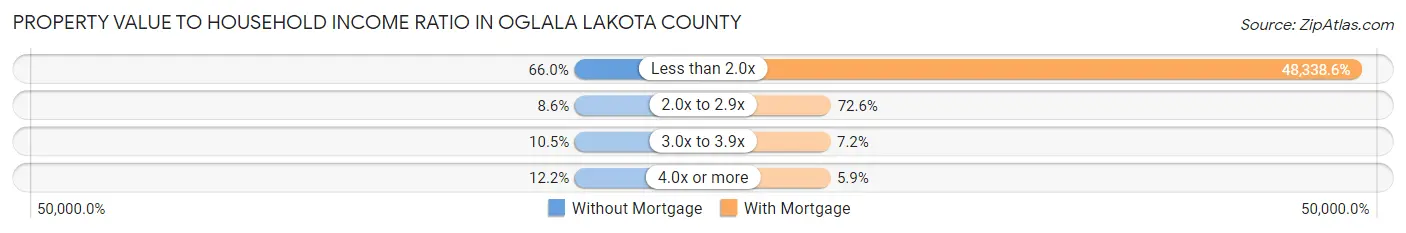
| Value-to-Income Ratio | Without Mortgage | With Mortgage |
| Less than 2.0x | 795 (66.0%) | 73,958 (48,338.6%) |
| 2.0x to 2.9x | 103 (8.6%) | 111 (72.6%) |
| 3.0x to 3.9x | 126 (10.5%) | 11 (7.2%) |
| 4.0x or more | 147 (12.2%) | 9 (5.9%) |
| Total | 1,205 (100.0%) | 153 (100.0%) |
Real Estate Taxes by Mortgage Status in Oglala Lakota County
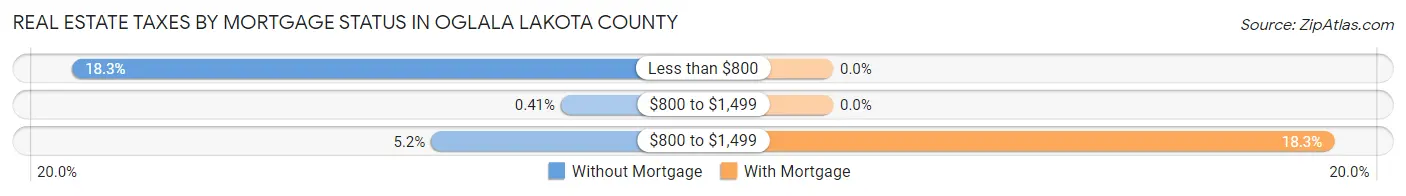
| Property Taxes | Without Mortgage | With Mortgage |
| Less than $800 | 220 (18.3%) | 0 (0.0%) |
| $800 to $1,499 | 5 (0.4%) | 0 (0.0%) |
| $800 to $1,499 | 62 (5.1%) | 28 (18.3%) |
| Total | 1,205 (100.0%) | 153 (100.0%) |
Health & Disability in Oglala Lakota County
Health Insurance Coverage by Age in Oglala Lakota County
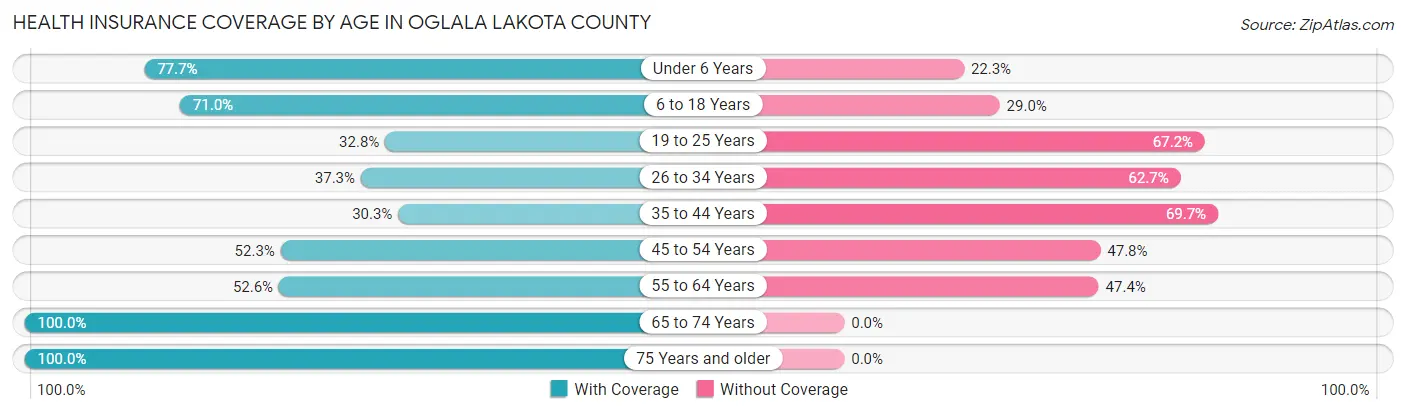
| Age Bracket | With Coverage | Without Coverage |
| Under 6 Years | 1,163 (77.7%) | 334 (22.3%) |
| 6 to 18 Years | 2,650 (71.0%) | 1,081 (29.0%) |
| 19 to 25 Years | 499 (32.8%) | 1,024 (67.2%) |
| 26 to 34 Years | 679 (37.3%) | 1,142 (62.7%) |
| 35 to 44 Years | 445 (30.3%) | 1,022 (69.7%) |
| 45 to 54 Years | 733 (52.2%) | 670 (47.7%) |
| 55 to 64 Years | 604 (52.6%) | 545 (47.4%) |
| 65 to 74 Years | 692 (100.0%) | 0 (0.0%) |
| 75 Years and older | 314 (100.0%) | 0 (0.0%) |
| Total | 7,779 (57.2%) | 5,818 (42.8%) |
Health Insurance Coverage by Citizenship Status in Oglala Lakota County
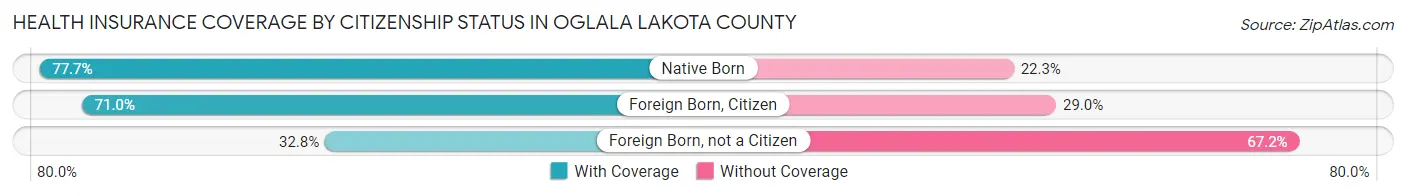
| Citizenship Status | With Coverage | Without Coverage |
| Native Born | 1,163 (77.7%) | 334 (22.3%) |
| Foreign Born, Citizen | 2,650 (71.0%) | 1,081 (29.0%) |
| Foreign Born, not a Citizen | 499 (32.8%) | 1,024 (67.2%) |
Health Insurance Coverage by Household Income in Oglala Lakota County
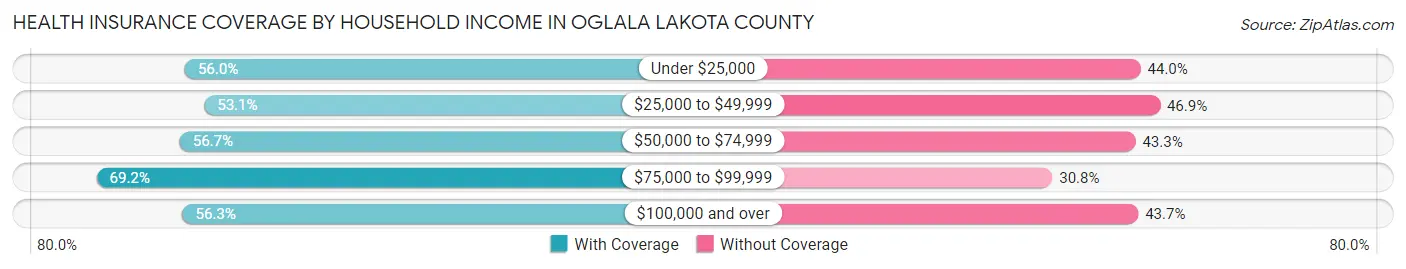
| Household Income | With Coverage | Without Coverage |
| Under $25,000 | 2,408 (56.0%) | 1,895 (44.0%) |
| $25,000 to $49,999 | 1,838 (53.1%) | 1,626 (46.9%) |
| $50,000 to $74,999 | 1,163 (56.7%) | 887 (43.3%) |
| $75,000 to $99,999 | 1,112 (69.2%) | 495 (30.8%) |
| $100,000 and over | 1,114 (56.3%) | 864 (43.7%) |
Public vs Private Health Insurance Coverage by Age in Oglala Lakota County
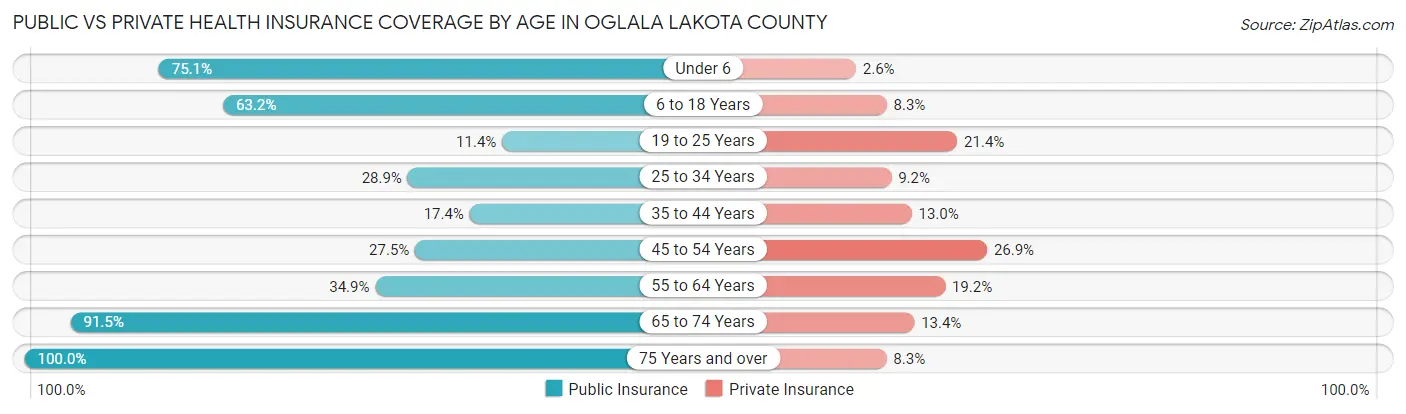
| Age Bracket | Public Insurance | Private Insurance |
| Under 6 | 1,124 (75.1%) | 39 (2.6%) |
| 6 to 18 Years | 2,357 (63.2%) | 310 (8.3%) |
| 19 to 25 Years | 173 (11.4%) | 326 (21.4%) |
| 25 to 34 Years | 526 (28.9%) | 167 (9.2%) |
| 35 to 44 Years | 255 (17.4%) | 190 (13.0%) |
| 45 to 54 Years | 386 (27.5%) | 378 (26.9%) |
| 55 to 64 Years | 401 (34.9%) | 220 (19.2%) |
| 65 to 74 Years | 633 (91.5%) | 93 (13.4%) |
| 75 Years and over | 314 (100.0%) | 26 (8.3%) |
| Total | 6,169 (45.4%) | 1,749 (12.9%) |
Disability Status by Sex by Age in Oglala Lakota County
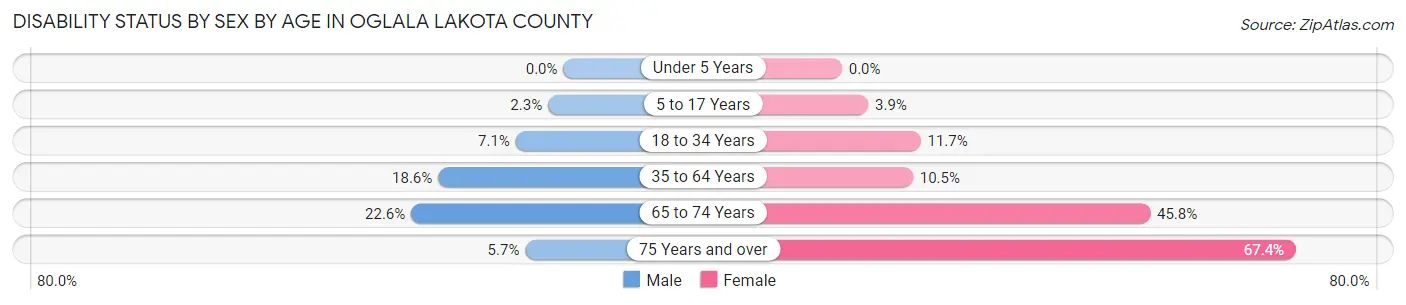
| Age Bracket | Male | Female |
| Under 5 Years | 0 (0.0%) | 0 (0.0%) |
| 5 to 17 Years | 46 (2.3%) | 70 (3.9%) |
| 18 to 34 Years | 126 (7.1%) | 204 (11.7%) |
| 35 to 64 Years | 361 (18.6%) | 219 (10.5%) |
| 65 to 74 Years | 71 (22.6%) | 173 (45.8%) |
| 75 Years and over | 3 (5.7%) | 176 (67.4%) |
Disability Class by Sex by Age in Oglala Lakota County
Disability Class: Hearing Difficulty
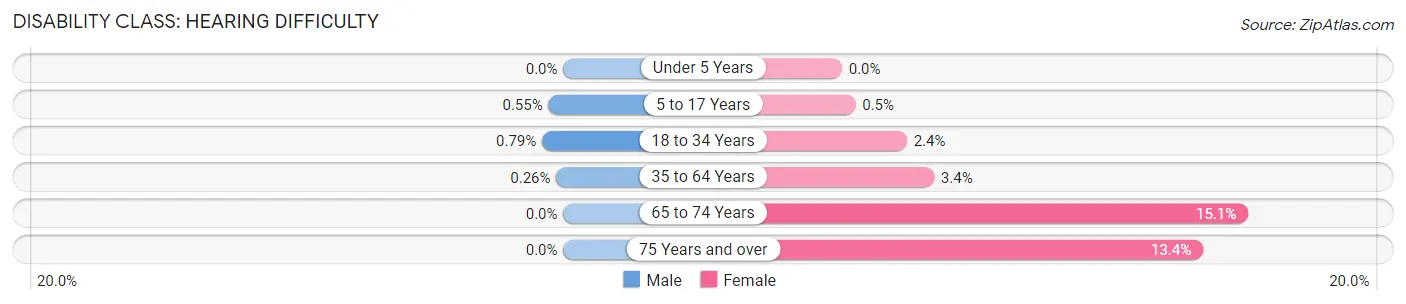
| Age Bracket | Male | Female |
| Under 5 Years | 0 (0.0%) | 0 (0.0%) |
| 5 to 17 Years | 11 (0.5%) | 9 (0.5%) |
| 18 to 34 Years | 14 (0.8%) | 42 (2.4%) |
| 35 to 64 Years | 5 (0.3%) | 71 (3.4%) |
| 65 to 74 Years | 0 (0.0%) | 57 (15.1%) |
| 75 Years and over | 0 (0.0%) | 35 (13.4%) |
Disability Class: Vision Difficulty
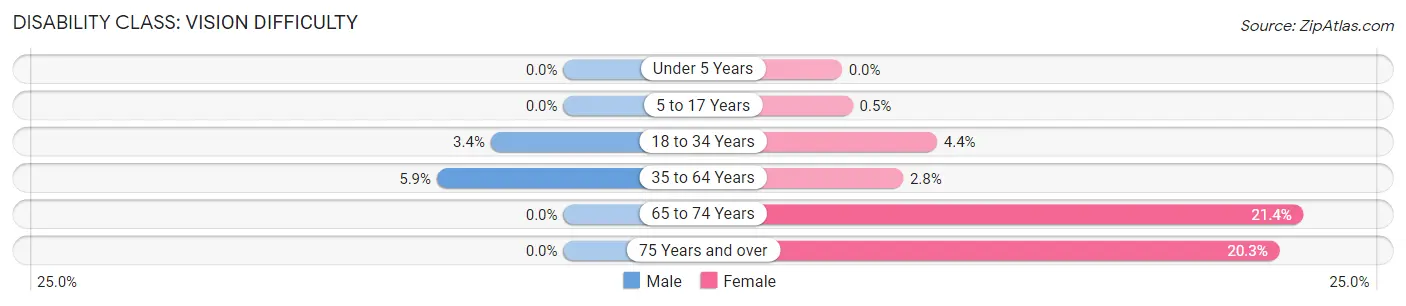
| Age Bracket | Male | Female |
| Under 5 Years | 0 (0.0%) | 0 (0.0%) |
| 5 to 17 Years | 0 (0.0%) | 9 (0.5%) |
| 18 to 34 Years | 60 (3.4%) | 77 (4.4%) |
| 35 to 64 Years | 114 (5.9%) | 59 (2.8%) |
| 65 to 74 Years | 0 (0.0%) | 81 (21.4%) |
| 75 Years and over | 0 (0.0%) | 53 (20.3%) |
Disability Class: Cognitive Difficulty
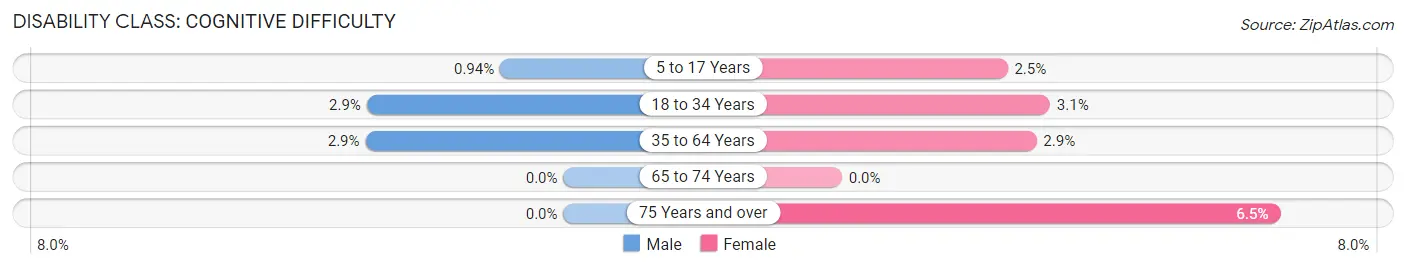
| Age Bracket | Male | Female |
| 5 to 17 Years | 19 (0.9%) | 44 (2.5%) |
| 18 to 34 Years | 52 (2.9%) | 54 (3.1%) |
| 35 to 64 Years | 57 (2.9%) | 60 (2.9%) |
| 65 to 74 Years | 0 (0.0%) | 0 (0.0%) |
| 75 Years and over | 0 (0.0%) | 17 (6.5%) |
Disability Class: Ambulatory Difficulty
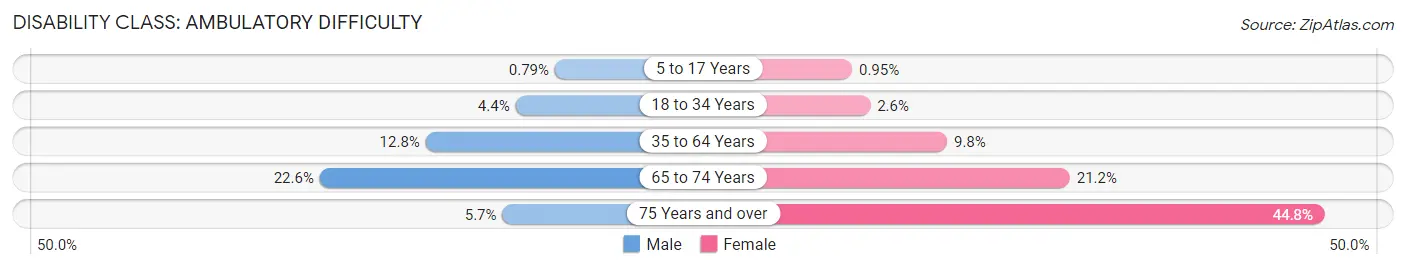
| Age Bracket | Male | Female |
| 5 to 17 Years | 16 (0.8%) | 17 (0.9%) |
| 18 to 34 Years | 79 (4.4%) | 46 (2.6%) |
| 35 to 64 Years | 248 (12.8%) | 203 (9.8%) |
| 65 to 74 Years | 71 (22.6%) | 80 (21.2%) |
| 75 Years and over | 3 (5.7%) | 117 (44.8%) |
Disability Class: Self-Care Difficulty
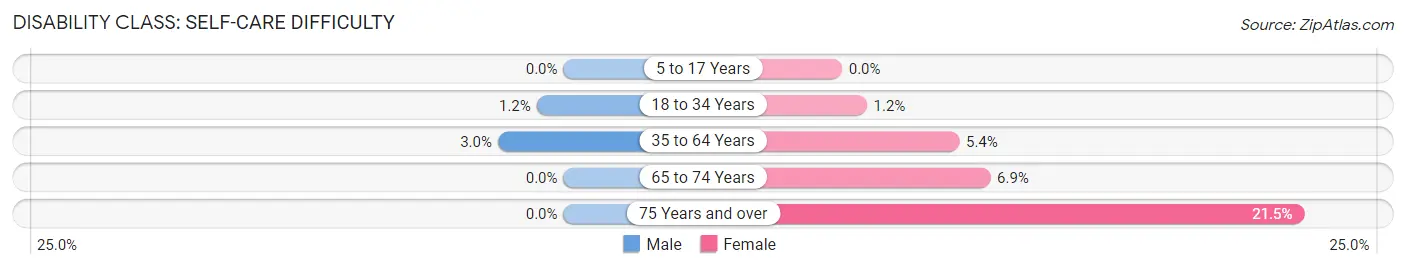
| Age Bracket | Male | Female |
| 5 to 17 Years | 0 (0.0%) | 0 (0.0%) |
| 18 to 34 Years | 22 (1.2%) | 20 (1.1%) |
| 35 to 64 Years | 59 (3.0%) | 113 (5.4%) |
| 65 to 74 Years | 0 (0.0%) | 26 (6.9%) |
| 75 Years and over | 0 (0.0%) | 56 (21.5%) |
Technology Access in Oglala Lakota County
Computing Device Access in Oglala Lakota County
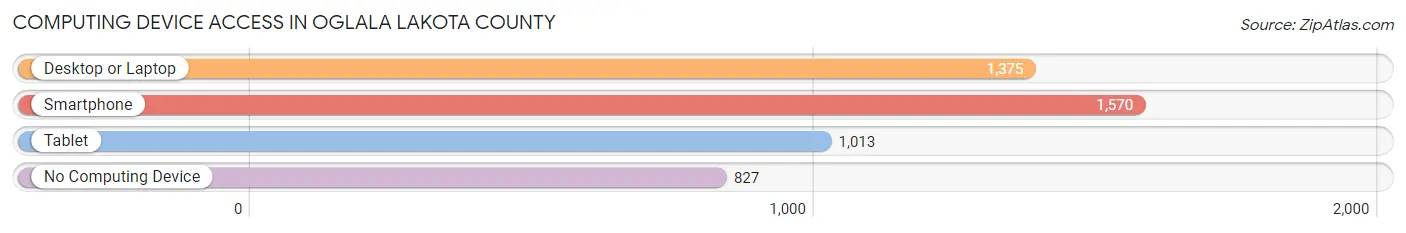
| Device Type | # Households | % Households |
| Desktop or Laptop | 1,375 | 51.2% |
| Smartphone | 1,570 | 58.5% |
| Tablet | 1,013 | 37.7% |
| No Computing Device | 827 | 30.8% |
| Total | 2,684 | 100.0% |
Internet Access in Oglala Lakota County
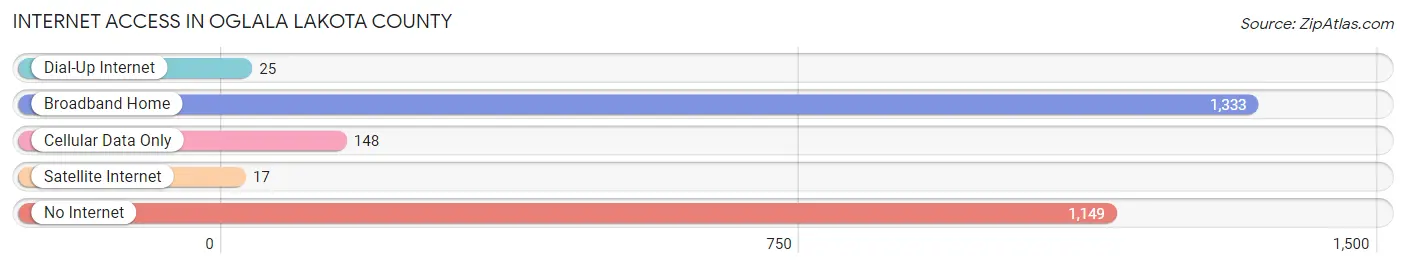
| Internet Type | # Households | % Households |
| Dial-Up Internet | 25 | 0.9% |
| Broadband Home | 1,333 | 49.7% |
| Cellular Data Only | 148 | 5.5% |
| Satellite Internet | 17 | 0.6% |
| No Internet | 1,149 | 42.8% |
| Total | 2,684 | 100.0% |
Oglala Lakota County Summary
Oglala Lakota County, South Dakota is located in the southwestern corner of the state and is the largest county in South Dakota. It is bordered by the states of Nebraska and Wyoming, and is part of the Pine Ridge Indian Reservation. The county is home to the Oglala Sioux Tribe, the second largest tribe in the United States. The county seat is Pine Ridge, and the population was estimated to be 15,521 in 2019.
History
Oglala Lakota County was established in 1877 as part of the Great Sioux Reservation. The reservation was created by the United States government in an effort to protect the Sioux people from further encroachment by white settlers. The reservation was originally much larger than it is today, encompassing all of South Dakota west of the Missouri River. Over time, the reservation was reduced in size as the US government sold off land to white settlers.
The Oglala Sioux Tribe is the second largest tribe in the United States, and is composed of seven bands: the Oglala, Brule, Miniconjou, Hunkpapa, Blackfeet, Two Kettle, and Sans Arc. The Oglala Sioux Tribe is a sovereign nation, and the Oglala Lakota County is part of the Pine Ridge Indian Reservation.
Geography
Oglala Lakota County is located in the southwestern corner of South Dakota, and is bordered by the states of Nebraska and Wyoming. The county covers an area of 2,907 square miles, making it the largest county in South Dakota. The county is mostly rural, with the majority of the population living in the county seat of Pine Ridge. The county is home to the Badlands National Park, which is located in the northern part of the county.
The county is located in the Great Plains region of the United States, and is characterized by rolling hills and prairies. The county is home to several rivers, including the White River, Cheyenne River, and Bad River. The county is also home to several lakes, including the Oahe Reservoir, which is the largest lake in South Dakota.
Economy
The economy of Oglala Lakota County is largely based on agriculture and tourism. The county is home to several large ranches, and the county is a major producer of beef, pork, and dairy products. The county is also home to several tourist attractions, including the Badlands National Park, which attracts thousands of visitors each year.
The county is also home to several casinos, which are owned and operated by the Oglala Sioux Tribe. The casinos generate significant revenue for the county, and provide employment opportunities for many of the county’s residents.
Demographics
As of 2019, the population of Oglala Lakota County was estimated to be 15,521. The population is largely Native American, with the Oglala Sioux Tribe making up the majority of the population. The median household income in the county is $30,945, and the poverty rate is 40.3%. The county has a high unemployment rate, with an estimated 17.2% of the population being unemployed.
Conclusion
Oglala Lakota County is located in the southwestern corner of South Dakota and is the largest county in the state. The county is home to the Oglala Sioux Tribe, and is part of the Pine Ridge Indian Reservation. The county is largely rural, and the economy is based on agriculture and tourism. The population of the county is largely Native American, and the median household income is $30,945. The county has a high unemployment rate, and the poverty rate is 40.3%.
Common Questions
What is the Total Population of Oglala Lakota County?
Total Population of Oglala Lakota County is 13,695.
What is the Total Male Population of Oglala Lakota County?
Total Male Population of Oglala Lakota County is 6,886.
What is the Total Female Population of Oglala Lakota County?
Total Female Population of Oglala Lakota County is 6,809.
What is the Ratio of Males per 100 Females in Oglala Lakota County?
There are 101.13 Males per 100 Females in Oglala Lakota County.
What is the Ratio of Females per 100 Males in Oglala Lakota County?
There are 98.88 Females per 100 Males in Oglala Lakota County.
What is the Median Population Age in Oglala Lakota County?
Median Population Age in Oglala Lakota County is 26.3 Years.
What is the Average Family Size in Oglala Lakota County
Average Family Size in Oglala Lakota County is 5.5 People.
What is the Average Household Size in Oglala Lakota County
Average Household Size in Oglala Lakota County is 5.0 People.
What is Per Capita Income in Oglala Lakota County?
Per Capita income in Oglala Lakota County is $10,955.
What is the Median Family Income in Oglala Lakota County?
Median Family Income in Oglala Lakota County is $33,578.
What is the Median Household income in Oglala Lakota County?
Median Household Income in Oglala Lakota County is $32,279.
What is Income or Wage Gap in Oglala Lakota County?
Income or Wage Gap in Oglala Lakota County is 14.2%.
Women in Oglala Lakota County earn 85.8 cents for every dollar earned by a man.
What is Family Income Deficit in Oglala Lakota County?
Family Income Deficit in Oglala Lakota County is $18,264.
Families that are below poverty line in Oglala Lakota County earn $18,264 less on average than the poverty threshold level.
What is Inequality or Gini Index in Oglala Lakota County?
Inequality or Gini Index in Oglala Lakota County is 0.51.
How Large is the Labor Force in Oglala Lakota County?
There are 3,588 People in the Labor Forcein in Oglala Lakota County.
What is the Percentage of People in the Labor Force in Oglala Lakota County?
39.0% of People are in the Labor Force in Oglala Lakota County.
What is the Unemployment Rate in Oglala Lakota County?
Unemployment Rate in Oglala Lakota County is 11.8%.