Minnehaha County, SD
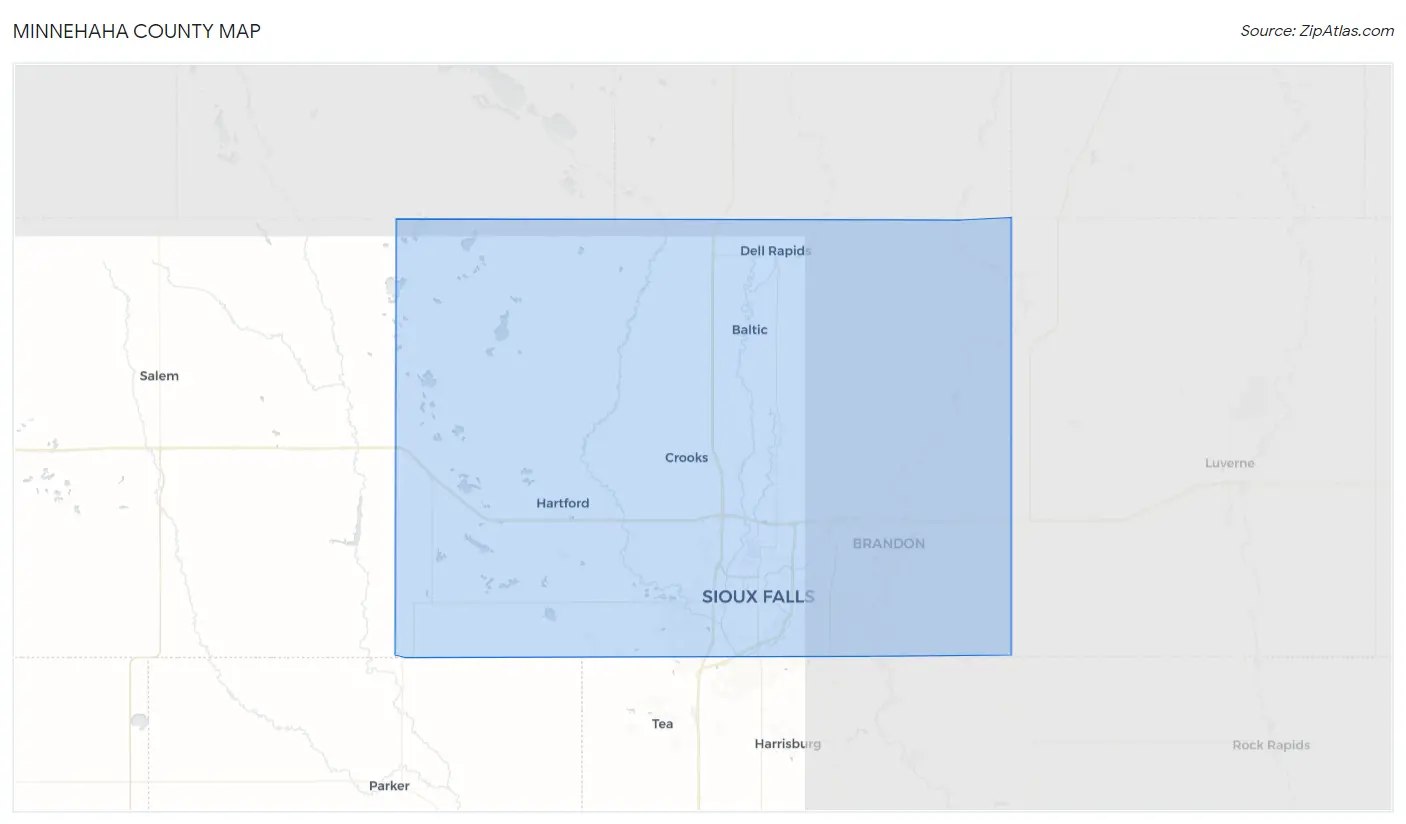
Minnehaha County Map
Minnehaha County Overview
197,742
TOTAL POPULATION
100,828
MALE POPULATION
96,914
FEMALE POPULATION
104.04
MALES / 100 FEMALES
96.12
FEMALES / 100 MALES
35.6
MEDIAN AGE
3.1
AVG FAMILY SIZE
2.4
AVG HOUSEHOLD SIZE
$39,289
PER CAPITA INCOME
$95,190
AVG FAMILY INCOME
$73,110
AVG HOUSEHOLD INCOME
23.4%
WAGE / INCOME GAP [ % ]
76.6¢/ $1
WAGE / INCOME GAP [ $ ]
$9,570
FAMILY INCOME DEFICIT
0.43
INEQUALITY / GINI INDEX
113,665
LABOR FORCE [ PEOPLE ]
74.3%
PERCENT IN LABOR FORCE
2.4%
UNEMPLOYMENT RATE
Minnehaha County Area Codes
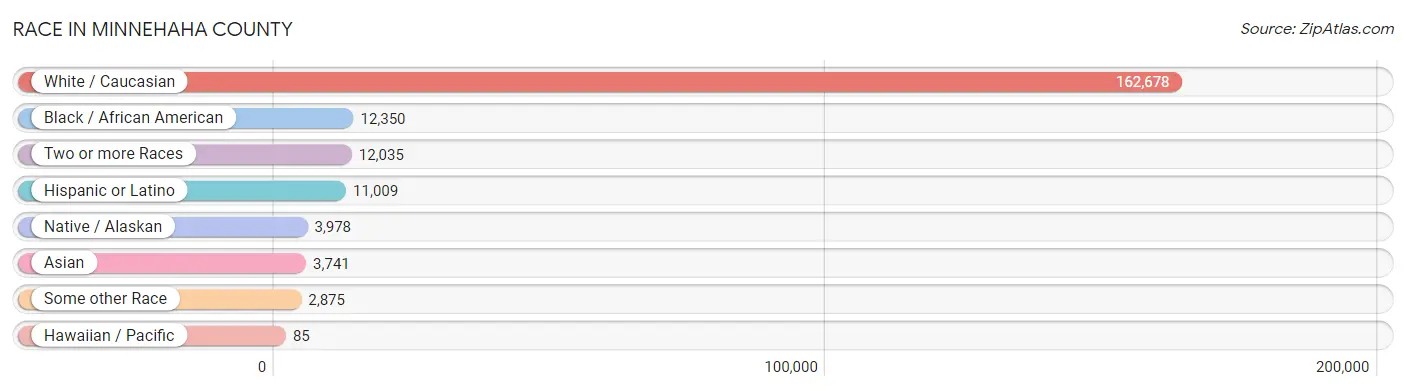
Race in Minnehaha County
The most populous races in Minnehaha County are White / Caucasian (162,678 | 82.3%), Black / African American (12,350 | 6.2%), and Two or more Races (12,035 | 6.1%).
| Race | # Population | % Population |
| Asian | 3,741 | 1.9% |
| Black / African American | 12,350 | 6.2% |
| Hawaiian / Pacific | 85 | 0.0% |
| Hispanic or Latino | 11,009 | 5.6% |
| Native / Alaskan | 3,978 | 2.0% |
| White / Caucasian | 162,678 | 82.3% |
| Two or more Races | 12,035 | 6.1% |
| Some other Race | 2,875 | 1.5% |
| Total | 197,742 | 100.0% |
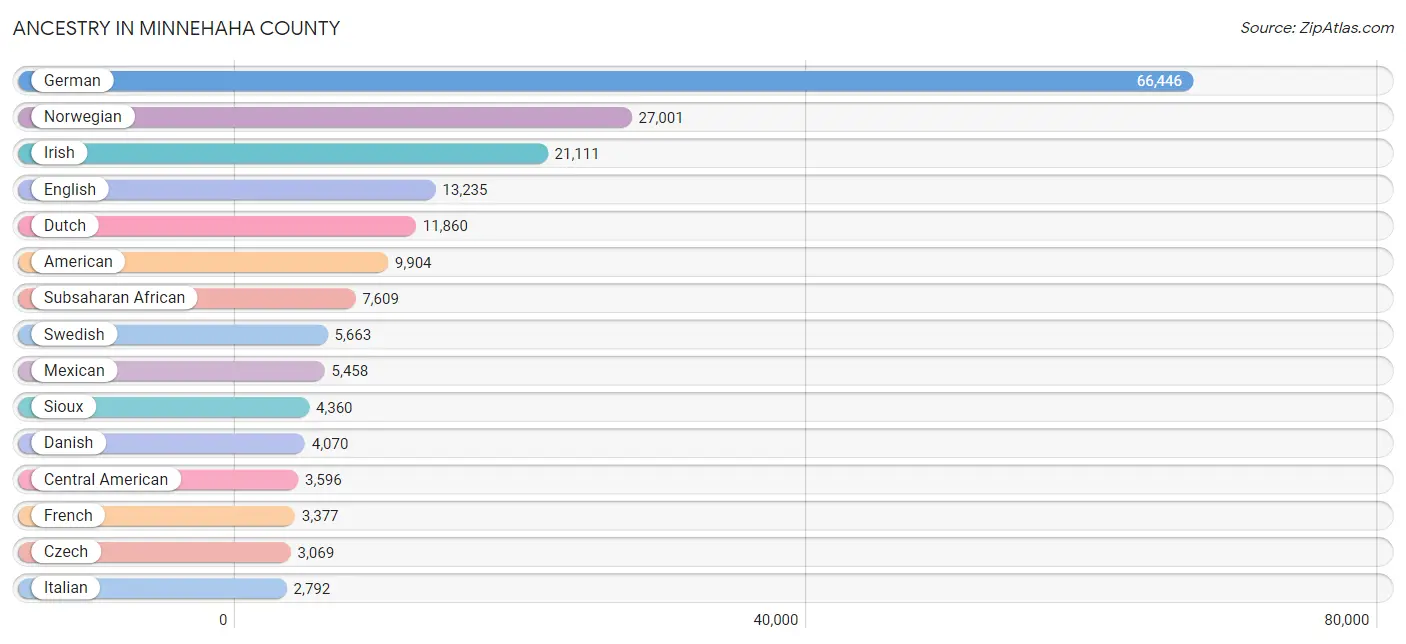
Ancestry in Minnehaha County
The most populous ancestries reported in Minnehaha County are German (66,446 | 33.6%), Norwegian (27,001 | 13.7%), Irish (21,111 | 10.7%), English (13,235 | 6.7%), and Dutch (11,860 | 6.0%), together accounting for 70.6% of all Minnehaha County residents.
| Ancestry | # Population | % Population |
| Afghan | 166 | 0.1% |
| African | 2,373 | 1.2% |
| Alaska Native | 9 | 0.0% |
| Albanian | 126 | 0.1% |
| American | 9,904 | 5.0% |
| Apache | 31 | 0.0% |
| Arab | 780 | 0.4% |
| Armenian | 56 | 0.0% |
| Australian | 22 | 0.0% |
| Austrian | 346 | 0.2% |
| Basque | 13 | 0.0% |
| Belgian | 468 | 0.2% |
| Bermudan | 51 | 0.0% |
| Bhutanese | 327 | 0.2% |
| Blackfeet | 100 | 0.1% |
| Bolivian | 50 | 0.0% |
| British | 615 | 0.3% |
| Bulgarian | 8 | 0.0% |
| Burmese | 765 | 0.4% |
| Canadian | 149 | 0.1% |
| Carpatho Rusyn | 3 | 0.0% |
| Celtic | 52 | 0.0% |
| Central American | 3,596 | 1.8% |
| Central American Indian | 32 | 0.0% |
| Cherokee | 171 | 0.1% |
| Cheyenne | 31 | 0.0% |
| Chilean | 86 | 0.0% |
| Chippewa | 51 | 0.0% |
| Choctaw | 53 | 0.0% |
| Colombian | 105 | 0.1% |
| Costa Rican | 5 | 0.0% |
| Creek | 28 | 0.0% |
| Croatian | 148 | 0.1% |
| Cuban | 90 | 0.1% |
| Cypriot | 6 | 0.0% |
| Czech | 3,069 | 1.5% |
| Czechoslovakian | 101 | 0.1% |
| Danish | 4,070 | 2.1% |
| Dominican | 135 | 0.1% |
| Dutch | 11,860 | 6.0% |
| Eastern European | 86 | 0.0% |
| Ecuadorian | 7 | 0.0% |
| Egyptian | 53 | 0.0% |
| English | 13,235 | 6.7% |
| Ethiopian | 2,761 | 1.4% |
| European | 2,666 | 1.3% |
| Finnish | 577 | 0.3% |
| French | 3,377 | 1.7% |
| French American Indian | 40 | 0.0% |
| French Canadian | 387 | 0.2% |
| German | 66,446 | 33.6% |
| German Russian | 15 | 0.0% |
| Greek | 350 | 0.2% |
| Guamanian / Chamorro | 69 | 0.0% |
| Guatemalan | 1,779 | 0.9% |
| Haitian | 30 | 0.0% |
| Honduran | 148 | 0.1% |
| Hungarian | 152 | 0.1% |
| Icelander | 24 | 0.0% |
| Indian (Asian) | 440 | 0.2% |
| Indonesian | 25 | 0.0% |
| Inupiat | 44 | 0.0% |
| Iranian | 15 | 0.0% |
| Iraqi | 86 | 0.0% |
| Irish | 21,111 | 10.7% |
| Iroquois | 54 | 0.0% |
| Italian | 2,792 | 1.4% |
| Jamaican | 39 | 0.0% |
| Japanese | 138 | 0.1% |
| Jordanian | 13 | 0.0% |
| Kenyan | 18 | 0.0% |
| Korean | 598 | 0.3% |
| Laotian | 55 | 0.0% |
| Latvian | 65 | 0.0% |
| Lebanese | 189 | 0.1% |
| Liberian | 978 | 0.5% |
| Lithuanian | 72 | 0.0% |
| Luxembourger | 225 | 0.1% |
| Malaysian | 307 | 0.2% |
| Maltese | 14 | 0.0% |
| Mexican | 5,458 | 2.8% |
| Mexican American Indian | 19 | 0.0% |
| Moroccan | 39 | 0.0% |
| Native Hawaiian | 149 | 0.1% |
| Navajo | 16 | 0.0% |
| Nicaraguan | 26 | 0.0% |
| Northern European | 315 | 0.2% |
| Norwegian | 27,001 | 13.7% |
| Pakistani | 125 | 0.1% |
| Palestinian | 13 | 0.0% |
| Pennsylvania German | 43 | 0.0% |
| Peruvian | 21 | 0.0% |
| Polish | 2,472 | 1.3% |
| Portuguese | 217 | 0.1% |
| Puerto Rican | 524 | 0.3% |
| Romanian | 16 | 0.0% |
| Russian | 1,269 | 0.6% |
| Salvadoran | 1,638 | 0.8% |
| Scandinavian | 2,145 | 1.1% |
| Scotch-Irish | 796 | 0.4% |
| Scottish | 1,681 | 0.9% |
| Serbian | 140 | 0.1% |
| Shoshone | 26 | 0.0% |
| Sioux | 4,360 | 2.2% |
| Slavic | 51 | 0.0% |
| Slovak | 226 | 0.1% |
| Slovene | 18 | 0.0% |
| Somali | 469 | 0.2% |
| South American | 306 | 0.2% |
| Spaniard | 105 | 0.1% |
| Spanish | 197 | 0.1% |
| Sri Lankan | 416 | 0.2% |
| Subsaharan African | 7,609 | 3.8% |
| Sudanese | 716 | 0.4% |
| Swedish | 5,663 | 2.9% |
| Swiss | 879 | 0.4% |
| Syrian | 6 | 0.0% |
| Thai | 996 | 0.5% |
| Ugandan | 7 | 0.0% |
| Ukrainian | 298 | 0.2% |
| Venezuelan | 37 | 0.0% |
| Welsh | 546 | 0.3% |
| West Indian | 484 | 0.2% |
| Yugoslavian | 344 | 0.2% | View All 124 Rows |
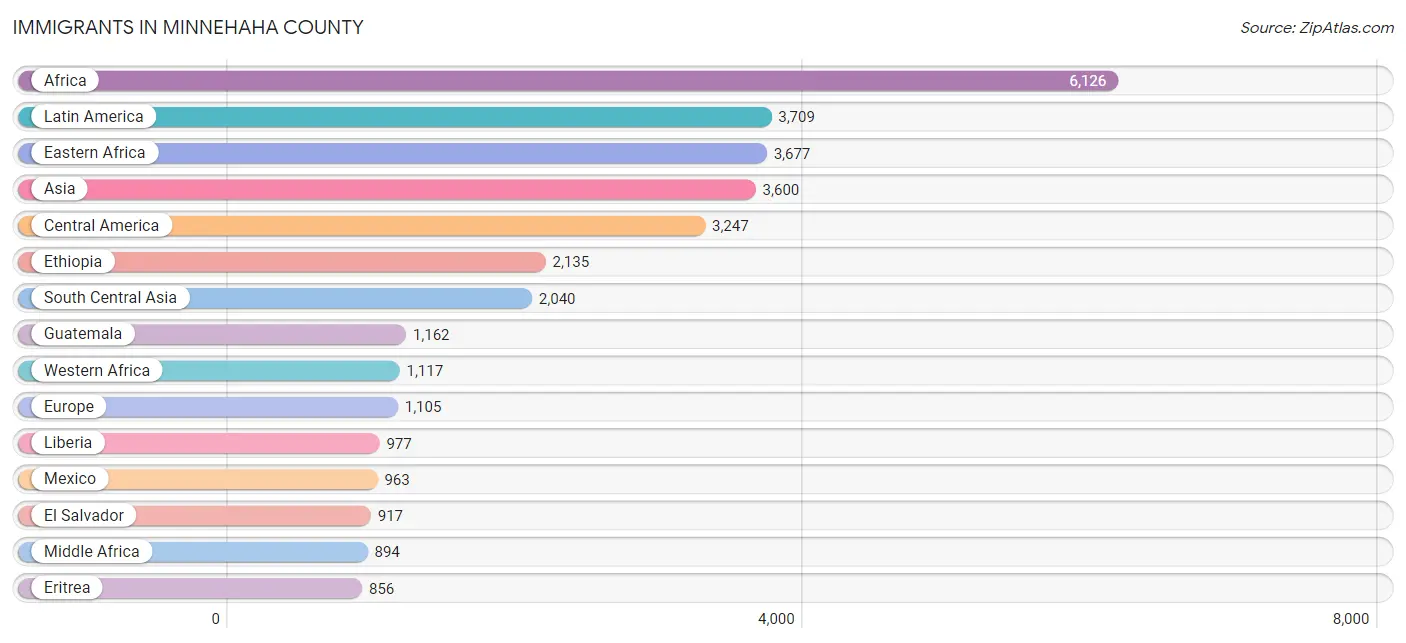
Immigrants in Minnehaha County
The most numerous immigrant groups reported in Minnehaha County came from Africa (6,126 | 3.1%), Latin America (3,709 | 1.9%), Eastern Africa (3,677 | 1.9%), Asia (3,600 | 1.8%), and Central America (3,247 | 1.6%), together accounting for 10.3% of all Minnehaha County residents.
| Immigration Origin | # Population | % Population |
| Afghanistan | 114 | 0.1% |
| Africa | 6,126 | 3.1% |
| Albania | 88 | 0.0% |
| Asia | 3,600 | 1.8% |
| Australia | 13 | 0.0% |
| Austria | 12 | 0.0% |
| Belarus | 7 | 0.0% |
| Bolivia | 15 | 0.0% |
| Bosnia and Herzegovina | 44 | 0.0% |
| Brazil | 12 | 0.0% |
| Cambodia | 161 | 0.1% |
| Canada | 294 | 0.2% |
| Caribbean | 195 | 0.1% |
| Central America | 3,247 | 1.6% |
| Chile | 38 | 0.0% |
| China | 138 | 0.1% |
| Colombia | 53 | 0.0% |
| Congo | 405 | 0.2% |
| Costa Rica | 5 | 0.0% |
| Croatia | 103 | 0.1% |
| Cuba | 39 | 0.0% |
| Dominican Republic | 29 | 0.0% |
| Eastern Africa | 3,677 | 1.9% |
| Eastern Asia | 451 | 0.2% |
| Eastern Europe | 763 | 0.4% |
| Ecuador | 111 | 0.1% |
| Egypt | 114 | 0.1% |
| El Salvador | 917 | 0.5% |
| England | 100 | 0.1% |
| Eritrea | 856 | 0.4% |
| Ethiopia | 2,135 | 1.1% |
| Europe | 1,105 | 0.6% |
| France | 6 | 0.0% |
| Germany | 70 | 0.0% |
| Greece | 6 | 0.0% |
| Guatemala | 1,162 | 0.6% |
| Haiti | 11 | 0.0% |
| Honduras | 91 | 0.1% |
| Hong Kong | 14 | 0.0% |
| India | 718 | 0.4% |
| Indonesia | 31 | 0.0% |
| Iran | 15 | 0.0% |
| Iraq | 239 | 0.1% |
| Ireland | 5 | 0.0% |
| Israel | 13 | 0.0% |
| Jamaica | 3 | 0.0% |
| Japan | 12 | 0.0% |
| Jordan | 13 | 0.0% |
| Kazakhstan | 25 | 0.0% |
| Kenya | 117 | 0.1% |
| Korea | 301 | 0.2% |
| Laos | 137 | 0.1% |
| Latin America | 3,709 | 1.9% |
| Latvia | 4 | 0.0% |
| Lebanon | 19 | 0.0% |
| Liberia | 977 | 0.5% |
| Malaysia | 29 | 0.0% |
| Mexico | 963 | 0.5% |
| Middle Africa | 894 | 0.4% |
| Moldova | 30 | 0.0% |
| Morocco | 37 | 0.0% |
| Nepal | 706 | 0.4% |
| Netherlands | 25 | 0.0% |
| Nicaragua | 26 | 0.0% |
| Nigeria | 24 | 0.0% |
| Northern Africa | 405 | 0.2% |
| Northern Europe | 193 | 0.1% |
| Norway | 24 | 0.0% |
| Oceania | 57 | 0.0% |
| Pakistan | 26 | 0.0% |
| Panama | 83 | 0.0% |
| Peru | 17 | 0.0% |
| Philippines | 177 | 0.1% |
| Poland | 14 | 0.0% |
| Romania | 12 | 0.0% |
| Russia | 35 | 0.0% |
| Somalia | 124 | 0.1% |
| South Africa | 19 | 0.0% |
| South America | 267 | 0.1% |
| South Central Asia | 2,040 | 1.0% |
| South Eastern Asia | 801 | 0.4% |
| Southern Europe | 36 | 0.0% |
| St. Vincent and the Grenadines | 61 | 0.0% |
| Sudan | 254 | 0.1% |
| Thailand | 94 | 0.1% |
| Uganda | 7 | 0.0% |
| Ukraine | 200 | 0.1% |
| Venezuela | 21 | 0.0% |
| Vietnam | 83 | 0.0% |
| Western Africa | 1,117 | 0.6% |
| Western Asia | 295 | 0.2% |
| Western Europe | 113 | 0.1% |
| Zaire | 489 | 0.3% |
| Zimbabwe | 18 | 0.0% | View All 94 Rows |
Sex and Age in Minnehaha County
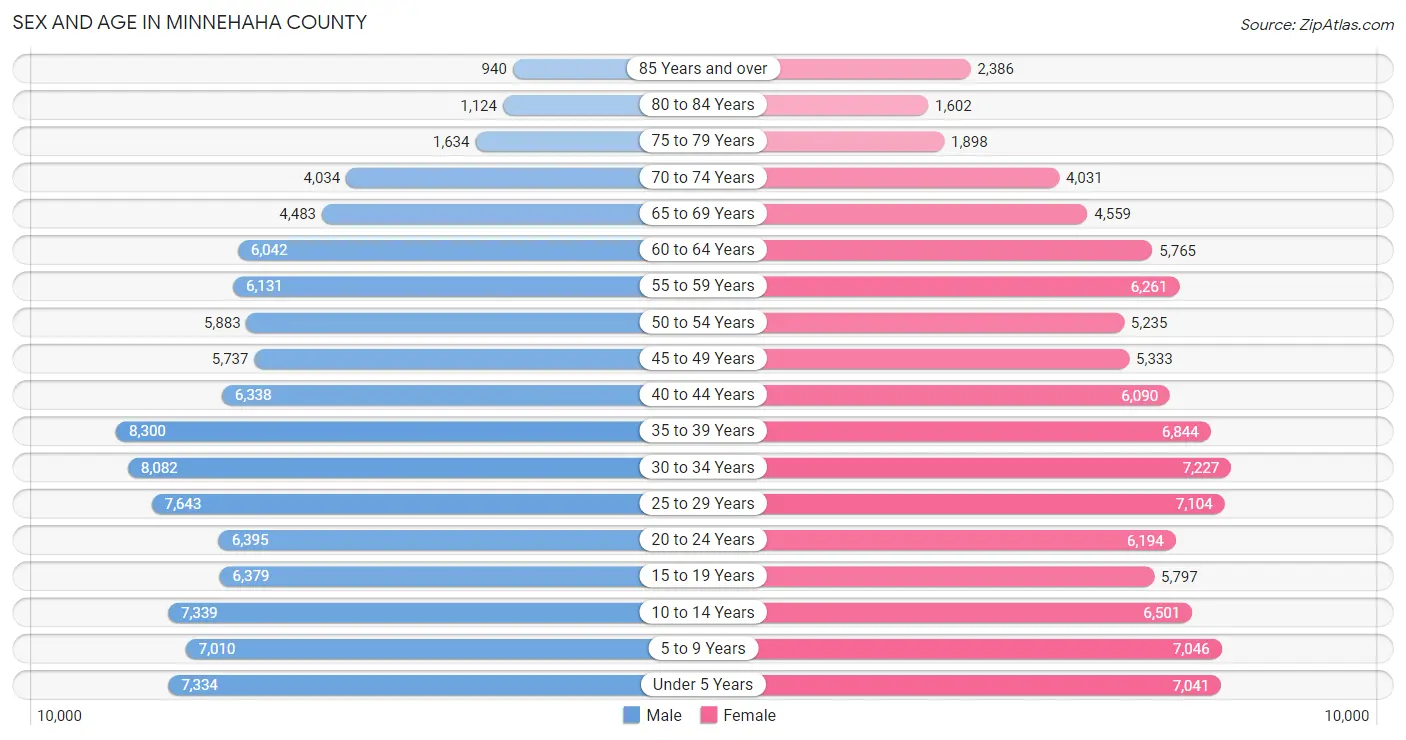
Sex and Age in Minnehaha County
The most populous age groups in Minnehaha County are 35 to 39 Years (8,300 | 8.2%) for men and 30 to 34 Years (7,227 | 7.5%) for women.
| Age Bracket | Male | Female |
| Under 5 Years | 7,334 (7.3%) | 7,041 (7.3%) |
| 5 to 9 Years | 7,010 (7.0%) | 7,046 (7.3%) |
| 10 to 14 Years | 7,339 (7.3%) | 6,501 (6.7%) |
| 15 to 19 Years | 6,379 (6.3%) | 5,797 (6.0%) |
| 20 to 24 Years | 6,395 (6.3%) | 6,194 (6.4%) |
| 25 to 29 Years | 7,643 (7.6%) | 7,104 (7.3%) |
| 30 to 34 Years | 8,082 (8.0%) | 7,227 (7.5%) |
| 35 to 39 Years | 8,300 (8.2%) | 6,844 (7.1%) |
| 40 to 44 Years | 6,338 (6.3%) | 6,090 (6.3%) |
| 45 to 49 Years | 5,737 (5.7%) | 5,333 (5.5%) |
| 50 to 54 Years | 5,883 (5.8%) | 5,235 (5.4%) |
| 55 to 59 Years | 6,131 (6.1%) | 6,261 (6.5%) |
| 60 to 64 Years | 6,042 (6.0%) | 5,765 (5.9%) |
| 65 to 69 Years | 4,483 (4.4%) | 4,559 (4.7%) |
| 70 to 74 Years | 4,034 (4.0%) | 4,031 (4.2%) |
| 75 to 79 Years | 1,634 (1.6%) | 1,898 (2.0%) |
| 80 to 84 Years | 1,124 (1.1%) | 1,602 (1.7%) |
| 85 Years and over | 940 (0.9%) | 2,386 (2.5%) |
| Total | 100,828 (100.0%) | 96,914 (100.0%) |
Families and Households in Minnehaha County
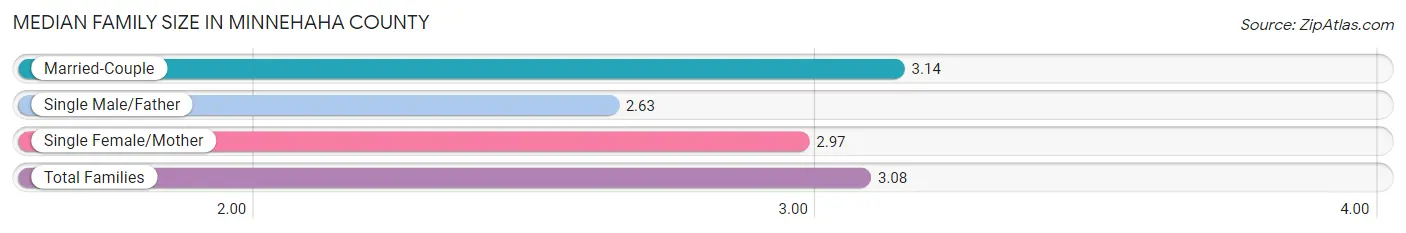
Median Family Size in Minnehaha County
The median family size in Minnehaha County is 3.08 persons per family, with married-couple families (37,263 | 77.1%) accounting for the largest median family size of 3.14 persons per family. On the other hand, single male/father families (3,745 | 7.7%) represent the smallest median family size with 2.63 persons per family.
| Family Type | # Families | Family Size |
| Married-Couple | 37,263 (77.1%) | 3.14 |
| Single Male/Father | 3,745 (7.7%) | 2.63 |
| Single Female/Mother | 7,347 (15.2%) | 2.97 |
| Total Families | 48,355 (100.0%) | 3.08 |
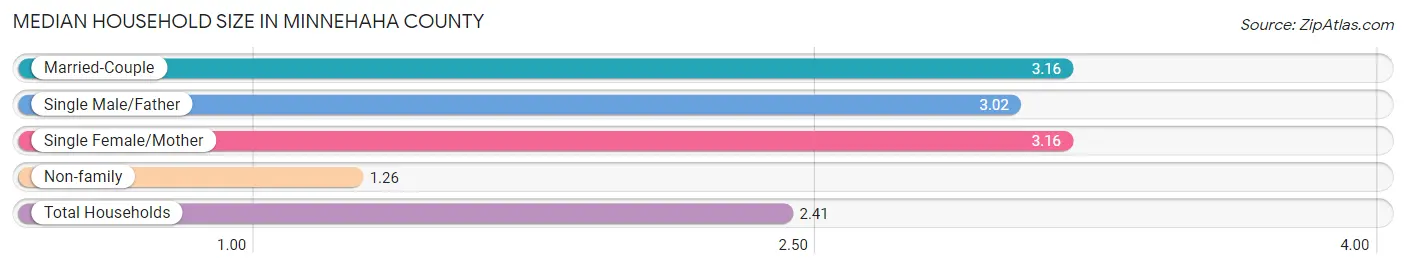
Median Household Size in Minnehaha County
The median household size in Minnehaha County is 2.41 persons per household, with married-couple households (37,263 | 46.6%) accounting for the largest median household size of 3.16 persons per household. non-family households (31,532 | 39.5%) represent the smallest median household size with 1.26 persons per household.
| Household Type | # Households | Household Size |
| Married-Couple | 37,263 (46.6%) | 3.16 |
| Single Male/Father | 3,745 (4.7%) | 3.02 |
| Single Female/Mother | 7,347 (9.2%) | 3.16 |
| Non-family | 31,532 (39.5%) | 1.26 |
| Total Households | 79,887 (100.0%) | 2.41 |
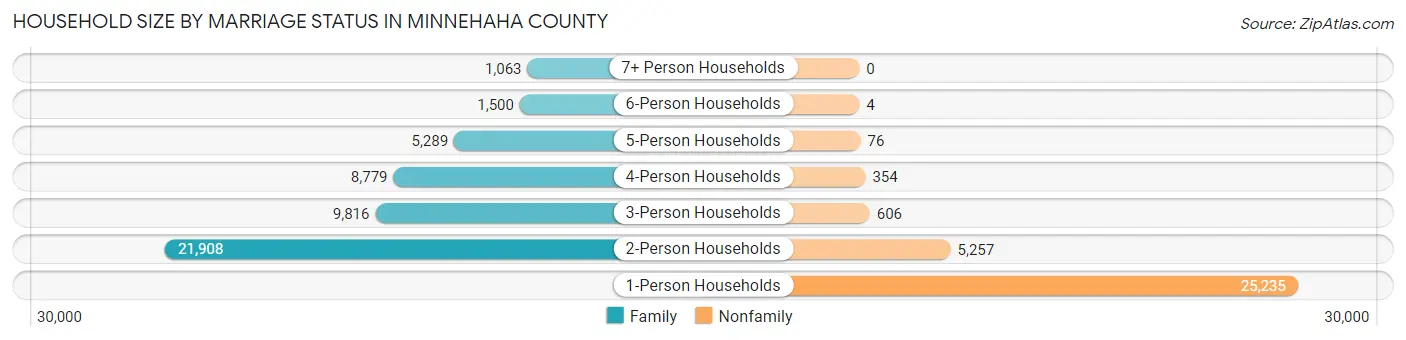
Household Size by Marriage Status in Minnehaha County
Out of a total of 79,887 households in Minnehaha County, 48,355 (60.5%) are family households, while 31,532 (39.5%) are nonfamily households. The most numerous type of family households are 2-person households, comprising 21,908, and the most common type of nonfamily households are 1-person households, comprising 25,235.
| Household Size | Family Households | Nonfamily Households |
| 1-Person Households | - | 25,235 (31.6%) |
| 2-Person Households | 21,908 (27.4%) | 5,257 (6.6%) |
| 3-Person Households | 9,816 (12.3%) | 606 (0.8%) |
| 4-Person Households | 8,779 (11.0%) | 354 (0.4%) |
| 5-Person Households | 5,289 (6.6%) | 76 (0.1%) |
| 6-Person Households | 1,500 (1.9%) | 4 (0.0%) |
| 7+ Person Households | 1,063 (1.3%) | 0 (0.0%) |
| Total | 48,355 (60.5%) | 31,532 (39.5%) |
Female Fertility in Minnehaha County
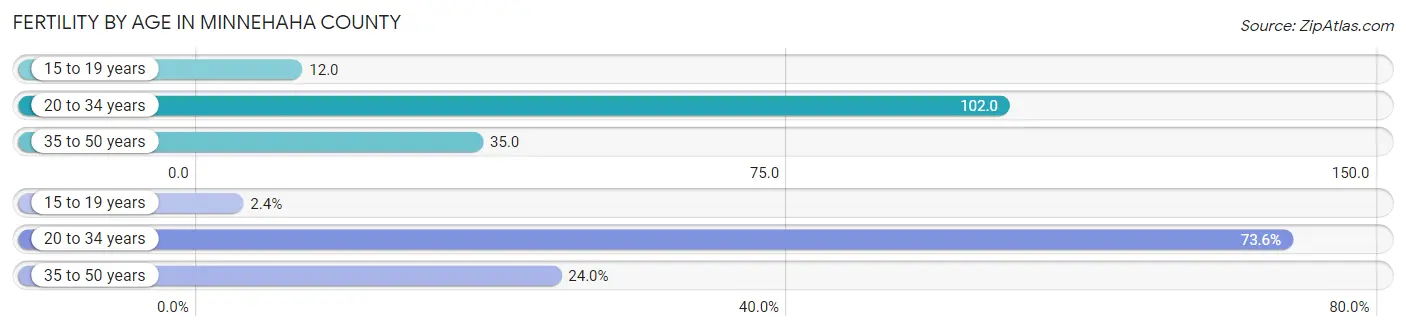
Fertility by Age in Minnehaha County
Average fertility rate in Minnehaha County is 62.0 births per 1,000 women. Women in the age bracket of 20 to 34 years have the highest fertility rate with 102.0 births per 1,000 women. Women in the age bracket of 20 to 34 years acount for 73.6% of all women with births.
| Age Bracket | Women with Births | Births / 1,000 Women |
| 15 to 19 years | 68 (2.4%) | 12.0 |
| 20 to 34 years | 2,088 (73.6%) | 102.0 |
| 35 to 50 years | 680 (24.0%) | 35.0 |
| Total | 2,836 (100.0%) | 62.0 |
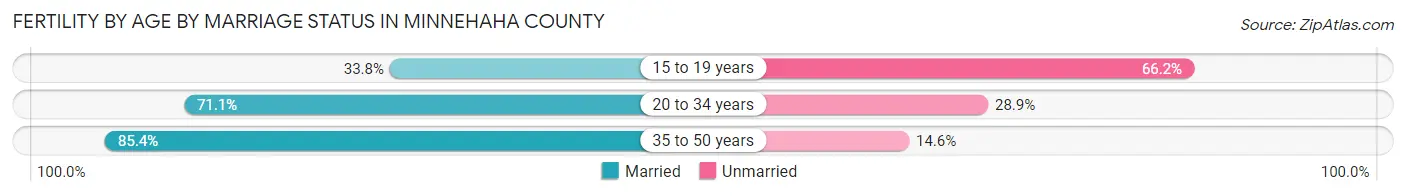
Fertility by Age by Marriage Status in Minnehaha County
73.7% of women with births (2,836) in Minnehaha County are married. The highest percentage of unmarried women with births falls into 15 to 19 years age bracket with 66.2% of them unmarried at the time of birth, while the lowest percentage of unmarried women with births belong to 35 to 50 years age bracket with 14.6% of them unmarried.
| Age Bracket | Married | Unmarried |
| 15 to 19 years | 23 (33.8%) | 45 (66.2%) |
| 20 to 34 years | 1,485 (71.1%) | 603 (28.9%) |
| 35 to 50 years | 581 (85.4%) | 99 (14.6%) |
| Total | 2,090 (73.7%) | 746 (26.3%) |
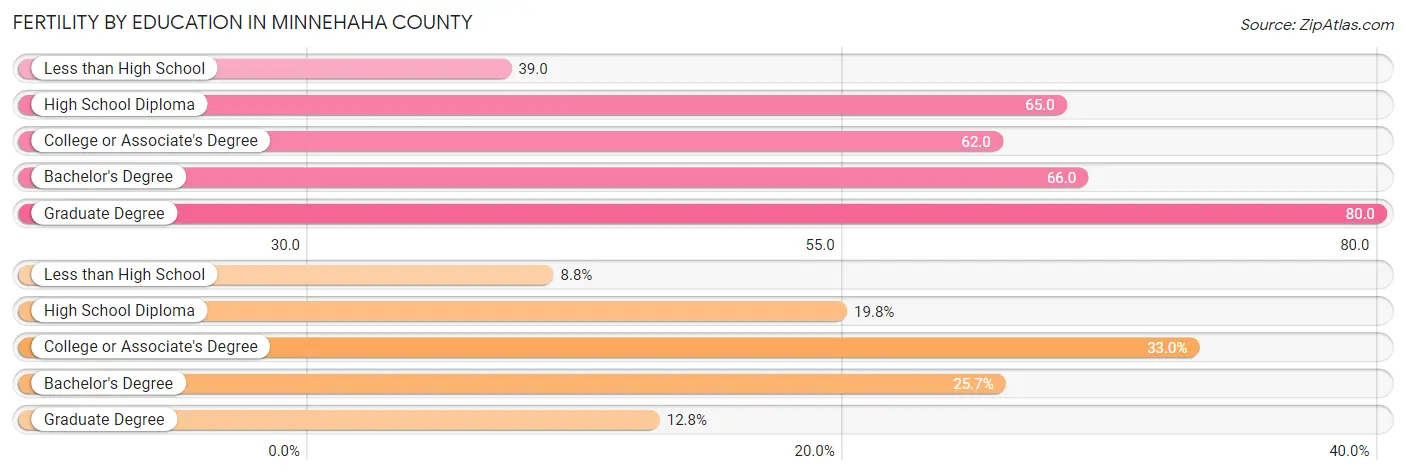
Fertility by Education in Minnehaha County
Average fertility rate in Minnehaha County is 62.0 births per 1,000 women. Women with the education attainment of graduate degree have the highest fertility rate of 80.0 births per 1,000 women, while women with the education attainment of less than high school have the lowest fertility at 39.0 births per 1,000 women. Women with the education attainment of college or associate's degree represent 33.0% of all women with births.
| Educational Attainment | Women with Births | Births / 1,000 Women |
| Less than High School | 249 (8.8%) | 39.0 |
| High School Diploma | 561 (19.8%) | 65.0 |
| College or Associate's Degree | 935 (33.0%) | 62.0 |
| Bachelor's Degree | 729 (25.7%) | 66.0 |
| Graduate Degree | 362 (12.8%) | 80.0 |
| Total | 2,836 (100.0%) | 62.0 |
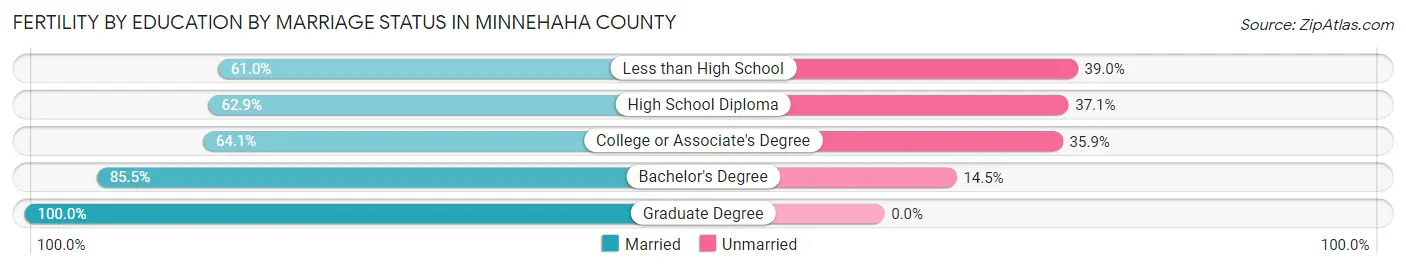
Fertility by Education by Marriage Status in Minnehaha County
26.3% of women with births in Minnehaha County are unmarried. Women with the educational attainment of graduate degree are most likely to be married with 100.0% of them married at childbirth, while women with the educational attainment of less than high school are least likely to be married with 39.0% of them unmarried at childbirth.
| Educational Attainment | Married | Unmarried |
| Less than High School | 152 (61.0%) | 97 (39.0%) |
| High School Diploma | 353 (62.9%) | 208 (37.1%) |
| College or Associate's Degree | 599 (64.1%) | 336 (35.9%) |
| Bachelor's Degree | 623 (85.5%) | 106 (14.5%) |
| Graduate Degree | 362 (100.0%) | 0 (0.0%) |
| Total | 2,090 (73.7%) | 746 (26.3%) |
Income in Minnehaha County
Income Overview in Minnehaha County
Per Capita Income in Minnehaha County is $39,289, while median incomes of families and households are $95,190 and $73,110 respectively.
| Characteristic | Number | Measure |
| Per Capita Income | 197,742 | $39,289 |
| Median Family Income | 48,355 | $95,190 |
| Mean Family Income | 48,355 | $114,985 |
| Median Household Income | 79,887 | $73,110 |
| Mean Household Income | 79,887 | $95,106 |
| Income Deficit | 48,355 | $9,570 |
| Wage / Income Gap (%) | 197,742 | 23.39% |
| Wage / Income Gap ($) | 197,742 | 76.61¢ per $1 |
| Gini / Inequality Index | 197,742 | 0.43 |
Earnings by Sex in Minnehaha County
Average Earnings in Minnehaha County are $42,666, $48,323 for men and $37,021 for women, a difference of 23.4%.
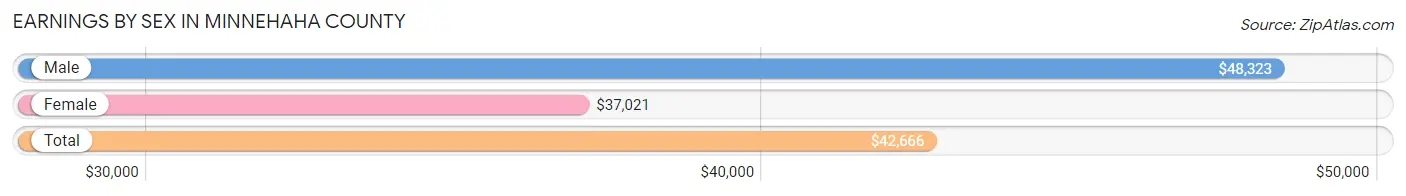
| Sex | Number | Average Earnings |
| Male | 63,697 (53.3%) | $48,323 |
| Female | 55,774 (46.7%) | $37,021 |
| Total | 119,471 (100.0%) | $42,666 |
Earnings by Sex by Income Bracket in Minnehaha County
The most common earnings brackets in Minnehaha County are $100,000+ for men (8,292 | 13.0%) and $55,000 to $64,999 for women (4,743 | 8.5%).
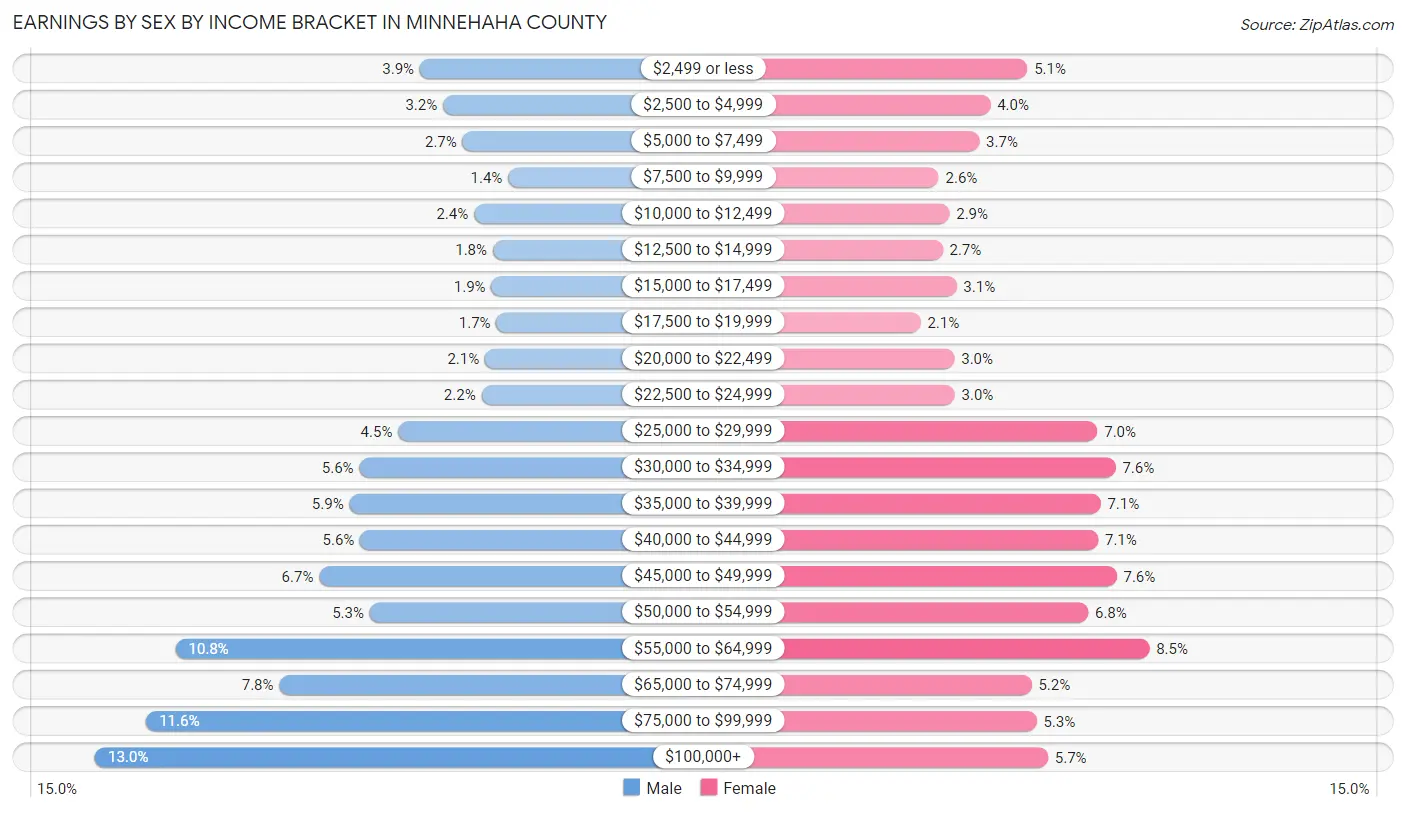
| Income | Male | Female |
| $2,499 or less | 2,475 (3.9%) | 2,830 (5.1%) |
| $2,500 to $4,999 | 2,065 (3.2%) | 2,250 (4.0%) |
| $5,000 to $7,499 | 1,711 (2.7%) | 2,077 (3.7%) |
| $7,500 to $9,999 | 895 (1.4%) | 1,440 (2.6%) |
| $10,000 to $12,499 | 1,511 (2.4%) | 1,609 (2.9%) |
| $12,500 to $14,999 | 1,172 (1.8%) | 1,498 (2.7%) |
| $15,000 to $17,499 | 1,198 (1.9%) | 1,720 (3.1%) |
| $17,500 to $19,999 | 1,110 (1.7%) | 1,152 (2.1%) |
| $20,000 to $22,499 | 1,309 (2.1%) | 1,685 (3.0%) |
| $22,500 to $24,999 | 1,374 (2.2%) | 1,688 (3.0%) |
| $25,000 to $29,999 | 2,865 (4.5%) | 3,929 (7.0%) |
| $30,000 to $34,999 | 3,561 (5.6%) | 4,209 (7.5%) |
| $35,000 to $39,999 | 3,738 (5.9%) | 3,979 (7.1%) |
| $40,000 to $44,999 | 3,545 (5.6%) | 3,939 (7.1%) |
| $45,000 to $49,999 | 4,282 (6.7%) | 4,226 (7.6%) |
| $50,000 to $54,999 | 3,373 (5.3%) | 3,782 (6.8%) |
| $55,000 to $64,999 | 6,854 (10.8%) | 4,743 (8.5%) |
| $65,000 to $74,999 | 4,993 (7.8%) | 2,896 (5.2%) |
| $75,000 to $99,999 | 7,374 (11.6%) | 2,971 (5.3%) |
| $100,000+ | 8,292 (13.0%) | 3,151 (5.7%) |
| Total | 63,697 (100.0%) | 55,774 (100.0%) |
Earnings by Sex by Educational Attainment in Minnehaha County
Average earnings in Minnehaha County are $54,182 for men and $41,619 for women, a difference of 23.2%. Men with an educational attainment of graduate degree enjoy the highest average annual earnings of $80,211, while those with less than high school education earn the least with $39,125. Women with an educational attainment of graduate degree earn the most with the average annual earnings of $58,864, while those with less than high school education have the smallest earnings of $28,937.
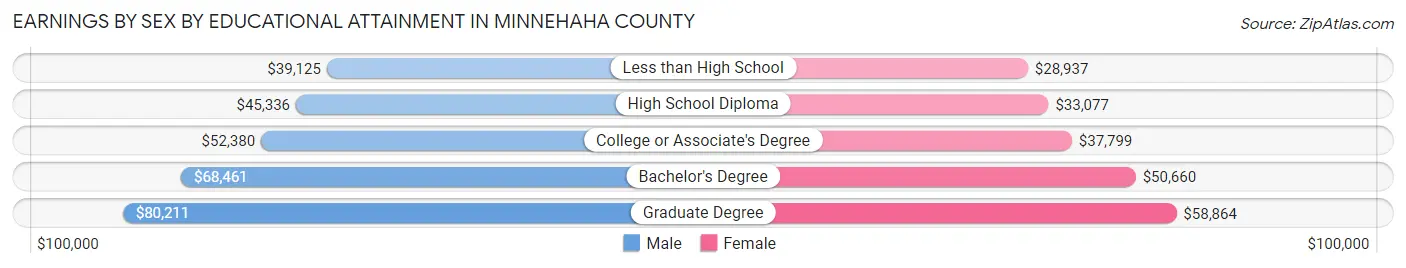
| Educational Attainment | Male Income | Female Income |
| Less than High School | $39,125 | $28,937 |
| High School Diploma | $45,336 | $33,077 |
| College or Associate's Degree | $52,380 | $37,799 |
| Bachelor's Degree | $68,461 | $50,660 |
| Graduate Degree | $80,211 | $58,864 |
| Total | $54,182 | $41,619 |
Family Income in Minnehaha County
Family Income Brackets in Minnehaha County
According to the Minnehaha County family income data, there are 12,089 families falling into the $100,000 to $149,999 income range, which is the most common income bracket and makes up 25.0% of all families. Conversely, the $10,000 to $14,999 income bracket is the least frequent group with only 580 families (1.2%) belonging to this category.
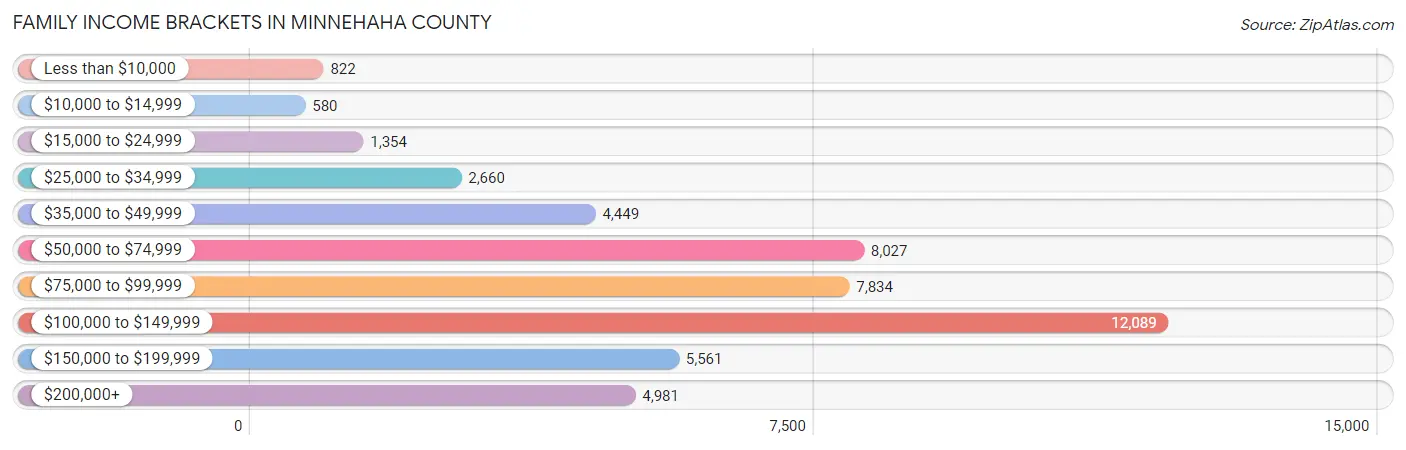
| Income Bracket | # Families | % Families |
| Less than $10,000 | 822 | 1.7% |
| $10,000 to $14,999 | 580 | 1.2% |
| $15,000 to $24,999 | 1,354 | 2.8% |
| $25,000 to $34,999 | 2,660 | 5.5% |
| $35,000 to $49,999 | 4,449 | 9.2% |
| $50,000 to $74,999 | 8,027 | 16.6% |
| $75,000 to $99,999 | 7,834 | 16.2% |
| $100,000 to $149,999 | 12,089 | 25.0% |
| $150,000 to $199,999 | 5,561 | 11.5% |
| $200,000+ | 4,981 | 10.3% |
Family Income by Famaliy Size in Minnehaha County
7+ person families (907 | 1.9%) account for the highest median family income in Minnehaha County with $122,258 per family, while 2-person families (23,301 | 48.2%) have the highest median income of $41,870 per family member.
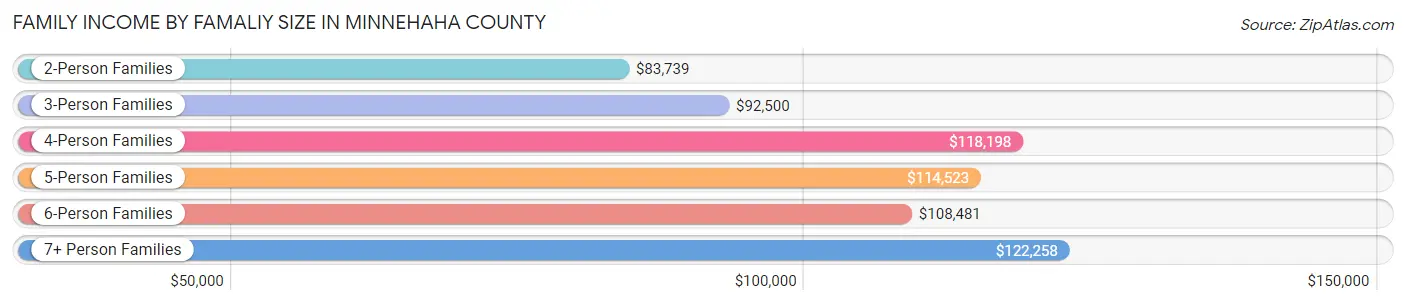
| Income Bracket | # Families | Median Income |
| 2-Person Families | 23,301 (48.2%) | $83,739 |
| 3-Person Families | 9,380 (19.4%) | $92,500 |
| 4-Person Families | 8,544 (17.7%) | $118,198 |
| 5-Person Families | 4,809 (10.0%) | $114,523 |
| 6-Person Families | 1,414 (2.9%) | $108,481 |
| 7+ Person Families | 907 (1.9%) | $122,258 |
| Total | 48,355 (100.0%) | $95,190 |
Family Income by Number of Earners in Minnehaha County
The median family income in Minnehaha County is $95,190, with families comprising 3+ earners (6,039) having the highest median family income of $146,265, while families with 1 earner (12,869) have the lowest median family income of $52,972, accounting for 12.5% and 26.6% of families, respectively.
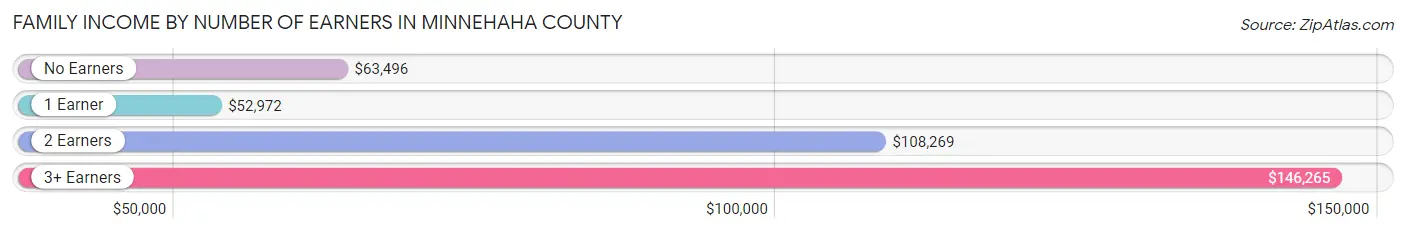
| Number of Earners | # Families | Median Income |
| No Earners | 4,574 (9.5%) | $63,496 |
| 1 Earner | 12,869 (26.6%) | $52,972 |
| 2 Earners | 24,873 (51.4%) | $108,269 |
| 3+ Earners | 6,039 (12.5%) | $146,265 |
| Total | 48,355 (100.0%) | $95,190 |
Household Income in Minnehaha County
Household Income Brackets in Minnehaha County
With 15,258 households falling in the category, the $100,000 to $149,999 income range is the most frequent in Minnehaha County, accounting for 19.1% of all households. In contrast, only 2,157 households (2.7%) fall into the $10,000 to $14,999 income bracket, making it the least populous group.
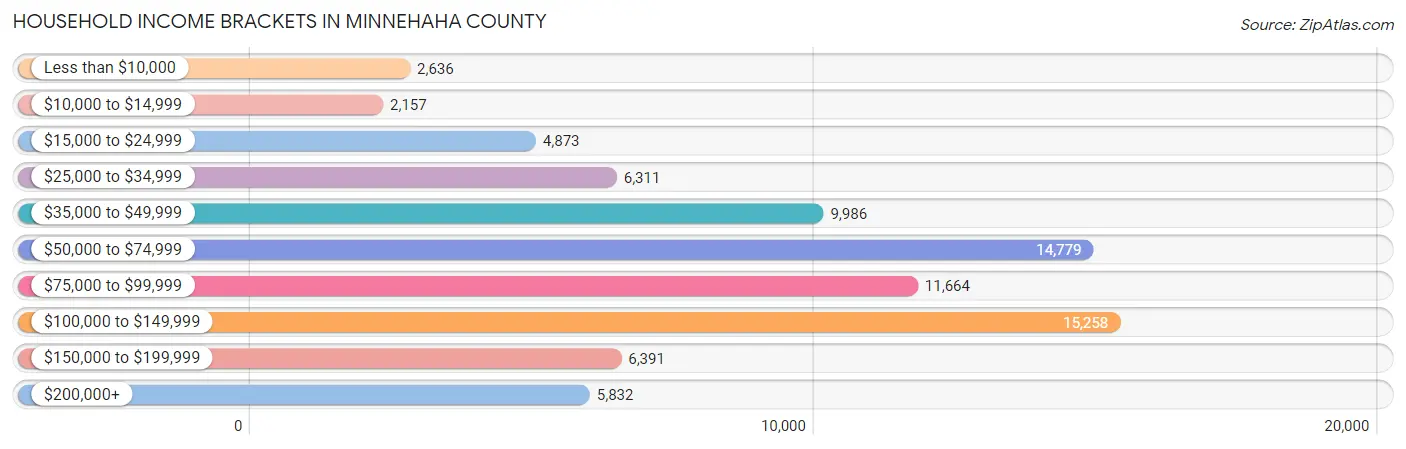
| Income Bracket | # Households | % Households |
| Less than $10,000 | 2,636 | 3.3% |
| $10,000 to $14,999 | 2,157 | 2.7% |
| $15,000 to $24,999 | 4,873 | 6.1% |
| $25,000 to $34,999 | 6,311 | 7.9% |
| $35,000 to $49,999 | 9,986 | 12.5% |
| $50,000 to $74,999 | 14,779 | 18.5% |
| $75,000 to $99,999 | 11,664 | 14.6% |
| $100,000 to $149,999 | 15,258 | 19.1% |
| $150,000 to $199,999 | 6,391 | 8.0% |
| $200,000+ | 5,832 | 7.3% |
Household Income by Householder Age in Minnehaha County
The median household income in Minnehaha County is $73,110, with the highest median household income of $86,239 found in the 45 to 64 years age bracket for the primary householder. A total of 26,902 households (33.7%) fall into this category. Meanwhile, the 15 to 24 years age bracket for the primary householder has the lowest median household income of $47,232, with 4,491 households (5.6%) in this group.
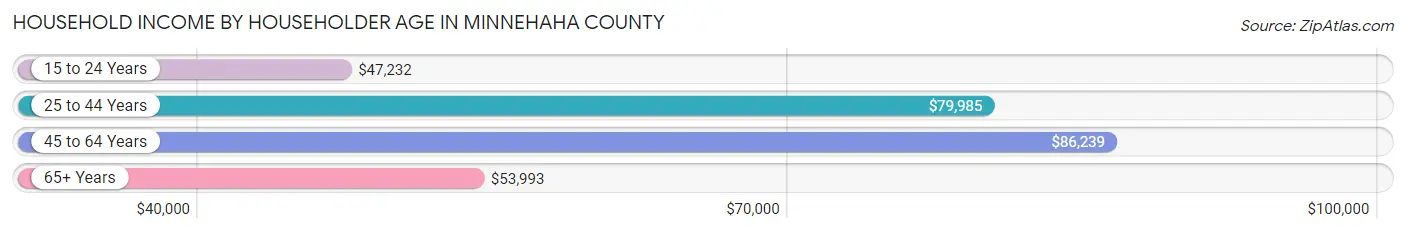
| Income Bracket | # Households | Median Income |
| 15 to 24 Years | 4,491 (5.6%) | $47,232 |
| 25 to 44 Years | 31,141 (39.0%) | $79,985 |
| 45 to 64 Years | 26,902 (33.7%) | $86,239 |
| 65+ Years | 17,353 (21.7%) | $53,993 |
| Total | 79,887 (100.0%) | $73,110 |
Poverty in Minnehaha County
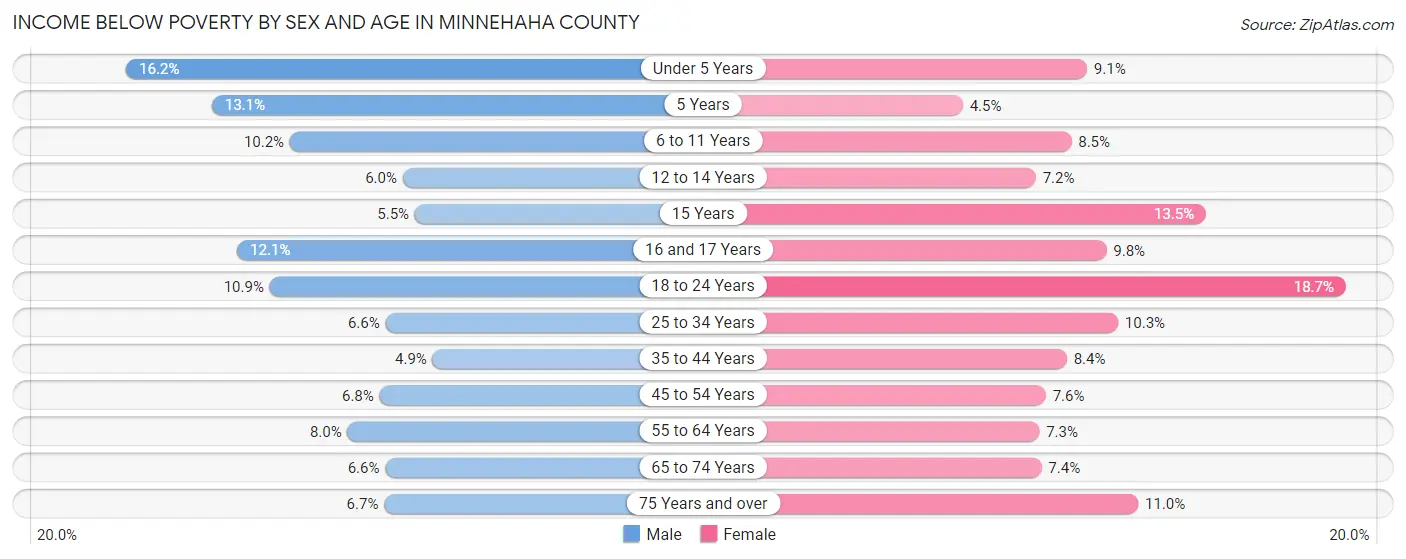
Income Below Poverty by Sex and Age in Minnehaha County
With 8.1% poverty level for males and 9.3% for females among the residents of Minnehaha County, under 5 year old males and 18 to 24 year old females are the most vulnerable to poverty, with 1,177 males (16.2%) and 1,367 females (18.7%) in their respective age groups living below the poverty level.
| Age Bracket | Male | Female |
| Under 5 Years | 1,177 (16.2%) | 630 (9.1%) |
| 5 Years | 165 (13.1%) | 62 (4.5%) |
| 6 to 11 Years | 816 (10.2%) | 688 (8.5%) |
| 12 to 14 Years | 273 (6.0%) | 282 (7.2%) |
| 15 Years | 75 (5.5%) | 151 (13.5%) |
| 16 and 17 Years | 313 (12.1%) | 254 (9.8%) |
| 18 to 24 Years | 855 (10.9%) | 1,367 (18.7%) |
| 25 to 34 Years | 1,004 (6.6%) | 1,460 (10.2%) |
| 35 to 44 Years | 698 (4.9%) | 1,076 (8.4%) |
| 45 to 54 Years | 777 (6.8%) | 799 (7.6%) |
| 55 to 64 Years | 969 (8.0%) | 876 (7.3%) |
| 65 to 74 Years | 553 (6.6%) | 630 (7.4%) |
| 75 Years and over | 234 (6.7%) | 591 (11.0%) |
| Total | 7,909 (8.1%) | 8,866 (9.3%) |
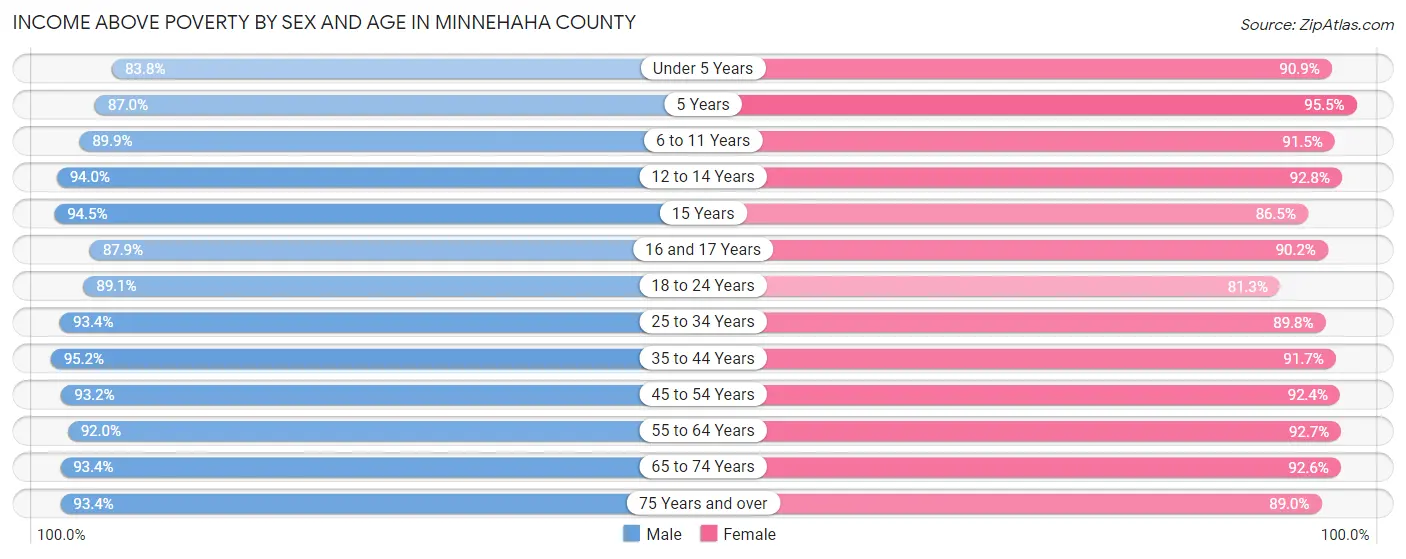
Income Above Poverty by Sex and Age in Minnehaha County
According to the poverty statistics in Minnehaha County, males aged 35 to 44 years and females aged 5 years are the age groups that are most secure financially, with 95.2% of males and 95.5% of females in these age groups living above the poverty line.
| Age Bracket | Male | Female |
| Under 5 Years | 6,075 (83.8%) | 6,290 (90.9%) |
| 5 Years | 1,099 (87.0%) | 1,320 (95.5%) |
| 6 to 11 Years | 7,221 (89.8%) | 7,389 (91.5%) |
| 12 to 14 Years | 4,305 (94.0%) | 3,635 (92.8%) |
| 15 Years | 1,285 (94.5%) | 966 (86.5%) |
| 16 and 17 Years | 2,272 (87.9%) | 2,333 (90.2%) |
| 18 to 24 Years | 6,989 (89.1%) | 5,941 (81.3%) |
| 25 to 34 Years | 14,219 (93.4%) | 12,790 (89.7%) |
| 35 to 44 Years | 13,685 (95.2%) | 11,807 (91.6%) |
| 45 to 54 Years | 10,623 (93.2%) | 9,757 (92.4%) |
| 55 to 64 Years | 11,123 (92.0%) | 11,080 (92.7%) |
| 65 to 74 Years | 7,815 (93.4%) | 7,867 (92.6%) |
| 75 Years and over | 3,284 (93.3%) | 4,784 (89.0%) |
| Total | 89,995 (91.9%) | 85,959 (90.6%) |
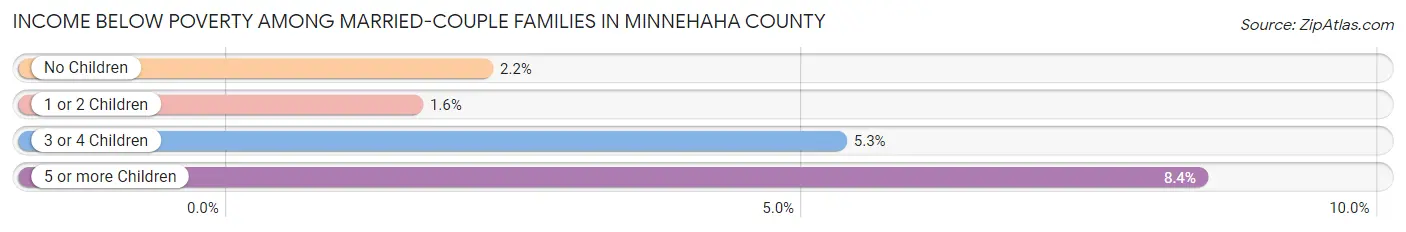
Income Below Poverty Among Married-Couple Families in Minnehaha County
The poverty statistics for married-couple families in Minnehaha County show that 2.5% or 915 of the total 37,263 families live below the poverty line. Families with 5 or more children have the highest poverty rate of 8.4%, comprising of 41 families. On the other hand, families with 1 or 2 children have the lowest poverty rate of 1.6%, which includes 195 families.
| Children | Above Poverty | Below Poverty |
| No Children | 19,898 (97.8%) | 452 (2.2%) |
| 1 or 2 Children | 11,945 (98.4%) | 195 (1.6%) |
| 3 or 4 Children | 4,060 (94.7%) | 227 (5.3%) |
| 5 or more Children | 445 (91.6%) | 41 (8.4%) |
| Total | 36,348 (97.5%) | 915 (2.5%) |
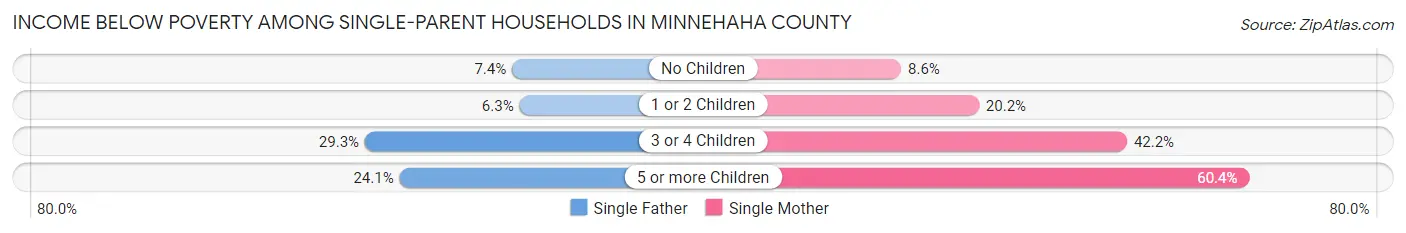
Income Below Poverty Among Single-Parent Households in Minnehaha County
According to the poverty data in Minnehaha County, 9.0% or 337 single-father households and 21.0% or 1,545 single-mother households are living below the poverty line. Among single-father households, those with 3 or 4 children have the highest poverty rate, with 99 households (29.3%) experiencing poverty. Likewise, among single-mother households, those with 5 or more children have the highest poverty rate, with 110 households (60.4%) falling below the poverty line.
| Children | Single Father | Single Mother |
| No Children | 96 (7.4%) | 157 (8.6%) |
| 1 or 2 Children | 128 (6.3%) | 888 (20.2%) |
| 3 or 4 Children | 99 (29.3%) | 390 (42.2%) |
| 5 or more Children | 14 (24.1%) | 110 (60.4%) |
| Total | 337 (9.0%) | 1,545 (21.0%) |
Income Below Poverty Among Married-Couple vs Single-Parent Households in Minnehaha County
The poverty data for Minnehaha County shows that 915 of the married-couple family households (2.5%) and 1,882 of the single-parent households (17.0%) are living below the poverty level. Within the married-couple family households, those with 5 or more children have the highest poverty rate, with 41 households (8.4%) falling below the poverty line. Among the single-parent households, those with 5 or more children have the highest poverty rate, with 124 household (51.7%) living below poverty.
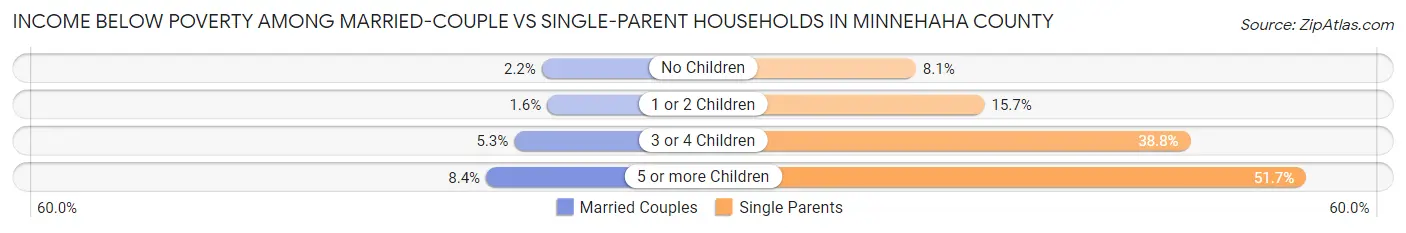
| Children | Married-Couple Families | Single-Parent Households |
| No Children | 452 (2.2%) | 253 (8.1%) |
| 1 or 2 Children | 195 (1.6%) | 1,016 (15.7%) |
| 3 or 4 Children | 227 (5.3%) | 489 (38.8%) |
| 5 or more Children | 41 (8.4%) | 124 (51.7%) |
| Total | 915 (2.5%) | 1,882 (17.0%) |
Employment Characteristics in Minnehaha County
Employment by Class of Employer in Minnehaha County
Among the 108,862 employed individuals in Minnehaha County, private company employees (74,843 | 68.8%), not-for-profit organizations (15,409 | 14.1%), and local government employees (5,154 | 4.7%) make up the most common classes of employment.
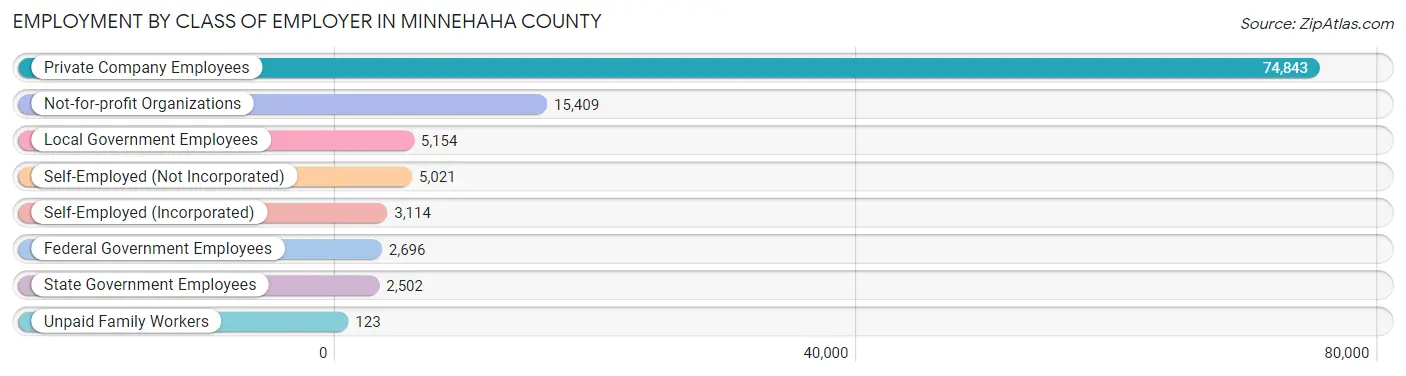
| Employer Class | # Employees | % Employees |
| Private Company Employees | 74,843 | 68.8% |
| Self-Employed (Incorporated) | 3,114 | 2.9% |
| Self-Employed (Not Incorporated) | 5,021 | 4.6% |
| Not-for-profit Organizations | 15,409 | 14.1% |
| Local Government Employees | 5,154 | 4.7% |
| State Government Employees | 2,502 | 2.3% |
| Federal Government Employees | 2,696 | 2.5% |
| Unpaid Family Workers | 123 | 0.1% |
| Total | 108,862 | 100.0% |
Employment Status by Age in Minnehaha County
According to the labor force statistics for Minnehaha County, out of the total population over 16 years of age (152,981), 74.3% or 113,665 individuals are in the labor force, with 2.4% or 2,728 of them unemployed. The age group with the highest labor force participation rate is 30 to 34 years, with 92.7% or 14,191 individuals in the labor force. Within the labor force, the 16 to 19 years age range has the highest percentage of unemployed individuals, with 8.4% or 464 of them being unemployed.
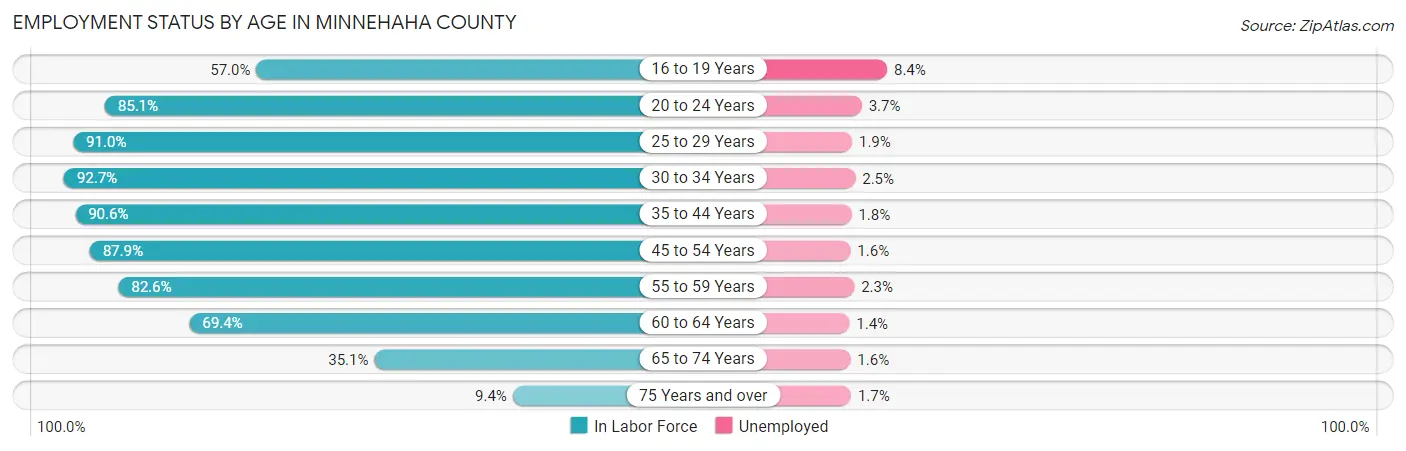
| Age Bracket | In Labor Force | Unemployed |
| 16 to 19 Years | 5,521 (57.0%) | 464 (8.4%) |
| 20 to 24 Years | 10,713 (85.1%) | 396 (3.7%) |
| 25 to 29 Years | 13,420 (91.0%) | 255 (1.9%) |
| 30 to 34 Years | 14,191 (92.7%) | 355 (2.5%) |
| 35 to 44 Years | 24,980 (90.6%) | 450 (1.8%) |
| 45 to 54 Years | 19,503 (87.9%) | 312 (1.6%) |
| 55 to 59 Years | 10,236 (82.6%) | 235 (2.3%) |
| 60 to 64 Years | 8,194 (69.4%) | 115 (1.4%) |
| 65 to 74 Years | 6,005 (35.1%) | 96 (1.6%) |
| 75 Years and over | 901 (9.4%) | 15 (1.7%) |
| Total | 113,665 (74.3%) | 2,728 (2.4%) |
Employment Status by Educational Attainment in Minnehaha County
According to labor force statistics for Minnehaha County, 87.0% of individuals (90,493) out of the total population between 25 and 64 years of age (104,015) are in the labor force, with 1.9% or 1,719 of them being unemployed. The group with the highest labor force participation rate are those with the educational attainment of bachelor's degree or higher, with 92.1% or 33,902 individuals in the labor force. Within the labor force, individuals with less than high school education have the highest percentage of unemployment, with 7.3% or 391 of them being unemployed.
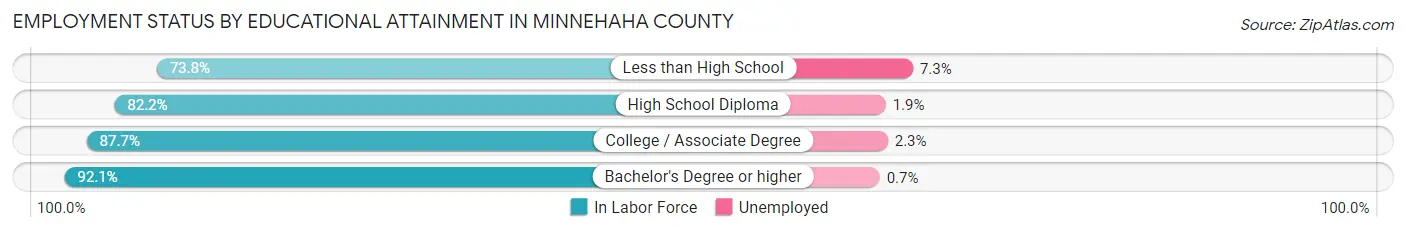
| Educational Attainment | In Labor Force | Unemployed |
| Less than High School | 5,362 (73.8%) | 530 (7.3%) |
| High School Diploma | 19,981 (82.2%) | 462 (1.9%) |
| College / Associate Degree | 31,248 (87.7%) | 820 (2.3%) |
| Bachelor's Degree or higher | 33,902 (92.1%) | 258 (0.7%) |
| Total | 90,493 (87.0%) | 1,976 (1.9%) |
Employment Occupations by Sex in Minnehaha County
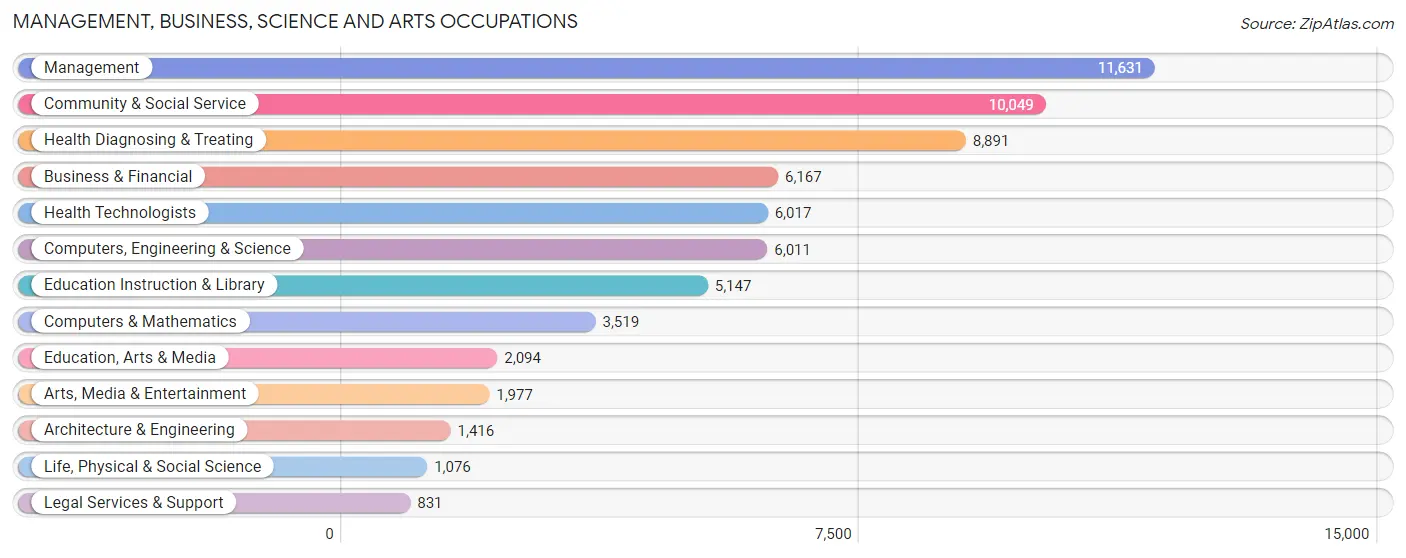
Management, Business, Science and Arts Occupations
The most common Management, Business, Science and Arts occupations in Minnehaha County are Management (11,631 | 10.5%), Community & Social Service (10,049 | 9.1%), Health Diagnosing & Treating (8,891 | 8.0%), Business & Financial (6,167 | 5.6%), and Health Technologists (6,017 | 5.4%).
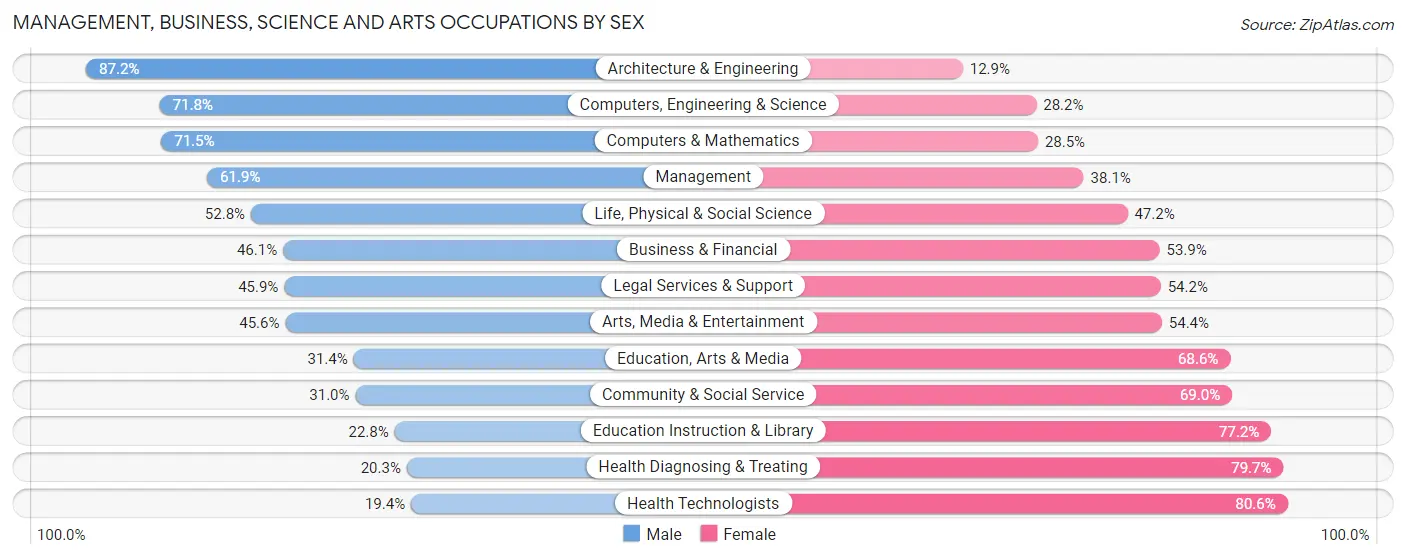
Management, Business, Science and Arts Occupations by Sex
Within the Management, Business, Science and Arts occupations in Minnehaha County, the most male-oriented occupations are Architecture & Engineering (87.2%), Computers, Engineering & Science (71.8%), and Computers & Mathematics (71.5%), while the most female-oriented occupations are Health Technologists (80.6%), Health Diagnosing & Treating (79.7%), and Education Instruction & Library (77.2%).
| Occupation | Male | Female |
| Management | 7,203 (61.9%) | 4,428 (38.1%) |
| Business & Financial | 2,843 (46.1%) | 3,324 (53.9%) |
| Computers, Engineering & Science | 4,317 (71.8%) | 1,694 (28.2%) |
| Computers & Mathematics | 2,515 (71.5%) | 1,004 (28.5%) |
| Architecture & Engineering | 1,234 (87.2%) | 182 (12.9%) |
| Life, Physical & Social Science | 568 (52.8%) | 508 (47.2%) |
| Community & Social Service | 3,115 (31.0%) | 6,934 (69.0%) |
| Education, Arts & Media | 657 (31.4%) | 1,437 (68.6%) |
| Legal Services & Support | 381 (45.9%) | 450 (54.1%) |
| Education Instruction & Library | 1,175 (22.8%) | 3,972 (77.2%) |
| Arts, Media & Entertainment | 902 (45.6%) | 1,075 (54.4%) |
| Health Diagnosing & Treating | 1,804 (20.3%) | 7,087 (79.7%) |
| Health Technologists | 1,167 (19.4%) | 4,850 (80.6%) |
| Total (Category) | 19,282 (45.1%) | 23,467 (54.9%) |
| Total (Overall) | 58,385 (52.8%) | 52,250 (47.2%) |
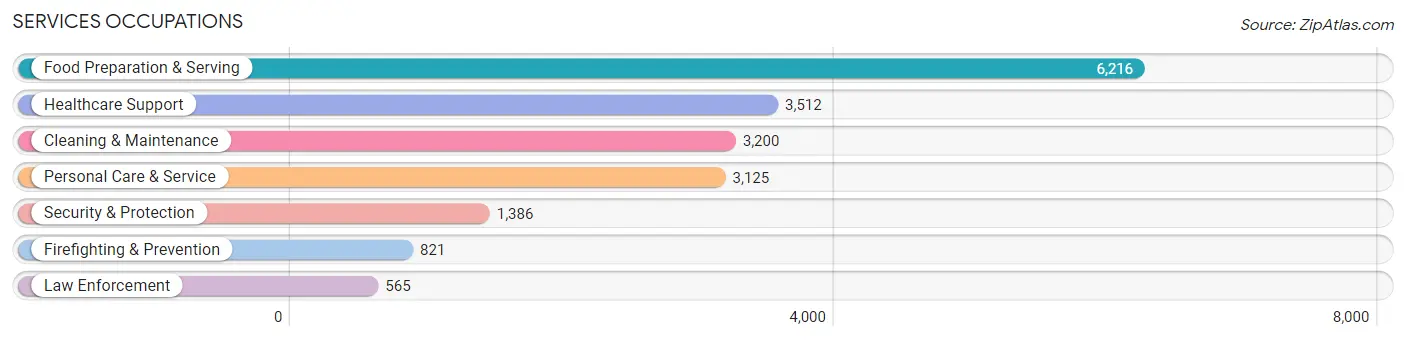
Services Occupations
The most common Services occupations in Minnehaha County are Food Preparation & Serving (6,216 | 5.6%), Healthcare Support (3,512 | 3.2%), Cleaning & Maintenance (3,200 | 2.9%), Personal Care & Service (3,125 | 2.8%), and Security & Protection (1,386 | 1.3%).
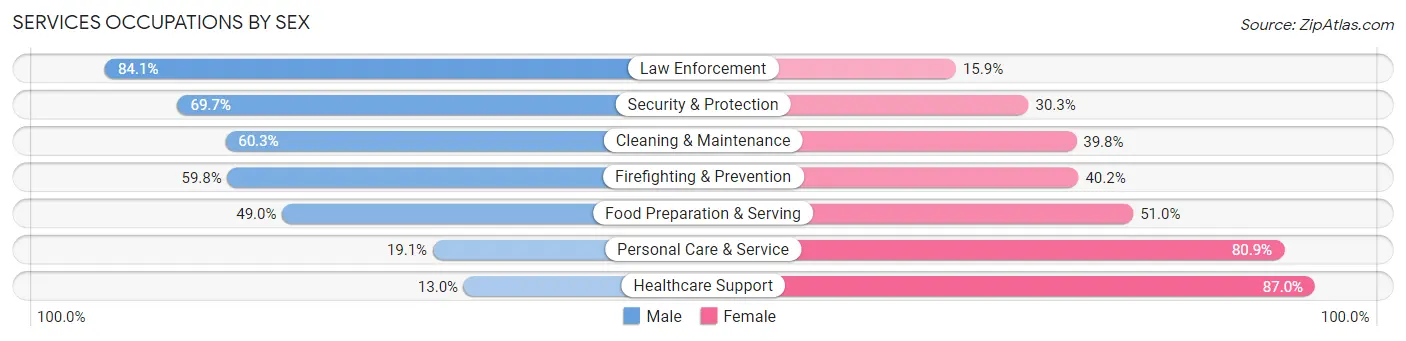
Services Occupations by Sex
Within the Services occupations in Minnehaha County, the most male-oriented occupations are Law Enforcement (84.1%), Security & Protection (69.7%), and Cleaning & Maintenance (60.3%), while the most female-oriented occupations are Healthcare Support (87.0%), Personal Care & Service (80.9%), and Food Preparation & Serving (51.0%).
| Occupation | Male | Female |
| Healthcare Support | 457 (13.0%) | 3,055 (87.0%) |
| Security & Protection | 966 (69.7%) | 420 (30.3%) |
| Firefighting & Prevention | 491 (59.8%) | 330 (40.2%) |
| Law Enforcement | 475 (84.1%) | 90 (15.9%) |
| Food Preparation & Serving | 3,044 (49.0%) | 3,172 (51.0%) |
| Cleaning & Maintenance | 1,928 (60.3%) | 1,272 (39.8%) |
| Personal Care & Service | 598 (19.1%) | 2,527 (80.9%) |
| Total (Category) | 6,993 (40.1%) | 10,446 (59.9%) |
| Total (Overall) | 58,385 (52.8%) | 52,250 (47.2%) |
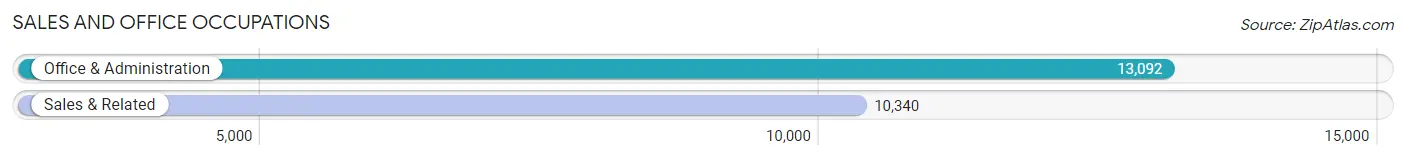
Sales and Office Occupations
The most common Sales and Office occupations in Minnehaha County are Office & Administration (13,092 | 11.8%), and Sales & Related (10,340 | 9.3%).
Sales and Office Occupations by Sex
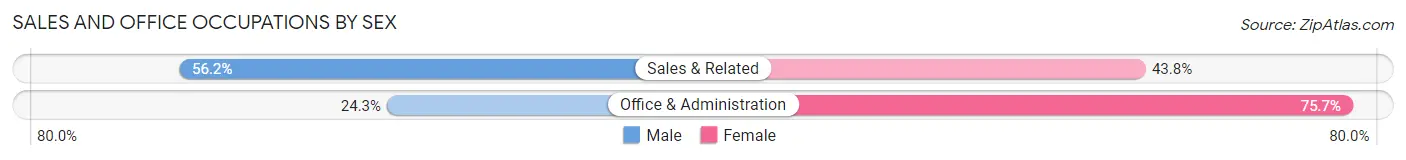
| Occupation | Male | Female |
| Sales & Related | 5,815 (56.2%) | 4,525 (43.8%) |
| Office & Administration | 3,178 (24.3%) | 9,914 (75.7%) |
| Total (Category) | 8,993 (38.4%) | 14,439 (61.6%) |
| Total (Overall) | 58,385 (52.8%) | 52,250 (47.2%) |
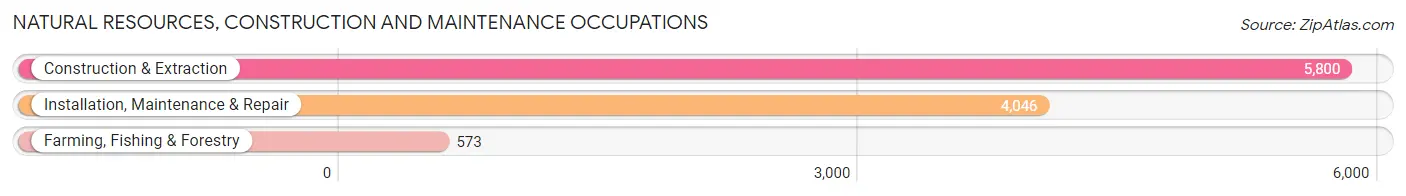
Natural Resources, Construction and Maintenance Occupations
The most common Natural Resources, Construction and Maintenance occupations in Minnehaha County are Construction & Extraction (5,800 | 5.2%), Installation, Maintenance & Repair (4,046 | 3.7%), and Farming, Fishing & Forestry (573 | 0.5%).
Natural Resources, Construction and Maintenance Occupations by Sex
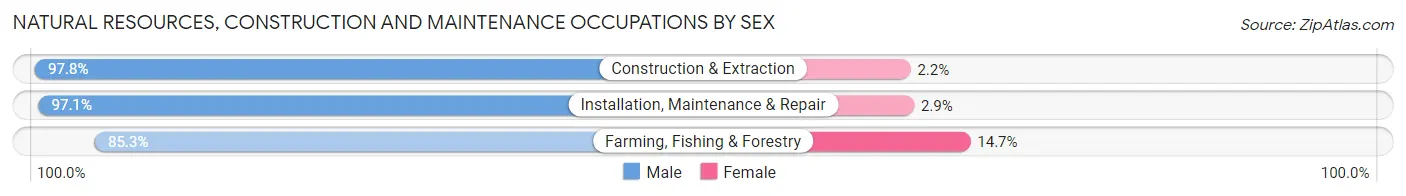
| Occupation | Male | Female |
| Farming, Fishing & Forestry | 489 (85.3%) | 84 (14.7%) |
| Construction & Extraction | 5,673 (97.8%) | 127 (2.2%) |
| Installation, Maintenance & Repair | 3,928 (97.1%) | 118 (2.9%) |
| Total (Category) | 10,090 (96.8%) | 329 (3.2%) |
| Total (Overall) | 58,385 (52.8%) | 52,250 (47.2%) |
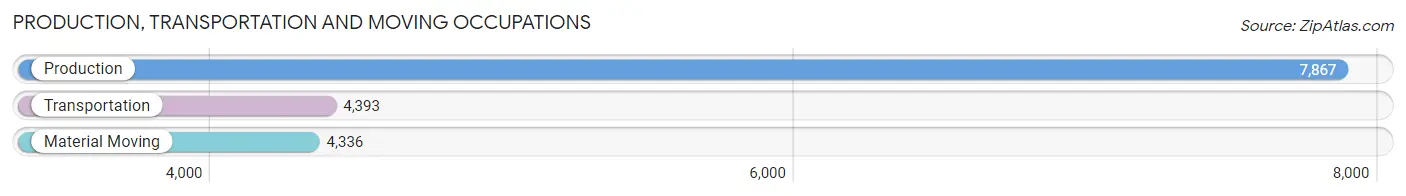
Production, Transportation and Moving Occupations
The most common Production, Transportation and Moving occupations in Minnehaha County are Production (7,867 | 7.1%), Transportation (4,393 | 4.0%), and Material Moving (4,336 | 3.9%).
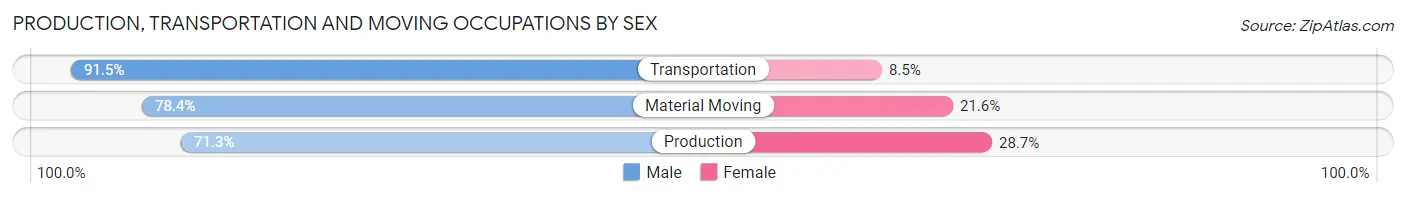
Production, Transportation and Moving Occupations by Sex
| Occupation | Male | Female |
| Production | 5,608 (71.3%) | 2,259 (28.7%) |
| Transportation | 4,018 (91.5%) | 375 (8.5%) |
| Material Moving | 3,401 (78.4%) | 935 (21.6%) |
| Total (Category) | 13,027 (78.5%) | 3,569 (21.5%) |
| Total (Overall) | 58,385 (52.8%) | 52,250 (47.2%) |
Employment Industries by Sex in Minnehaha County
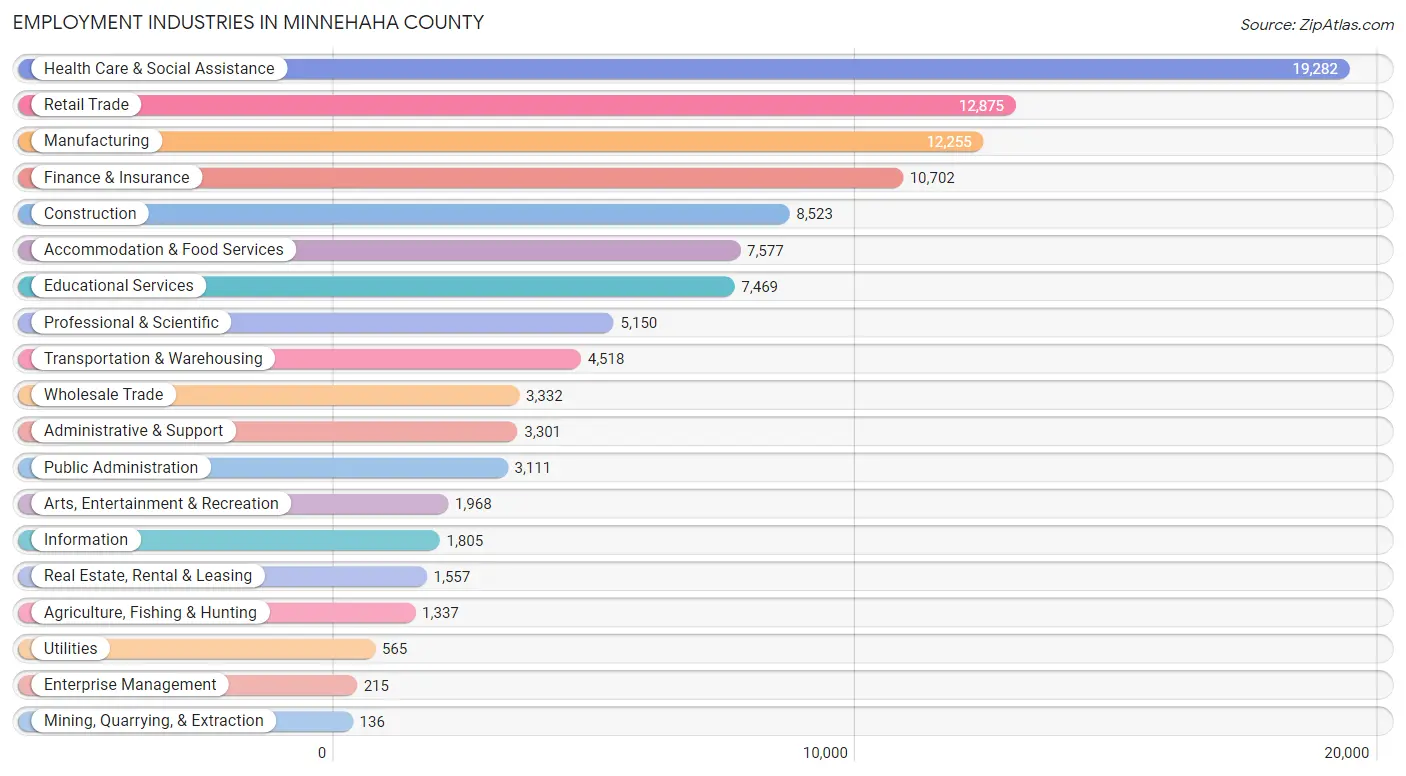
Employment Industries in Minnehaha County
The major employment industries in Minnehaha County include Health Care & Social Assistance (19,282 | 17.4%), Retail Trade (12,875 | 11.6%), Manufacturing (12,255 | 11.1%), Finance & Insurance (10,702 | 9.7%), and Construction (8,523 | 7.7%).
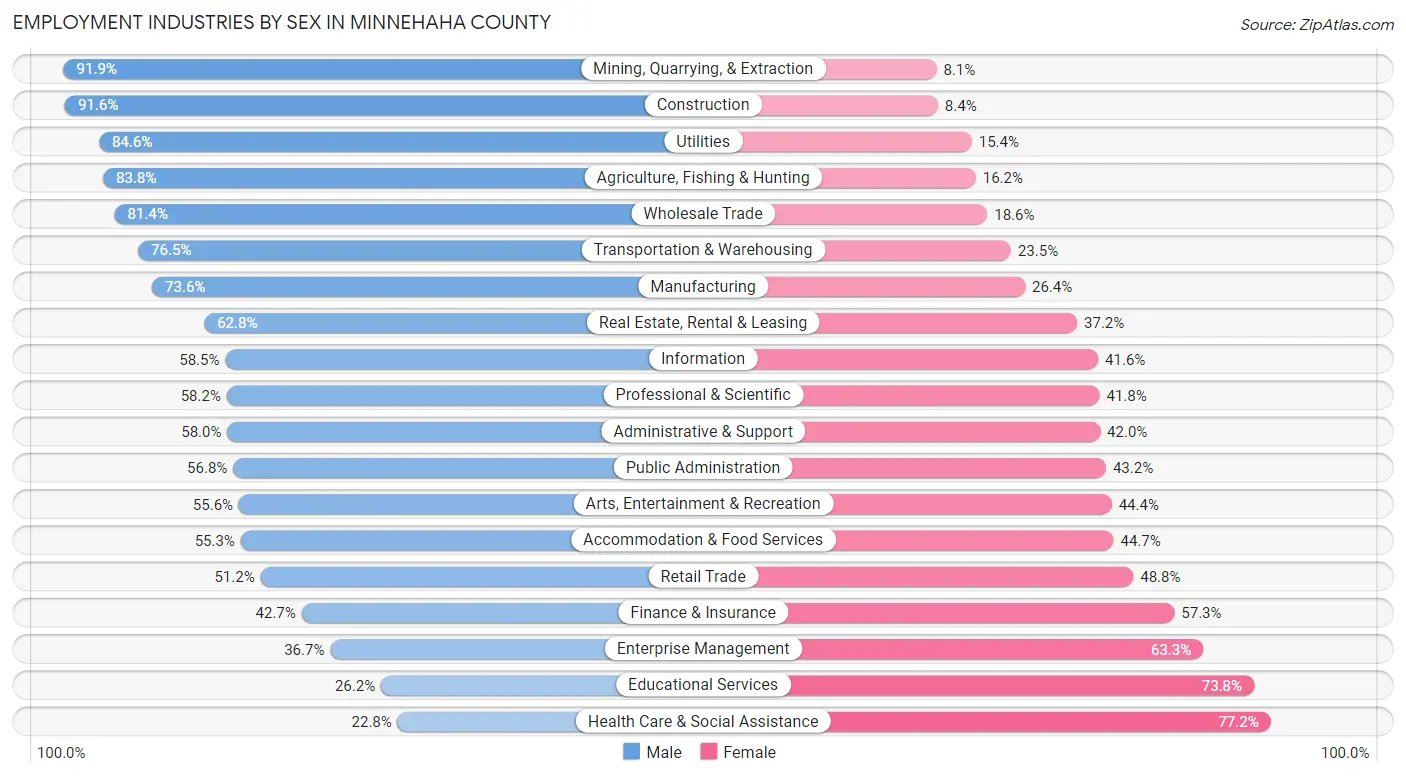
Employment Industries by Sex in Minnehaha County
The Minnehaha County industries that see more men than women are Mining, Quarrying, & Extraction (91.9%), Construction (91.6%), and Utilities (84.6%), whereas the industries that tend to have a higher number of women are Health Care & Social Assistance (77.2%), Educational Services (73.8%), and Enterprise Management (63.3%).
| Industry | Male | Female |
| Agriculture, Fishing & Hunting | 1,120 (83.8%) | 217 (16.2%) |
| Mining, Quarrying, & Extraction | 125 (91.9%) | 11 (8.1%) |
| Construction | 7,809 (91.6%) | 714 (8.4%) |
| Manufacturing | 9,019 (73.6%) | 3,236 (26.4%) |
| Wholesale Trade | 2,712 (81.4%) | 620 (18.6%) |
| Retail Trade | 6,589 (51.2%) | 6,286 (48.8%) |
| Transportation & Warehousing | 3,456 (76.5%) | 1,062 (23.5%) |
| Utilities | 478 (84.6%) | 87 (15.4%) |
| Information | 1,055 (58.5%) | 750 (41.5%) |
| Finance & Insurance | 4,568 (42.7%) | 6,134 (57.3%) |
| Real Estate, Rental & Leasing | 978 (62.8%) | 579 (37.2%) |
| Professional & Scientific | 2,995 (58.2%) | 2,155 (41.8%) |
| Enterprise Management | 79 (36.7%) | 136 (63.3%) |
| Administrative & Support | 1,916 (58.0%) | 1,385 (42.0%) |
| Educational Services | 1,959 (26.2%) | 5,510 (73.8%) |
| Health Care & Social Assistance | 4,395 (22.8%) | 14,887 (77.2%) |
| Arts, Entertainment & Recreation | 1,095 (55.6%) | 873 (44.4%) |
| Accommodation & Food Services | 4,188 (55.3%) | 3,389 (44.7%) |
| Public Administration | 1,768 (56.8%) | 1,343 (43.2%) |
| Total | 58,385 (52.8%) | 52,250 (47.2%) |
Education in Minnehaha County
School Enrollment in Minnehaha County
The most common levels of schooling among the 47,965 students in Minnehaha County are elementary school (11,150 | 23.3%), middle school (10,782 | 22.5%), and high school (9,752 | 20.3%).
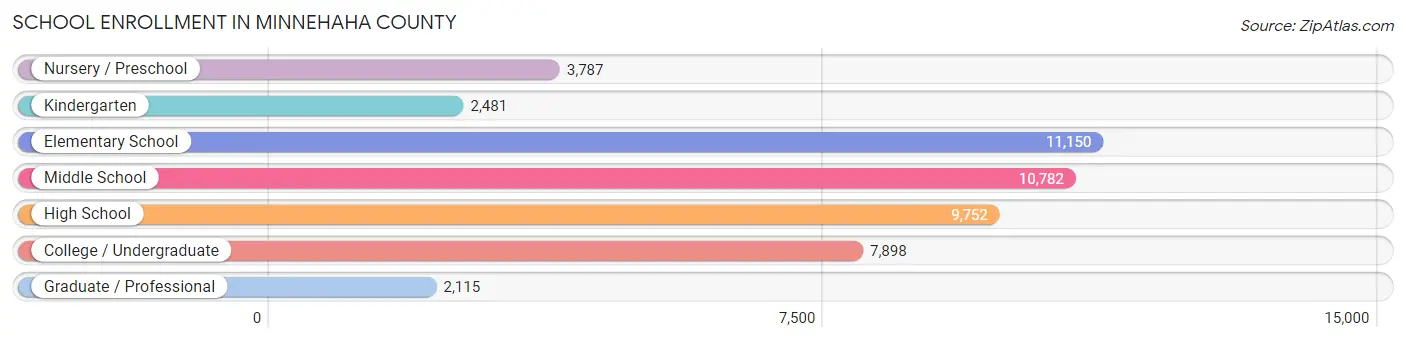
| School Level | # Students | % Students |
| Nursery / Preschool | 3,787 | 7.9% |
| Kindergarten | 2,481 | 5.2% |
| Elementary School | 11,150 | 23.3% |
| Middle School | 10,782 | 22.5% |
| High School | 9,752 | 20.3% |
| College / Undergraduate | 7,898 | 16.5% |
| Graduate / Professional | 2,115 | 4.4% |
| Total | 47,965 | 100.0% |
School Enrollment by Age by Funding Source in Minnehaha County
Out of a total of 47,965 students who are enrolled in schools in Minnehaha County, 9,017 (18.8%) attend a private institution, while the remaining 38,948 (81.2%) are enrolled in public schools. The age group of 3 to 4 year olds has the highest likelihood of being enrolled in private schools, with 882 (38.7% in the age bracket) enrolled. Conversely, the age group of 15 to 17 year olds has the lowest likelihood of being enrolled in a private school, with 6,641 (88.5% in the age bracket) attending a public institution.
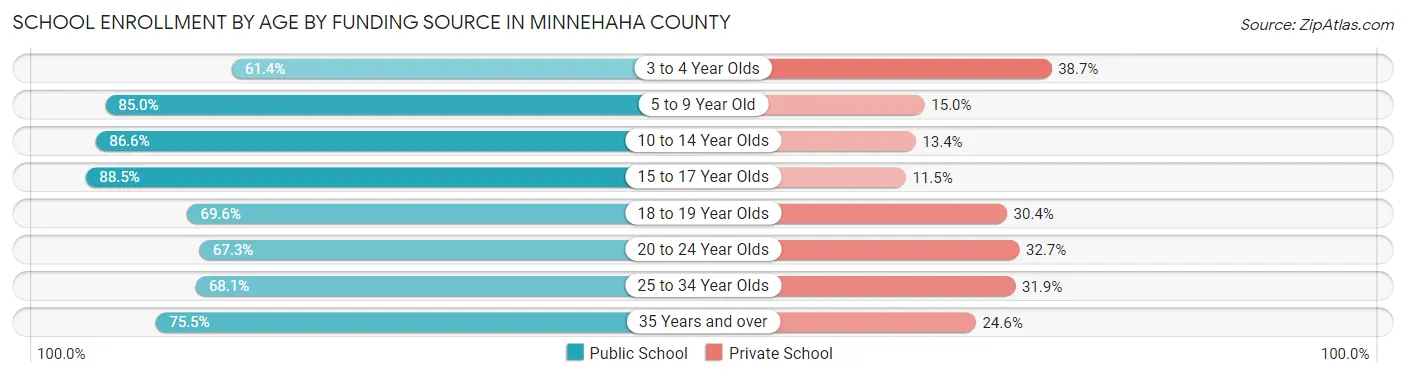
| Age Bracket | Public School | Private School |
| 3 to 4 Year Olds | 1,400 (61.4%) | 882 (38.7%) |
| 5 to 9 Year Old | 11,150 (85.0%) | 1,973 (15.0%) |
| 10 to 14 Year Olds | 11,696 (86.6%) | 1,803 (13.4%) |
| 15 to 17 Year Olds | 6,641 (88.5%) | 865 (11.5%) |
| 18 to 19 Year Olds | 2,291 (69.6%) | 999 (30.4%) |
| 20 to 24 Year Olds | 2,689 (67.3%) | 1,304 (32.7%) |
| 25 to 34 Year Olds | 1,508 (68.1%) | 707 (31.9%) |
| 35 Years and over | 1,552 (75.4%) | 505 (24.5%) |
| Total | 38,948 (81.2%) | 9,017 (18.8%) |
Educational Attainment by Field of Study in Minnehaha County
Business (10,536 | 21.3%), education (7,125 | 14.4%), science & technology (6,477 | 13.1%), social sciences (3,459 | 7.0%), and bio, nature & agricultural (3,422 | 6.9%) are the most common fields of study among 49,481 individuals in Minnehaha County who have obtained a bachelor's degree or higher.
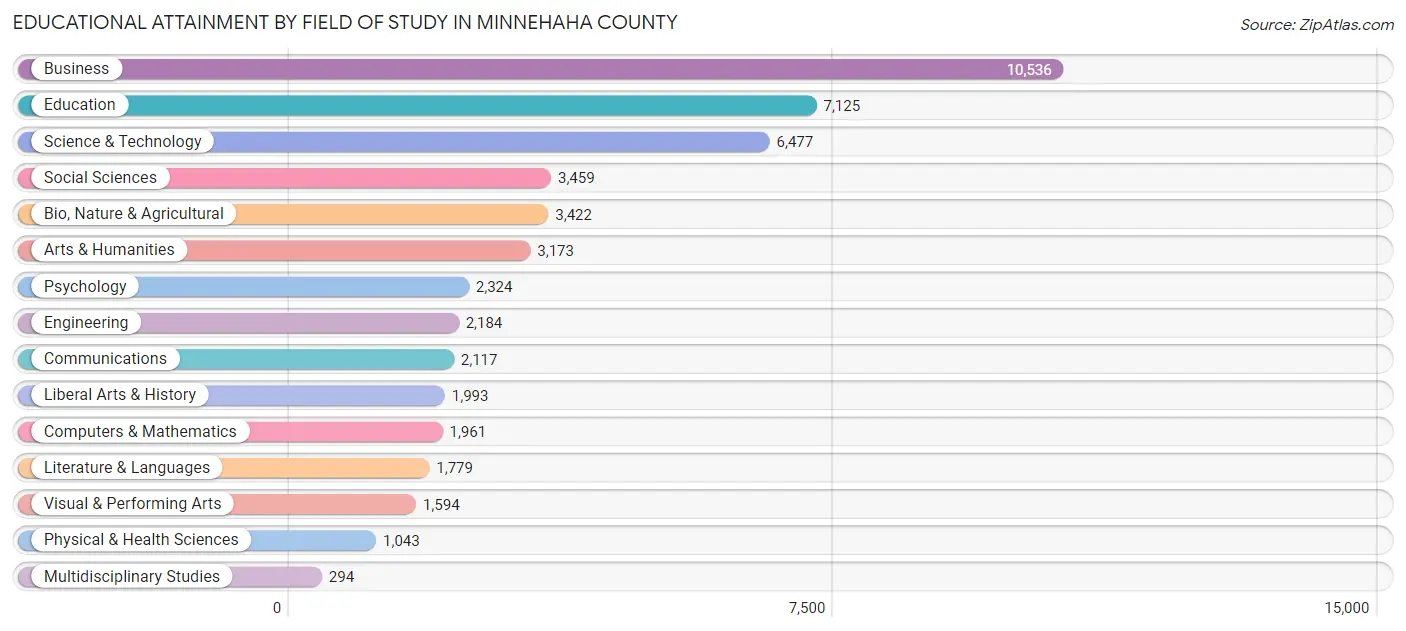
| Field of Study | # Graduates | % Graduates |
| Computers & Mathematics | 1,961 | 4.0% |
| Bio, Nature & Agricultural | 3,422 | 6.9% |
| Physical & Health Sciences | 1,043 | 2.1% |
| Psychology | 2,324 | 4.7% |
| Social Sciences | 3,459 | 7.0% |
| Engineering | 2,184 | 4.4% |
| Multidisciplinary Studies | 294 | 0.6% |
| Science & Technology | 6,477 | 13.1% |
| Business | 10,536 | 21.3% |
| Education | 7,125 | 14.4% |
| Literature & Languages | 1,779 | 3.6% |
| Liberal Arts & History | 1,993 | 4.0% |
| Visual & Performing Arts | 1,594 | 3.2% |
| Communications | 2,117 | 4.3% |
| Arts & Humanities | 3,173 | 6.4% |
| Total | 49,481 | 100.0% |
Transportation & Commute in Minnehaha County
Vehicle Availability by Sex in Minnehaha County
The most prevalent vehicle ownership categories in Minnehaha County are males with 2 vehicles (24,162, accounting for 42.6%) and females with 2 vehicles (20,739, making up 47.8%).
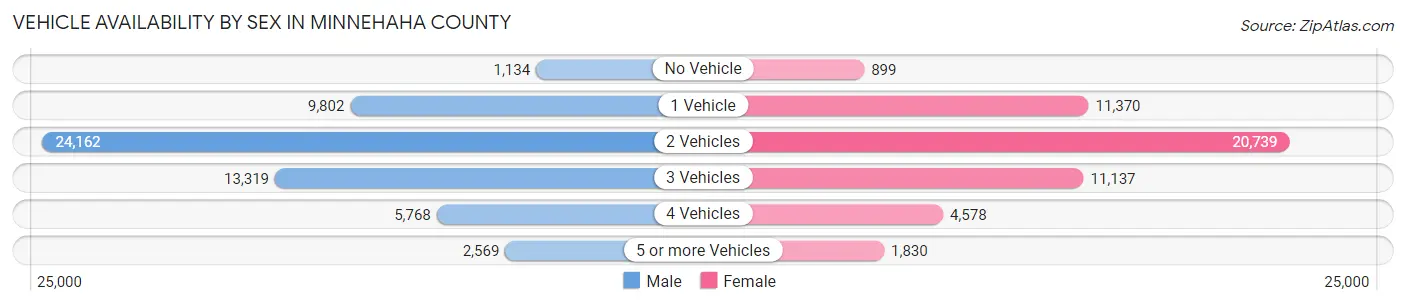
| Vehicles Available | Male | Female |
| No Vehicle | 1,134 (2.0%) | 899 (1.8%) |
| 1 Vehicle | 9,802 (17.3%) | 11,370 (22.5%) |
| 2 Vehicles | 24,162 (42.6%) | 20,739 (41.0%) |
| 3 Vehicles | 13,319 (23.5%) | 11,137 (22.0%) |
| 4 Vehicles | 5,768 (10.2%) | 4,578 (9.1%) |
| 5 or more Vehicles | 2,569 (4.5%) | 1,830 (3.6%) |
| Total | 56,754 (100.0%) | 50,553 (100.0%) |
Commute Time in Minnehaha County
The most frequently occuring commute durations in Minnehaha County are 15 to 19 minutes (25,455 commuters, 25.6%), 10 to 14 minutes (21,730 commuters, 21.8%), and 20 to 24 minutes (17,668 commuters, 17.7%).
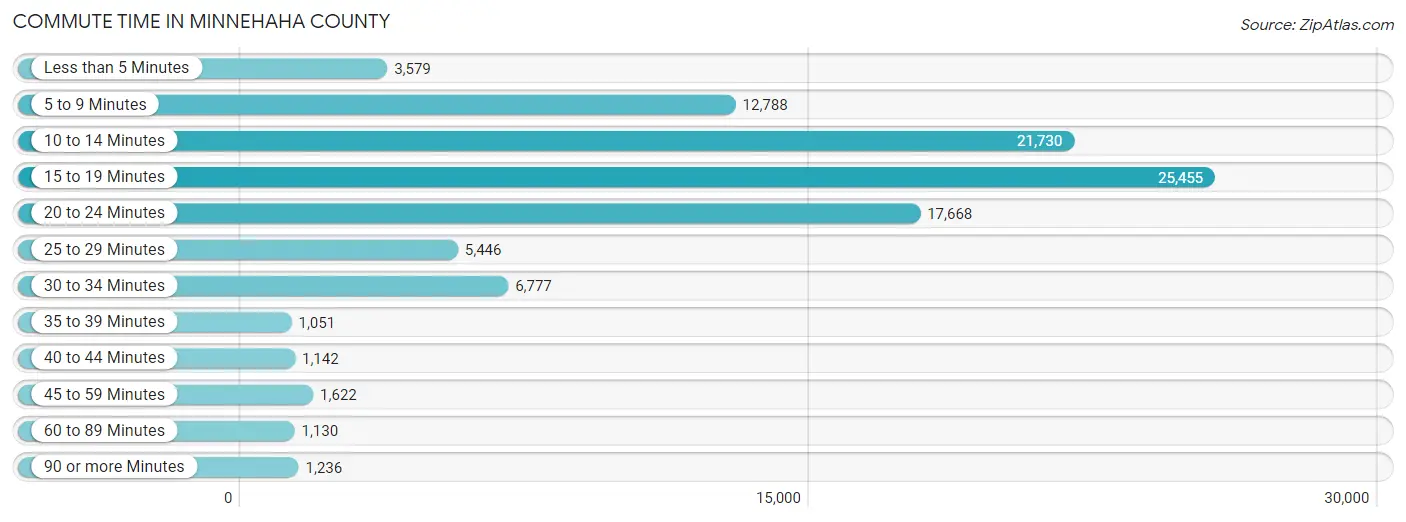
| Commute Time | # Commuters | % Commuters |
| Less than 5 Minutes | 3,579 | 3.6% |
| 5 to 9 Minutes | 12,788 | 12.8% |
| 10 to 14 Minutes | 21,730 | 21.8% |
| 15 to 19 Minutes | 25,455 | 25.6% |
| 20 to 24 Minutes | 17,668 | 17.7% |
| 25 to 29 Minutes | 5,446 | 5.5% |
| 30 to 34 Minutes | 6,777 | 6.8% |
| 35 to 39 Minutes | 1,051 | 1.1% |
| 40 to 44 Minutes | 1,142 | 1.1% |
| 45 to 59 Minutes | 1,622 | 1.6% |
| 60 to 89 Minutes | 1,130 | 1.1% |
| 90 or more Minutes | 1,236 | 1.2% |
Commute Time by Sex in Minnehaha County
The most common commute times in Minnehaha County are 15 to 19 minutes (14,074 commuters, 26.2%) for males and 15 to 19 minutes (11,381 commuters, 24.8%) for females.
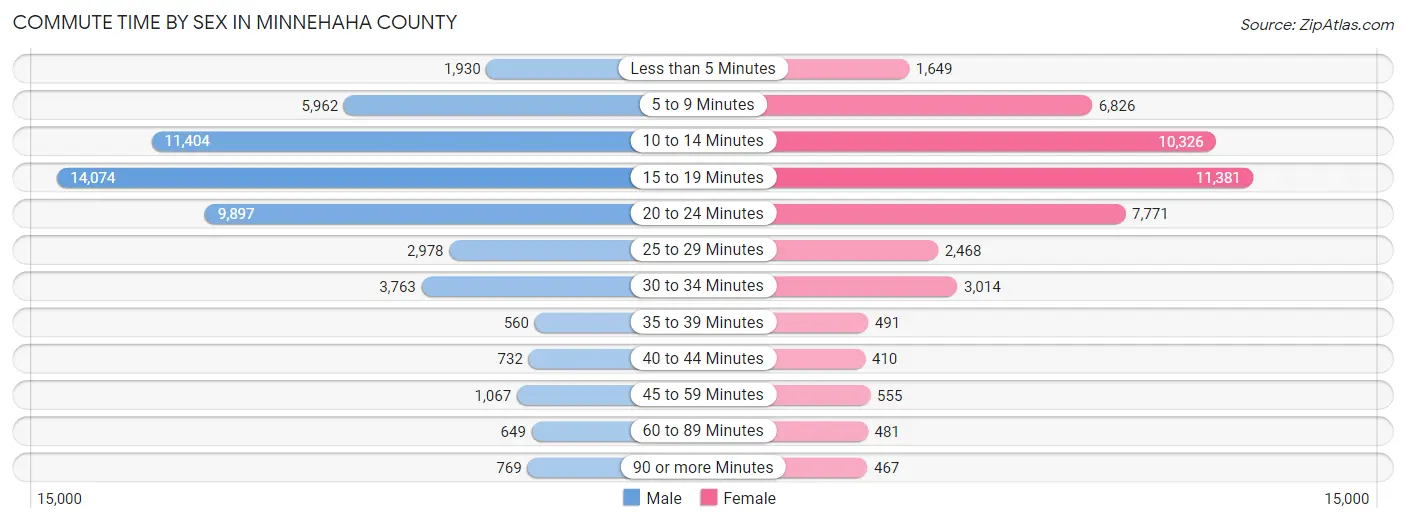
| Commute Time | Male | Female |
| Less than 5 Minutes | 1,930 (3.6%) | 1,649 (3.6%) |
| 5 to 9 Minutes | 5,962 (11.1%) | 6,826 (14.9%) |
| 10 to 14 Minutes | 11,404 (21.2%) | 10,326 (22.5%) |
| 15 to 19 Minutes | 14,074 (26.2%) | 11,381 (24.8%) |
| 20 to 24 Minutes | 9,897 (18.4%) | 7,771 (17.0%) |
| 25 to 29 Minutes | 2,978 (5.5%) | 2,468 (5.4%) |
| 30 to 34 Minutes | 3,763 (7.0%) | 3,014 (6.6%) |
| 35 to 39 Minutes | 560 (1.0%) | 491 (1.1%) |
| 40 to 44 Minutes | 732 (1.4%) | 410 (0.9%) |
| 45 to 59 Minutes | 1,067 (2.0%) | 555 (1.2%) |
| 60 to 89 Minutes | 649 (1.2%) | 481 (1.1%) |
| 90 or more Minutes | 769 (1.4%) | 467 (1.0%) |
Time of Departure to Work by Sex in Minnehaha County
The most frequent times of departure to work in Minnehaha County are 7:30 AM to 7:59 AM (10,010, 18.6%) for males and 7:30 AM to 7:59 AM (10,021, 21.9%) for females.
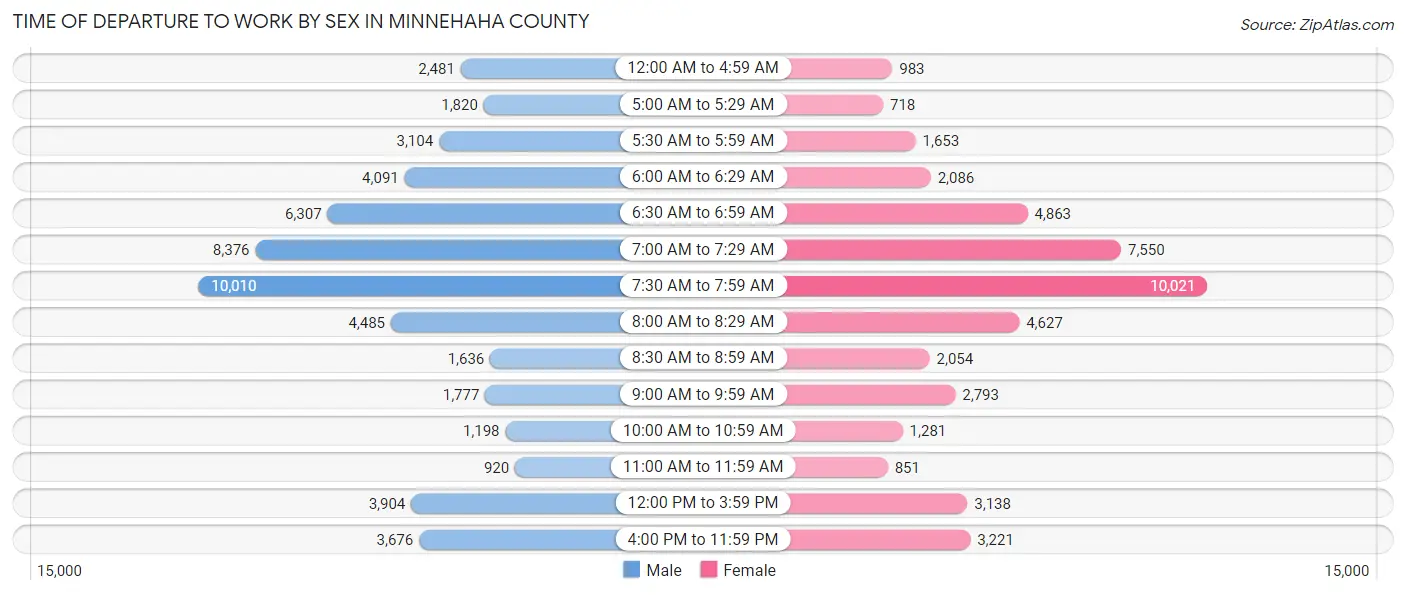
| Time of Departure | Male | Female |
| 12:00 AM to 4:59 AM | 2,481 (4.6%) | 983 (2.1%) |
| 5:00 AM to 5:29 AM | 1,820 (3.4%) | 718 (1.6%) |
| 5:30 AM to 5:59 AM | 3,104 (5.8%) | 1,653 (3.6%) |
| 6:00 AM to 6:29 AM | 4,091 (7.6%) | 2,086 (4.5%) |
| 6:30 AM to 6:59 AM | 6,307 (11.7%) | 4,863 (10.6%) |
| 7:00 AM to 7:29 AM | 8,376 (15.6%) | 7,550 (16.5%) |
| 7:30 AM to 7:59 AM | 10,010 (18.6%) | 10,021 (21.9%) |
| 8:00 AM to 8:29 AM | 4,485 (8.3%) | 4,627 (10.1%) |
| 8:30 AM to 8:59 AM | 1,636 (3.0%) | 2,054 (4.5%) |
| 9:00 AM to 9:59 AM | 1,777 (3.3%) | 2,793 (6.1%) |
| 10:00 AM to 10:59 AM | 1,198 (2.2%) | 1,281 (2.8%) |
| 11:00 AM to 11:59 AM | 920 (1.7%) | 851 (1.9%) |
| 12:00 PM to 3:59 PM | 3,904 (7.3%) | 3,138 (6.9%) |
| 4:00 PM to 11:59 PM | 3,676 (6.8%) | 3,221 (7.0%) |
| Total | 53,785 (100.0%) | 45,839 (100.0%) |
Housing Occupancy in Minnehaha County
Occupancy by Ownership in Minnehaha County
Of the total 79,887 dwellings in Minnehaha County, owner-occupied units account for 50,674 (63.4%), while renter-occupied units make up 29,213 (36.6%).
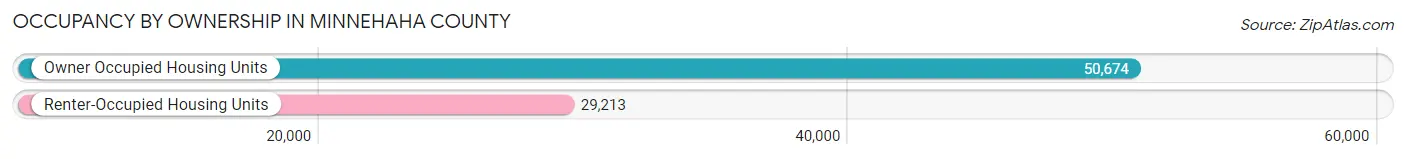
| Occupancy | # Housing Units | % Housing Units |
| Owner Occupied Housing Units | 50,674 | 63.4% |
| Renter-Occupied Housing Units | 29,213 | 36.6% |
| Total Occupied Housing Units | 79,887 | 100.0% |
Occupancy by Household Size in Minnehaha County
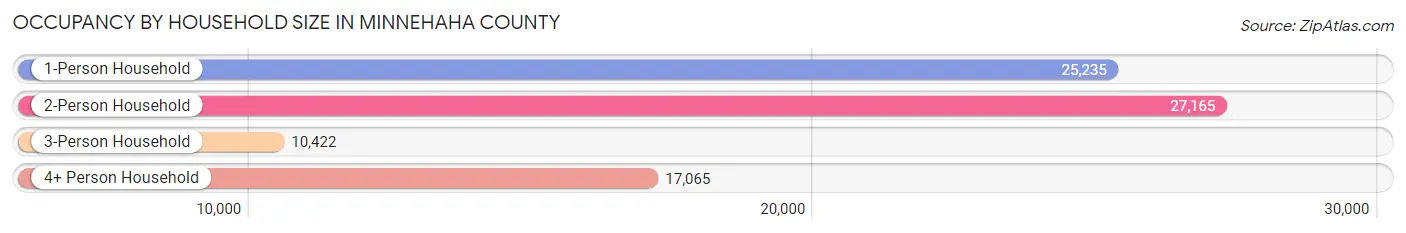
| Household Size | # Housing Units | % Housing Units |
| 1-Person Household | 25,235 | 31.6% |
| 2-Person Household | 27,165 | 34.0% |
| 3-Person Household | 10,422 | 13.1% |
| 4+ Person Household | 17,065 | 21.4% |
| Total Housing Units | 79,887 | 100.0% |
Occupancy by Ownership by Household Size in Minnehaha County
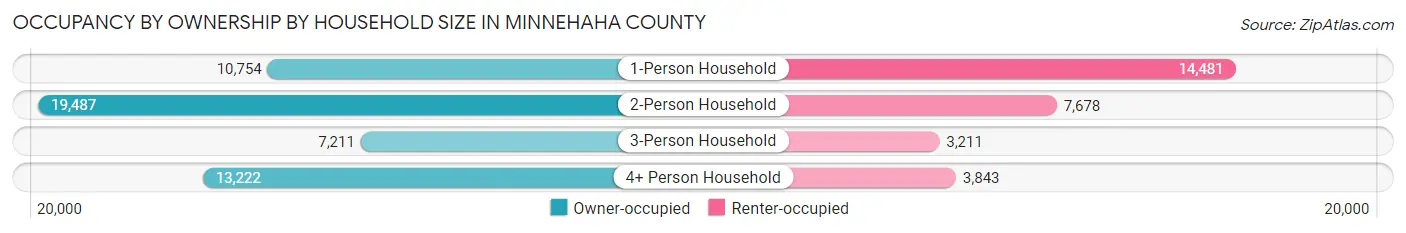
| Household Size | Owner-occupied | Renter-occupied |
| 1-Person Household | 10,754 (42.6%) | 14,481 (57.4%) |
| 2-Person Household | 19,487 (71.7%) | 7,678 (28.3%) |
| 3-Person Household | 7,211 (69.2%) | 3,211 (30.8%) |
| 4+ Person Household | 13,222 (77.5%) | 3,843 (22.5%) |
| Total Housing Units | 50,674 (63.4%) | 29,213 (36.6%) |
Occupancy by Educational Attainment in Minnehaha County
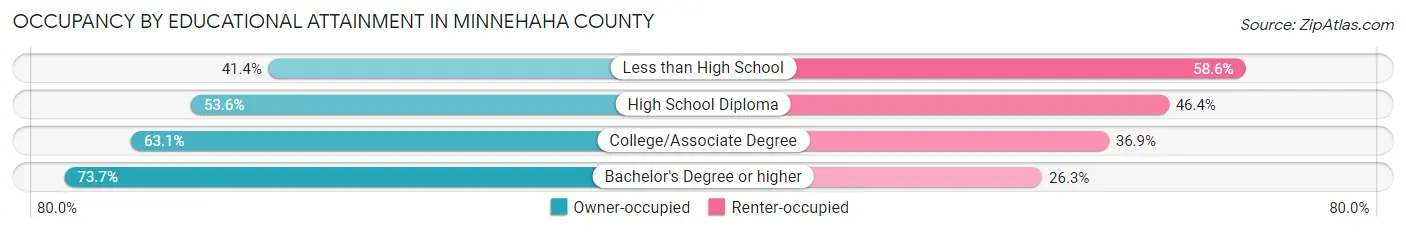
| Household Size | Owner-occupied | Renter-occupied |
| Less than High School | 1,807 (41.4%) | 2,553 (58.6%) |
| High School Diploma | 10,293 (53.6%) | 8,910 (46.4%) |
| College/Associate Degree | 17,441 (63.1%) | 10,196 (36.9%) |
| Bachelor's Degree or higher | 21,133 (73.7%) | 7,554 (26.3%) |
Occupancy by Age of Householder in Minnehaha County
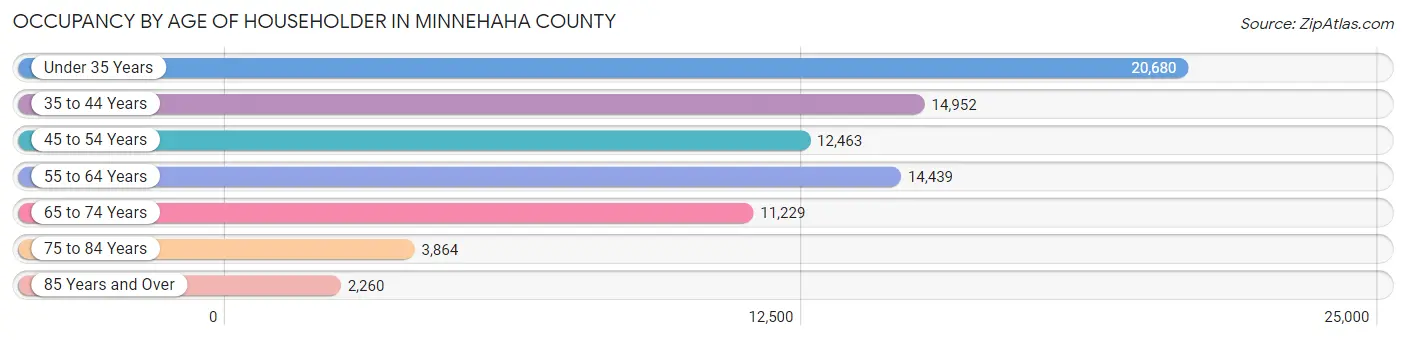
| Age Bracket | # Households | % Households |
| Under 35 Years | 20,680 | 25.9% |
| 35 to 44 Years | 14,952 | 18.7% |
| 45 to 54 Years | 12,463 | 15.6% |
| 55 to 64 Years | 14,439 | 18.1% |
| 65 to 74 Years | 11,229 | 14.1% |
| 75 to 84 Years | 3,864 | 4.8% |
| 85 Years and Over | 2,260 | 2.8% |
| Total | 79,887 | 100.0% |
Housing Finances in Minnehaha County
Median Income by Occupancy in Minnehaha County
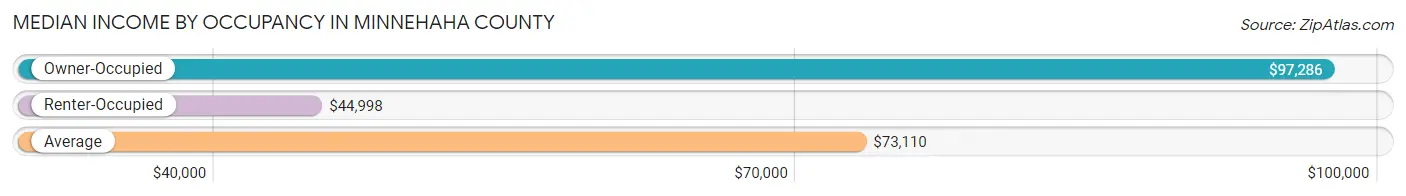
| Occupancy Type | # Households | Median Income |
| Owner-Occupied | 50,674 (63.4%) | $97,286 |
| Renter-Occupied | 29,213 (36.6%) | $44,998 |
| Average | 79,887 (100.0%) | $73,110 |
Occupancy by Householder Income Bracket in Minnehaha County
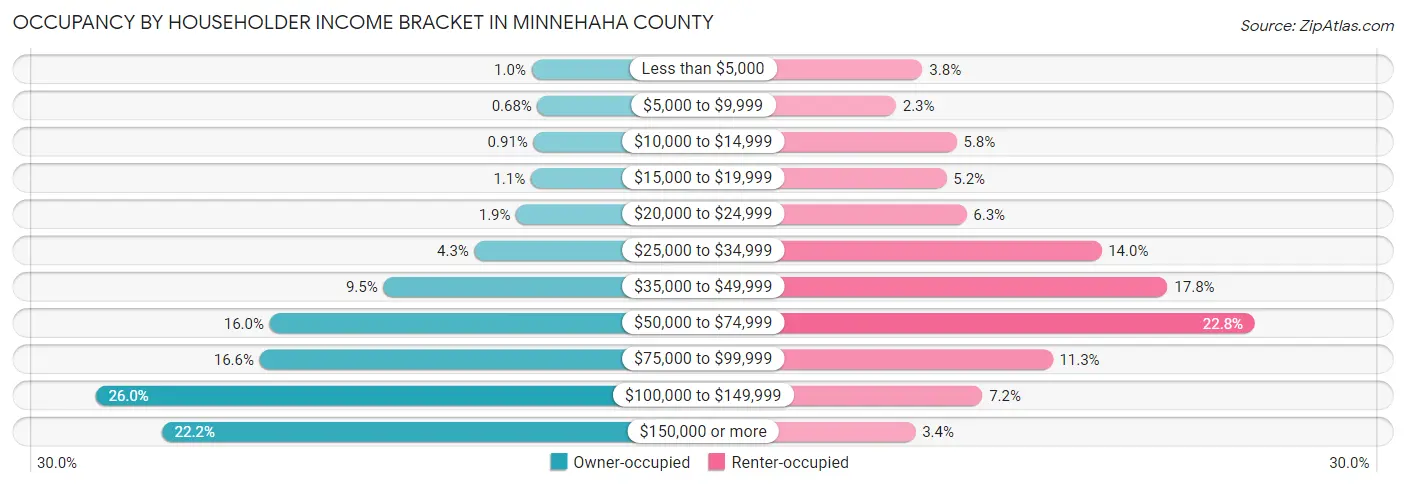
| Income Bracket | Owner-occupied | Renter-occupied |
| Less than $5,000 | 515 (1.0%) | 1,117 (3.8%) |
| $5,000 to $9,999 | 345 (0.7%) | 673 (2.3%) |
| $10,000 to $14,999 | 460 (0.9%) | 1,687 (5.8%) |
| $15,000 to $19,999 | 536 (1.1%) | 1,517 (5.2%) |
| $20,000 to $24,999 | 962 (1.9%) | 1,849 (6.3%) |
| $25,000 to $34,999 | 2,170 (4.3%) | 4,102 (14.0%) |
| $35,000 to $49,999 | 4,809 (9.5%) | 5,205 (17.8%) |
| $50,000 to $74,999 | 8,104 (16.0%) | 6,666 (22.8%) |
| $75,000 to $99,999 | 8,390 (16.6%) | 3,287 (11.3%) |
| $100,000 to $149,999 | 13,149 (26.0%) | 2,115 (7.2%) |
| $150,000 or more | 11,234 (22.2%) | 995 (3.4%) |
| Total | 50,674 (100.0%) | 29,213 (100.0%) |
Monthly Housing Cost Tiers in Minnehaha County
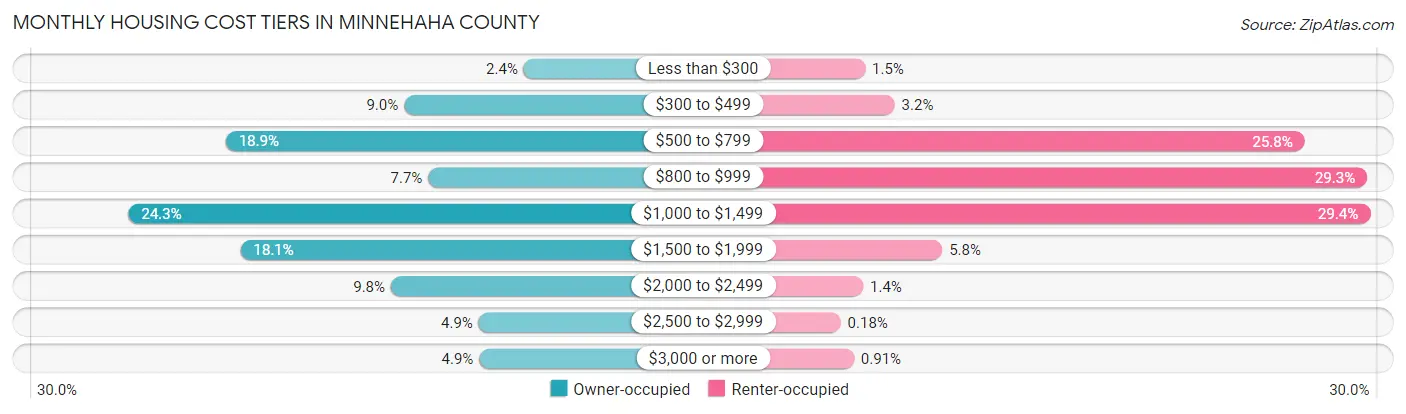
| Monthly Cost | Owner-occupied | Renter-occupied |
| Less than $300 | 1,233 (2.4%) | 447 (1.5%) |
| $300 to $499 | 4,580 (9.0%) | 922 (3.2%) |
| $500 to $799 | 9,572 (18.9%) | 7,538 (25.8%) |
| $800 to $999 | 3,906 (7.7%) | 8,544 (29.2%) |
| $1,000 to $1,499 | 12,300 (24.3%) | 8,595 (29.4%) |
| $1,500 to $1,999 | 9,162 (18.1%) | 1,691 (5.8%) |
| $2,000 to $2,499 | 4,951 (9.8%) | 415 (1.4%) |
| $2,500 to $2,999 | 2,491 (4.9%) | 52 (0.2%) |
| $3,000 or more | 2,479 (4.9%) | 265 (0.9%) |
| Total | 50,674 (100.0%) | 29,213 (100.0%) |
Physical Housing Characteristics in Minnehaha County
Housing Structures in Minnehaha County
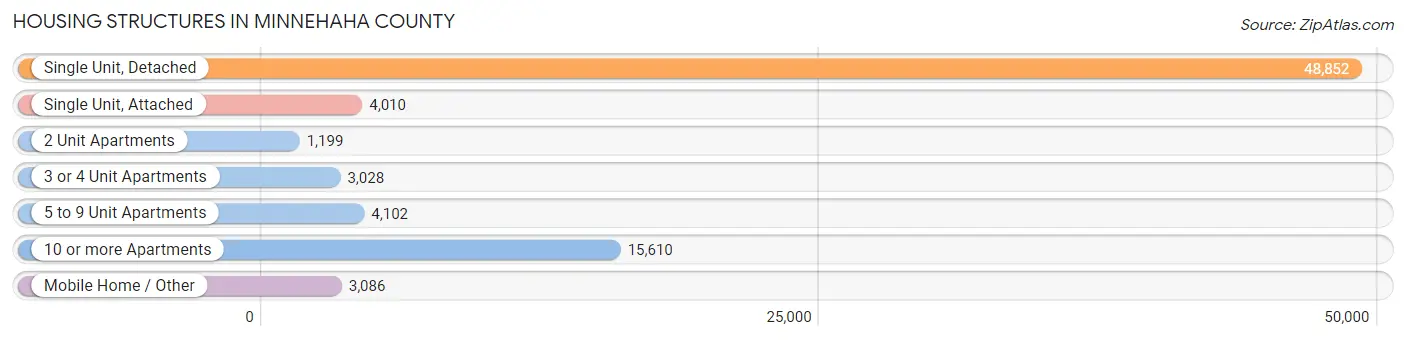
| Structure Type | # Housing Units | % Housing Units |
| Single Unit, Detached | 48,852 | 61.2% |
| Single Unit, Attached | 4,010 | 5.0% |
| 2 Unit Apartments | 1,199 | 1.5% |
| 3 or 4 Unit Apartments | 3,028 | 3.8% |
| 5 to 9 Unit Apartments | 4,102 | 5.1% |
| 10 or more Apartments | 15,610 | 19.5% |
| Mobile Home / Other | 3,086 | 3.9% |
| Total | 79,887 | 100.0% |
Housing Structures by Occupancy in Minnehaha County
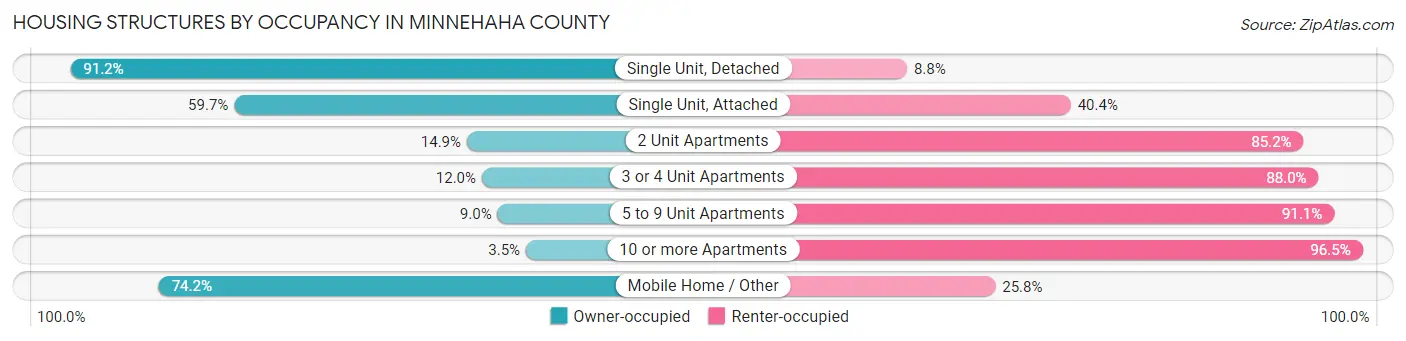
| Structure Type | Owner-occupied | Renter-occupied |
| Single Unit, Detached | 44,543 (91.2%) | 4,309 (8.8%) |
| Single Unit, Attached | 2,392 (59.7%) | 1,618 (40.4%) |
| 2 Unit Apartments | 178 (14.8%) | 1,021 (85.2%) |
| 3 or 4 Unit Apartments | 362 (12.0%) | 2,666 (88.0%) |
| 5 to 9 Unit Apartments | 367 (8.9%) | 3,735 (91.0%) |
| 10 or more Apartments | 543 (3.5%) | 15,067 (96.5%) |
| Mobile Home / Other | 2,289 (74.2%) | 797 (25.8%) |
| Total | 50,674 (63.4%) | 29,213 (36.6%) |
Housing Structures by Number of Rooms in Minnehaha County
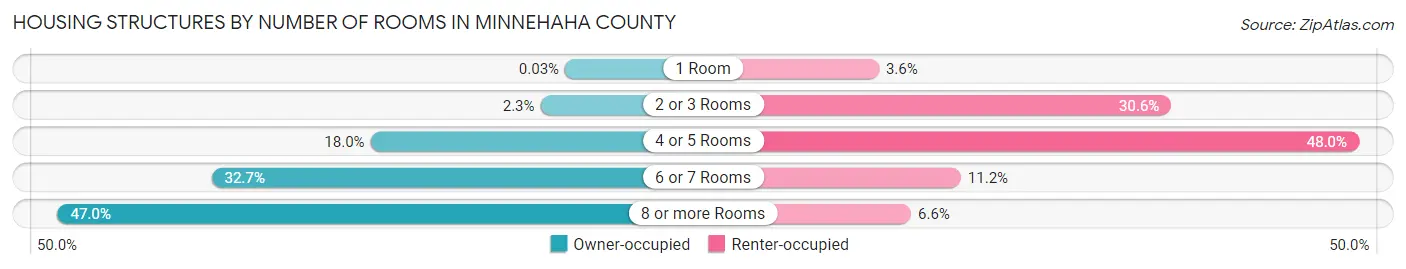
| Number of Rooms | Owner-occupied | Renter-occupied |
| 1 Room | 15 (0.0%) | 1,055 (3.6%) |
| 2 or 3 Rooms | 1,164 (2.3%) | 8,949 (30.6%) |
| 4 or 5 Rooms | 9,130 (18.0%) | 14,019 (48.0%) |
| 6 or 7 Rooms | 16,576 (32.7%) | 3,269 (11.2%) |
| 8 or more Rooms | 23,789 (46.9%) | 1,921 (6.6%) |
| Total | 50,674 (100.0%) | 29,213 (100.0%) |
Housing Structure by Heating Type in Minnehaha County
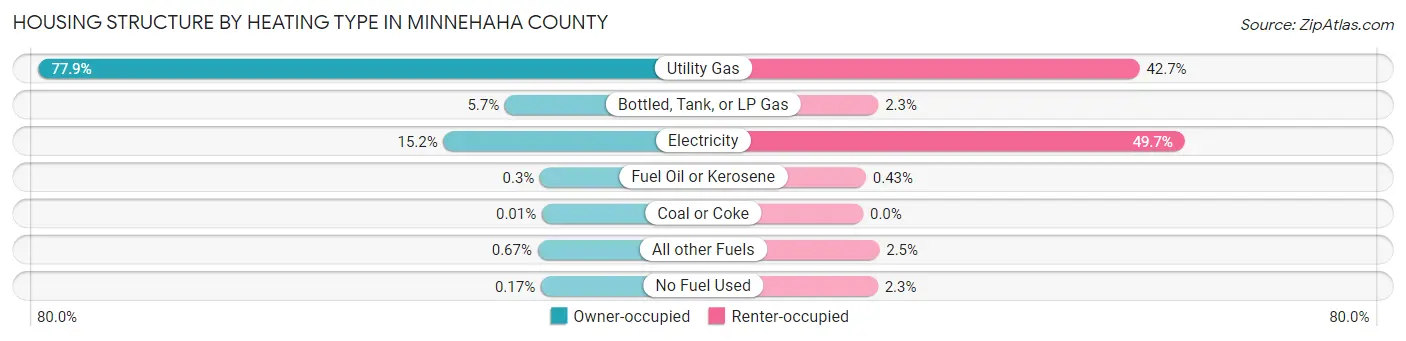
| Heating Type | Owner-occupied | Renter-occupied |
| Utility Gas | 39,461 (77.9%) | 12,482 (42.7%) |
| Bottled, Tank, or LP Gas | 2,906 (5.7%) | 685 (2.3%) |
| Electricity | 7,725 (15.2%) | 14,524 (49.7%) |
| Fuel Oil or Kerosene | 153 (0.3%) | 127 (0.4%) |
| Coal or Coke | 3 (0.0%) | 0 (0.0%) |
| All other Fuels | 338 (0.7%) | 732 (2.5%) |
| No Fuel Used | 88 (0.2%) | 663 (2.3%) |
| Total | 50,674 (100.0%) | 29,213 (100.0%) |
Household Vehicle Usage in Minnehaha County
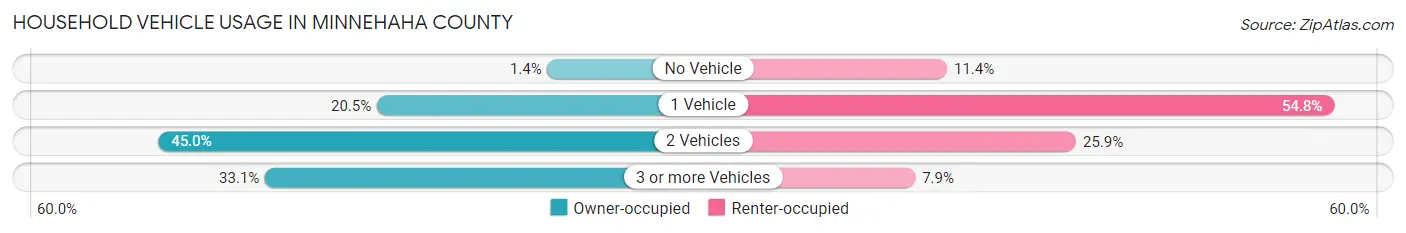
| Vehicles per Household | Owner-occupied | Renter-occupied |
| No Vehicle | 719 (1.4%) | 3,342 (11.4%) |
| 1 Vehicle | 10,395 (20.5%) | 16,010 (54.8%) |
| 2 Vehicles | 22,814 (45.0%) | 7,562 (25.9%) |
| 3 or more Vehicles | 16,746 (33.1%) | 2,299 (7.9%) |
| Total | 50,674 (100.0%) | 29,213 (100.0%) |
Real Estate & Mortgages in Minnehaha County
Real Estate and Mortgage Overview in Minnehaha County
| Characteristic | Without Mortgage | With Mortgage |
| Housing Units | 17,560 | 33,114 |
| Median Property Value | $233,900 | $252,600 |
| Median Household Income | $76,377 | $8,285 |
| Monthly Housing Costs | $586 | $2,475 |
| Real Estate Taxes | $2,848 | $522 |
Property Value by Mortgage Status in Minnehaha County
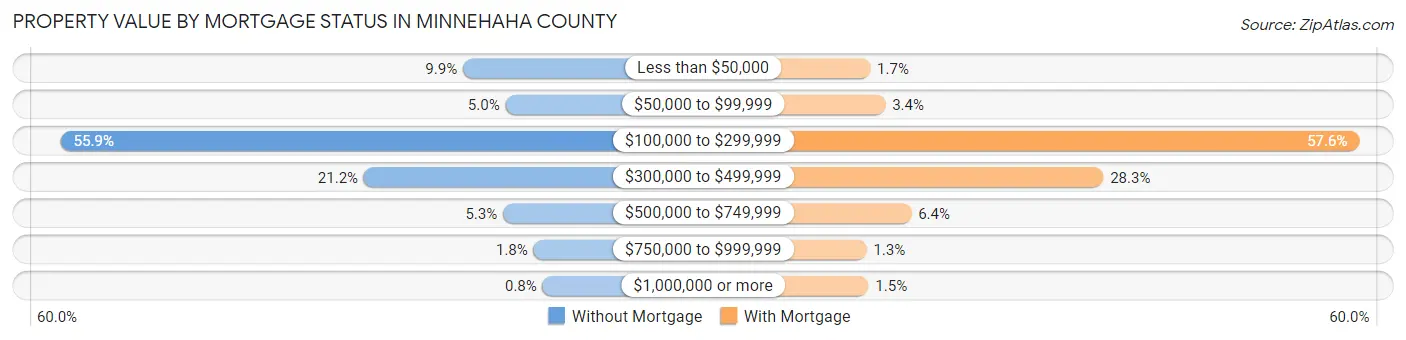
| Property Value | Without Mortgage | With Mortgage |
| Less than $50,000 | 1,739 (9.9%) | 553 (1.7%) |
| $50,000 to $99,999 | 885 (5.0%) | 1,121 (3.4%) |
| $100,000 to $299,999 | 9,813 (55.9%) | 19,059 (57.6%) |
| $300,000 to $499,999 | 3,726 (21.2%) | 9,374 (28.3%) |
| $500,000 to $749,999 | 935 (5.3%) | 2,107 (6.4%) |
| $750,000 to $999,999 | 321 (1.8%) | 414 (1.3%) |
| $1,000,000 or more | 141 (0.8%) | 486 (1.5%) |
| Total | 17,560 (100.0%) | 33,114 (100.0%) |
Household Income by Mortgage Status in Minnehaha County
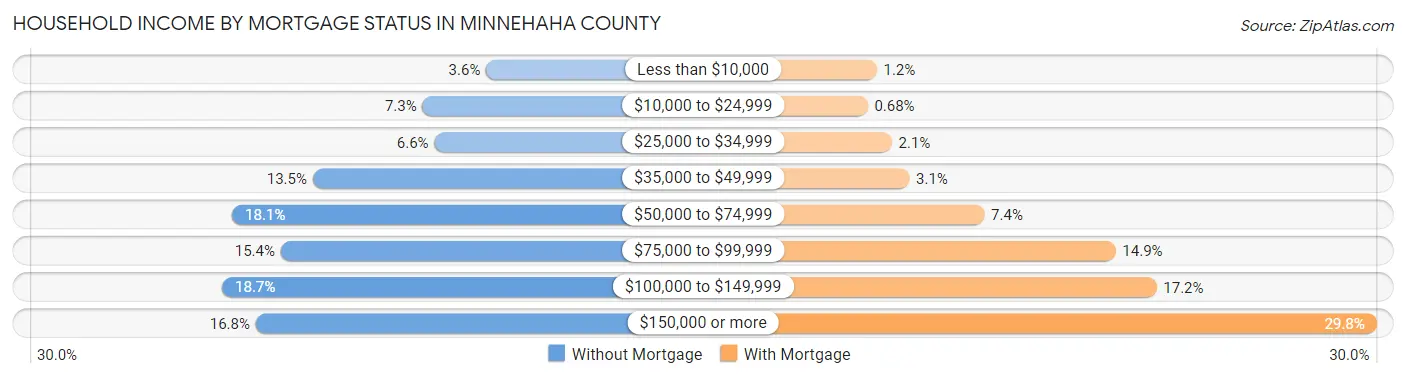
| Household Income | Without Mortgage | With Mortgage |
| Less than $10,000 | 636 (3.6%) | 396 (1.2%) |
| $10,000 to $24,999 | 1,275 (7.3%) | 224 (0.7%) |
| $25,000 to $34,999 | 1,156 (6.6%) | 683 (2.1%) |
| $35,000 to $49,999 | 2,376 (13.5%) | 1,014 (3.1%) |
| $50,000 to $74,999 | 3,185 (18.1%) | 2,433 (7.3%) |
| $75,000 to $99,999 | 2,697 (15.4%) | 4,919 (14.8%) |
| $100,000 to $149,999 | 3,286 (18.7%) | 5,693 (17.2%) |
| $150,000 or more | 2,949 (16.8%) | 9,863 (29.8%) |
| Total | 17,560 (100.0%) | 33,114 (100.0%) |
Property Value to Household Income Ratio in Minnehaha County
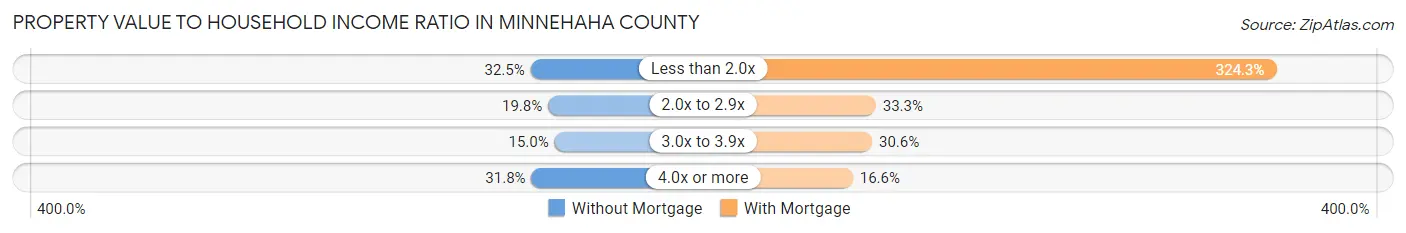
| Value-to-Income Ratio | Without Mortgage | With Mortgage |
| Less than 2.0x | 5,703 (32.5%) | 107,375 (324.3%) |
| 2.0x to 2.9x | 3,468 (19.8%) | 11,040 (33.3%) |
| 3.0x to 3.9x | 2,636 (15.0%) | 10,126 (30.6%) |
| 4.0x or more | 5,588 (31.8%) | 5,492 (16.6%) |
| Total | 17,560 (100.0%) | 33,114 (100.0%) |
Real Estate Taxes by Mortgage Status in Minnehaha County
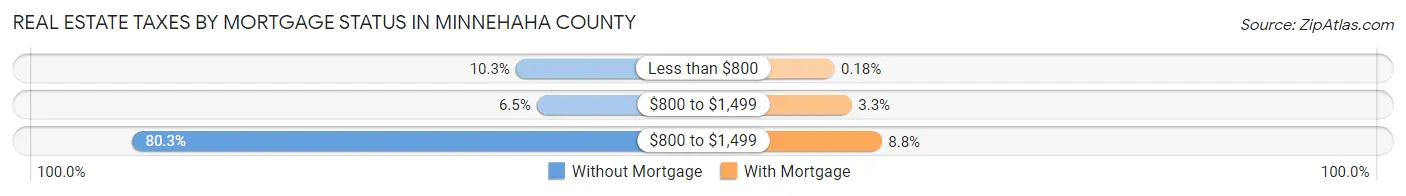
| Property Taxes | Without Mortgage | With Mortgage |
| Less than $800 | 1,809 (10.3%) | 58 (0.2%) |
| $800 to $1,499 | 1,139 (6.5%) | 1,106 (3.3%) |
| $800 to $1,499 | 14,096 (80.3%) | 2,922 (8.8%) |
| Total | 17,560 (100.0%) | 33,114 (100.0%) |
Health & Disability in Minnehaha County
Health Insurance Coverage by Age in Minnehaha County
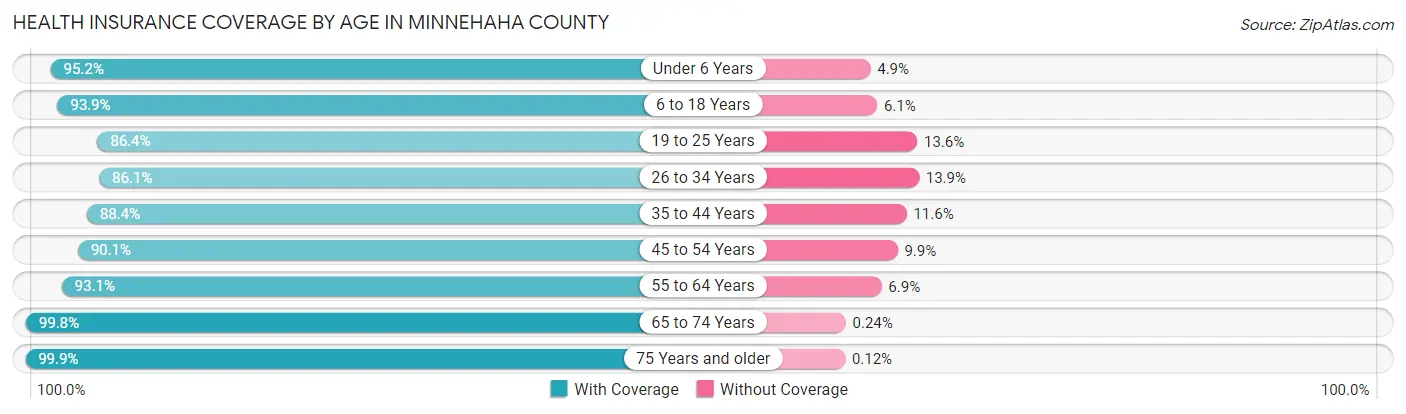
| Age Bracket | With Coverage | Without Coverage |
| Under 6 Years | 16,244 (95.2%) | 828 (4.9%) |
| 6 to 18 Years | 32,587 (93.9%) | 2,118 (6.1%) |
| 19 to 25 Years | 15,283 (86.4%) | 2,398 (13.6%) |
| 26 to 34 Years | 22,689 (86.1%) | 3,661 (13.9%) |
| 35 to 44 Years | 24,038 (88.4%) | 3,155 (11.6%) |
| 45 to 54 Years | 19,710 (90.1%) | 2,168 (9.9%) |
| 55 to 64 Years | 22,372 (93.1%) | 1,664 (6.9%) |
| 65 to 74 Years | 16,824 (99.8%) | 41 (0.2%) |
| 75 Years and older | 8,882 (99.9%) | 11 (0.1%) |
| Total | 178,629 (91.8%) | 16,044 (8.2%) |
Health Insurance Coverage by Citizenship Status in Minnehaha County
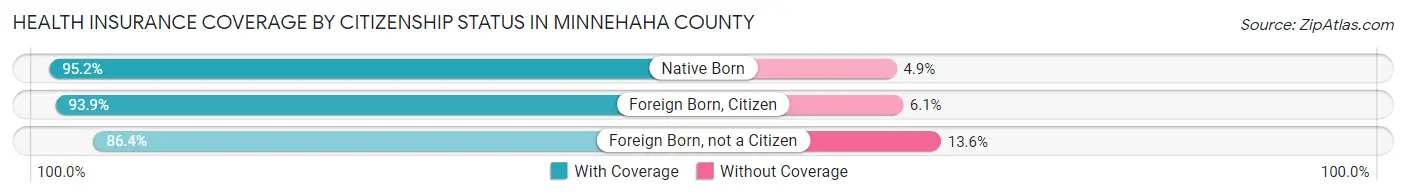
| Citizenship Status | With Coverage | Without Coverage |
| Native Born | 16,244 (95.2%) | 828 (4.9%) |
| Foreign Born, Citizen | 32,587 (93.9%) | 2,118 (6.1%) |
| Foreign Born, not a Citizen | 15,283 (86.4%) | 2,398 (13.6%) |
Health Insurance Coverage by Household Income in Minnehaha County
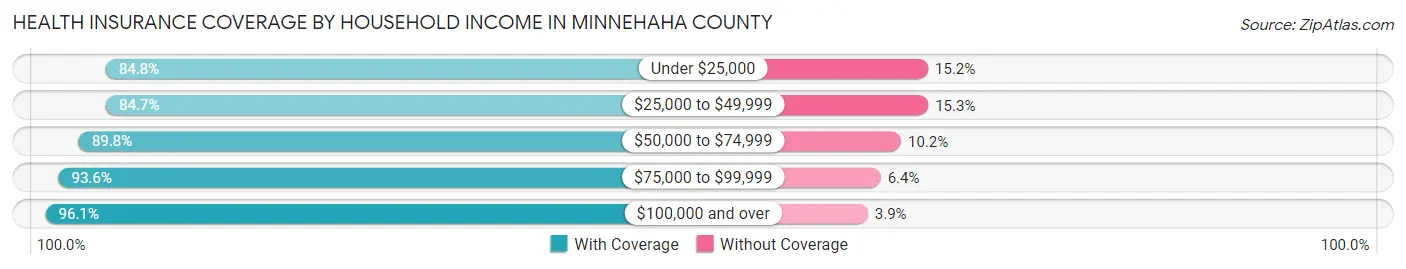
| Household Income | With Coverage | Without Coverage |
| Under $25,000 | 12,417 (84.8%) | 2,231 (15.2%) |
| $25,000 to $49,999 | 24,694 (84.7%) | 4,446 (15.3%) |
| $50,000 to $74,999 | 28,877 (89.8%) | 3,269 (10.2%) |
| $75,000 to $99,999 | 28,230 (93.6%) | 1,917 (6.4%) |
| $100,000 and over | 82,382 (96.1%) | 3,382 (3.9%) |
Public vs Private Health Insurance Coverage by Age in Minnehaha County
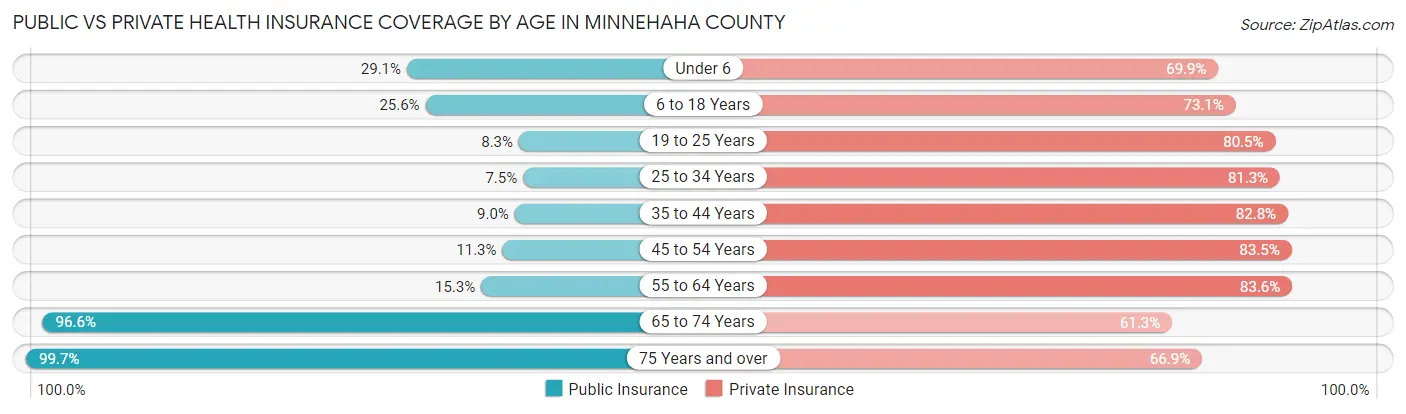
| Age Bracket | Public Insurance | Private Insurance |
| Under 6 | 4,959 (29.0%) | 11,931 (69.9%) |
| 6 to 18 Years | 8,886 (25.6%) | 25,365 (73.1%) |
| 19 to 25 Years | 1,460 (8.3%) | 14,225 (80.4%) |
| 25 to 34 Years | 1,970 (7.5%) | 21,429 (81.3%) |
| 35 to 44 Years | 2,456 (9.0%) | 22,516 (82.8%) |
| 45 to 54 Years | 2,477 (11.3%) | 18,265 (83.5%) |
| 55 to 64 Years | 3,671 (15.3%) | 20,090 (83.6%) |
| 65 to 74 Years | 16,298 (96.6%) | 10,340 (61.3%) |
| 75 Years and over | 8,868 (99.7%) | 5,946 (66.9%) |
| Total | 51,045 (26.2%) | 150,107 (77.1%) |
Disability Status by Sex by Age in Minnehaha County
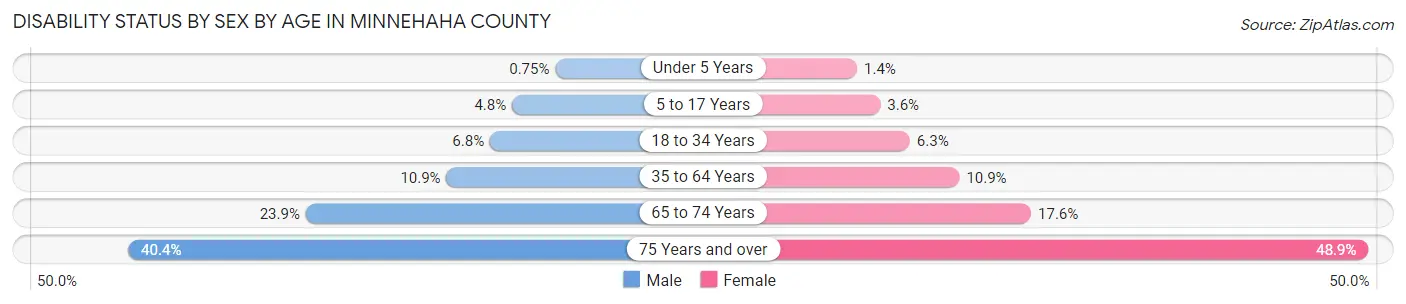
| Age Bracket | Male | Female |
| Under 5 Years | 55 (0.7%) | 100 (1.4%) |
| 5 to 17 Years | 866 (4.8%) | 617 (3.6%) |
| 18 to 34 Years | 1,600 (6.8%) | 1,420 (6.3%) |
| 35 to 64 Years | 4,096 (10.8%) | 3,862 (10.9%) |
| 65 to 74 Years | 2,001 (23.9%) | 1,493 (17.6%) |
| 75 Years and over | 1,421 (40.4%) | 2,626 (48.9%) |
Disability Class by Sex by Age in Minnehaha County
Disability Class: Hearing Difficulty
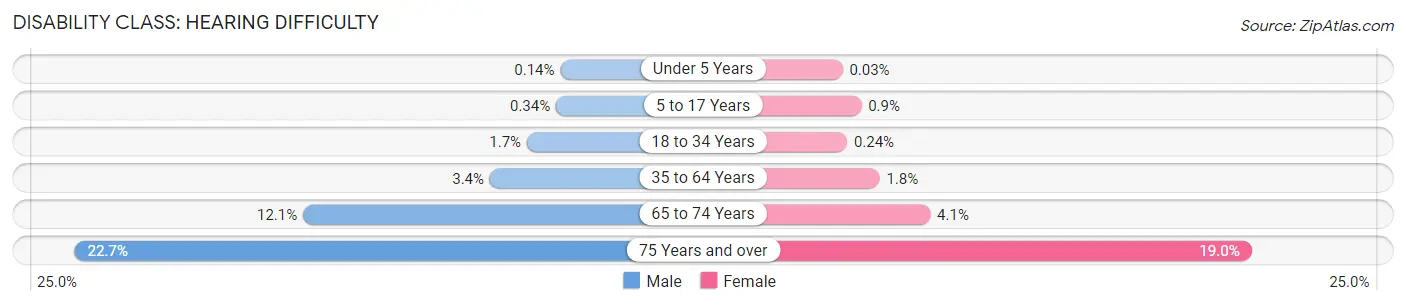
| Age Bracket | Male | Female |
| Under 5 Years | 10 (0.1%) | 2 (0.0%) |
| 5 to 17 Years | 61 (0.3%) | 156 (0.9%) |
| 18 to 34 Years | 397 (1.7%) | 53 (0.2%) |
| 35 to 64 Years | 1,287 (3.4%) | 620 (1.8%) |
| 65 to 74 Years | 1,011 (12.1%) | 348 (4.1%) |
| 75 Years and over | 798 (22.7%) | 1,022 (19.0%) |
Disability Class: Vision Difficulty
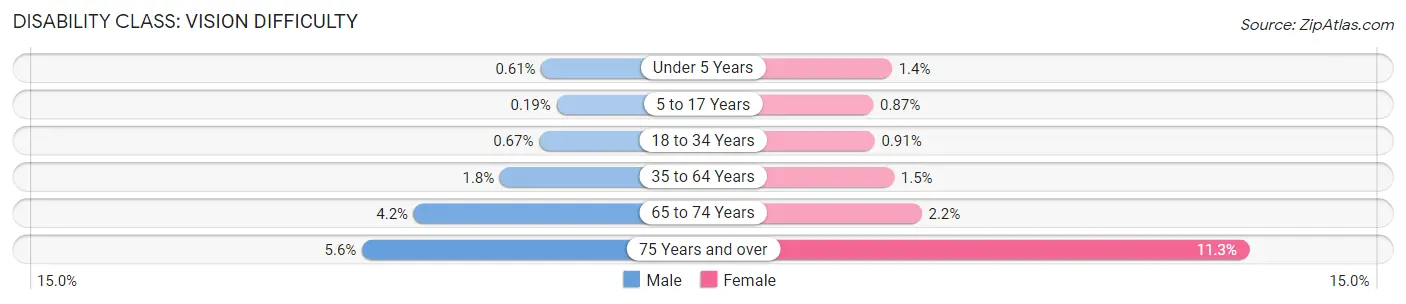
| Age Bracket | Male | Female |
| Under 5 Years | 45 (0.6%) | 98 (1.4%) |
| 5 to 17 Years | 35 (0.2%) | 150 (0.9%) |
| 18 to 34 Years | 158 (0.7%) | 204 (0.9%) |
| 35 to 64 Years | 665 (1.8%) | 512 (1.5%) |
| 65 to 74 Years | 348 (4.2%) | 189 (2.2%) |
| 75 Years and over | 197 (5.6%) | 609 (11.3%) |
Disability Class: Cognitive Difficulty
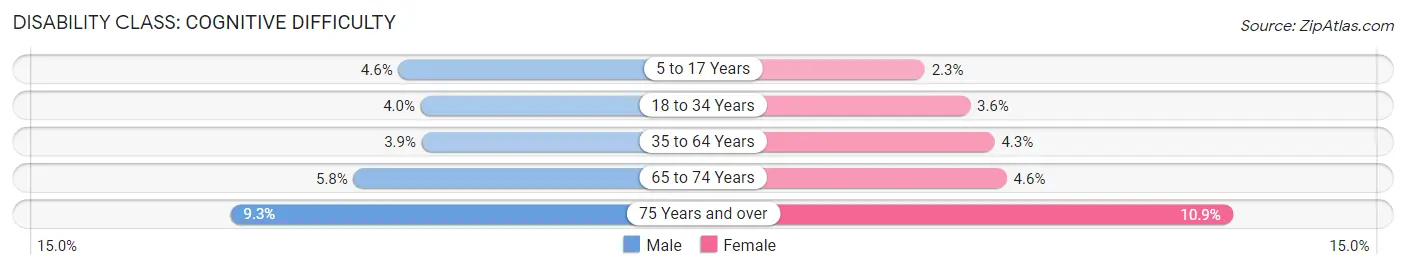
| Age Bracket | Male | Female |
| 5 to 17 Years | 835 (4.6%) | 398 (2.3%) |
| 18 to 34 Years | 934 (4.0%) | 803 (3.6%) |
| 35 to 64 Years | 1,488 (3.9%) | 1,503 (4.3%) |
| 65 to 74 Years | 489 (5.8%) | 390 (4.6%) |
| 75 Years and over | 326 (9.3%) | 585 (10.9%) |
Disability Class: Ambulatory Difficulty
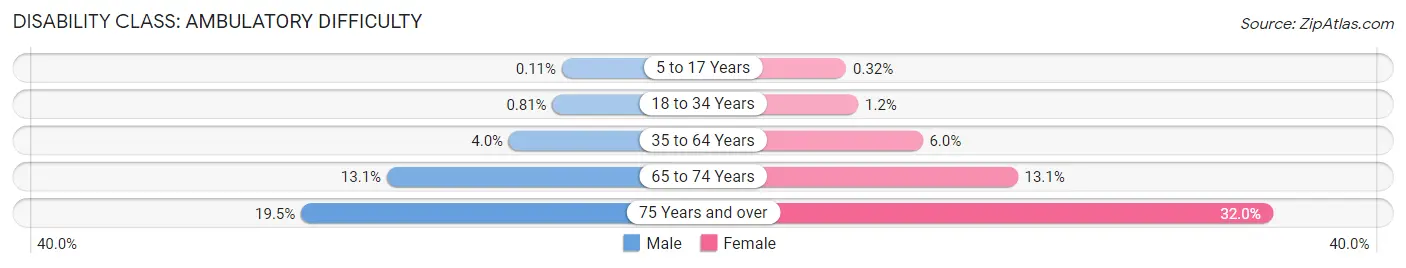
| Age Bracket | Male | Female |
| 5 to 17 Years | 20 (0.1%) | 55 (0.3%) |
| 18 to 34 Years | 190 (0.8%) | 272 (1.2%) |
| 35 to 64 Years | 1,524 (4.0%) | 2,120 (6.0%) |
| 65 to 74 Years | 1,096 (13.1%) | 1,109 (13.1%) |
| 75 Years and over | 685 (19.5%) | 1,719 (32.0%) |
Disability Class: Self-Care Difficulty
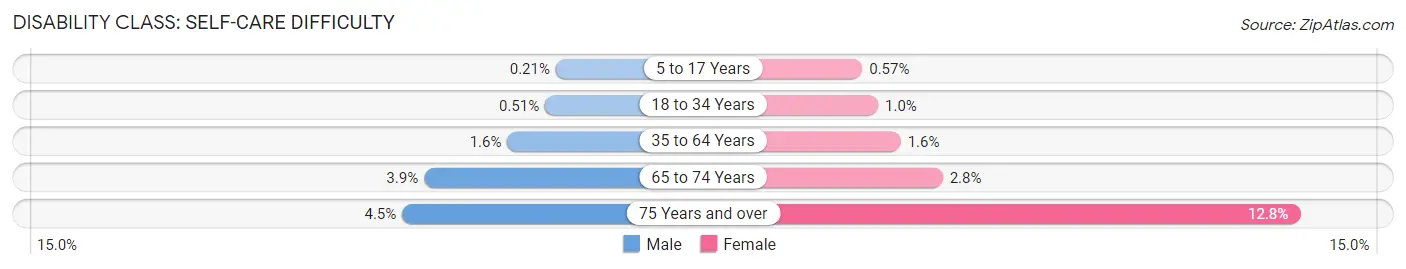
| Age Bracket | Male | Female |
| 5 to 17 Years | 39 (0.2%) | 99 (0.6%) |
| 18 to 34 Years | 121 (0.5%) | 228 (1.0%) |
| 35 to 64 Years | 587 (1.6%) | 581 (1.6%) |
| 65 to 74 Years | 325 (3.9%) | 239 (2.8%) |
| 75 Years and over | 158 (4.5%) | 686 (12.8%) |
Technology Access in Minnehaha County
Computing Device Access in Minnehaha County
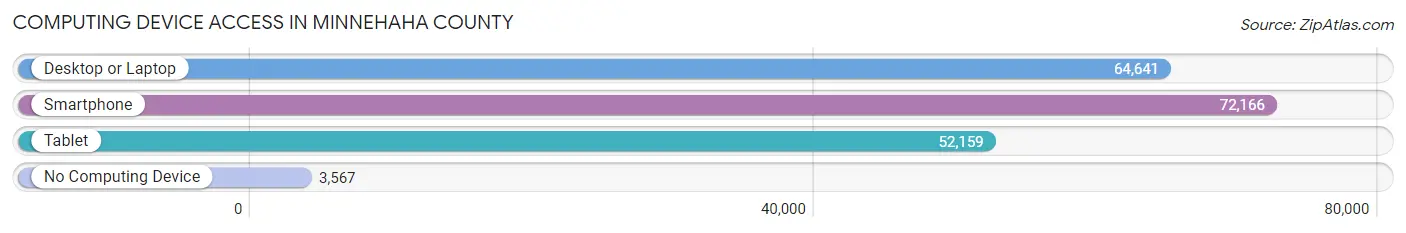
| Device Type | # Households | % Households |
| Desktop or Laptop | 64,641 | 80.9% |
| Smartphone | 72,166 | 90.3% |
| Tablet | 52,159 | 65.3% |
| No Computing Device | 3,567 | 4.5% |
| Total | 79,887 | 100.0% |
Internet Access in Minnehaha County
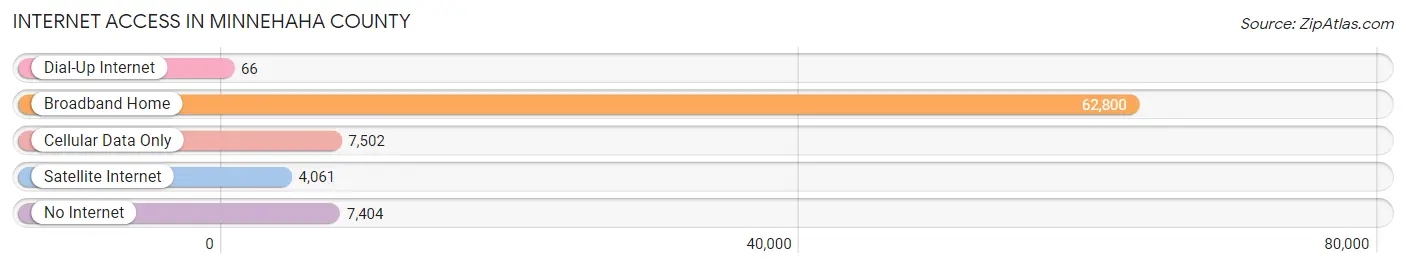
| Internet Type | # Households | % Households |
| Dial-Up Internet | 66 | 0.1% |
| Broadband Home | 62,800 | 78.6% |
| Cellular Data Only | 7,502 | 9.4% |
| Satellite Internet | 4,061 | 5.1% |
| No Internet | 7,404 | 9.3% |
| Total | 79,887 | 100.0% |
Minnehaha County Summary
Minnehaha County, South Dakota is located in the southeastern corner of the state and is the most populous county in the state. It is bordered by Lincoln County to the north, Turner County to the east, Clay County to the south, and Moody County to the west. The county seat is Sioux Falls, the largest city in the state.
History
Minnehaha County was established in 1862 and named after the Sioux Indian word for “laughing water”. The county was originally part of the Dakota Territory and was organized in 1868. The county was named after the Sioux Indian word for “laughing water”. The county was originally part of the Dakota Territory and was organized in 1868.
The county was home to several Native American tribes, including the Sioux, Yankton Sioux, and the Santee Sioux. The first settlers in the area were mostly of European descent, and the county was largely agricultural. The first railroad in the county was built in 1872, and the city of Sioux Falls was founded in 1876.
Geography
Minnehaha County covers an area of 1,072 square miles and is located in the southeastern corner of South Dakota. The county is bordered by Lincoln County to the north, Turner County to the east, Clay County to the south, and Moody County to the west. The county is mostly flat, with some rolling hills in the western part of the county. The Big Sioux River runs through the county, and there are several lakes and reservoirs in the area.
Economy
The economy of Minnehaha County is largely based on agriculture, manufacturing, and services. The county is home to several large companies, including Smithfield Foods, Wells Fargo, and Sanford Health. Agriculture is the largest industry in the county, with corn, soybeans, and wheat being the main crops. Manufacturing is also a major industry in the county, with several large companies located in the area.
Demographics
As of the 2010 census, the population of Minnehaha County was 169,468. The population is mostly white (87.3%), with a small percentage of African Americans (4.2%), Native Americans (2.2%), Asians (2.1%), and other races (4.2%). The median household income in the county is $54,945, and the median age is 36.7 years.
Conclusion
Minnehaha County is a vibrant and diverse county located in the southeastern corner of South Dakota. The county is home to several large companies, and the economy is largely based on agriculture, manufacturing, and services. The population of the county is mostly white, with a small percentage of African Americans, Native Americans, Asians, and other races. The median household income in the county is $54,945, and the median age is 36.7 years.
Common Questions
What is the Total Population of Minnehaha County?
Total Population of Minnehaha County is 197,742.
What is the Total Male Population of Minnehaha County?
Total Male Population of Minnehaha County is 100,828.
What is the Total Female Population of Minnehaha County?
Total Female Population of Minnehaha County is 96,914.
What is the Ratio of Males per 100 Females in Minnehaha County?
There are 104.04 Males per 100 Females in Minnehaha County.
What is the Ratio of Females per 100 Males in Minnehaha County?
There are 96.12 Females per 100 Males in Minnehaha County.
What is the Median Population Age in Minnehaha County?
Median Population Age in Minnehaha County is 35.6 Years.
What is the Average Family Size in Minnehaha County
Average Family Size in Minnehaha County is 3.1 People.
What is the Average Household Size in Minnehaha County
Average Household Size in Minnehaha County is 2.4 People.
What is Per Capita Income in Minnehaha County?
Per Capita income in Minnehaha County is $39,289.
What is the Median Family Income in Minnehaha County?
Median Family Income in Minnehaha County is $95,190.
What is the Median Household income in Minnehaha County?
Median Household Income in Minnehaha County is $73,110.
What is Income or Wage Gap in Minnehaha County?
Income or Wage Gap in Minnehaha County is 23.4%.
Women in Minnehaha County earn 76.6 cents for every dollar earned by a man.
What is Family Income Deficit in Minnehaha County?
Family Income Deficit in Minnehaha County is $9,570.
Families that are below poverty line in Minnehaha County earn $9,570 less on average than the poverty threshold level.
What is Inequality or Gini Index in Minnehaha County?
Inequality or Gini Index in Minnehaha County is 0.43.
How Large is the Labor Force in Minnehaha County?
There are 113,665 People in the Labor Forcein in Minnehaha County.
What is the Percentage of People in the Labor Force in Minnehaha County?
74.3% of People are in the Labor Force in Minnehaha County.
What is the Unemployment Rate in Minnehaha County?
Unemployment Rate in Minnehaha County is 2.4%.