Miner County, SD
Miner County Map

Miner County Overview
2,312
TOTAL POPULATION
1,167
MALE POPULATION
1,145
FEMALE POPULATION
101.92
MALES / 100 FEMALES
98.11
FEMALES / 100 MALES
48.8
MEDIAN AGE
3.1
AVG FAMILY SIZE
2.5
AVG HOUSEHOLD SIZE
$32,033
PER CAPITA INCOME
$88,011
AVG FAMILY INCOME
$62,037
AVG HOUSEHOLD INCOME
32.9%
WAGE / INCOME GAP [ % ]
67.1¢/ $1
WAGE / INCOME GAP [ $ ]
0.43
INEQUALITY / GINI INDEX
1,139
LABOR FORCE [ PEOPLE ]
60.1%
PERCENT IN LABOR FORCE
1.4%
UNEMPLOYMENT RATE
Miner County Area Codes
Race in Miner County
The most populous races in Miner County are White / Caucasian (2,214 | 95.8%), Hispanic or Latino (67 | 2.9%), and Two or more Races (32 | 1.4%).

| Race | # Population | % Population |
| Asian | 10 | 0.4% |
| Black / African American | 13 | 0.6% |
| Hawaiian / Pacific | 0 | 0.0% |
| Hispanic or Latino | 67 | 2.9% |
| Native / Alaskan | 31 | 1.3% |
| White / Caucasian | 2,214 | 95.8% |
| Two or more Races | 32 | 1.4% |
| Some other Race | 12 | 0.5% |
| Total | 2,312 | 100.0% |
Ancestry in Miner County
The most populous ancestries reported in Miner County are German (938 | 40.6%), Norwegian (345 | 14.9%), Irish (237 | 10.2%), American (181 | 7.8%), and Swedish (97 | 4.2%), together accounting for 77.8% of all Miner County residents.

| Ancestry | # Population | % Population |
| American | 181 | 7.8% |
| Belgian | 3 | 0.1% |
| Bhutanese | 9 | 0.4% |
| British | 8 | 0.4% |
| Burmese | 1 | 0.0% |
| Canadian | 34 | 1.5% |
| Czech | 6 | 0.3% |
| Czechoslovakian | 4 | 0.2% |
| Danish | 18 | 0.8% |
| Dutch | 13 | 0.6% |
| English | 81 | 3.5% |
| European | 1 | 0.0% |
| Finnish | 3 | 0.1% |
| French | 20 | 0.9% |
| French Canadian | 3 | 0.1% |
| German | 938 | 40.6% |
| Irish | 237 | 10.2% |
| Italian | 9 | 0.4% |
| Jamaican | 5 | 0.2% |
| Luxembourger | 32 | 1.4% |
| Mexican | 45 | 1.9% |
| Norwegian | 345 | 14.9% |
| Pennsylvania German | 22 | 0.9% |
| Polish | 10 | 0.4% |
| Puerto Rican | 12 | 0.5% |
| Scandinavian | 20 | 0.9% |
| Scottish | 4 | 0.2% |
| Serbian | 2 | 0.1% |
| Sioux | 30 | 1.3% |
| Spaniard | 10 | 0.4% |
| Swedish | 97 | 4.2% |
| Welsh | 27 | 1.2% | View All 32 Rows |
Immigrants in Miner County

| Immigration Origin | # Population | % Population | View All 0 Rows |
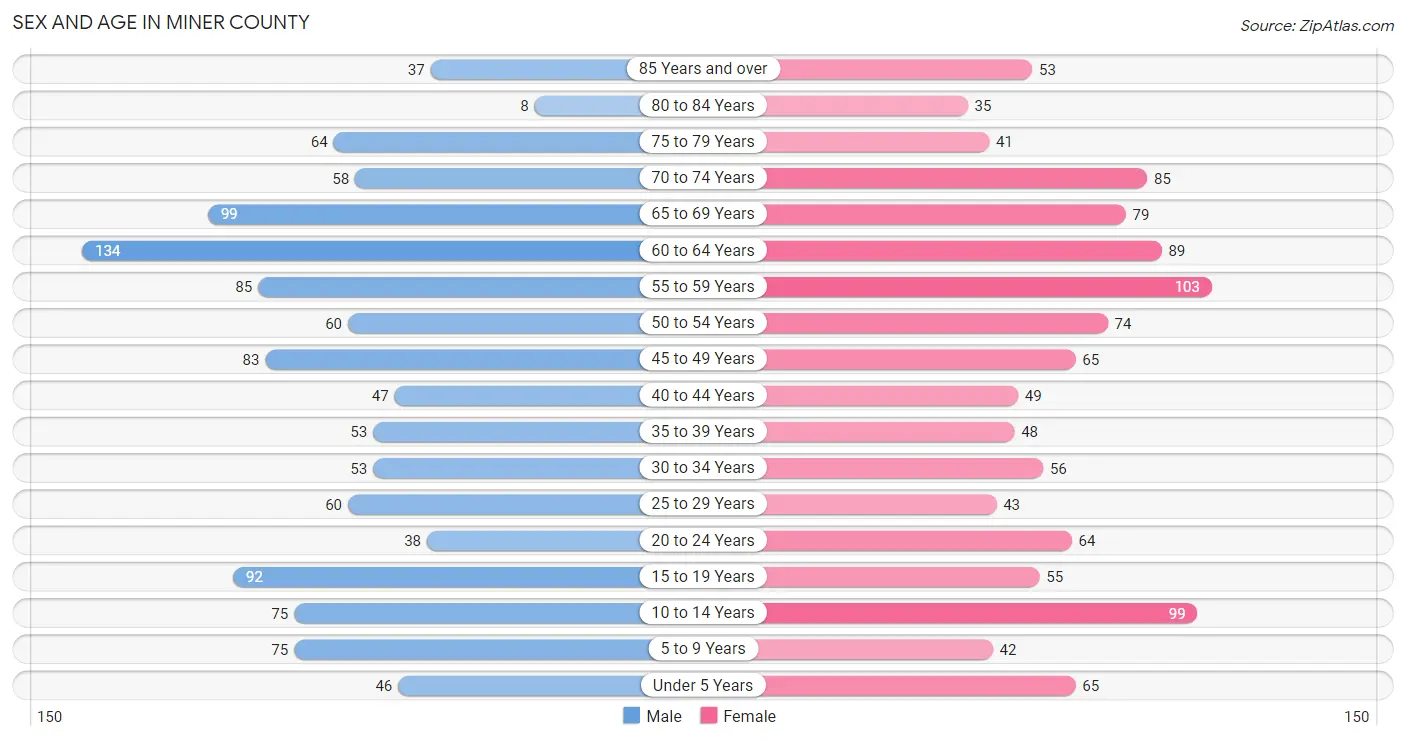
Sex and Age in Miner County
Sex and Age in Miner County
The most populous age groups in Miner County are 60 to 64 Years (134 | 11.5%) for men and 55 to 59 Years (103 | 9.0%) for women.
| Age Bracket | Male | Female |
| Under 5 Years | 46 (3.9%) | 65 (5.7%) |
| 5 to 9 Years | 75 (6.4%) | 42 (3.7%) |
| 10 to 14 Years | 75 (6.4%) | 99 (8.6%) |
| 15 to 19 Years | 92 (7.9%) | 55 (4.8%) |
| 20 to 24 Years | 38 (3.3%) | 64 (5.6%) |
| 25 to 29 Years | 60 (5.1%) | 43 (3.8%) |
| 30 to 34 Years | 53 (4.5%) | 56 (4.9%) |
| 35 to 39 Years | 53 (4.5%) | 48 (4.2%) |
| 40 to 44 Years | 47 (4.0%) | 49 (4.3%) |
| 45 to 49 Years | 83 (7.1%) | 65 (5.7%) |
| 50 to 54 Years | 60 (5.1%) | 74 (6.5%) |
| 55 to 59 Years | 85 (7.3%) | 103 (9.0%) |
| 60 to 64 Years | 134 (11.5%) | 89 (7.8%) |
| 65 to 69 Years | 99 (8.5%) | 79 (6.9%) |
| 70 to 74 Years | 58 (5.0%) | 85 (7.4%) |
| 75 to 79 Years | 64 (5.5%) | 41 (3.6%) |
| 80 to 84 Years | 8 (0.7%) | 35 (3.1%) |
| 85 Years and over | 37 (3.2%) | 53 (4.6%) |
| Total | 1,167 (100.0%) | 1,145 (100.0%) |
Families and Households in Miner County
Median Family Size in Miner County
The median family size in Miner County is 3.14 persons per family, with single male/father families (54 | 9.5%) accounting for the largest median family size of 3.46 persons per family. On the other hand, single female/mother families (38 | 6.7%) represent the smallest median family size with 2.87 persons per family.

| Family Type | # Families | Family Size |
| Married-Couple | 479 (83.9%) | 3.13 |
| Single Male/Father | 54 (9.5%) | 3.46 |
| Single Female/Mother | 38 (6.7%) | 2.87 |
| Total Families | 571 (100.0%) | 3.14 |
Median Household Size in Miner County
The median household size in Miner County is 2.48 persons per household, with single male/father households (54 | 5.9%) accounting for the largest median household size of 4.87 persons per household. non-family households (339 | 37.2%) represent the smallest median household size with 1.15 persons per household.

| Household Type | # Households | Household Size |
| Married-Couple | 479 (52.6%) | 3.13 |
| Single Male/Father | 54 (5.9%) | 4.87 |
| Single Female/Mother | 38 (4.2%) | 2.87 |
| Non-family | 339 (37.2%) | 1.15 |
| Total Households | 910 (100.0%) | 2.48 |
Household Size by Marriage Status in Miner County
Out of a total of 910 households in Miner County, 571 (62.7%) are family households, while 339 (37.2%) are nonfamily households. The most numerous type of family households are 2-person households, comprising 306, and the most common type of nonfamily households are 1-person households, comprising 306.

| Household Size | Family Households | Nonfamily Households |
| 1-Person Households | - | 306 (33.6%) |
| 2-Person Households | 306 (33.6%) | 33 (3.6%) |
| 3-Person Households | 95 (10.4%) | 0 (0.0%) |
| 4-Person Households | 94 (10.3%) | 0 (0.0%) |
| 5-Person Households | 48 (5.3%) | 0 (0.0%) |
| 6-Person Households | 7 (0.8%) | 0 (0.0%) |
| 7+ Person Households | 21 (2.3%) | 0 (0.0%) |
| Total | 571 (62.7%) | 339 (37.2%) |
Female Fertility in Miner County
Fertility by Age in Miner County
Average fertility rate in Miner County is 58.0 births per 1,000 women. Women in the age bracket of 20 to 34 years have the highest fertility rate with 92.0 births per 1,000 women. Women in the age bracket of 20 to 34 years acount for 65.2% of all women with births.

| Age Bracket | Women with Births | Births / 1,000 Women |
| 15 to 19 years | 0 (0.0%) | 0.0 |
| 20 to 34 years | 15 (65.2%) | 92.0 |
| 35 to 50 years | 8 (34.8%) | 44.0 |
| Total | 23 (100.0%) | 58.0 |
Fertility by Age by Marriage Status in Miner County
91.3% of women with births (23) in Miner County are married. The highest percentage of unmarried women with births falls into 20 to 34 years age bracket with 13.3% of them unmarried at the time of birth, while the lowest percentage of unmarried women with births belong to 35 to 50 years age bracket with 0.0% of them unmarried.

| Age Bracket | Married | Unmarried |
| 15 to 19 years | 0 (0.0%) | 0 (0.0%) |
| 20 to 34 years | 13 (86.7%) | 2 (13.3%) |
| 35 to 50 years | 8 (100.0%) | 0 (0.0%) |
| Total | 21 (91.3%) | 2 (8.7%) |
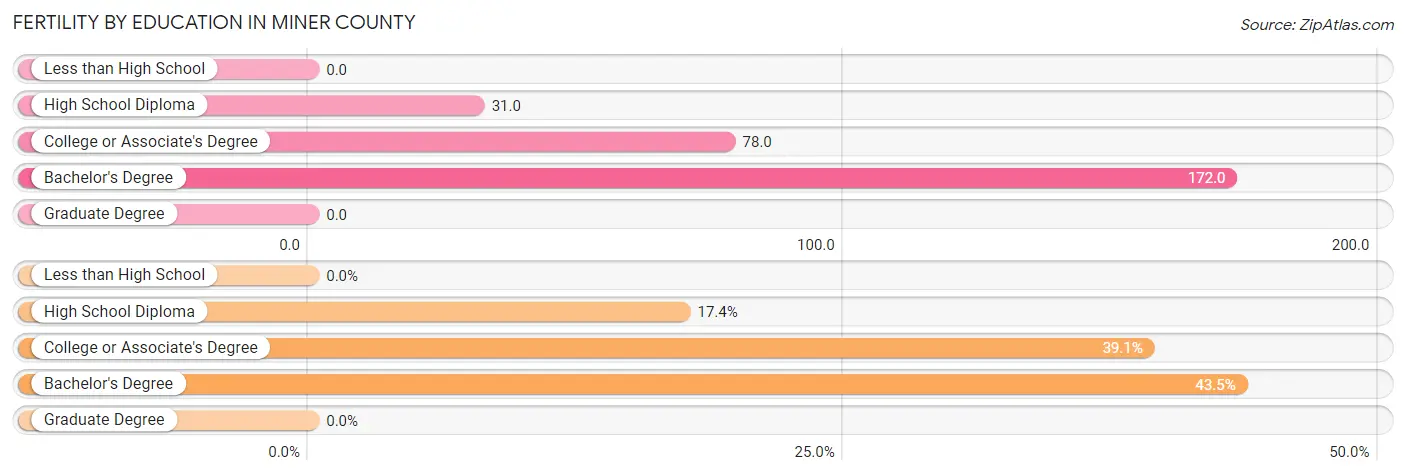
Fertility by Education in Miner County
| Educational Attainment | Women with Births | Births / 1,000 Women |
| Less than High School | 0 (0.0%) | 0.0 |
| High School Diploma | 4 (17.4%) | 31.0 |
| College or Associate's Degree | 9 (39.1%) | 78.0 |
| Bachelor's Degree | 10 (43.5%) | 172.0 |
| Graduate Degree | 0 (0.0%) | 0.0 |
| Total | 23 (100.0%) | 58.0 |
Fertility by Education by Marriage Status in Miner County
8.7% of women with births in Miner County are unmarried. Women with the educational attainment of college or associate's degree are most likely to be married with 100.0% of them married at childbirth, while women with the educational attainment of high school diploma are least likely to be married with 50.0% of them unmarried at childbirth.

| Educational Attainment | Married | Unmarried |
| Less than High School | 0 (0.0%) | 0 (0.0%) |
| High School Diploma | 2 (50.0%) | 2 (50.0%) |
| College or Associate's Degree | 9 (100.0%) | 0 (0.0%) |
| Bachelor's Degree | 10 (100.0%) | 0 (0.0%) |
| Graduate Degree | 0 (0.0%) | 0 (0.0%) |
| Total | 21 (91.3%) | 2 (8.7%) |
Income in Miner County
Income Overview in Miner County
Per Capita Income in Miner County is $32,033, while median incomes of families and households are $88,011 and $62,037 respectively.
| Characteristic | Number | Measure |
| Per Capita Income | 2,312 | $32,033 |
| Median Family Income | 571 | $88,011 |
| Mean Family Income | 571 | $96,103 |
| Median Household Income | 910 | $62,037 |
| Mean Household Income | 910 | $76,169 |
| Income Deficit | 571 | $0 |
| Wage / Income Gap (%) | 2,312 | 32.94% |
| Wage / Income Gap ($) | 2,312 | 67.06¢ per $1 |
| Gini / Inequality Index | 2,312 | 0.43 |
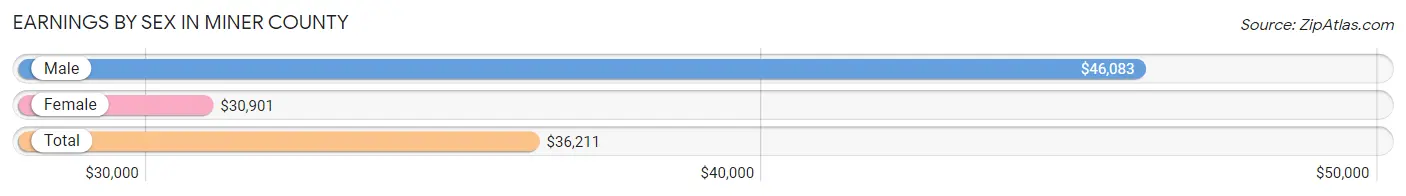
Earnings by Sex in Miner County
Average Earnings in Miner County are $36,211, $46,083 for men and $30,901 for women, a difference of 32.9%.
| Sex | Number | Average Earnings |
| Male | 654 (51.9%) | $46,083 |
| Female | 605 (48.0%) | $30,901 |
| Total | 1,259 (100.0%) | $36,211 |
Earnings by Sex by Income Bracket in Miner County
The most common earnings brackets in Miner County are $65,000 to $74,999 for men (92 | 14.1%) and $30,000 to $34,999 for women (102 | 16.9%).

| Income | Male | Female |
| $2,499 or less | 29 (4.4%) | 23 (3.8%) |
| $2,500 to $4,999 | 33 (5.1%) | 18 (3.0%) |
| $5,000 to $7,499 | 20 (3.1%) | 40 (6.6%) |
| $7,500 to $9,999 | 10 (1.5%) | 6 (1.0%) |
| $10,000 to $12,499 | 5 (0.8%) | 14 (2.3%) |
| $12,500 to $14,999 | 1 (0.2%) | 36 (5.9%) |
| $15,000 to $17,499 | 9 (1.4%) | 25 (4.1%) |
| $17,500 to $19,999 | 26 (4.0%) | 7 (1.2%) |
| $20,000 to $22,499 | 18 (2.8%) | 8 (1.3%) |
| $22,500 to $24,999 | 5 (0.8%) | 43 (7.1%) |
| $25,000 to $29,999 | 22 (3.4%) | 58 (9.6%) |
| $30,000 to $34,999 | 56 (8.6%) | 102 (16.9%) |
| $35,000 to $39,999 | 31 (4.7%) | 58 (9.6%) |
| $40,000 to $44,999 | 36 (5.5%) | 35 (5.8%) |
| $45,000 to $49,999 | 84 (12.8%) | 38 (6.3%) |
| $50,000 to $54,999 | 21 (3.2%) | 11 (1.8%) |
| $55,000 to $64,999 | 81 (12.4%) | 38 (6.3%) |
| $65,000 to $74,999 | 92 (14.1%) | 18 (3.0%) |
| $75,000 to $99,999 | 40 (6.1%) | 5 (0.8%) |
| $100,000+ | 35 (5.3%) | 22 (3.6%) |
| Total | 654 (100.0%) | 605 (100.0%) |
Earnings by Sex by Educational Attainment in Miner County
Average earnings in Miner County are $47,760 for men and $31,857 for women, a difference of 33.3%. Men with an educational attainment of college or associate's degree enjoy the highest average annual earnings of $58,182, while those with less than high school education earn the least with $45,682. Women with an educational attainment of graduate degree earn the most with the average annual earnings of $57,500, while those with high school diploma education have the smallest earnings of $27,125.

| Educational Attainment | Male Income | Female Income |
| Less than High School | $45,682 | $0 |
| High School Diploma | $47,419 | $27,125 |
| College or Associate's Degree | $58,182 | $31,890 |
| Bachelor's Degree | $46,771 | $44,063 |
| Graduate Degree | $56,250 | $57,500 |
| Total | $47,760 | $31,857 |
Family Income in Miner County
Family Income Brackets in Miner County
According to the Miner County family income data, there are 190 families falling into the $100,000 to $149,999 income range, which is the most common income bracket and makes up 33.3% of all families.

| Income Bracket | # Families | % Families |
| Less than $10,000 | 23 | 4.0% |
| $10,000 to $14,999 | 0 | 0.0% |
| $15,000 to $24,999 | 25 | 4.4% |
| $25,000 to $34,999 | 31 | 5.4% |
| $35,000 to $49,999 | 94 | 16.5% |
| $50,000 to $74,999 | 73 | 12.8% |
| $75,000 to $99,999 | 70 | 12.3% |
| $100,000 to $149,999 | 190 | 33.3% |
| $150,000 to $199,999 | 35 | 6.1% |
| $200,000+ | 30 | 5.3% |
Family Income by Famaliy Size in Miner County
7+ person families (15 | 2.6%) account for the highest median family income in Miner County with $157,188 per family, while 2-person families (313 | 54.8%) have the highest median income of $42,734 per family member.

| Income Bracket | # Families | Median Income |
| 2-Person Families | 313 (54.8%) | $85,469 |
| 3-Person Families | 97 (17.0%) | $94,375 |
| 4-Person Families | 92 (16.1%) | $84,643 |
| 5-Person Families | 54 (9.5%) | $109,722 |
| 6-Person Families | 0 (0.0%) | $0 |
| 7+ Person Families | 15 (2.6%) | $157,188 |
| Total | 571 (100.0%) | $88,011 |
Family Income by Number of Earners in Miner County
The median family income in Miner County is $88,011, with families comprising 3+ earners (62) having the highest median family income of $115,500, while families with no earners (68) have the lowest median family income of $38,750, accounting for 10.9% and 11.9% of families, respectively.

| Number of Earners | # Families | Median Income |
| No Earners | 68 (11.9%) | $38,750 |
| 1 Earner | 149 (26.1%) | $47,019 |
| 2 Earners | 292 (51.1%) | $107,500 |
| 3+ Earners | 62 (10.9%) | $115,500 |
| Total | 571 (100.0%) | $88,011 |
Household Income in Miner County
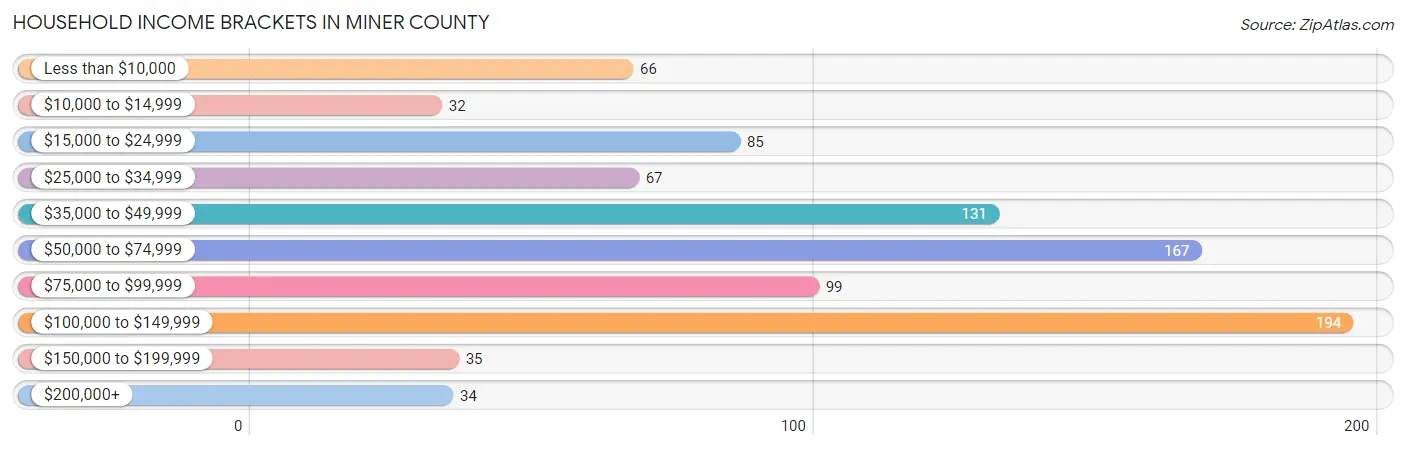
Household Income Brackets in Miner County
With 194 households falling in the category, the $100,000 to $149,999 income range is the most frequent in Miner County, accounting for 21.3% of all households. In contrast, only 32 households (3.5%) fall into the $10,000 to $14,999 income bracket, making it the least populous group.
| Income Bracket | # Households | % Households |
| Less than $10,000 | 66 | 7.3% |
| $10,000 to $14,999 | 32 | 3.5% |
| $15,000 to $24,999 | 85 | 9.3% |
| $25,000 to $34,999 | 67 | 7.4% |
| $35,000 to $49,999 | 131 | 14.4% |
| $50,000 to $74,999 | 167 | 18.4% |
| $75,000 to $99,999 | 99 | 10.9% |
| $100,000 to $149,999 | 194 | 21.3% |
| $150,000 to $199,999 | 35 | 3.8% |
| $200,000+ | 34 | 3.7% |
Household Income by Householder Age in Miner County
The median household income in Miner County is $62,037, with the highest median household income of $75,938 found in the 25 to 44 years age bracket for the primary householder. A total of 217 households (23.8%) fall into this category. Meanwhile, the 65+ years age bracket for the primary householder has the lowest median household income of $43,684, with 306 households (33.6%) in this group.

| Income Bracket | # Households | Median Income |
| 15 to 24 Years | 6 (0.7%) | $60,000 |
| 25 to 44 Years | 217 (23.8%) | $75,938 |
| 45 to 64 Years | 381 (41.9%) | $59,375 |
| 65+ Years | 306 (33.6%) | $43,684 |
| Total | 910 (100.0%) | $62,037 |
Poverty in Miner County
Income Below Poverty by Sex and Age in Miner County
With 12.0% poverty level for males and 8.9% for females among the residents of Miner County, 15 year old males and 18 to 24 year old females are the most vulnerable to poverty, with 8 males (57.1%) and 40 females (49.4%) in their respective age groups living below the poverty level.
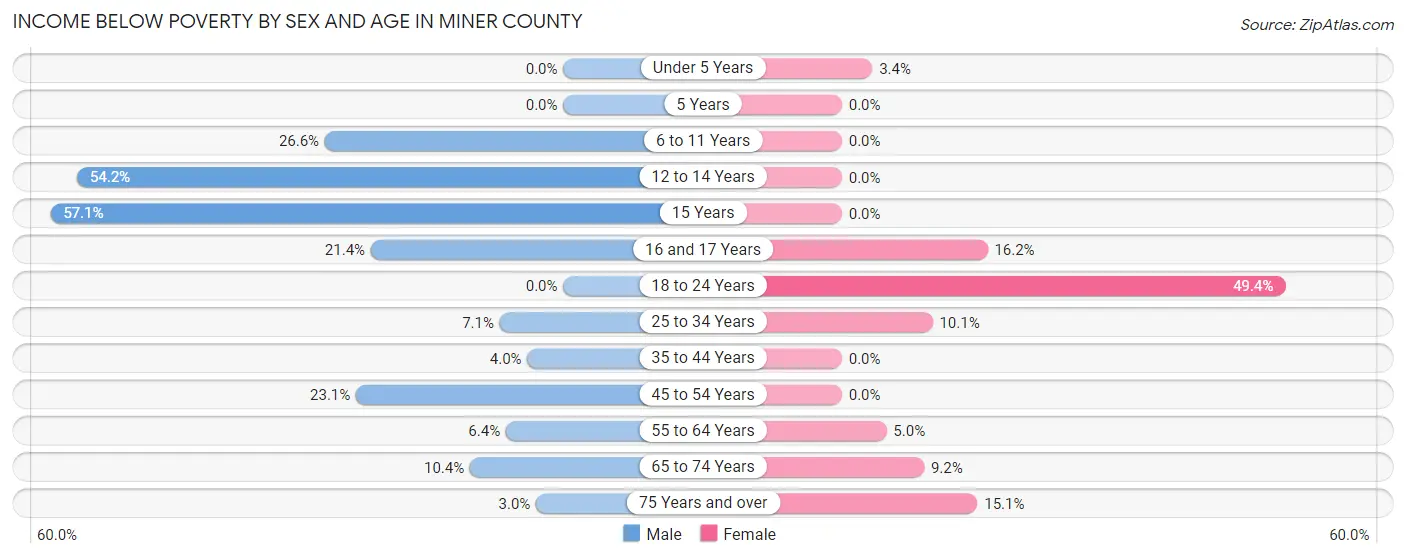
| Age Bracket | Male | Female |
| Under 5 Years | 0 (0.0%) | 2 (3.4%) |
| 5 Years | 0 (0.0%) | 0 (0.0%) |
| 6 to 11 Years | 30 (26.6%) | 0 (0.0%) |
| 12 to 14 Years | 13 (54.2%) | 0 (0.0%) |
| 15 Years | 8 (57.1%) | 0 (0.0%) |
| 16 and 17 Years | 9 (21.4%) | 6 (16.2%) |
| 18 to 24 Years | 0 (0.0%) | 40 (49.4%) |
| 25 to 34 Years | 8 (7.1%) | 10 (10.1%) |
| 35 to 44 Years | 4 (4.0%) | 0 (0.0%) |
| 45 to 54 Years | 33 (23.1%) | 0 (0.0%) |
| 55 to 64 Years | 14 (6.4%) | 9 (5.0%) |
| 65 to 74 Years | 16 (10.4%) | 15 (9.1%) |
| 75 Years and over | 3 (3.0%) | 16 (15.1%) |
| Total | 138 (12.0%) | 98 (8.9%) |
Income Above Poverty by Sex and Age in Miner County
According to the poverty statistics in Miner County, males aged under 5 years and females aged 5 years are the age groups that are most secure financially, with 100.0% of males and 100.0% of females in these age groups living above the poverty line.

| Age Bracket | Male | Female |
| Under 5 Years | 37 (100.0%) | 57 (96.6%) |
| 5 Years | 13 (100.0%) | 12 (100.0%) |
| 6 to 11 Years | 83 (73.5%) | 64 (100.0%) |
| 12 to 14 Years | 11 (45.8%) | 65 (100.0%) |
| 15 Years | 6 (42.9%) | 1 (100.0%) |
| 16 and 17 Years | 33 (78.6%) | 31 (83.8%) |
| 18 to 24 Years | 74 (100.0%) | 41 (50.6%) |
| 25 to 34 Years | 105 (92.9%) | 89 (89.9%) |
| 35 to 44 Years | 96 (96.0%) | 97 (100.0%) |
| 45 to 54 Years | 110 (76.9%) | 135 (100.0%) |
| 55 to 64 Years | 205 (93.6%) | 172 (95.0%) |
| 65 to 74 Years | 138 (89.6%) | 149 (90.8%) |
| 75 Years and over | 96 (97.0%) | 90 (84.9%) |
| Total | 1,007 (87.9%) | 1,003 (91.1%) |
Income Below Poverty Among Married-Couple Families in Miner County
The poverty statistics for married-couple families in Miner County show that 1.9% or 9 of the total 479 families live below the poverty line. Families with no children have the highest poverty rate of 2.3%, comprising of 7 families. On the other hand, families with 3 or 4 children have the lowest poverty rate of 0.0%, which includes 0 families.

| Children | Above Poverty | Below Poverty |
| No Children | 298 (97.7%) | 7 (2.3%) |
| 1 or 2 Children | 116 (98.3%) | 2 (1.7%) |
| 3 or 4 Children | 47 (100.0%) | 0 (0.0%) |
| 5 or more Children | 9 (100.0%) | 0 (0.0%) |
| Total | 470 (98.1%) | 9 (1.9%) |
Income Below Poverty Among Single-Parent Households in Miner County
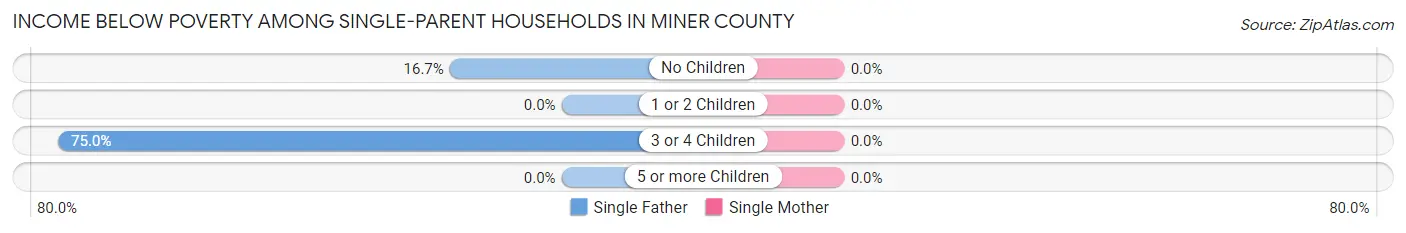
| Children | Single Father | Single Mother |
| No Children | 2 (16.7%) | 0 (0.0%) |
| 1 or 2 Children | 0 (0.0%) | 0 (0.0%) |
| 3 or 4 Children | 18 (75.0%) | 0 (0.0%) |
| 5 or more Children | 0 (0.0%) | 0 (0.0%) |
| Total | 20 (37.0%) | 0 (0.0%) |
Income Below Poverty Among Married-Couple vs Single-Parent Households in Miner County
The poverty data for Miner County shows that 9 of the married-couple family households (1.9%) and 20 of the single-parent households (21.7%) are living below the poverty level. Within the married-couple family households, those with no children have the highest poverty rate, with 7 households (2.3%) falling below the poverty line. Among the single-parent households, those with 3 or 4 children have the highest poverty rate, with 18 household (75.0%) living below poverty.

| Children | Married-Couple Families | Single-Parent Households |
| No Children | 7 (2.3%) | 2 (8.0%) |
| 1 or 2 Children | 2 (1.7%) | 0 (0.0%) |
| 3 or 4 Children | 0 (0.0%) | 18 (75.0%) |
| 5 or more Children | 0 (0.0%) | 0 (0.0%) |
| Total | 9 (1.9%) | 20 (21.7%) |
Employment Characteristics in Miner County
Employment by Class of Employer in Miner County
Among the 1,111 employed individuals in Miner County, private company employees (568 | 51.1%), not-for-profit organizations (172 | 15.5%), and self-employed (not incorporated) (170 | 15.3%) make up the most common classes of employment.
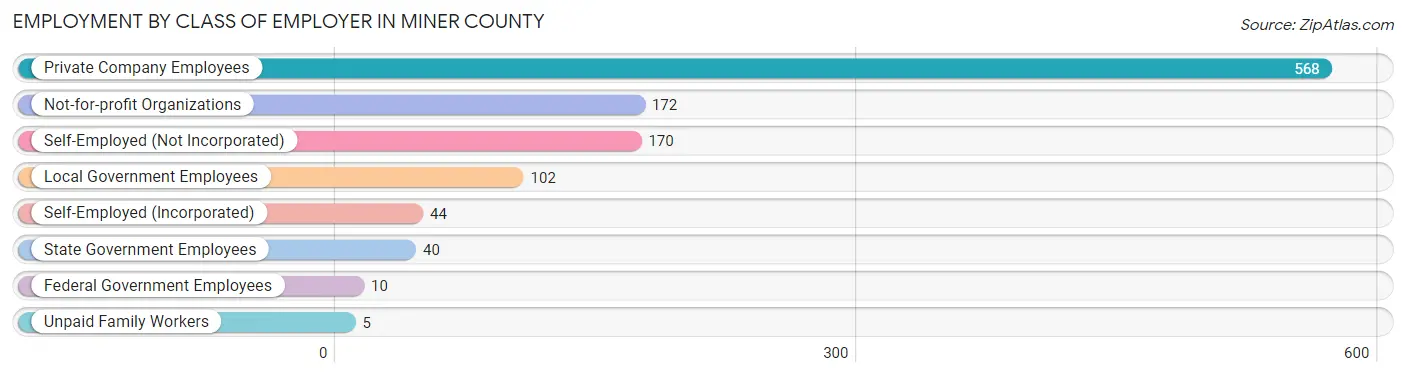
| Employer Class | # Employees | % Employees |
| Private Company Employees | 568 | 51.1% |
| Self-Employed (Incorporated) | 44 | 4.0% |
| Self-Employed (Not Incorporated) | 170 | 15.3% |
| Not-for-profit Organizations | 172 | 15.5% |
| Local Government Employees | 102 | 9.2% |
| State Government Employees | 40 | 3.6% |
| Federal Government Employees | 10 | 0.9% |
| Unpaid Family Workers | 5 | 0.4% |
| Total | 1,111 | 100.0% |
Employment Status by Age in Miner County
According to the labor force statistics for Miner County, out of the total population over 16 years of age (1,895), 60.1% or 1,139 individuals are in the labor force, with 1.4% or 16 of them unemployed. The age group with the highest labor force participation rate is 30 to 34 years, with 100.0% or 109 individuals in the labor force. Within the labor force, the 16 to 19 years age range has the highest percentage of unemployed individuals, with 19.1% or 9 of them being unemployed.

| Age Bracket | In Labor Force | Unemployed |
| 16 to 19 Years | 47 (35.6%) | 9 (19.1%) |
| 20 to 24 Years | 51 (50.0%) | 0 (0.0%) |
| 25 to 29 Years | 68 (66.0%) | 0 (0.0%) |
| 30 to 34 Years | 109 (100.0%) | 0 (0.0%) |
| 35 to 44 Years | 192 (97.5%) | 0 (0.0%) |
| 45 to 54 Years | 216 (76.6%) | 2 (0.9%) |
| 55 to 59 Years | 160 (85.1%) | 0 (0.0%) |
| 60 to 64 Years | 155 (69.5%) | 5 (3.2%) |
| 65 to 74 Years | 122 (38.0%) | 0 (0.0%) |
| 75 Years and over | 18 (7.6%) | 0 (0.0%) |
| Total | 1,139 (60.1%) | 16 (1.4%) |
Employment Status by Educational Attainment in Miner County
According to labor force statistics for Miner County, 81.7% of individuals (900) out of the total population between 25 and 64 years of age (1,102) are in the labor force, with 0.8% or 7 of them being unemployed. The group with the highest labor force participation rate are those with the educational attainment of bachelor's degree or higher, with 94.1% or 160 individuals in the labor force. Within the labor force, individuals with high school diploma education have the highest percentage of unemployment, with 2.0% or 7 of them being unemployed.

| Educational Attainment | In Labor Force | Unemployed |
| Less than High School | 68 (66.0%) | 0 (0.0%) |
| High School Diploma | 353 (81.9%) | 9 (2.0%) |
| College / Associate Degree | 319 (80.2%) | 0 (0.0%) |
| Bachelor's Degree or higher | 160 (94.1%) | 0 (0.0%) |
| Total | 900 (81.7%) | 9 (0.8%) |
Employment Occupations by Sex in Miner County
Management, Business, Science and Arts Occupations
The most common Management, Business, Science and Arts occupations in Miner County are Management (177 | 15.8%), Community & Social Service (118 | 10.5%), Education Instruction & Library (82 | 7.3%), Health Diagnosing & Treating (70 | 6.2%), and Business & Financial (45 | 4.0%).
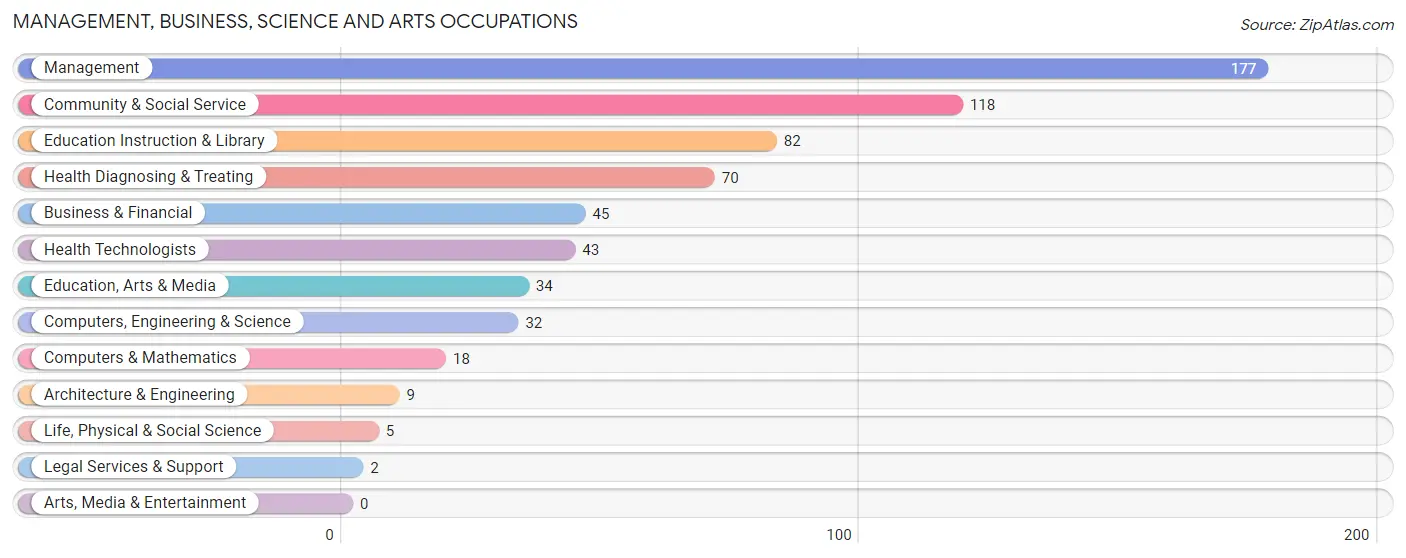
Management, Business, Science and Arts Occupations by Sex
Within the Management, Business, Science and Arts occupations in Miner County, the most male-oriented occupations are Life, Physical & Social Science (100.0%), Legal Services & Support (100.0%), and Management (75.7%), while the most female-oriented occupations are Health Diagnosing & Treating (100.0%), Health Technologists (100.0%), and Education Instruction & Library (98.8%).

| Occupation | Male | Female |
| Management | 134 (75.7%) | 43 (24.3%) |
| Business & Financial | 12 (26.7%) | 33 (73.3%) |
| Computers, Engineering & Science | 19 (59.4%) | 13 (40.6%) |
| Computers & Mathematics | 12 (66.7%) | 6 (33.3%) |
| Architecture & Engineering | 2 (22.2%) | 7 (77.8%) |
| Life, Physical & Social Science | 5 (100.0%) | 0 (0.0%) |
| Community & Social Service | 23 (19.5%) | 95 (80.5%) |
| Education, Arts & Media | 20 (58.8%) | 14 (41.2%) |
| Legal Services & Support | 2 (100.0%) | 0 (0.0%) |
| Education Instruction & Library | 1 (1.2%) | 81 (98.8%) |
| Arts, Media & Entertainment | 0 (0.0%) | 0 (0.0%) |
| Health Diagnosing & Treating | 0 (0.0%) | 70 (100.0%) |
| Health Technologists | 0 (0.0%) | 43 (100.0%) |
| Total (Category) | 188 (42.5%) | 254 (57.5%) |
| Total (Overall) | 589 (52.5%) | 533 (47.5%) |
Services Occupations
The most common Services occupations in Miner County are Healthcare Support (49 | 4.4%), Food Preparation & Serving (38 | 3.4%), Cleaning & Maintenance (29 | 2.6%), Personal Care & Service (16 | 1.4%), and Security & Protection (9 | 0.8%).

Services Occupations by Sex
Within the Services occupations in Miner County, the most male-oriented occupations are Security & Protection (100.0%), Law Enforcement (100.0%), and Cleaning & Maintenance (100.0%), while the most female-oriented occupations are Healthcare Support (100.0%), Personal Care & Service (100.0%), and Food Preparation & Serving (86.8%).
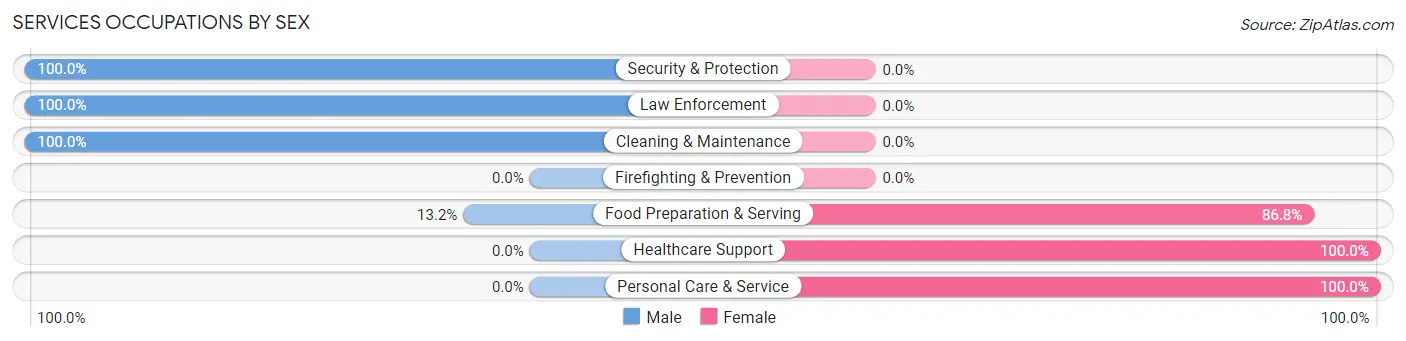
| Occupation | Male | Female |
| Healthcare Support | 0 (0.0%) | 49 (100.0%) |
| Security & Protection | 9 (100.0%) | 0 (0.0%) |
| Firefighting & Prevention | 0 (0.0%) | 0 (0.0%) |
| Law Enforcement | 9 (100.0%) | 0 (0.0%) |
| Food Preparation & Serving | 5 (13.2%) | 33 (86.8%) |
| Cleaning & Maintenance | 29 (100.0%) | 0 (0.0%) |
| Personal Care & Service | 0 (0.0%) | 16 (100.0%) |
| Total (Category) | 43 (30.5%) | 98 (69.5%) |
| Total (Overall) | 589 (52.5%) | 533 (47.5%) |
Sales and Office Occupations
The most common Sales and Office occupations in Miner County are Office & Administration (125 | 11.1%), and Sales & Related (81 | 7.2%).

Sales and Office Occupations by Sex

| Occupation | Male | Female |
| Sales & Related | 48 (59.3%) | 33 (40.7%) |
| Office & Administration | 33 (26.4%) | 92 (73.6%) |
| Total (Category) | 81 (39.3%) | 125 (60.7%) |
| Total (Overall) | 589 (52.5%) | 533 (47.5%) |
Natural Resources, Construction and Maintenance Occupations
The most common Natural Resources, Construction and Maintenance occupations in Miner County are Installation, Maintenance & Repair (65 | 5.8%), Construction & Extraction (34 | 3.0%), and Farming, Fishing & Forestry (20 | 1.8%).

Natural Resources, Construction and Maintenance Occupations by Sex

| Occupation | Male | Female |
| Farming, Fishing & Forestry | 20 (100.0%) | 0 (0.0%) |
| Construction & Extraction | 34 (100.0%) | 0 (0.0%) |
| Installation, Maintenance & Repair | 65 (100.0%) | 0 (0.0%) |
| Total (Category) | 119 (100.0%) | 0 (0.0%) |
| Total (Overall) | 589 (52.5%) | 533 (47.5%) |
Production, Transportation and Moving Occupations
The most common Production, Transportation and Moving occupations in Miner County are Production (147 | 13.1%), Transportation (50 | 4.5%), and Material Moving (17 | 1.5%).

Production, Transportation and Moving Occupations by Sex
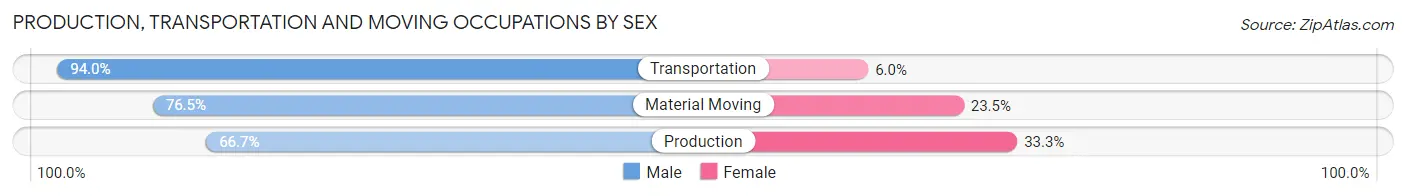
| Occupation | Male | Female |
| Production | 98 (66.7%) | 49 (33.3%) |
| Transportation | 47 (94.0%) | 3 (6.0%) |
| Material Moving | 13 (76.5%) | 4 (23.5%) |
| Total (Category) | 158 (73.8%) | 56 (26.2%) |
| Total (Overall) | 589 (52.5%) | 533 (47.5%) |
Employment Industries by Sex in Miner County
Employment Industries in Miner County
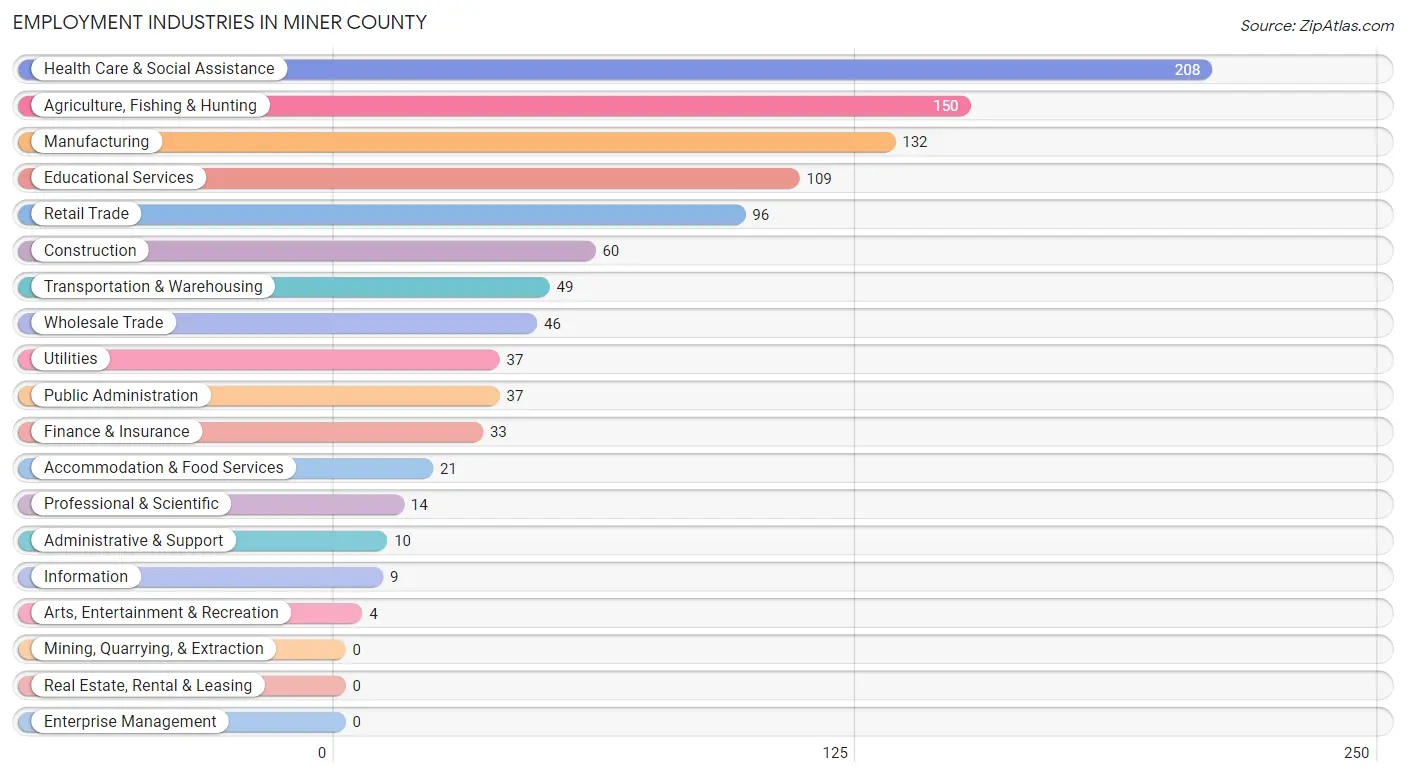
The major employment industries in Miner County include Health Care & Social Assistance (208 | 18.5%), Agriculture, Fishing & Hunting (150 | 13.4%), Manufacturing (132 | 11.8%), Educational Services (109 | 9.7%), and Retail Trade (96 | 8.6%).
Employment Industries by Sex in Miner County
The Miner County industries that see more men than women are Utilities (100.0%), Arts, Entertainment & Recreation (100.0%), and Agriculture, Fishing & Hunting (94.0%), whereas the industries that tend to have a higher number of women are Accommodation & Food Services (95.2%), Health Care & Social Assistance (91.8%), and Educational Services (90.8%).

| Industry | Male | Female |
| Agriculture, Fishing & Hunting | 141 (94.0%) | 9 (6.0%) |
| Mining, Quarrying, & Extraction | 0 (0.0%) | 0 (0.0%) |
| Construction | 53 (88.3%) | 7 (11.7%) |
| Manufacturing | 75 (56.8%) | 57 (43.2%) |
| Wholesale Trade | 40 (87.0%) | 6 (13.0%) |
| Retail Trade | 43 (44.8%) | 53 (55.2%) |
| Transportation & Warehousing | 46 (93.9%) | 3 (6.1%) |
| Utilities | 37 (100.0%) | 0 (0.0%) |
| Information | 3 (33.3%) | 6 (66.7%) |
| Finance & Insurance | 14 (42.4%) | 19 (57.6%) |
| Real Estate, Rental & Leasing | 0 (0.0%) | 0 (0.0%) |
| Professional & Scientific | 9 (64.3%) | 5 (35.7%) |
| Enterprise Management | 0 (0.0%) | 0 (0.0%) |
| Administrative & Support | 6 (60.0%) | 4 (40.0%) |
| Educational Services | 10 (9.2%) | 99 (90.8%) |
| Health Care & Social Assistance | 17 (8.2%) | 191 (91.8%) |
| Arts, Entertainment & Recreation | 4 (100.0%) | 0 (0.0%) |
| Accommodation & Food Services | 1 (4.8%) | 20 (95.2%) |
| Public Administration | 9 (24.3%) | 28 (75.7%) |
| Total | 589 (52.5%) | 533 (47.5%) |
Education in Miner County
School Enrollment in Miner County
The most common levels of schooling among the 453 students in Miner County are high school (146 | 32.2%), middle school (122 | 26.9%), and elementary school (99 | 21.8%).

| School Level | # Students | % Students |
| Nursery / Preschool | 33 | 7.3% |
| Kindergarten | 8 | 1.8% |
| Elementary School | 99 | 21.8% |
| Middle School | 122 | 26.9% |
| High School | 146 | 32.2% |
| College / Undergraduate | 35 | 7.7% |
| Graduate / Professional | 10 | 2.2% |
| Total | 453 | 100.0% |
School Enrollment by Age by Funding Source in Miner County
Out of a total of 453 students who are enrolled in schools in Miner County, 25 (5.5%) attend a private institution, while the remaining 428 (94.5%) are enrolled in public schools. The age group of 3 to 4 year olds has the highest likelihood of being enrolled in private schools, with 8 (47.1% in the age bracket) enrolled. Conversely, the age group of 10 to 14 year olds has the lowest likelihood of being enrolled in a private school, with 174 (100.0% in the age bracket) attending a public institution.

| Age Bracket | Public School | Private School |
| 3 to 4 Year Olds | 9 (52.9%) | 8 (47.1%) |
| 5 to 9 Year Old | 90 (90.0%) | 10 (10.0%) |
| 10 to 14 Year Olds | 174 (100.0%) | 0 (0.0%) |
| 15 to 17 Year Olds | 87 (92.5%) | 7 (7.4%) |
| 18 to 19 Year Olds | 32 (100.0%) | 0 (0.0%) |
| 20 to 24 Year Olds | 13 (100.0%) | 0 (0.0%) |
| 25 to 34 Year Olds | 6 (100.0%) | 0 (0.0%) |
| 35 Years and over | 17 (100.0%) | 0 (0.0%) |
| Total | 428 (94.5%) | 25 (5.5%) |
Educational Attainment by Field of Study in Miner County
Education (88 | 29.6%), science & technology (76 | 25.6%), bio, nature & agricultural (50 | 16.8%), business (27 | 9.1%), and arts & humanities (19 | 6.4%) are the most common fields of study among 297 individuals in Miner County who have obtained a bachelor's degree or higher.

| Field of Study | # Graduates | % Graduates |
| Computers & Mathematics | 6 | 2.0% |
| Bio, Nature & Agricultural | 50 | 16.8% |
| Physical & Health Sciences | 7 | 2.4% |
| Psychology | 4 | 1.3% |
| Social Sciences | 0 | 0.0% |
| Engineering | 4 | 1.3% |
| Multidisciplinary Studies | 0 | 0.0% |
| Science & Technology | 76 | 25.6% |
| Business | 27 | 9.1% |
| Education | 88 | 29.6% |
| Literature & Languages | 5 | 1.7% |
| Liberal Arts & History | 6 | 2.0% |
| Visual & Performing Arts | 0 | 0.0% |
| Communications | 5 | 1.7% |
| Arts & Humanities | 19 | 6.4% |
| Total | 297 | 100.0% |
Transportation & Commute in Miner County
Vehicle Availability by Sex in Miner County
The most prevalent vehicle ownership categories in Miner County are males with 3 vehicles (181, accounting for 30.7%) and females with 3 vehicles (151, making up 34.7%).

| Vehicles Available | Male | Female |
| No Vehicle | 29 (4.9%) | 0 (0.0%) |
| 1 Vehicle | 66 (11.2%) | 48 (9.2%) |
| 2 Vehicles | 138 (23.4%) | 142 (27.2%) |
| 3 Vehicles | 181 (30.7%) | 151 (28.9%) |
| 4 Vehicles | 61 (10.4%) | 61 (11.7%) |
| 5 or more Vehicles | 114 (19.4%) | 120 (23.0%) |
| Total | 589 (100.0%) | 522 (100.0%) |
Commute Time in Miner County
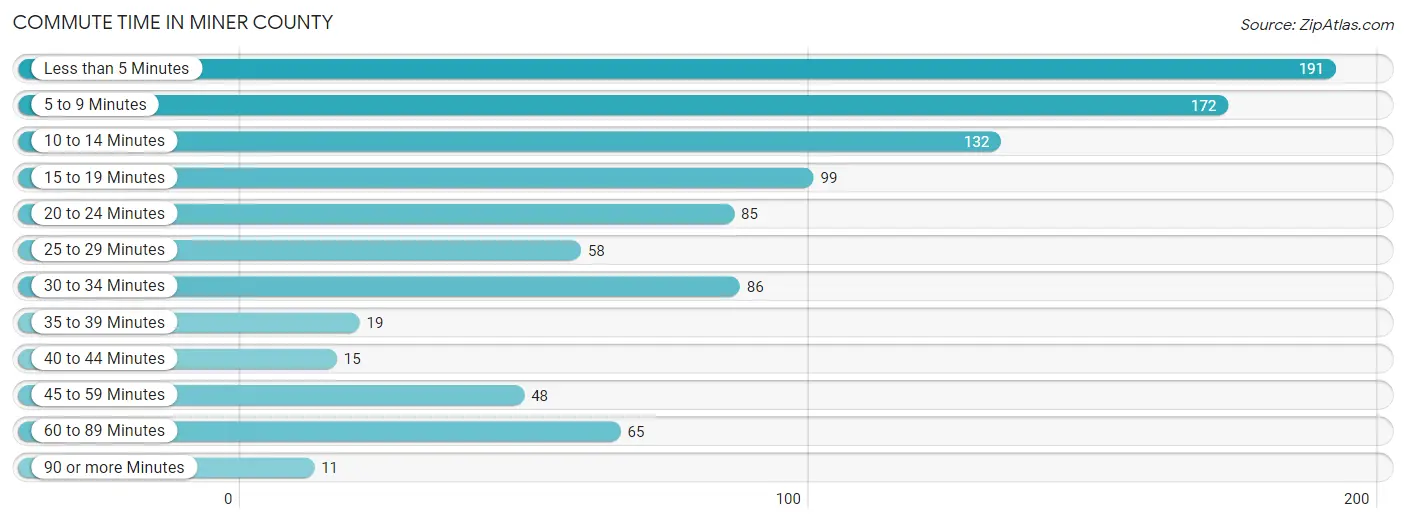
The most frequently occuring commute durations in Miner County are less than 5 minutes (191 commuters, 19.5%), 5 to 9 minutes (172 commuters, 17.5%), and 10 to 14 minutes (132 commuters, 13.5%).
| Commute Time | # Commuters | % Commuters |
| Less than 5 Minutes | 191 | 19.5% |
| 5 to 9 Minutes | 172 | 17.5% |
| 10 to 14 Minutes | 132 | 13.5% |
| 15 to 19 Minutes | 99 | 10.1% |
| 20 to 24 Minutes | 85 | 8.7% |
| 25 to 29 Minutes | 58 | 5.9% |
| 30 to 34 Minutes | 86 | 8.8% |
| 35 to 39 Minutes | 19 | 1.9% |
| 40 to 44 Minutes | 15 | 1.5% |
| 45 to 59 Minutes | 48 | 4.9% |
| 60 to 89 Minutes | 65 | 6.6% |
| 90 or more Minutes | 11 | 1.1% |
Commute Time by Sex in Miner County
The most common commute times in Miner County are less than 5 minutes (140 commuters, 27.0%) for males and 5 to 9 minutes (140 commuters, 30.2%) for females.

| Commute Time | Male | Female |
| Less than 5 Minutes | 140 (27.0%) | 51 (11.0%) |
| 5 to 9 Minutes | 32 (6.2%) | 140 (30.2%) |
| 10 to 14 Minutes | 65 (12.6%) | 67 (14.5%) |
| 15 to 19 Minutes | 48 (9.3%) | 51 (11.0%) |
| 20 to 24 Minutes | 55 (10.6%) | 30 (6.5%) |
| 25 to 29 Minutes | 36 (7.0%) | 22 (4.8%) |
| 30 to 34 Minutes | 67 (12.9%) | 19 (4.1%) |
| 35 to 39 Minutes | 5 (1.0%) | 14 (3.0%) |
| 40 to 44 Minutes | 13 (2.5%) | 2 (0.4%) |
| 45 to 59 Minutes | 13 (2.5%) | 35 (7.6%) |
| 60 to 89 Minutes | 39 (7.5%) | 26 (5.6%) |
| 90 or more Minutes | 5 (1.0%) | 6 (1.3%) |
Time of Departure to Work by Sex in Miner County
The most frequent times of departure to work in Miner County are 7:30 AM to 7:59 AM (119, 23.0%) for males and 7:30 AM to 7:59 AM (151, 32.6%) for females.

| Time of Departure | Male | Female |
| 12:00 AM to 4:59 AM | 20 (3.9%) | 3 (0.6%) |
| 5:00 AM to 5:29 AM | 79 (15.2%) | 33 (7.1%) |
| 5:30 AM to 5:59 AM | 13 (2.5%) | 19 (4.1%) |
| 6:00 AM to 6:29 AM | 42 (8.1%) | 17 (3.7%) |
| 6:30 AM to 6:59 AM | 57 (11.0%) | 16 (3.5%) |
| 7:00 AM to 7:29 AM | 49 (9.5%) | 92 (19.9%) |
| 7:30 AM to 7:59 AM | 119 (23.0%) | 151 (32.6%) |
| 8:00 AM to 8:29 AM | 70 (13.5%) | 20 (4.3%) |
| 8:30 AM to 8:59 AM | 2 (0.4%) | 18 (3.9%) |
| 9:00 AM to 9:59 AM | 7 (1.3%) | 27 (5.8%) |
| 10:00 AM to 10:59 AM | 7 (1.3%) | 7 (1.5%) |
| 11:00 AM to 11:59 AM | 1 (0.2%) | 0 (0.0%) |
| 12:00 PM to 3:59 PM | 35 (6.8%) | 28 (6.0%) |
| 4:00 PM to 11:59 PM | 17 (3.3%) | 32 (6.9%) |
| Total | 518 (100.0%) | 463 (100.0%) |
Housing Occupancy in Miner County
Occupancy by Ownership in Miner County
Of the total 910 dwellings in Miner County, owner-occupied units account for 738 (81.1%), while renter-occupied units make up 172 (18.9%).

| Occupancy | # Housing Units | % Housing Units |
| Owner Occupied Housing Units | 738 | 81.1% |
| Renter-Occupied Housing Units | 172 | 18.9% |
| Total Occupied Housing Units | 910 | 100.0% |
Occupancy by Household Size in Miner County

| Household Size | # Housing Units | % Housing Units |
| 1-Person Household | 306 | 33.6% |
| 2-Person Household | 339 | 37.2% |
| 3-Person Household | 95 | 10.4% |
| 4+ Person Household | 170 | 18.7% |
| Total Housing Units | 910 | 100.0% |
Occupancy by Ownership by Household Size in Miner County

| Household Size | Owner-occupied | Renter-occupied |
| 1-Person Household | 199 (65.0%) | 107 (35.0%) |
| 2-Person Household | 296 (87.3%) | 43 (12.7%) |
| 3-Person Household | 89 (93.7%) | 6 (6.3%) |
| 4+ Person Household | 154 (90.6%) | 16 (9.4%) |
| Total Housing Units | 738 (81.1%) | 172 (18.9%) |
Occupancy by Educational Attainment in Miner County

| Household Size | Owner-occupied | Renter-occupied |
| Less than High School | 42 (72.4%) | 16 (27.6%) |
| High School Diploma | 304 (80.6%) | 73 (19.4%) |
| College/Associate Degree | 247 (80.7%) | 59 (19.3%) |
| Bachelor's Degree or higher | 145 (85.8%) | 24 (14.2%) |
Occupancy by Age of Householder in Miner County

| Age Bracket | # Households | % Households |
| Under 35 Years | 117 | 12.9% |
| 35 to 44 Years | 106 | 11.7% |
| 45 to 54 Years | 182 | 20.0% |
| 55 to 64 Years | 199 | 21.9% |
| 65 to 74 Years | 178 | 19.6% |
| 75 to 84 Years | 75 | 8.2% |
| 85 Years and Over | 53 | 5.8% |
| Total | 910 | 100.0% |
Housing Finances in Miner County
Median Income by Occupancy in Miner County

| Occupancy Type | # Households | Median Income |
| Owner-Occupied | 738 (81.1%) | $67,750 |
| Renter-Occupied | 172 (18.9%) | $44,464 |
| Average | 910 (100.0%) | $62,037 |
Occupancy by Householder Income Bracket in Miner County

| Income Bracket | Owner-occupied | Renter-occupied |
| Less than $5,000 | 45 (6.1%) | 4 (2.3%) |
| $5,000 to $9,999 | 7 (0.9%) | 10 (5.8%) |
| $10,000 to $14,999 | 23 (3.1%) | 9 (5.2%) |
| $15,000 to $19,999 | 41 (5.6%) | 7 (4.1%) |
| $20,000 to $24,999 | 14 (1.9%) | 23 (13.4%) |
| $25,000 to $34,999 | 45 (6.1%) | 22 (12.8%) |
| $35,000 to $49,999 | 117 (15.9%) | 14 (8.1%) |
| $50,000 to $74,999 | 119 (16.1%) | 48 (27.9%) |
| $75,000 to $99,999 | 75 (10.2%) | 24 (14.0%) |
| $100,000 to $149,999 | 183 (24.8%) | 11 (6.4%) |
| $150,000 or more | 69 (9.3%) | 0 (0.0%) |
| Total | 738 (100.0%) | 172 (100.0%) |
Monthly Housing Cost Tiers in Miner County

| Monthly Cost | Owner-occupied | Renter-occupied |
| Less than $300 | 64 (8.7%) | 16 (9.3%) |
| $300 to $499 | 211 (28.6%) | 21 (12.2%) |
| $500 to $799 | 169 (22.9%) | 66 (38.4%) |
| $800 to $999 | 53 (7.2%) | 7 (4.1%) |
| $1,000 to $1,499 | 157 (21.3%) | 12 (7.0%) |
| $1,500 to $1,999 | 52 (7.0%) | 0 (0.0%) |
| $2,000 to $2,499 | 19 (2.6%) | 0 (0.0%) |
| $2,500 to $2,999 | 5 (0.7%) | 0 (0.0%) |
| $3,000 or more | 8 (1.1%) | 10 (5.8%) |
| Total | 738 (100.0%) | 172 (100.0%) |
Physical Housing Characteristics in Miner County
Housing Structures in Miner County

| Structure Type | # Housing Units | % Housing Units |
| Single Unit, Detached | 790 | 86.8% |
| Single Unit, Attached | 4 | 0.4% |
| 2 Unit Apartments | 7 | 0.8% |
| 3 or 4 Unit Apartments | 18 | 2.0% |
| 5 to 9 Unit Apartments | 32 | 3.5% |
| 10 or more Apartments | 49 | 5.4% |
| Mobile Home / Other | 10 | 1.1% |
| Total | 910 | 100.0% |
Housing Structures by Occupancy in Miner County

| Structure Type | Owner-occupied | Renter-occupied |
| Single Unit, Detached | 723 (91.5%) | 67 (8.5%) |
| Single Unit, Attached | 0 (0.0%) | 4 (100.0%) |
| 2 Unit Apartments | 0 (0.0%) | 7 (100.0%) |
| 3 or 4 Unit Apartments | 0 (0.0%) | 18 (100.0%) |
| 5 to 9 Unit Apartments | 5 (15.6%) | 27 (84.4%) |
| 10 or more Apartments | 0 (0.0%) | 49 (100.0%) |
| Mobile Home / Other | 10 (100.0%) | 0 (0.0%) |
| Total | 738 (81.1%) | 172 (18.9%) |
Housing Structures by Number of Rooms in Miner County
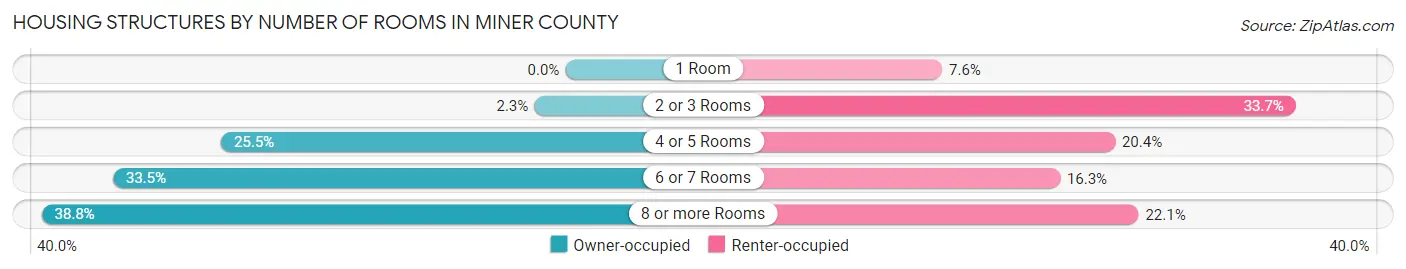
| Number of Rooms | Owner-occupied | Renter-occupied |
| 1 Room | 0 (0.0%) | 13 (7.6%) |
| 2 or 3 Rooms | 17 (2.3%) | 58 (33.7%) |
| 4 or 5 Rooms | 188 (25.5%) | 35 (20.3%) |
| 6 or 7 Rooms | 247 (33.5%) | 28 (16.3%) |
| 8 or more Rooms | 286 (38.8%) | 38 (22.1%) |
| Total | 738 (100.0%) | 172 (100.0%) |
Housing Structure by Heating Type in Miner County
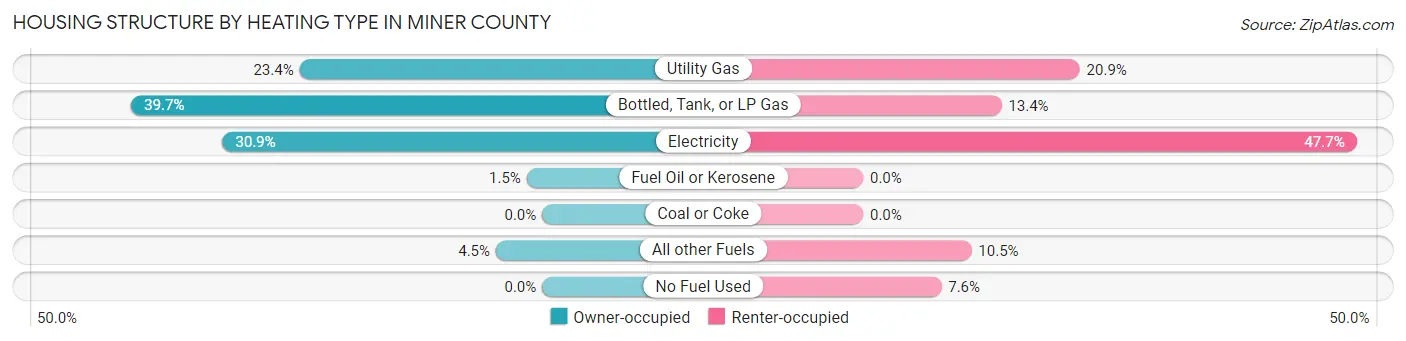
| Heating Type | Owner-occupied | Renter-occupied |
| Utility Gas | 173 (23.4%) | 36 (20.9%) |
| Bottled, Tank, or LP Gas | 293 (39.7%) | 23 (13.4%) |
| Electricity | 228 (30.9%) | 82 (47.7%) |
| Fuel Oil or Kerosene | 11 (1.5%) | 0 (0.0%) |
| Coal or Coke | 0 (0.0%) | 0 (0.0%) |
| All other Fuels | 33 (4.5%) | 18 (10.5%) |
| No Fuel Used | 0 (0.0%) | 13 (7.6%) |
| Total | 738 (100.0%) | 172 (100.0%) |
Household Vehicle Usage in Miner County

| Vehicles per Household | Owner-occupied | Renter-occupied |
| No Vehicle | 7 (0.9%) | 29 (16.9%) |
| 1 Vehicle | 108 (14.6%) | 83 (48.3%) |
| 2 Vehicles | 259 (35.1%) | 31 (18.0%) |
| 3 or more Vehicles | 364 (49.3%) | 29 (16.9%) |
| Total | 738 (100.0%) | 172 (100.0%) |
Real Estate & Mortgages in Miner County
Real Estate and Mortgage Overview in Miner County
| Characteristic | Without Mortgage | With Mortgage |
| Housing Units | 485 | 253 |
| Median Property Value | $79,500 | $118,200 |
| Median Household Income | $66,250 | $17 |
| Monthly Housing Costs | $472 | $5 |
| Real Estate Taxes | $973 | $5 |
Property Value by Mortgage Status in Miner County

| Property Value | Without Mortgage | With Mortgage |
| Less than $50,000 | 122 (25.2%) | 41 (16.2%) |
| $50,000 to $99,999 | 160 (33.0%) | 60 (23.7%) |
| $100,000 to $299,999 | 150 (30.9%) | 93 (36.8%) |
| $300,000 to $499,999 | 27 (5.6%) | 33 (13.0%) |
| $500,000 to $749,999 | 21 (4.3%) | 20 (7.9%) |
| $750,000 to $999,999 | 0 (0.0%) | 6 (2.4%) |
| $1,000,000 or more | 5 (1.0%) | 0 (0.0%) |
| Total | 485 (100.0%) | 253 (100.0%) |
Household Income by Mortgage Status in Miner County

| Household Income | Without Mortgage | With Mortgage |
| Less than $10,000 | 32 (6.6%) | 0 (0.0%) |
| $10,000 to $24,999 | 78 (16.1%) | 20 (7.9%) |
| $25,000 to $34,999 | 37 (7.6%) | 0 (0.0%) |
| $35,000 to $49,999 | 50 (10.3%) | 8 (3.2%) |
| $50,000 to $74,999 | 96 (19.8%) | 67 (26.5%) |
| $75,000 to $99,999 | 33 (6.8%) | 23 (9.1%) |
| $100,000 to $149,999 | 107 (22.1%) | 42 (16.6%) |
| $150,000 or more | 52 (10.7%) | 76 (30.0%) |
| Total | 485 (100.0%) | 253 (100.0%) |
Property Value to Household Income Ratio in Miner County

| Value-to-Income Ratio | Without Mortgage | With Mortgage |
| Less than 2.0x | 260 (53.6%) | 83,438 (32,979.5%) |
| 2.0x to 2.9x | 71 (14.6%) | 123 (48.6%) |
| 3.0x to 3.9x | 34 (7.0%) | 41 (16.2%) |
| 4.0x or more | 101 (20.8%) | 22 (8.7%) |
| Total | 485 (100.0%) | 253 (100.0%) |
Real Estate Taxes by Mortgage Status in Miner County

| Property Taxes | Without Mortgage | With Mortgage |
| Less than $800 | 177 (36.5%) | 0 (0.0%) |
| $800 to $1,499 | 161 (33.2%) | 42 (16.6%) |
| $800 to $1,499 | 137 (28.2%) | 66 (26.1%) |
| Total | 485 (100.0%) | 253 (100.0%) |
Health & Disability in Miner County
Health Insurance Coverage by Age in Miner County

| Age Bracket | With Coverage | Without Coverage |
| Under 6 Years | 134 (98.5%) | 2 (1.5%) |
| 6 to 18 Years | 359 (94.0%) | 23 (6.0%) |
| 19 to 25 Years | 161 (97.0%) | 5 (3.0%) |
| 26 to 34 Years | 161 (89.9%) | 18 (10.1%) |
| 35 to 44 Years | 183 (92.9%) | 14 (7.1%) |
| 45 to 54 Years | 200 (71.9%) | 78 (28.1%) |
| 55 to 64 Years | 358 (89.5%) | 42 (10.5%) |
| 65 to 74 Years | 318 (100.0%) | 0 (0.0%) |
| 75 Years and older | 205 (100.0%) | 0 (0.0%) |
| Total | 2,079 (91.9%) | 182 (8.1%) |
Health Insurance Coverage by Citizenship Status in Miner County

| Citizenship Status | With Coverage | Without Coverage |
| Native Born | 134 (98.5%) | 2 (1.5%) |
| Foreign Born, Citizen | 359 (94.0%) | 23 (6.0%) |
| Foreign Born, not a Citizen | 161 (97.0%) | 5 (3.0%) |
Health Insurance Coverage by Household Income in Miner County

| Household Income | With Coverage | Without Coverage |
| Under $25,000 | 220 (83.3%) | 44 (16.7%) |
| $25,000 to $49,999 | 384 (87.7%) | 54 (12.3%) |
| $50,000 to $74,999 | 317 (88.3%) | 42 (11.7%) |
| $75,000 to $99,999 | 320 (91.9%) | 28 (8.1%) |
| $100,000 and over | 838 (98.4%) | 14 (1.6%) |
Public vs Private Health Insurance Coverage by Age in Miner County
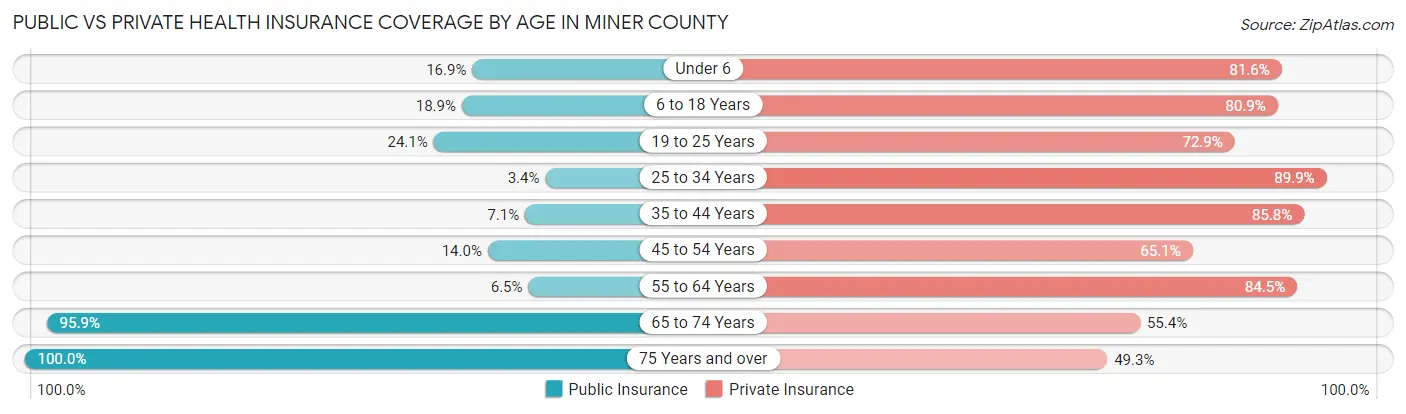
| Age Bracket | Public Insurance | Private Insurance |
| Under 6 | 23 (16.9%) | 111 (81.6%) |
| 6 to 18 Years | 72 (18.9%) | 309 (80.9%) |
| 19 to 25 Years | 40 (24.1%) | 121 (72.9%) |
| 25 to 34 Years | 6 (3.4%) | 161 (89.9%) |
| 35 to 44 Years | 14 (7.1%) | 169 (85.8%) |
| 45 to 54 Years | 39 (14.0%) | 181 (65.1%) |
| 55 to 64 Years | 26 (6.5%) | 338 (84.5%) |
| 65 to 74 Years | 305 (95.9%) | 176 (55.3%) |
| 75 Years and over | 205 (100.0%) | 101 (49.3%) |
| Total | 730 (32.3%) | 1,667 (73.7%) |
Disability Status by Sex by Age in Miner County

| Age Bracket | Male | Female |
| Under 5 Years | 0 (0.0%) | 0 (0.0%) |
| 5 to 17 Years | 13 (6.3%) | 4 (2.2%) |
| 18 to 34 Years | 18 (9.6%) | 2 (1.1%) |
| 35 to 64 Years | 92 (19.9%) | 57 (13.8%) |
| 65 to 74 Years | 66 (42.9%) | 42 (25.6%) |
| 75 Years and over | 56 (56.6%) | 56 (52.8%) |
Disability Class by Sex by Age in Miner County
Disability Class: Hearing Difficulty
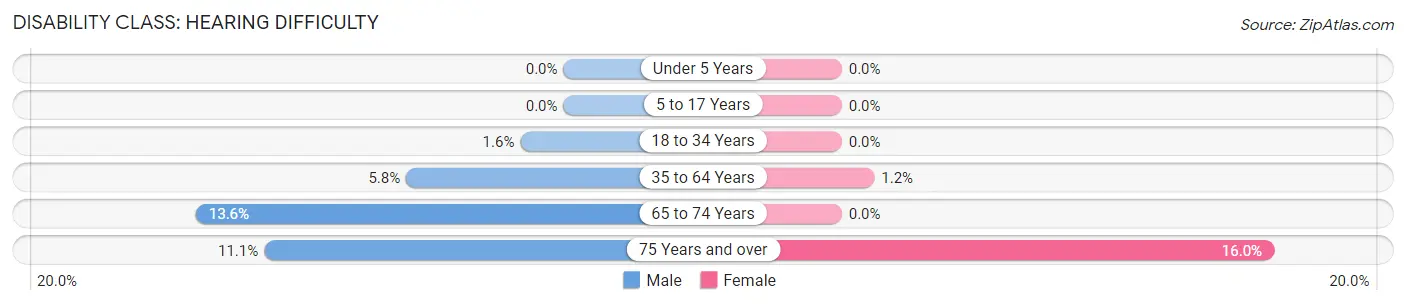
| Age Bracket | Male | Female |
| Under 5 Years | 0 (0.0%) | 0 (0.0%) |
| 5 to 17 Years | 0 (0.0%) | 0 (0.0%) |
| 18 to 34 Years | 3 (1.6%) | 0 (0.0%) |
| 35 to 64 Years | 27 (5.8%) | 5 (1.2%) |
| 65 to 74 Years | 21 (13.6%) | 0 (0.0%) |
| 75 Years and over | 11 (11.1%) | 17 (16.0%) |
Disability Class: Vision Difficulty

| Age Bracket | Male | Female |
| Under 5 Years | 0 (0.0%) | 0 (0.0%) |
| 5 to 17 Years | 7 (3.4%) | 0 (0.0%) |
| 18 to 34 Years | 0 (0.0%) | 0 (0.0%) |
| 35 to 64 Years | 0 (0.0%) | 9 (2.2%) |
| 65 to 74 Years | 5 (3.3%) | 13 (7.9%) |
| 75 Years and over | 0 (0.0%) | 15 (14.1%) |
Disability Class: Cognitive Difficulty
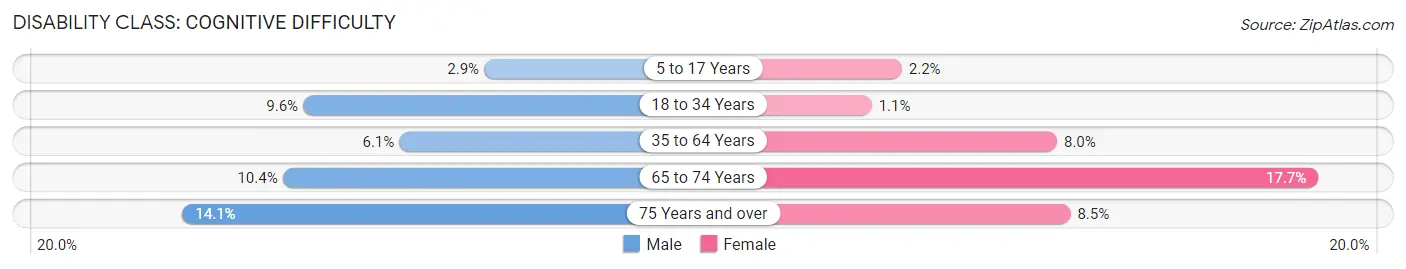
| Age Bracket | Male | Female |
| 5 to 17 Years | 6 (2.9%) | 4 (2.2%) |
| 18 to 34 Years | 18 (9.6%) | 2 (1.1%) |
| 35 to 64 Years | 28 (6.1%) | 33 (8.0%) |
| 65 to 74 Years | 16 (10.4%) | 29 (17.7%) |
| 75 Years and over | 14 (14.1%) | 9 (8.5%) |
Disability Class: Ambulatory Difficulty

| Age Bracket | Male | Female |
| 5 to 17 Years | 7 (3.4%) | 0 (0.0%) |
| 18 to 34 Years | 0 (0.0%) | 0 (0.0%) |
| 35 to 64 Years | 70 (15.1%) | 16 (3.9%) |
| 65 to 74 Years | 50 (32.5%) | 14 (8.5%) |
| 75 Years and over | 39 (39.4%) | 47 (44.3%) |
Disability Class: Self-Care Difficulty

| Age Bracket | Male | Female |
| 5 to 17 Years | 7 (3.4%) | 0 (0.0%) |
| 18 to 34 Years | 0 (0.0%) | 0 (0.0%) |
| 35 to 64 Years | 6 (1.3%) | 6 (1.5%) |
| 65 to 74 Years | 11 (7.1%) | 8 (4.9%) |
| 75 Years and over | 34 (34.3%) | 12 (11.3%) |
Technology Access in Miner County
Computing Device Access in Miner County

| Device Type | # Households | % Households |
| Desktop or Laptop | 651 | 71.5% |
| Smartphone | 755 | 83.0% |
| Tablet | 525 | 57.7% |
| No Computing Device | 68 | 7.5% |
| Total | 910 | 100.0% |
Internet Access in Miner County
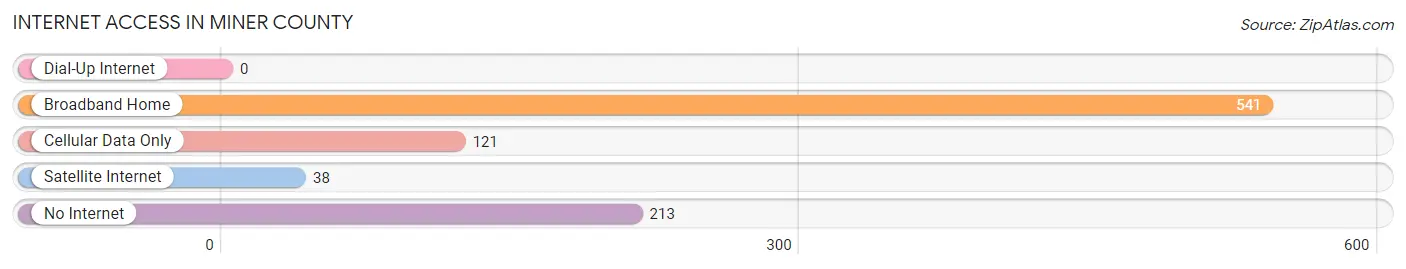
| Internet Type | # Households | % Households |
| Dial-Up Internet | 0 | 0.0% |
| Broadband Home | 541 | 59.5% |
| Cellular Data Only | 121 | 13.3% |
| Satellite Internet | 38 | 4.2% |
| No Internet | 213 | 23.4% |
| Total | 910 | 100.0% |
Miner County Summary
Miner County is located in the southeastern corner of South Dakota, and is bordered by Moody County to the north, Lake County to the east, McCook County to the south, and Hutchinson County to the west. The county seat is Howard, and the county was named after Henry Miner, a prominent early settler. As of the 2010 census, the population of Miner County was 2,921, making it the second least populous county in South Dakota.
Geography
Miner County covers an area of 576 square miles, making it the fourth smallest county in South Dakota. The terrain is mostly flat, with rolling hills in the western part of the county. The county is drained by the Big Sioux River, which flows through the northern part of the county. The county is also home to several small lakes, including Lake Madison, Lake Herman, and Lake Poinsett.
The county is located in the Coteau des Prairies, a region of rolling hills and prairies that stretches from the Minnesota border to the Missouri River. The county is mostly rural, with the majority of the population living in small towns and rural areas.
Climate
Miner County has a humid continental climate, with cold winters and hot summers. The average annual temperature is 48°F, and the average annual precipitation is 22 inches.
Demographics
As of the 2010 census, there were 2,921 people, 1,093 households, and 745 families living in Miner County. The population density was 5.1 people per square mile. The racial makeup of the county was 97.3% White, 0.3% African American, 0.3% Native American, 0.2% Asian, 0.1% Pacific Islander, 0.7% from other races, and 0.9% from two or more races. Hispanic or Latino of any race were 1.7% of the population.
The median income for a household in the county was $41,944, and the median income for a family was $50,000. The per capita income for the county was $19,945. About 8.2% of families and 11.2% of the population were below the poverty line, including 14.2% of those under age 18 and 8.3% of those age 65 or over.
Economy
Miner County is primarily an agricultural county, with the majority of the population employed in farming and related industries. The county is home to several large farms, and the main crops grown in the county are corn, soybeans, wheat, and hay. The county is also home to several small businesses, including a few restaurants, a grocery store, and a few retail stores.
The county is also home to several manufacturing companies, including a furniture manufacturer, a plastics manufacturer, and a metal fabrication company. The county is also home to a few small energy companies, including a wind farm and a solar energy company.
The county is served by two school districts, Howard-Willow Lake School District and Hanson School District. The county is also home to a few small colleges, including Dakota State University and South Dakota State University.
Conclusion
Miner County is a rural county located in the southeastern corner of South Dakota. The county is mostly agricultural, with the majority of the population employed in farming and related industries. The county is also home to several small businesses, manufacturing companies, and energy companies. The county is served by two school districts, and is home to a few small colleges.
Common Questions
What is the Total Population of Miner County?
Total Population of Miner County is 2,312.
What is the Total Male Population of Miner County?
Total Male Population of Miner County is 1,167.
What is the Total Female Population of Miner County?
Total Female Population of Miner County is 1,145.
What is the Ratio of Males per 100 Females in Miner County?
There are 101.92 Males per 100 Females in Miner County.
What is the Ratio of Females per 100 Males in Miner County?
There are 98.11 Females per 100 Males in Miner County.
What is the Median Population Age in Miner County?
Median Population Age in Miner County is 48.8 Years.
What is the Average Family Size in Miner County
Average Family Size in Miner County is 3.1 People.
What is the Average Household Size in Miner County
Average Household Size in Miner County is 2.5 People.
What is Per Capita Income in Miner County?
Per Capita income in Miner County is $32,033.
What is the Median Family Income in Miner County?
Median Family Income in Miner County is $88,011.
What is the Median Household income in Miner County?
Median Household Income in Miner County is $62,037.
What is Income or Wage Gap in Miner County?
Income or Wage Gap in Miner County is 32.9%.
Women in Miner County earn 67.1 cents for every dollar earned by a man.
What is Inequality or Gini Index in Miner County?
Inequality or Gini Index in Miner County is 0.43.
How Large is the Labor Force in Miner County?
There are 1,139 People in the Labor Forcein in Miner County.
What is the Percentage of People in the Labor Force in Miner County?
60.1% of People are in the Labor Force in Miner County.
What is the Unemployment Rate in Miner County?
Unemployment Rate in Miner County is 1.4%.