Mellette County, SD
Mellette County Map

Mellette County Overview
1,989
TOTAL POPULATION
969
MALE POPULATION
1,020
FEMALE POPULATION
95.00
MALES / 100 FEMALES
105.26
FEMALES / 100 MALES
36.3
MEDIAN AGE
4.0
AVG FAMILY SIZE
3.1
AVG HOUSEHOLD SIZE
$16,826
PER CAPITA INCOME
$50,707
AVG FAMILY INCOME
$41,397
AVG HOUSEHOLD INCOME
19.7%
WAGE / INCOME GAP [ % ]
80.3¢/ $1
WAGE / INCOME GAP [ $ ]
$16,977
FAMILY INCOME DEFICIT
0.46
INEQUALITY / GINI INDEX
703
LABOR FORCE [ PEOPLE ]
47.5%
PERCENT IN LABOR FORCE
16.5%
UNEMPLOYMENT RATE
Mellette County Area Codes
Race in Mellette County
The most populous races in Mellette County are Native / Alaskan (1,250 | 62.8%), White / Caucasian (640 | 32.2%), and Two or more Races (84 | 4.2%).

| Race | # Population | % Population |
| Asian | 0 | 0.0% |
| Black / African American | 5 | 0.3% |
| Hawaiian / Pacific | 5 | 0.3% |
| Hispanic or Latino | 13 | 0.6% |
| Native / Alaskan | 1,250 | 62.8% |
| White / Caucasian | 640 | 32.2% |
| Two or more Races | 84 | 4.2% |
| Some other Race | 5 | 0.3% |
| Total | 1,989 | 100.0% |
Ancestry in Mellette County
The most populous ancestries reported in Mellette County are Sioux (1,055 | 53.0%), German (295 | 14.8%), English (100 | 5.0%), American (70 | 3.5%), and Irish (56 | 2.8%), together accounting for 79.2% of all Mellette County residents.

| Ancestry | # Population | % Population |
| American | 70 | 3.5% |
| British | 25 | 1.3% |
| Cherokee | 8 | 0.4% |
| Czech | 5 | 0.3% |
| Czechoslovakian | 18 | 0.9% |
| Danish | 19 | 1.0% |
| Dutch | 12 | 0.6% |
| English | 100 | 5.0% |
| European | 41 | 2.1% |
| French | 22 | 1.1% |
| German | 295 | 14.8% |
| Irish | 56 | 2.8% |
| Korean | 11 | 0.5% |
| Mexican | 13 | 0.6% |
| Native Hawaiian | 5 | 0.3% |
| Navajo | 5 | 0.3% |
| Norwegian | 11 | 0.5% |
| Russian | 27 | 1.4% |
| Scotch-Irish | 3 | 0.2% |
| Sioux | 1,055 | 53.0% |
| Swedish | 39 | 2.0% |
| Swiss | 13 | 0.6% |
| Welsh | 6 | 0.3% | View All 23 Rows |
Immigrants in Mellette County

| Immigration Origin | # Population | % Population | View All 0 Rows |
Sex and Age in Mellette County
Sex and Age in Mellette County
The most populous age groups in Mellette County are 45 to 49 Years (87 | 9.0%) for men and 10 to 14 Years (109 | 10.7%) for women.
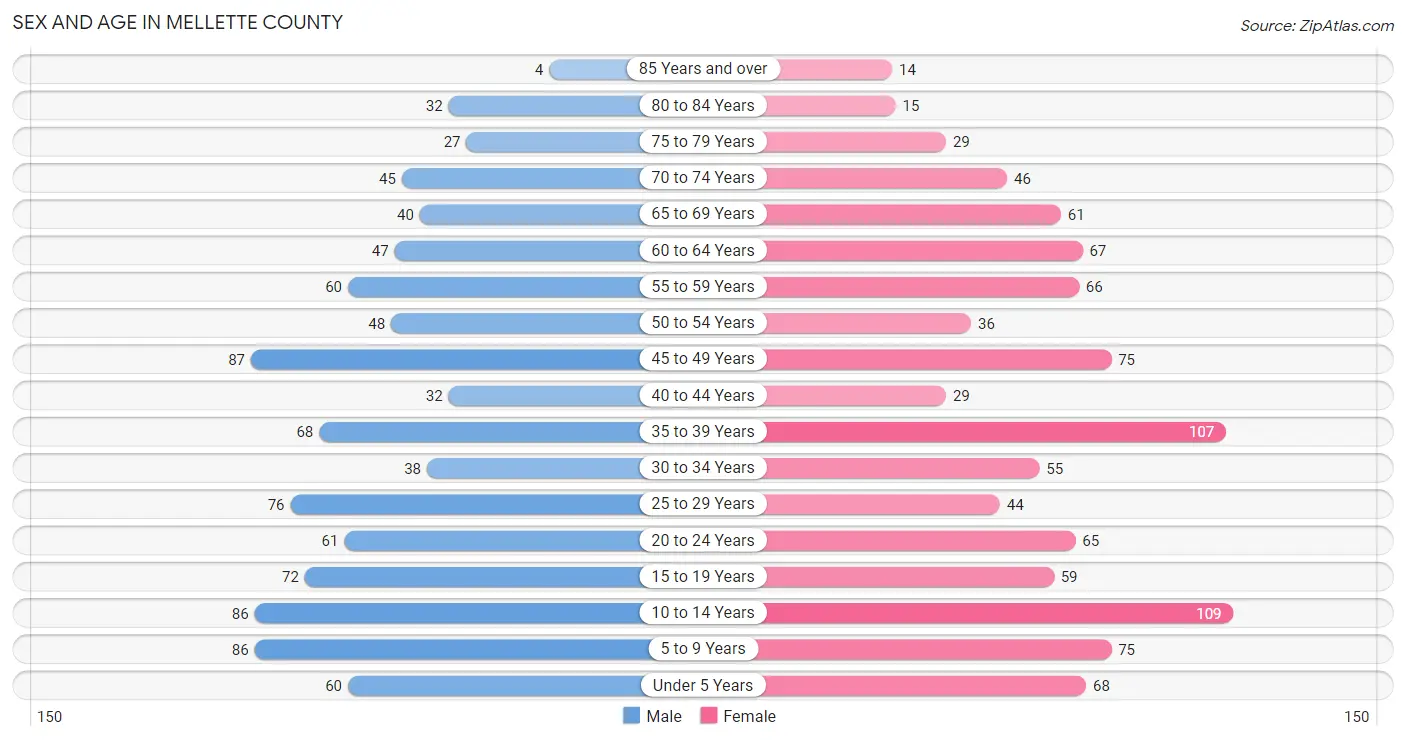
| Age Bracket | Male | Female |
| Under 5 Years | 60 (6.2%) | 68 (6.7%) |
| 5 to 9 Years | 86 (8.9%) | 75 (7.3%) |
| 10 to 14 Years | 86 (8.9%) | 109 (10.7%) |
| 15 to 19 Years | 72 (7.4%) | 59 (5.8%) |
| 20 to 24 Years | 61 (6.3%) | 65 (6.4%) |
| 25 to 29 Years | 76 (7.8%) | 44 (4.3%) |
| 30 to 34 Years | 38 (3.9%) | 55 (5.4%) |
| 35 to 39 Years | 68 (7.0%) | 107 (10.5%) |
| 40 to 44 Years | 32 (3.3%) | 29 (2.8%) |
| 45 to 49 Years | 87 (9.0%) | 75 (7.3%) |
| 50 to 54 Years | 48 (5.0%) | 36 (3.5%) |
| 55 to 59 Years | 60 (6.2%) | 66 (6.5%) |
| 60 to 64 Years | 47 (4.9%) | 67 (6.6%) |
| 65 to 69 Years | 40 (4.1%) | 61 (6.0%) |
| 70 to 74 Years | 45 (4.6%) | 46 (4.5%) |
| 75 to 79 Years | 27 (2.8%) | 29 (2.8%) |
| 80 to 84 Years | 32 (3.3%) | 15 (1.5%) |
| 85 Years and over | 4 (0.4%) | 14 (1.4%) |
| Total | 969 (100.0%) | 1,020 (100.0%) |
Families and Households in Mellette County
Median Family Size in Mellette County
The median family size in Mellette County is 4.05 persons per family, with single female/mother families (111 | 28.2%) accounting for the largest median family size of 5.97 persons per family. On the other hand, single male/father families (61 | 15.5%) represent the smallest median family size with 2.69 persons per family.

| Family Type | # Families | Family Size |
| Married-Couple | 221 (56.2%) | 3.45 |
| Single Male/Father | 61 (15.5%) | 2.69 |
| Single Female/Mother | 111 (28.2%) | 5.97 |
| Total Families | 393 (100.0%) | 4.05 |
Median Household Size in Mellette County
The median household size in Mellette County is 3.13 persons per household, with single female/mother households (111 | 17.9%) accounting for the largest median household size of 6.46 persons per household. non-family households (228 | 36.7%) represent the smallest median household size with 1.08 persons per household.

| Household Type | # Households | Household Size |
| Married-Couple | 221 (35.6%) | 3.63 |
| Single Male/Father | 61 (9.8%) | 2.92 |
| Single Female/Mother | 111 (17.9%) | 6.46 |
| Non-family | 228 (36.7%) | 1.08 |
| Total Households | 621 (100.0%) | 3.13 |
Household Size by Marriage Status in Mellette County
Out of a total of 621 households in Mellette County, 393 (63.3%) are family households, while 228 (36.7%) are nonfamily households. The most numerous type of family households are 2-person households, comprising 144, and the most common type of nonfamily households are 1-person households, comprising 212.

| Household Size | Family Households | Nonfamily Households |
| 1-Person Households | - | 212 (34.1%) |
| 2-Person Households | 144 (23.2%) | 16 (2.6%) |
| 3-Person Households | 99 (15.9%) | 0 (0.0%) |
| 4-Person Households | 68 (11.0%) | 0 (0.0%) |
| 5-Person Households | 22 (3.5%) | 0 (0.0%) |
| 6-Person Households | 21 (3.4%) | 0 (0.0%) |
| 7+ Person Households | 39 (6.3%) | 0 (0.0%) |
| Total | 393 (63.3%) | 228 (36.7%) |
Female Fertility in Mellette County
Fertility by Age in Mellette County
Average fertility rate in Mellette County is 38.0 births per 1,000 women. Women in the age bracket of 20 to 34 years have the highest fertility rate with 85.0 births per 1,000 women. Women in the age bracket of 20 to 34 years acount for 82.4% of all women with births.

| Age Bracket | Women with Births | Births / 1,000 Women |
| 15 to 19 years | 3 (17.6%) | 51.0 |
| 20 to 34 years | 14 (82.4%) | 85.0 |
| 35 to 50 years | 0 (0.0%) | 0.0 |
| Total | 17 (100.0%) | 38.0 |
Fertility by Age by Marriage Status in Mellette County
52.9% of women with births (17) in Mellette County are married. The highest percentage of unmarried women with births falls into 20 to 34 years age bracket with 57.1% of them unmarried at the time of birth, while the lowest percentage of unmarried women with births belong to 15 to 19 years age bracket with 0.0% of them unmarried.

| Age Bracket | Married | Unmarried |
| 15 to 19 years | 3 (100.0%) | 0 (0.0%) |
| 20 to 34 years | 6 (42.9%) | 8 (57.1%) |
| 35 to 50 years | 0 (0.0%) | 0 (0.0%) |
| Total | 9 (52.9%) | 8 (47.1%) |
Fertility by Education in Mellette County

| Educational Attainment | Women with Births | Births / 1,000 Women |
| Less than High School | 6 (35.3%) | 42.0 |
| High School Diploma | 5 (29.4%) | 31.0 |
| College or Associate's Degree | 6 (35.3%) | 62.0 |
| Bachelor's Degree | 0 (0.0%) | 0.0 |
| Graduate Degree | 0 (0.0%) | 0.0 |
| Total | 17 (100.0%) | 38.0 |
Fertility by Education by Marriage Status in Mellette County
47.1% of women with births in Mellette County are unmarried. Women with the educational attainment of college or associate's degree are most likely to be married with 100.0% of them married at childbirth, while women with the educational attainment of less than high school are least likely to be married with 100.0% of them unmarried at childbirth.

| Educational Attainment | Married | Unmarried |
| Less than High School | 0 (0.0%) | 6 (100.0%) |
| High School Diploma | 3 (60.0%) | 2 (40.0%) |
| College or Associate's Degree | 6 (100.0%) | 0 (0.0%) |
| Bachelor's Degree | 0 (0.0%) | 0 (0.0%) |
| Graduate Degree | 0 (0.0%) | 0 (0.0%) |
| Total | 9 (52.9%) | 8 (47.1%) |
Income in Mellette County
Income Overview in Mellette County
Per Capita Income in Mellette County is $16,826, while median incomes of families and households are $50,707 and $41,397 respectively.
| Characteristic | Number | Measure |
| Per Capita Income | 1,989 | $16,826 |
| Median Family Income | 393 | $50,707 |
| Mean Family Income | 393 | $55,805 |
| Median Household Income | 621 | $41,397 |
| Mean Household Income | 621 | $51,327 |
| Income Deficit | 393 | $16,977 |
| Wage / Income Gap (%) | 1,989 | 19.72% |
| Wage / Income Gap ($) | 1,989 | 80.28¢ per $1 |
| Gini / Inequality Index | 1,989 | 0.46 |
Earnings by Sex in Mellette County
Average Earnings in Mellette County are $28,264, $31,815 for men and $25,541 for women, a difference of 19.7%.

| Sex | Number | Average Earnings |
| Male | 341 (47.2%) | $31,815 |
| Female | 382 (52.8%) | $25,541 |
| Total | 723 (100.0%) | $28,264 |
Earnings by Sex by Income Bracket in Mellette County
The most common earnings brackets in Mellette County are $35,000 to $39,999 for men (43 | 12.6%) and $7,500 to $9,999 for women (61 | 16.0%).
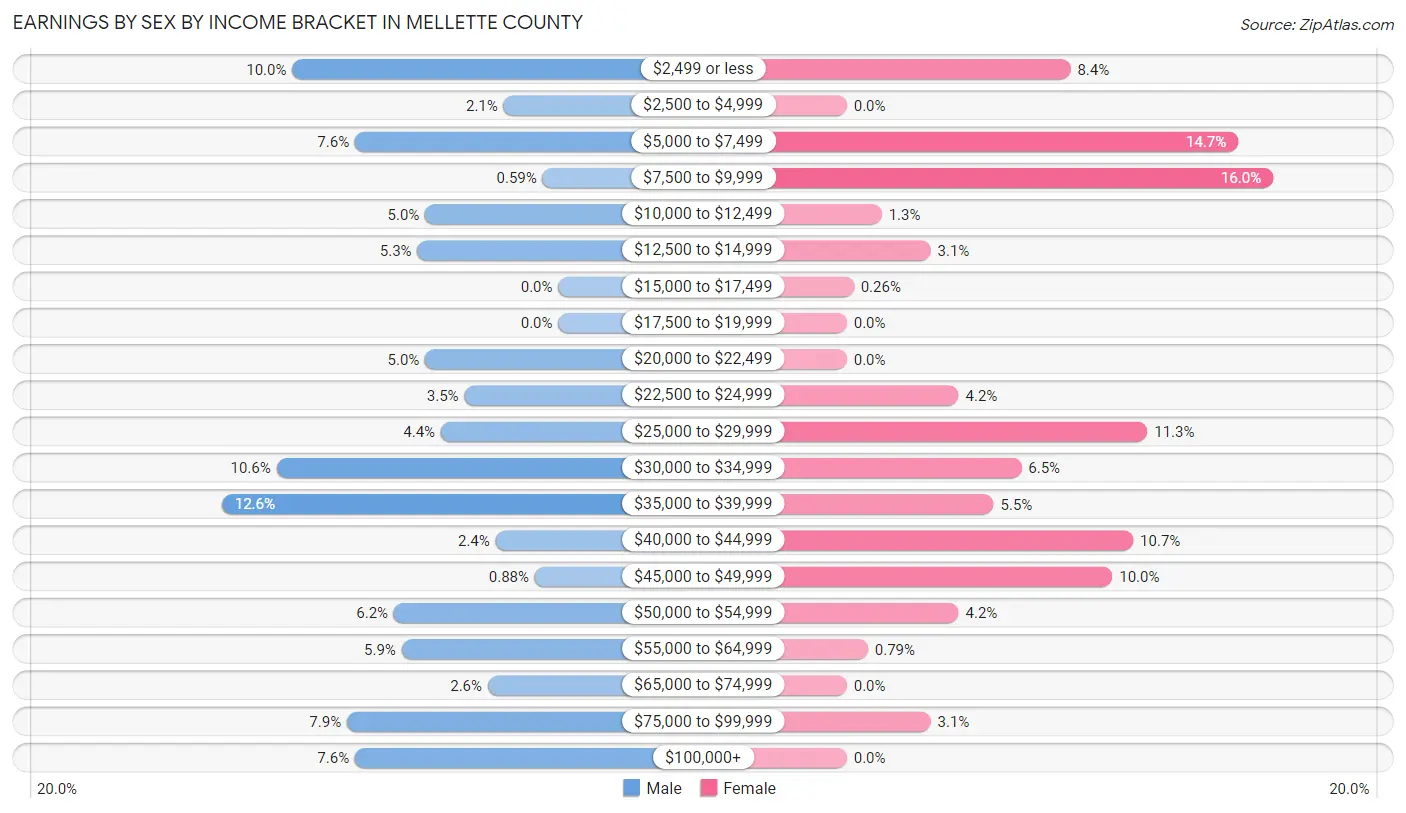
| Income | Male | Female |
| $2,499 or less | 34 (10.0%) | 32 (8.4%) |
| $2,500 to $4,999 | 7 (2.1%) | 0 (0.0%) |
| $5,000 to $7,499 | 26 (7.6%) | 56 (14.7%) |
| $7,500 to $9,999 | 2 (0.6%) | 61 (16.0%) |
| $10,000 to $12,499 | 17 (5.0%) | 5 (1.3%) |
| $12,500 to $14,999 | 18 (5.3%) | 12 (3.1%) |
| $15,000 to $17,499 | 0 (0.0%) | 1 (0.3%) |
| $17,500 to $19,999 | 0 (0.0%) | 0 (0.0%) |
| $20,000 to $22,499 | 17 (5.0%) | 0 (0.0%) |
| $22,500 to $24,999 | 12 (3.5%) | 16 (4.2%) |
| $25,000 to $29,999 | 15 (4.4%) | 43 (11.3%) |
| $30,000 to $34,999 | 36 (10.6%) | 25 (6.5%) |
| $35,000 to $39,999 | 43 (12.6%) | 21 (5.5%) |
| $40,000 to $44,999 | 8 (2.4%) | 41 (10.7%) |
| $45,000 to $49,999 | 3 (0.9%) | 38 (10.0%) |
| $50,000 to $54,999 | 21 (6.2%) | 16 (4.2%) |
| $55,000 to $64,999 | 20 (5.9%) | 3 (0.8%) |
| $65,000 to $74,999 | 9 (2.6%) | 0 (0.0%) |
| $75,000 to $99,999 | 27 (7.9%) | 12 (3.1%) |
| $100,000+ | 26 (7.6%) | 0 (0.0%) |
| Total | 341 (100.0%) | 382 (100.0%) |
Earnings by Sex by Educational Attainment in Mellette County
Average earnings in Mellette County are $35,345 for men and $27,162 for women, a difference of 23.2%. Men with an educational attainment of college or associate's degree enjoy the highest average annual earnings of $51,172, while those with high school diploma education earn the least with $30,690. Women with an educational attainment of bachelor's degree earn the most with the average annual earnings of $48,688, while those with college or associate's degree education have the smallest earnings of $26,458.

| Educational Attainment | Male Income | Female Income |
| Less than High School | $36,019 | $0 |
| High School Diploma | $30,690 | $0 |
| College or Associate's Degree | $51,172 | $26,458 |
| Bachelor's Degree | - | - |
| Graduate Degree | - | - |
| Total | $35,345 | $27,162 |
Family Income in Mellette County
Family Income Brackets in Mellette County
According to the Mellette County family income data, there are 120 families falling into the $50,000 to $74,999 income range, which is the most common income bracket and makes up 30.5% of all families. Conversely, the $200,000+ income bracket is the least frequent group with only 7 families (1.8%) belonging to this category.

| Income Bracket | # Families | % Families |
| Less than $10,000 | 60 | 15.3% |
| $10,000 to $14,999 | 28 | 7.1% |
| $15,000 to $24,999 | 24 | 6.1% |
| $25,000 to $34,999 | 33 | 8.4% |
| $35,000 to $49,999 | 30 | 7.6% |
| $50,000 to $74,999 | 120 | 30.5% |
| $75,000 to $99,999 | 37 | 9.4% |
| $100,000 to $149,999 | 40 | 10.2% |
| $150,000 to $199,999 | 14 | 3.6% |
| $200,000+ | 7 | 1.8% |
Family Income by Famaliy Size in Mellette County
3-person families (60 | 15.3%) account for the highest median family income in Mellette County with $79,643 per family, while 3-person families (60 | 15.3%) have the highest median income of $26,548 per family member.

| Income Bracket | # Families | Median Income |
| 2-Person Families | 192 (48.8%) | $51,444 |
| 3-Person Families | 60 (15.3%) | $79,643 |
| 4-Person Families | 62 (15.8%) | $0 |
| 5-Person Families | 21 (5.3%) | $27,969 |
| 6-Person Families | 19 (4.8%) | $31,250 |
| 7+ Person Families | 39 (9.9%) | $0 |
| Total | 393 (100.0%) | $50,707 |
Family Income by Number of Earners in Mellette County

| Number of Earners | # Families | Median Income |
| No Earners | 134 (34.1%) | $12,083 |
| 1 Earner | 85 (21.6%) | $51,641 |
| 2 Earners | 147 (37.4%) | $61,094 |
| 3+ Earners | 27 (6.9%) | $0 |
| Total | 393 (100.0%) | $50,707 |
Household Income in Mellette County
Household Income Brackets in Mellette County
With 105 households falling in the category, the $50,000 to $74,999 income range is the most frequent in Mellette County, accounting for 16.9% of all households. In contrast, only 7 households (1.1%) fall into the $200,000+ income bracket, making it the least populous group.

| Income Bracket | # Households | % Households |
| Less than $10,000 | 104 | 16.7% |
| $10,000 to $14,999 | 48 | 7.7% |
| $15,000 to $24,999 | 32 | 5.2% |
| $25,000 to $34,999 | 94 | 15.1% |
| $35,000 to $49,999 | 73 | 11.8% |
| $50,000 to $74,999 | 105 | 16.9% |
| $75,000 to $99,999 | 102 | 16.4% |
| $100,000 to $149,999 | 38 | 6.1% |
| $150,000 to $199,999 | 18 | 2.9% |
| $200,000+ | 7 | 1.1% |
Household Income by Householder Age in Mellette County
The median household income in Mellette County is $41,397, with the highest median household income of $47,557 found in the 65+ years age bracket for the primary householder. A total of 197 households (31.7%) fall into this category. Meanwhile, the 15 to 24 years age bracket for the primary householder has the lowest median household income of $0, with 2 households (0.3%) in this group.

| Income Bracket | # Households | Median Income |
| 15 to 24 Years | 2 (0.3%) | $0 |
| 25 to 44 Years | 163 (26.3%) | $37,321 |
| 45 to 64 Years | 259 (41.7%) | $40,875 |
| 65+ Years | 197 (31.7%) | $47,557 |
| Total | 621 (100.0%) | $41,397 |
Poverty in Mellette County
Income Below Poverty by Sex and Age in Mellette County
With 49.6% poverty level for males and 48.7% for females among the residents of Mellette County, 5 year old males and 15 year old females are the most vulnerable to poverty, with 13 males (100.0%) and 22 females (100.0%) in their respective age groups living below the poverty level.

| Age Bracket | Male | Female |
| Under 5 Years | 48 (87.3%) | 45 (70.3%) |
| 5 Years | 13 (100.0%) | 12 (70.6%) |
| 6 to 11 Years | 46 (73.0%) | 70 (66.0%) |
| 12 to 14 Years | 25 (36.2%) | 26 (46.4%) |
| 15 Years | 4 (100.0%) | 22 (100.0%) |
| 16 and 17 Years | 27 (51.9%) | 4 (21.0%) |
| 18 to 24 Years | 57 (74.0%) | 50 (60.2%) |
| 25 to 34 Years | 59 (51.7%) | 43 (43.4%) |
| 35 to 44 Years | 61 (61.0%) | 68 (50.0%) |
| 45 to 54 Years | 49 (36.3%) | 61 (58.1%) |
| 55 to 64 Years | 41 (41.8%) | 26 (20.2%) |
| 65 to 74 Years | 9 (11.4%) | 34 (32.7%) |
| 75 Years and over | 15 (26.3%) | 20 (42.5%) |
| Total | 454 (49.6%) | 481 (48.7%) |
Income Above Poverty by Sex and Age in Mellette County
According to the poverty statistics in Mellette County, males aged 65 to 74 years and females aged 55 to 64 years are the age groups that are most secure financially, with 88.6% of males and 79.8% of females in these age groups living above the poverty line.
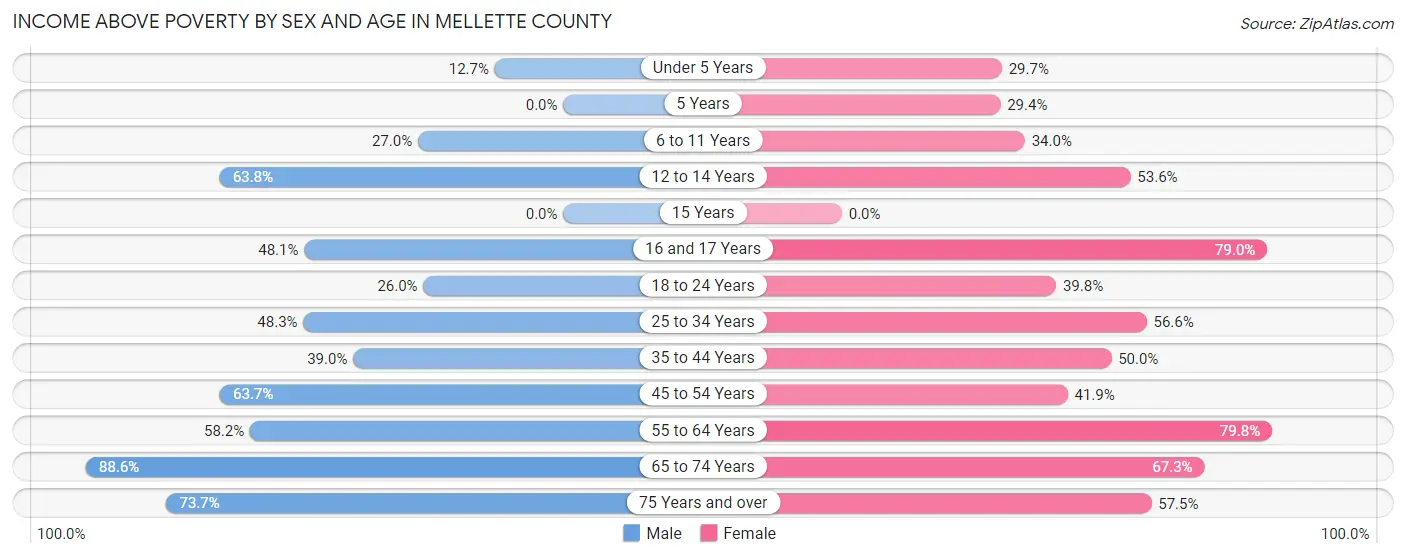
| Age Bracket | Male | Female |
| Under 5 Years | 7 (12.7%) | 19 (29.7%) |
| 5 Years | 0 (0.0%) | 5 (29.4%) |
| 6 to 11 Years | 17 (27.0%) | 36 (34.0%) |
| 12 to 14 Years | 44 (63.8%) | 30 (53.6%) |
| 15 Years | 0 (0.0%) | 0 (0.0%) |
| 16 and 17 Years | 25 (48.1%) | 15 (78.9%) |
| 18 to 24 Years | 20 (26.0%) | 33 (39.8%) |
| 25 to 34 Years | 55 (48.2%) | 56 (56.6%) |
| 35 to 44 Years | 39 (39.0%) | 68 (50.0%) |
| 45 to 54 Years | 86 (63.7%) | 44 (41.9%) |
| 55 to 64 Years | 57 (58.2%) | 103 (79.8%) |
| 65 to 74 Years | 70 (88.6%) | 70 (67.3%) |
| 75 Years and over | 42 (73.7%) | 27 (57.5%) |
| Total | 462 (50.4%) | 506 (51.3%) |
Income Below Poverty Among Married-Couple Families in Mellette County
The poverty statistics for married-couple families in Mellette County show that 19.0% or 42 of the total 221 families live below the poverty line. Families with 3 or 4 children have the highest poverty rate of 100.0%, comprising of 7 families. On the other hand, families with no children have the lowest poverty rate of 8.6%, which includes 11 families.

| Children | Above Poverty | Below Poverty |
| No Children | 117 (91.4%) | 11 (8.6%) |
| 1 or 2 Children | 48 (71.6%) | 19 (28.4%) |
| 3 or 4 Children | 0 (0.0%) | 7 (100.0%) |
| 5 or more Children | 14 (73.7%) | 5 (26.3%) |
| Total | 179 (81.0%) | 42 (19.0%) |
Income Below Poverty Among Single-Parent Households in Mellette County
According to the poverty data in Mellette County, 26.2% or 16 single-father households and 76.6% or 85 single-mother households are living below the poverty line. Among single-father households, those with 3 or 4 children have the highest poverty rate, with 7 households (58.3%) experiencing poverty. Likewise, among single-mother households, those with 3 or 4 children have the highest poverty rate, with 18 households (100.0%) falling below the poverty line.

| Children | Single Father | Single Mother |
| No Children | 4 (10.0%) | 35 (94.6%) |
| 1 or 2 Children | 5 (55.6%) | 10 (29.4%) |
| 3 or 4 Children | 7 (58.3%) | 18 (100.0%) |
| 5 or more Children | 0 (0.0%) | 22 (100.0%) |
| Total | 16 (26.2%) | 85 (76.6%) |
Income Below Poverty Among Married-Couple vs Single-Parent Households in Mellette County
The poverty data for Mellette County shows that 42 of the married-couple family households (19.0%) and 101 of the single-parent households (58.7%) are living below the poverty level. Within the married-couple family households, those with 3 or 4 children have the highest poverty rate, with 7 households (100.0%) falling below the poverty line. Among the single-parent households, those with 5 or more children have the highest poverty rate, with 22 household (100.0%) living below poverty.

| Children | Married-Couple Families | Single-Parent Households |
| No Children | 11 (8.6%) | 39 (50.6%) |
| 1 or 2 Children | 19 (28.4%) | 15 (34.9%) |
| 3 or 4 Children | 7 (100.0%) | 25 (83.3%) |
| 5 or more Children | 5 (26.3%) | 22 (100.0%) |
| Total | 42 (19.0%) | 101 (58.7%) |
Employment Characteristics in Mellette County
Employment by Class of Employer in Mellette County
Among the 587 employed individuals in Mellette County, self-employed (not incorporated) (151 | 25.7%), private company employees (129 | 22.0%), and local government employees (111 | 18.9%) make up the most common classes of employment.

| Employer Class | # Employees | % Employees |
| Private Company Employees | 129 | 22.0% |
| Self-Employed (Incorporated) | 6 | 1.0% |
| Self-Employed (Not Incorporated) | 151 | 25.7% |
| Not-for-profit Organizations | 81 | 13.8% |
| Local Government Employees | 111 | 18.9% |
| State Government Employees | 63 | 10.7% |
| Federal Government Employees | 44 | 7.5% |
| Unpaid Family Workers | 2 | 0.3% |
| Total | 587 | 100.0% |
Employment Status by Age in Mellette County
According to the labor force statistics for Mellette County, out of the total population over 16 years of age (1,479), 47.5% or 703 individuals are in the labor force, with 16.5% or 116 of them unemployed. The age group with the highest labor force participation rate is 60 to 64 years, with 60.5% or 69 individuals in the labor force. Within the labor force, the 30 to 34 years age range has the highest percentage of unemployed individuals, with 36.2% or 17 of them being unemployed.
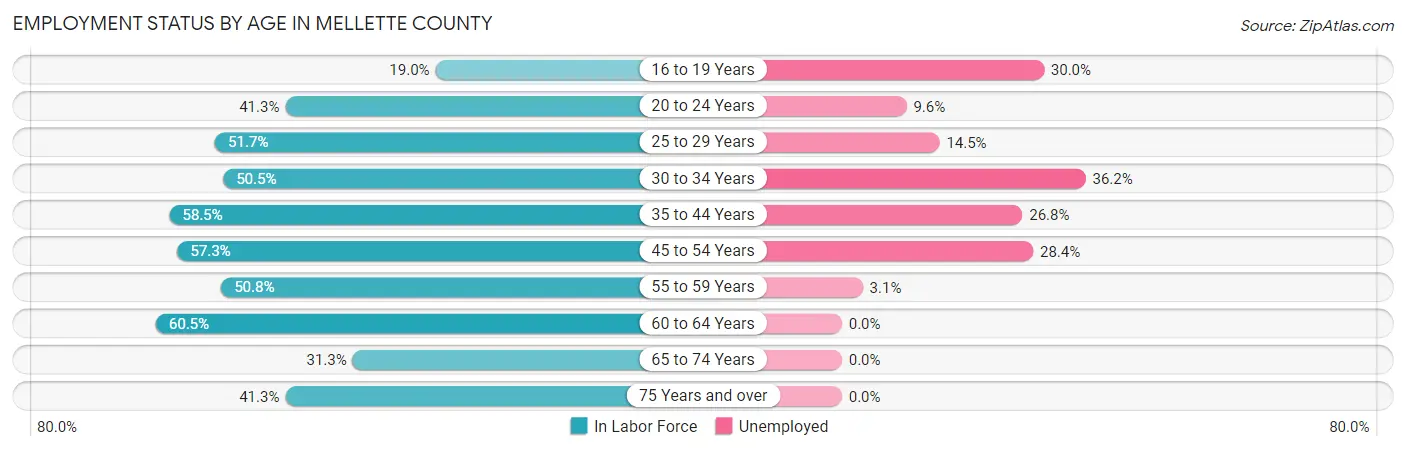
| Age Bracket | In Labor Force | Unemployed |
| 16 to 19 Years | 20 (19.0%) | 6 (30.0%) |
| 20 to 24 Years | 52 (41.3%) | 5 (9.6%) |
| 25 to 29 Years | 62 (51.7%) | 9 (14.5%) |
| 30 to 34 Years | 47 (50.5%) | 17 (36.2%) |
| 35 to 44 Years | 138 (58.5%) | 37 (26.8%) |
| 45 to 54 Years | 141 (57.3%) | 40 (28.4%) |
| 55 to 59 Years | 64 (50.8%) | 2 (3.1%) |
| 60 to 64 Years | 69 (60.5%) | 0 (0.0%) |
| 65 to 74 Years | 60 (31.3%) | 0 (0.0%) |
| 75 Years and over | 50 (41.3%) | 0 (0.0%) |
| Total | 703 (47.5%) | 116 (16.5%) |
Employment Status by Educational Attainment in Mellette County
According to labor force statistics for Mellette County, 55.7% of individuals (521) out of the total population between 25 and 64 years of age (935) are in the labor force, with 20.2% or 105 of them being unemployed. The group with the highest labor force participation rate are those with the educational attainment of bachelor's degree or higher, with 80.4% or 82 individuals in the labor force. Within the labor force, individuals with high school diploma education have the highest percentage of unemployment, with 35.2% or 62 of them being unemployed.

| Educational Attainment | In Labor Force | Unemployed |
| Less than High School | 50 (26.3%) | 38 (20.0%) |
| High School Diploma | 176 (48.6%) | 127 (35.2%) |
| College / Associate Degree | 213 (75.8%) | 30 (10.8%) |
| Bachelor's Degree or higher | 82 (80.4%) | 12 (12.2%) |
| Total | 521 (55.7%) | 189 (20.2%) |
Employment Occupations by Sex in Mellette County
Management, Business, Science and Arts Occupations
The most common Management, Business, Science and Arts occupations in Mellette County are Management (140 | 23.8%), Health Diagnosing & Treating (78 | 13.3%), Community & Social Service (66 | 11.2%), Health Technologists (42 | 7.2%), and Education Instruction & Library (38 | 6.5%).

Management, Business, Science and Arts Occupations by Sex
Within the Management, Business, Science and Arts occupations in Mellette County, the most male-oriented occupations are Computers, Engineering & Science (100.0%), Architecture & Engineering (100.0%), and Arts, Media & Entertainment (100.0%), while the most female-oriented occupations are Business & Financial (100.0%), Education, Arts & Media (100.0%), and Health Technologists (100.0%).
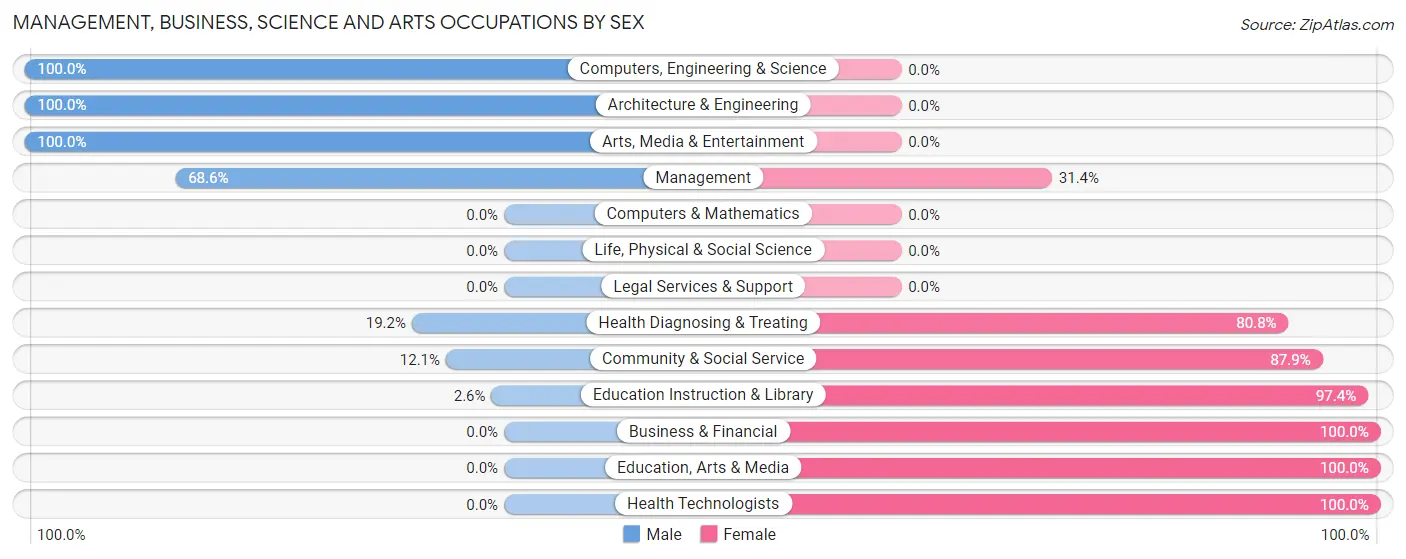
| Occupation | Male | Female |
| Management | 96 (68.6%) | 44 (31.4%) |
| Business & Financial | 0 (0.0%) | 10 (100.0%) |
| Computers, Engineering & Science | 4 (100.0%) | 0 (0.0%) |
| Computers & Mathematics | 0 (0.0%) | 0 (0.0%) |
| Architecture & Engineering | 4 (100.0%) | 0 (0.0%) |
| Life, Physical & Social Science | 0 (0.0%) | 0 (0.0%) |
| Community & Social Service | 8 (12.1%) | 58 (87.9%) |
| Education, Arts & Media | 0 (0.0%) | 21 (100.0%) |
| Legal Services & Support | 0 (0.0%) | 0 (0.0%) |
| Education Instruction & Library | 1 (2.6%) | 37 (97.4%) |
| Arts, Media & Entertainment | 7 (100.0%) | 0 (0.0%) |
| Health Diagnosing & Treating | 15 (19.2%) | 63 (80.8%) |
| Health Technologists | 0 (0.0%) | 42 (100.0%) |
| Total (Category) | 123 (41.3%) | 175 (58.7%) |
| Total (Overall) | 246 (41.9%) | 341 (58.1%) |
Services Occupations
The most common Services occupations in Mellette County are Food Preparation & Serving (55 | 9.4%), Cleaning & Maintenance (52 | 8.9%), Healthcare Support (35 | 6.0%), Personal Care & Service (22 | 3.7%), and Security & Protection (2 | 0.3%).

Services Occupations by Sex
Within the Services occupations in Mellette County, the most male-oriented occupations are Security & Protection (100.0%), Firefighting & Prevention (100.0%), and Food Preparation & Serving (30.9%), while the most female-oriented occupations are Personal Care & Service (86.4%), Healthcare Support (85.7%), and Cleaning & Maintenance (84.6%).

| Occupation | Male | Female |
| Healthcare Support | 5 (14.3%) | 30 (85.7%) |
| Security & Protection | 2 (100.0%) | 0 (0.0%) |
| Firefighting & Prevention | 2 (100.0%) | 0 (0.0%) |
| Law Enforcement | 0 (0.0%) | 0 (0.0%) |
| Food Preparation & Serving | 17 (30.9%) | 38 (69.1%) |
| Cleaning & Maintenance | 8 (15.4%) | 44 (84.6%) |
| Personal Care & Service | 3 (13.6%) | 19 (86.4%) |
| Total (Category) | 35 (21.1%) | 131 (78.9%) |
| Total (Overall) | 246 (41.9%) | 341 (58.1%) |
Sales and Office Occupations
The most common Sales and Office occupations in Mellette County are Sales & Related (42 | 7.2%), and Office & Administration (17 | 2.9%).

Sales and Office Occupations by Sex

| Occupation | Male | Female |
| Sales & Related | 32 (76.2%) | 10 (23.8%) |
| Office & Administration | 0 (0.0%) | 17 (100.0%) |
| Total (Category) | 32 (54.2%) | 27 (45.8%) |
| Total (Overall) | 246 (41.9%) | 341 (58.1%) |
Natural Resources, Construction and Maintenance Occupations
The most common Natural Resources, Construction and Maintenance occupations in Mellette County are Construction & Extraction (47 | 8.0%), Installation, Maintenance & Repair (10 | 1.7%), and Farming, Fishing & Forestry (6 | 1.0%).
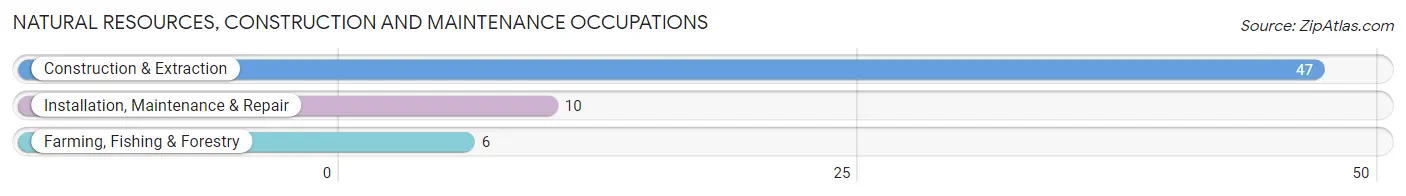
Natural Resources, Construction and Maintenance Occupations by Sex

| Occupation | Male | Female |
| Farming, Fishing & Forestry | 6 (100.0%) | 0 (0.0%) |
| Construction & Extraction | 39 (83.0%) | 8 (17.0%) |
| Installation, Maintenance & Repair | 10 (100.0%) | 0 (0.0%) |
| Total (Category) | 55 (87.3%) | 8 (12.7%) |
| Total (Overall) | 246 (41.9%) | 341 (58.1%) |
Production, Transportation and Moving Occupations
The most common Production, Transportation and Moving occupations in Mellette County are , and Transportation (1 | 0.2%).

Production, Transportation and Moving Occupations by Sex

| Occupation | Male | Female |
| Production | 0 (0.0%) | 0 (0.0%) |
| Transportation | 1 (100.0%) | 0 (0.0%) |
| Material Moving | 0 (0.0%) | 0 (0.0%) |
| Total (Category) | 1 (100.0%) | 0 (0.0%) |
| Total (Overall) | 246 (41.9%) | 341 (58.1%) |
Employment Industries by Sex in Mellette County
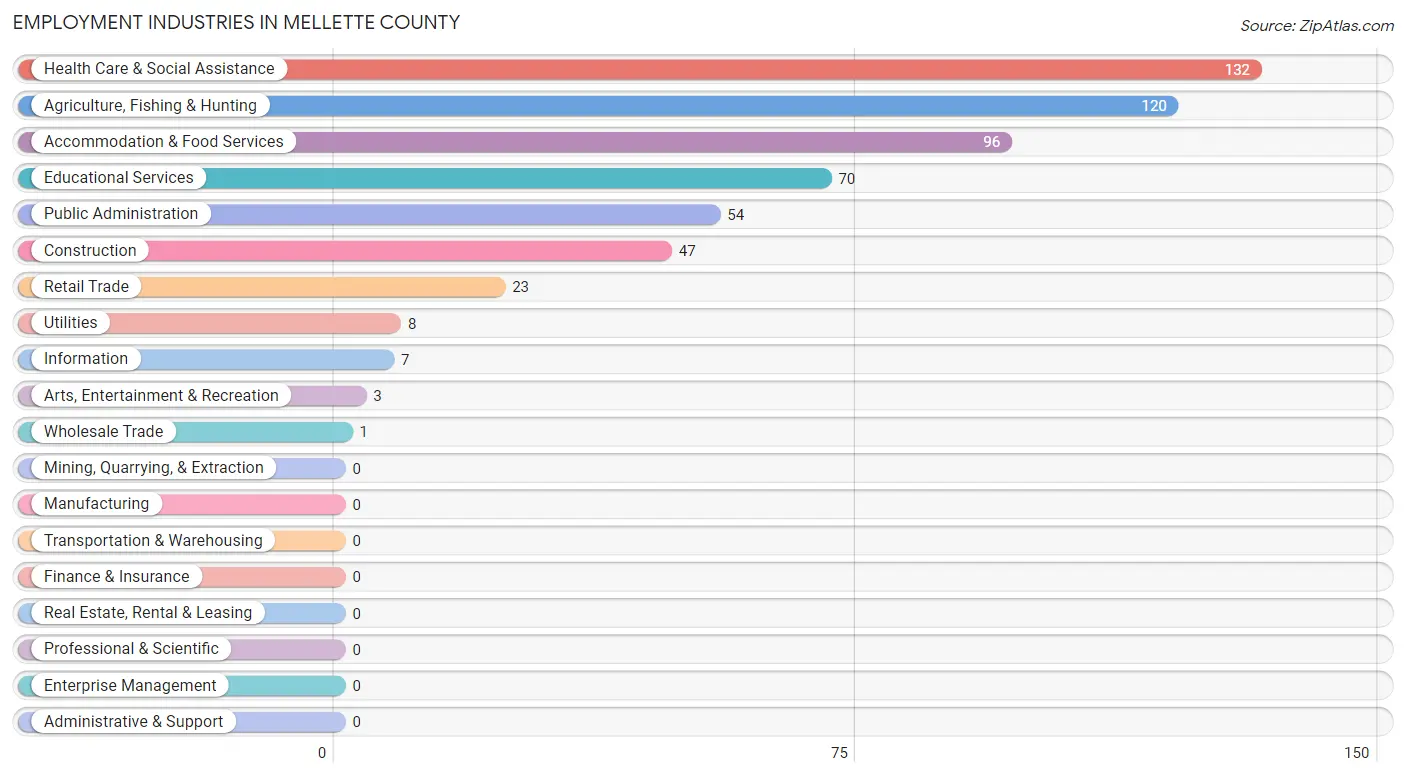
Employment Industries in Mellette County
The major employment industries in Mellette County include Health Care & Social Assistance (132 | 22.5%), Agriculture, Fishing & Hunting (120 | 20.4%), Accommodation & Food Services (96 | 16.4%), Educational Services (70 | 11.9%), and Public Administration (54 | 9.2%).
Employment Industries by Sex in Mellette County
The Mellette County industries that see more men than women are Wholesale Trade (100.0%), Information (100.0%), and Arts, Entertainment & Recreation (100.0%), whereas the industries that tend to have a higher number of women are Public Administration (90.7%), Educational Services (90.0%), and Health Care & Social Assistance (74.2%).

| Industry | Male | Female |
| Agriculture, Fishing & Hunting | 93 (77.5%) | 27 (22.5%) |
| Mining, Quarrying, & Extraction | 0 (0.0%) | 0 (0.0%) |
| Construction | 39 (83.0%) | 8 (17.0%) |
| Manufacturing | 0 (0.0%) | 0 (0.0%) |
| Wholesale Trade | 1 (100.0%) | 0 (0.0%) |
| Retail Trade | 13 (56.5%) | 10 (43.5%) |
| Transportation & Warehousing | 0 (0.0%) | 0 (0.0%) |
| Utilities | 5 (62.5%) | 3 (37.5%) |
| Information | 7 (100.0%) | 0 (0.0%) |
| Finance & Insurance | 0 (0.0%) | 0 (0.0%) |
| Real Estate, Rental & Leasing | 0 (0.0%) | 0 (0.0%) |
| Professional & Scientific | 0 (0.0%) | 0 (0.0%) |
| Enterprise Management | 0 (0.0%) | 0 (0.0%) |
| Administrative & Support | 0 (0.0%) | 0 (0.0%) |
| Educational Services | 7 (10.0%) | 63 (90.0%) |
| Health Care & Social Assistance | 34 (25.8%) | 98 (74.2%) |
| Arts, Entertainment & Recreation | 3 (100.0%) | 0 (0.0%) |
| Accommodation & Food Services | 34 (35.4%) | 62 (64.6%) |
| Public Administration | 5 (9.3%) | 49 (90.7%) |
| Total | 246 (41.9%) | 341 (58.1%) |
Education in Mellette County
School Enrollment in Mellette County
The most common levels of schooling among the 526 students in Mellette County are middle school (171 | 32.5%), elementary school (139 | 26.4%), and high school (90 | 17.1%).

| School Level | # Students | % Students |
| Nursery / Preschool | 27 | 5.1% |
| Kindergarten | 33 | 6.3% |
| Elementary School | 139 | 26.4% |
| Middle School | 171 | 32.5% |
| High School | 90 | 17.1% |
| College / Undergraduate | 58 | 11.0% |
| Graduate / Professional | 8 | 1.5% |
| Total | 526 | 100.0% |
School Enrollment by Age by Funding Source in Mellette County
Out of a total of 526 students who are enrolled in schools in Mellette County, 7 (1.3%) attend a private institution, while the remaining 519 (98.7%) are enrolled in public schools. The age group of 20 to 24 year olds has the highest likelihood of being enrolled in private schools, with 1 (3.7% in the age bracket) enrolled. Conversely, the age group of 3 to 4 year olds has the lowest likelihood of being enrolled in a private school, with 25 (100.0% in the age bracket) attending a public institution.

| Age Bracket | Public School | Private School |
| 3 to 4 Year Olds | 25 (100.0%) | 0 (0.0%) |
| 5 to 9 Year Old | 141 (100.0%) | 0 (0.0%) |
| 10 to 14 Year Olds | 189 (96.9%) | 6 (3.1%) |
| 15 to 17 Year Olds | 89 (100.0%) | 0 (0.0%) |
| 18 to 19 Year Olds | 10 (100.0%) | 0 (0.0%) |
| 20 to 24 Year Olds | 26 (96.3%) | 1 (3.7%) |
| 25 to 34 Year Olds | 9 (100.0%) | 0 (0.0%) |
| 35 Years and over | 30 (100.0%) | 0 (0.0%) |
| Total | 519 (98.7%) | 7 (1.3%) |
Educational Attainment by Field of Study in Mellette County
Education (81 | 54.4%), science & technology (29 | 19.5%), bio, nature & agricultural (22 | 14.8%), physical & health sciences (5 | 3.4%), and psychology (3 | 2.0%) are the most common fields of study among 149 individuals in Mellette County who have obtained a bachelor's degree or higher.

| Field of Study | # Graduates | % Graduates |
| Computers & Mathematics | 0 | 0.0% |
| Bio, Nature & Agricultural | 22 | 14.8% |
| Physical & Health Sciences | 5 | 3.4% |
| Psychology | 3 | 2.0% |
| Social Sciences | 0 | 0.0% |
| Engineering | 0 | 0.0% |
| Multidisciplinary Studies | 0 | 0.0% |
| Science & Technology | 29 | 19.5% |
| Business | 3 | 2.0% |
| Education | 81 | 54.4% |
| Literature & Languages | 0 | 0.0% |
| Liberal Arts & History | 0 | 0.0% |
| Visual & Performing Arts | 3 | 2.0% |
| Communications | 0 | 0.0% |
| Arts & Humanities | 3 | 2.0% |
| Total | 149 | 100.0% |
Transportation & Commute in Mellette County
Vehicle Availability by Sex in Mellette County
The most prevalent vehicle ownership categories in Mellette County are males with 3 vehicles (95, accounting for 38.6%) and females with 3 vehicles (161, making up 27.9%).

| Vehicles Available | Male | Female |
| No Vehicle | 8 (3.3%) | 0 (0.0%) |
| 1 Vehicle | 62 (25.2%) | 76 (22.3%) |
| 2 Vehicles | 36 (14.6%) | 61 (17.9%) |
| 3 Vehicles | 95 (38.6%) | 161 (47.2%) |
| 4 Vehicles | 25 (10.2%) | 35 (10.3%) |
| 5 or more Vehicles | 20 (8.1%) | 8 (2.4%) |
| Total | 246 (100.0%) | 341 (100.0%) |
Commute Time in Mellette County
The most frequently occuring commute durations in Mellette County are 5 to 9 minutes (143 commuters, 25.7%), less than 5 minutes (107 commuters, 19.2%), and 15 to 19 minutes (71 commuters, 12.8%).

| Commute Time | # Commuters | % Commuters |
| Less than 5 Minutes | 107 | 19.2% |
| 5 to 9 Minutes | 143 | 25.7% |
| 10 to 14 Minutes | 56 | 10.1% |
| 15 to 19 Minutes | 71 | 12.8% |
| 20 to 24 Minutes | 36 | 6.5% |
| 25 to 29 Minutes | 25 | 4.5% |
| 30 to 34 Minutes | 33 | 5.9% |
| 35 to 39 Minutes | 35 | 6.3% |
| 40 to 44 Minutes | 7 | 1.3% |
| 45 to 59 Minutes | 37 | 6.6% |
| 60 to 89 Minutes | 5 | 0.9% |
| 90 or more Minutes | 2 | 0.4% |
Commute Time by Sex in Mellette County
The most common commute times in Mellette County are 15 to 19 minutes (52 commuters, 23.3%) for males and 5 to 9 minutes (104 commuters, 31.1%) for females.
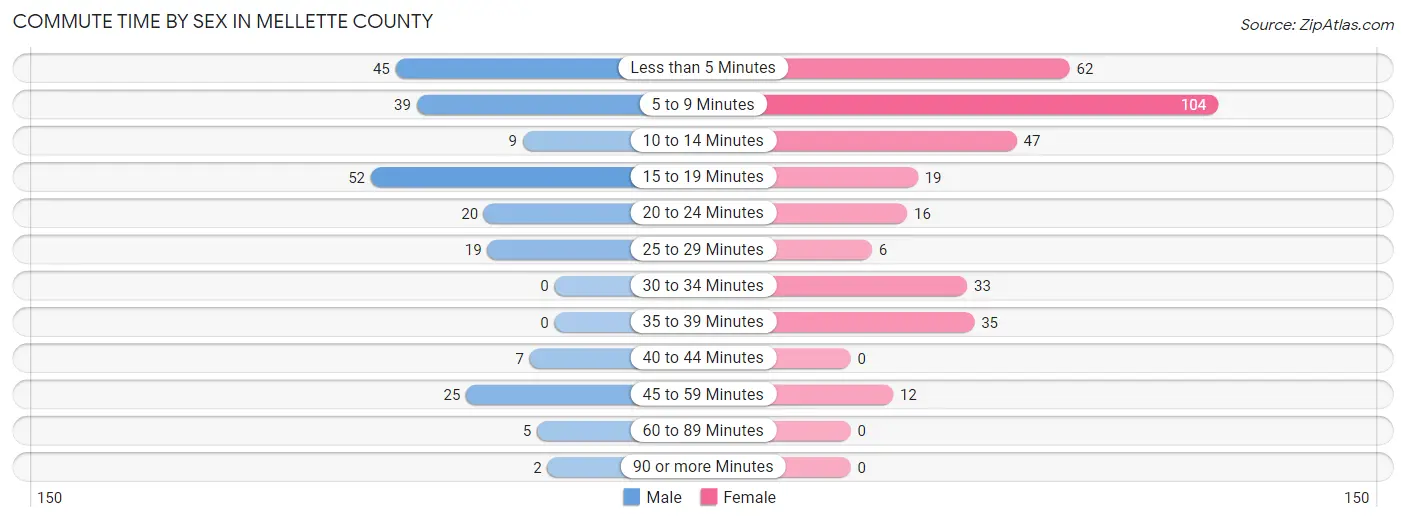
| Commute Time | Male | Female |
| Less than 5 Minutes | 45 (20.2%) | 62 (18.6%) |
| 5 to 9 Minutes | 39 (17.5%) | 104 (31.1%) |
| 10 to 14 Minutes | 9 (4.0%) | 47 (14.1%) |
| 15 to 19 Minutes | 52 (23.3%) | 19 (5.7%) |
| 20 to 24 Minutes | 20 (9.0%) | 16 (4.8%) |
| 25 to 29 Minutes | 19 (8.5%) | 6 (1.8%) |
| 30 to 34 Minutes | 0 (0.0%) | 33 (9.9%) |
| 35 to 39 Minutes | 0 (0.0%) | 35 (10.5%) |
| 40 to 44 Minutes | 7 (3.1%) | 0 (0.0%) |
| 45 to 59 Minutes | 25 (11.2%) | 12 (3.6%) |
| 60 to 89 Minutes | 5 (2.2%) | 0 (0.0%) |
| 90 or more Minutes | 2 (0.9%) | 0 (0.0%) |
Time of Departure to Work by Sex in Mellette County
The most frequent times of departure to work in Mellette County are 7:30 AM to 7:59 AM (68, 30.5%) for males and 7:00 AM to 7:29 AM (104, 31.1%) for females.
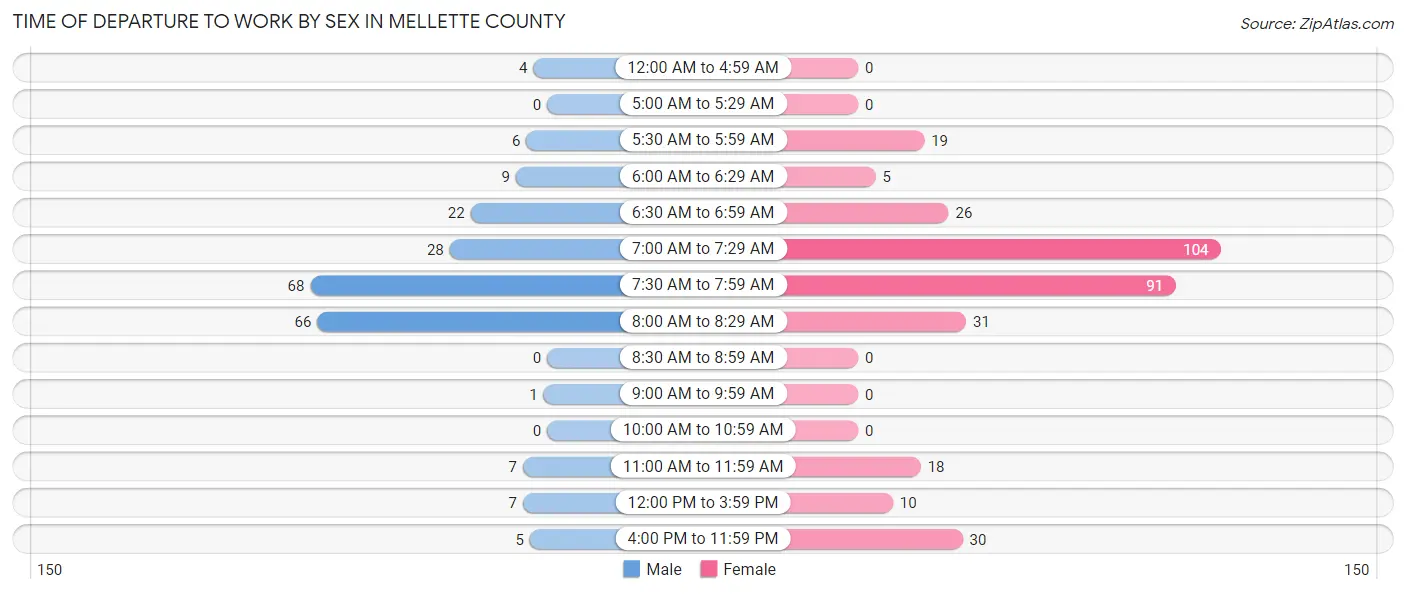
| Time of Departure | Male | Female |
| 12:00 AM to 4:59 AM | 4 (1.8%) | 0 (0.0%) |
| 5:00 AM to 5:29 AM | 0 (0.0%) | 0 (0.0%) |
| 5:30 AM to 5:59 AM | 6 (2.7%) | 19 (5.7%) |
| 6:00 AM to 6:29 AM | 9 (4.0%) | 5 (1.5%) |
| 6:30 AM to 6:59 AM | 22 (9.9%) | 26 (7.8%) |
| 7:00 AM to 7:29 AM | 28 (12.6%) | 104 (31.1%) |
| 7:30 AM to 7:59 AM | 68 (30.5%) | 91 (27.3%) |
| 8:00 AM to 8:29 AM | 66 (29.6%) | 31 (9.3%) |
| 8:30 AM to 8:59 AM | 0 (0.0%) | 0 (0.0%) |
| 9:00 AM to 9:59 AM | 1 (0.4%) | 0 (0.0%) |
| 10:00 AM to 10:59 AM | 0 (0.0%) | 0 (0.0%) |
| 11:00 AM to 11:59 AM | 7 (3.1%) | 18 (5.4%) |
| 12:00 PM to 3:59 PM | 7 (3.1%) | 10 (3.0%) |
| 4:00 PM to 11:59 PM | 5 (2.2%) | 30 (9.0%) |
| Total | 223 (100.0%) | 334 (100.0%) |
Housing Occupancy in Mellette County
Occupancy by Ownership in Mellette County
Of the total 621 dwellings in Mellette County, owner-occupied units account for 351 (56.5%), while renter-occupied units make up 270 (43.5%).

| Occupancy | # Housing Units | % Housing Units |
| Owner Occupied Housing Units | 351 | 56.5% |
| Renter-Occupied Housing Units | 270 | 43.5% |
| Total Occupied Housing Units | 621 | 100.0% |
Occupancy by Household Size in Mellette County

| Household Size | # Housing Units | % Housing Units |
| 1-Person Household | 212 | 34.1% |
| 2-Person Household | 160 | 25.8% |
| 3-Person Household | 99 | 15.9% |
| 4+ Person Household | 150 | 24.1% |
| Total Housing Units | 621 | 100.0% |
Occupancy by Ownership by Household Size in Mellette County

| Household Size | Owner-occupied | Renter-occupied |
| 1-Person Household | 97 (45.8%) | 115 (54.2%) |
| 2-Person Household | 113 (70.6%) | 47 (29.4%) |
| 3-Person Household | 63 (63.6%) | 36 (36.4%) |
| 4+ Person Household | 78 (52.0%) | 72 (48.0%) |
| Total Housing Units | 351 (56.5%) | 270 (43.5%) |
Occupancy by Educational Attainment in Mellette County

| Household Size | Owner-occupied | Renter-occupied |
| Less than High School | 22 (22.7%) | 75 (77.3%) |
| High School Diploma | 130 (58.3%) | 93 (41.7%) |
| College/Associate Degree | 137 (62.8%) | 81 (37.2%) |
| Bachelor's Degree or higher | 62 (74.7%) | 21 (25.3%) |
Occupancy by Age of Householder in Mellette County

| Age Bracket | # Households | % Households |
| Under 35 Years | 69 | 11.1% |
| 35 to 44 Years | 96 | 15.5% |
| 45 to 54 Years | 148 | 23.8% |
| 55 to 64 Years | 111 | 17.9% |
| 65 to 74 Years | 115 | 18.5% |
| 75 to 84 Years | 68 | 11.0% |
| 85 Years and Over | 14 | 2.2% |
| Total | 621 | 100.0% |
Housing Finances in Mellette County
Median Income by Occupancy in Mellette County

| Occupancy Type | # Households | Median Income |
| Owner-Occupied | 351 (56.5%) | $50,954 |
| Renter-Occupied | 270 (43.5%) | $36,786 |
| Average | 621 (100.0%) | $41,397 |
Occupancy by Householder Income Bracket in Mellette County

| Income Bracket | Owner-occupied | Renter-occupied |
| Less than $5,000 | 32 (9.1%) | 25 (9.3%) |
| $5,000 to $9,999 | 32 (9.1%) | 15 (5.6%) |
| $10,000 to $14,999 | 30 (8.6%) | 18 (6.7%) |
| $15,000 to $19,999 | 4 (1.1%) | 4 (1.5%) |
| $20,000 to $24,999 | 11 (3.1%) | 13 (4.8%) |
| $25,000 to $34,999 | 39 (11.1%) | 55 (20.4%) |
| $35,000 to $49,999 | 13 (3.7%) | 60 (22.2%) |
| $50,000 to $74,999 | 72 (20.5%) | 33 (12.2%) |
| $75,000 to $99,999 | 59 (16.8%) | 43 (15.9%) |
| $100,000 to $149,999 | 34 (9.7%) | 4 (1.5%) |
| $150,000 or more | 25 (7.1%) | 0 (0.0%) |
| Total | 351 (100.0%) | 270 (100.0%) |
Monthly Housing Cost Tiers in Mellette County

| Monthly Cost | Owner-occupied | Renter-occupied |
| Less than $300 | 64 (18.2%) | 22 (8.2%) |
| $300 to $499 | 93 (26.5%) | 37 (13.7%) |
| $500 to $799 | 88 (25.1%) | 64 (23.7%) |
| $800 to $999 | 26 (7.4%) | 9 (3.3%) |
| $1,000 to $1,499 | 55 (15.7%) | 48 (17.8%) |
| $1,500 to $1,999 | 16 (4.6%) | 0 (0.0%) |
| $2,000 to $2,499 | 0 (0.0%) | 0 (0.0%) |
| $2,500 to $2,999 | 0 (0.0%) | 0 (0.0%) |
| $3,000 or more | 9 (2.6%) | 0 (0.0%) |
| Total | 351 (100.0%) | 270 (100.0%) |
Physical Housing Characteristics in Mellette County
Housing Structures in Mellette County

| Structure Type | # Housing Units | % Housing Units |
| Single Unit, Detached | 447 | 72.0% |
| Single Unit, Attached | 0 | 0.0% |
| 2 Unit Apartments | 23 | 3.7% |
| 3 or 4 Unit Apartments | 5 | 0.8% |
| 5 to 9 Unit Apartments | 0 | 0.0% |
| 10 or more Apartments | 3 | 0.5% |
| Mobile Home / Other | 143 | 23.0% |
| Total | 621 | 100.0% |
Housing Structures by Occupancy in Mellette County

| Structure Type | Owner-occupied | Renter-occupied |
| Single Unit, Detached | 258 (57.7%) | 189 (42.3%) |
| Single Unit, Attached | 0 (0.0%) | 0 (0.0%) |
| 2 Unit Apartments | 0 (0.0%) | 23 (100.0%) |
| 3 or 4 Unit Apartments | 0 (0.0%) | 5 (100.0%) |
| 5 to 9 Unit Apartments | 0 (0.0%) | 0 (0.0%) |
| 10 or more Apartments | 0 (0.0%) | 3 (100.0%) |
| Mobile Home / Other | 93 (65.0%) | 50 (35.0%) |
| Total | 351 (56.5%) | 270 (43.5%) |
Housing Structures by Number of Rooms in Mellette County

| Number of Rooms | Owner-occupied | Renter-occupied |
| 1 Room | 3 (0.9%) | 0 (0.0%) |
| 2 or 3 Rooms | 7 (2.0%) | 17 (6.3%) |
| 4 or 5 Rooms | 169 (48.1%) | 130 (48.1%) |
| 6 or 7 Rooms | 118 (33.6%) | 119 (44.1%) |
| 8 or more Rooms | 54 (15.4%) | 4 (1.5%) |
| Total | 351 (100.0%) | 270 (100.0%) |
Housing Structure by Heating Type in Mellette County

| Heating Type | Owner-occupied | Renter-occupied |
| Utility Gas | 6 (1.7%) | 10 (3.7%) |
| Bottled, Tank, or LP Gas | 175 (49.9%) | 110 (40.7%) |
| Electricity | 99 (28.2%) | 102 (37.8%) |
| Fuel Oil or Kerosene | 19 (5.4%) | 15 (5.6%) |
| Coal or Coke | 0 (0.0%) | 0 (0.0%) |
| All other Fuels | 52 (14.8%) | 33 (12.2%) |
| No Fuel Used | 0 (0.0%) | 0 (0.0%) |
| Total | 351 (100.0%) | 270 (100.0%) |
Household Vehicle Usage in Mellette County

| Vehicles per Household | Owner-occupied | Renter-occupied |
| No Vehicle | 13 (3.7%) | 28 (10.4%) |
| 1 Vehicle | 75 (21.4%) | 141 (52.2%) |
| 2 Vehicles | 82 (23.4%) | 74 (27.4%) |
| 3 or more Vehicles | 181 (51.6%) | 27 (10.0%) |
| Total | 351 (100.0%) | 270 (100.0%) |
Real Estate & Mortgages in Mellette County
Real Estate and Mortgage Overview in Mellette County
| Characteristic | Without Mortgage | With Mortgage |
| Housing Units | 254 | 97 |
| Median Property Value | - | - |
| Median Household Income | $31,429 | $12 |
| Monthly Housing Costs | $381 | $9 |
| Real Estate Taxes | $938 | $3 |
Property Value by Mortgage Status in Mellette County

| Property Value | Without Mortgage | With Mortgage |
| Less than $50,000 | 124 (48.8%) | 19 (19.6%) |
| $50,000 to $99,999 | 77 (30.3%) | 29 (29.9%) |
| $100,000 to $299,999 | 46 (18.1%) | 34 (35.0%) |
| $300,000 to $499,999 | 7 (2.8%) | 6 (6.2%) |
| $500,000 to $749,999 | 0 (0.0%) | 9 (9.3%) |
| $750,000 to $999,999 | 0 (0.0%) | 0 (0.0%) |
| $1,000,000 or more | 0 (0.0%) | 0 (0.0%) |
| Total | 254 (100.0%) | 97 (100.0%) |
Household Income by Mortgage Status in Mellette County

| Household Income | Without Mortgage | With Mortgage |
| Less than $10,000 | 54 (21.3%) | 0 (0.0%) |
| $10,000 to $24,999 | 42 (16.5%) | 10 (10.3%) |
| $25,000 to $34,999 | 39 (15.3%) | 3 (3.1%) |
| $35,000 to $49,999 | 13 (5.1%) | 0 (0.0%) |
| $50,000 to $74,999 | 49 (19.3%) | 0 (0.0%) |
| $75,000 to $99,999 | 32 (12.6%) | 23 (23.7%) |
| $100,000 to $149,999 | 12 (4.7%) | 27 (27.8%) |
| $150,000 or more | 13 (5.1%) | 22 (22.7%) |
| Total | 254 (100.0%) | 97 (100.0%) |
Property Value to Household Income Ratio in Mellette County

| Value-to-Income Ratio | Without Mortgage | With Mortgage |
| Less than 2.0x | 163 (64.2%) | 79,732 (82,197.9%) |
| 2.0x to 2.9x | 18 (7.1%) | 50 (51.5%) |
| 3.0x to 3.9x | 8 (3.2%) | 12 (12.4%) |
| 4.0x or more | 50 (19.7%) | 16 (16.5%) |
| Total | 254 (100.0%) | 97 (100.0%) |
Real Estate Taxes by Mortgage Status in Mellette County
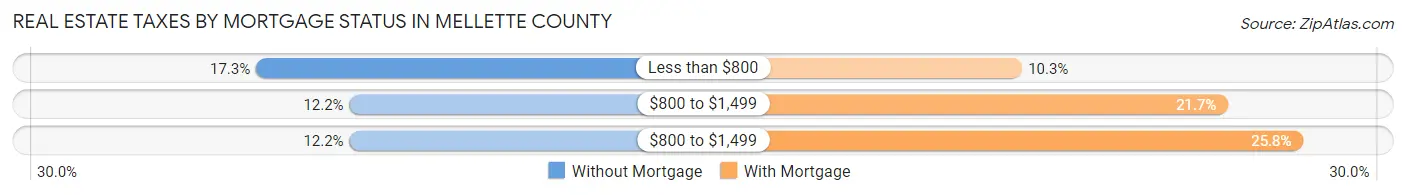
| Property Taxes | Without Mortgage | With Mortgage |
| Less than $800 | 44 (17.3%) | 10 (10.3%) |
| $800 to $1,499 | 31 (12.2%) | 21 (21.6%) |
| $800 to $1,499 | 31 (12.2%) | 25 (25.8%) |
| Total | 254 (100.0%) | 97 (100.0%) |
Health & Disability in Mellette County
Health Insurance Coverage by Age in Mellette County

| Age Bracket | With Coverage | Without Coverage |
| Under 6 Years | 155 (96.9%) | 5 (3.1%) |
| 6 to 18 Years | 417 (96.1%) | 17 (3.9%) |
| 19 to 25 Years | 35 (21.2%) | 130 (78.8%) |
| 26 to 34 Years | 94 (48.2%) | 101 (51.8%) |
| 35 to 44 Years | 97 (41.1%) | 139 (58.9%) |
| 45 to 54 Years | 140 (58.3%) | 100 (41.7%) |
| 55 to 64 Years | 157 (69.2%) | 70 (30.8%) |
| 65 to 74 Years | 183 (100.0%) | 0 (0.0%) |
| 75 Years and older | 104 (100.0%) | 0 (0.0%) |
| Total | 1,382 (71.1%) | 562 (28.9%) |
Health Insurance Coverage by Citizenship Status in Mellette County

| Citizenship Status | With Coverage | Without Coverage |
| Native Born | 155 (96.9%) | 5 (3.1%) |
| Foreign Born, Citizen | 417 (96.1%) | 17 (3.9%) |
| Foreign Born, not a Citizen | 35 (21.2%) | 130 (78.8%) |
Health Insurance Coverage by Household Income in Mellette County

| Household Income | With Coverage | Without Coverage |
| Under $25,000 | 393 (56.5%) | 303 (43.5%) |
| $25,000 to $49,999 | 343 (68.3%) | 159 (31.7%) |
| $50,000 to $74,999 | 218 (84.8%) | 39 (15.2%) |
| $75,000 to $99,999 | 194 (87.0%) | 29 (13.0%) |
| $100,000 and over | 234 (88.0%) | 32 (12.0%) |
Public vs Private Health Insurance Coverage by Age in Mellette County

| Age Bracket | Public Insurance | Private Insurance |
| Under 6 | 142 (88.7%) | 13 (8.1%) |
| 6 to 18 Years | 380 (87.6%) | 39 (9.0%) |
| 19 to 25 Years | 29 (17.6%) | 6 (3.6%) |
| 25 to 34 Years | 36 (18.5%) | 58 (29.7%) |
| 35 to 44 Years | 69 (29.2%) | 28 (11.9%) |
| 45 to 54 Years | 31 (12.9%) | 109 (45.4%) |
| 55 to 64 Years | 49 (21.6%) | 108 (47.6%) |
| 65 to 74 Years | 182 (99.5%) | 67 (36.6%) |
| 75 Years and over | 104 (100.0%) | 33 (31.7%) |
| Total | 1,022 (52.6%) | 461 (23.7%) |
Disability Status by Sex by Age in Mellette County

| Age Bracket | Male | Female |
| Under 5 Years | 0 (0.0%) | 0 (0.0%) |
| 5 to 17 Years | 0 (0.0%) | 8 (3.6%) |
| 18 to 34 Years | 0 (0.0%) | 13 (7.1%) |
| 35 to 64 Years | 32 (9.6%) | 52 (14.1%) |
| 65 to 74 Years | 10 (12.7%) | 40 (38.5%) |
| 75 Years and over | 38 (66.7%) | 6 (12.8%) |
Disability Class by Sex by Age in Mellette County
Disability Class: Hearing Difficulty

| Age Bracket | Male | Female |
| Under 5 Years | 0 (0.0%) | 0 (0.0%) |
| 5 to 17 Years | 0 (0.0%) | 0 (0.0%) |
| 18 to 34 Years | 0 (0.0%) | 0 (0.0%) |
| 35 to 64 Years | 15 (4.5%) | 11 (3.0%) |
| 65 to 74 Years | 3 (3.8%) | 14 (13.5%) |
| 75 Years and over | 3 (5.3%) | 2 (4.3%) |
Disability Class: Vision Difficulty

| Age Bracket | Male | Female |
| Under 5 Years | 0 (0.0%) | 0 (0.0%) |
| 5 to 17 Years | 0 (0.0%) | 0 (0.0%) |
| 18 to 34 Years | 0 (0.0%) | 0 (0.0%) |
| 35 to 64 Years | 12 (3.6%) | 10 (2.7%) |
| 65 to 74 Years | 0 (0.0%) | 7 (6.7%) |
| 75 Years and over | 4 (7.0%) | 0 (0.0%) |
Disability Class: Cognitive Difficulty
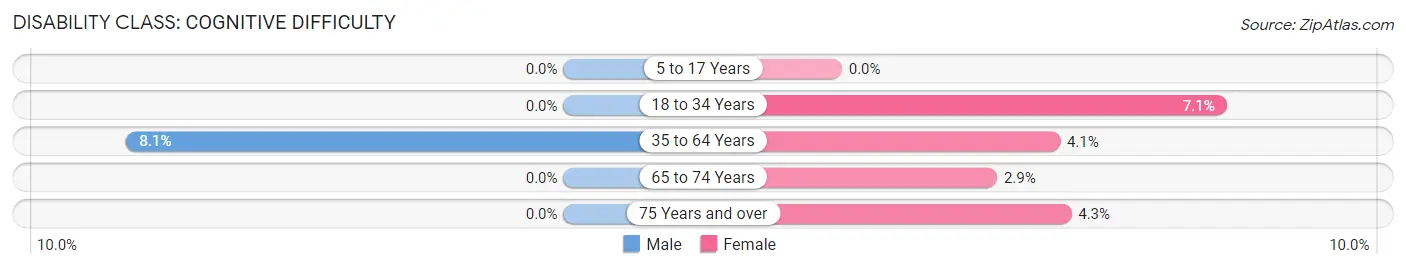
| Age Bracket | Male | Female |
| 5 to 17 Years | 0 (0.0%) | 0 (0.0%) |
| 18 to 34 Years | 0 (0.0%) | 13 (7.1%) |
| 35 to 64 Years | 27 (8.1%) | 15 (4.1%) |
| 65 to 74 Years | 0 (0.0%) | 3 (2.9%) |
| 75 Years and over | 0 (0.0%) | 2 (4.3%) |
Disability Class: Ambulatory Difficulty

| Age Bracket | Male | Female |
| 5 to 17 Years | 0 (0.0%) | 8 (3.6%) |
| 18 to 34 Years | 0 (0.0%) | 0 (0.0%) |
| 35 to 64 Years | 19 (5.7%) | 34 (9.2%) |
| 65 to 74 Years | 7 (8.9%) | 27 (26.0%) |
| 75 Years and over | 31 (54.4%) | 6 (12.8%) |
Disability Class: Self-Care Difficulty

| Age Bracket | Male | Female |
| 5 to 17 Years | 0 (0.0%) | 0 (0.0%) |
| 18 to 34 Years | 0 (0.0%) | 0 (0.0%) |
| 35 to 64 Years | 5 (1.5%) | 19 (5.1%) |
| 65 to 74 Years | 0 (0.0%) | 20 (19.2%) |
| 75 Years and over | 4 (7.0%) | 0 (0.0%) |
Technology Access in Mellette County
Computing Device Access in Mellette County

| Device Type | # Households | % Households |
| Desktop or Laptop | 375 | 60.4% |
| Smartphone | 405 | 65.2% |
| Tablet | 306 | 49.3% |
| No Computing Device | 158 | 25.4% |
| Total | 621 | 100.0% |
Internet Access in Mellette County

| Internet Type | # Households | % Households |
| Dial-Up Internet | 6 | 1.0% |
| Broadband Home | 282 | 45.4% |
| Cellular Data Only | 81 | 13.0% |
| Satellite Internet | 41 | 6.6% |
| No Internet | 228 | 36.7% |
| Total | 621 | 100.0% |
Mellette County Summary
Mellette County is located in the southwestern corner of South Dakota, and is bordered by Todd County to the north, Tripp County to the east, Gregory County to the south, and Shannon County to the west. The county seat is White River, and the county was named after Richard F. Mellette, the last territorial governor of South Dakota.
History
The area that is now Mellette County was first inhabited by the Lakota Sioux, who used the area for hunting and gathering. The first white settlers arrived in the area in the late 1800s, and the county was officially organized in 1909. The county was named after Richard F. Mellette, the last territorial governor of South Dakota.
The county was largely agricultural in its early years, with the main crops being wheat, corn, and hay. The county also had a thriving livestock industry, with cattle, sheep, and horses being raised in the area.
In the early 1900s, the county saw an influx of immigrants from Europe, particularly from Germany and Scandinavia. These immigrants brought with them their own culture and traditions, which still influence the county today.
Geography
Mellette County is located in the southwestern corner of South Dakota, and is bordered by Todd County to the north, Tripp County to the east, Gregory County to the south, and Shannon County to the west. The county covers an area of 1,845 square miles, and is mostly rural, with only a few small towns and villages.
The county is mostly flat, with rolling hills in the east and south. The White River runs through the county, and there are several small lakes and ponds scattered throughout the area. The county is also home to several wildlife refuges, including the White River National Wildlife Refuge and the Oahe Wildlife Refuge.
Economy
The economy of Mellette County is largely based on agriculture, with wheat, corn, and hay being the main crops. Livestock production is also important, with cattle, sheep, and horses being raised in the area.
The county also has a thriving tourism industry, with visitors coming to the area to enjoy the natural beauty and outdoor activities. Hunting, fishing, and camping are popular activities in the area, and there are several state parks and wildlife refuges in the county.
Demographics
As of the 2010 census, the population of Mellette County was 4,845. The population is largely white (97.2%), with small percentages of Native American (1.2%), African American (0.3%), and Asian (0.2%) residents. The median household income is $41,945, and the median age is 44.7 years.
Conclusion
Mellette County is a rural county located in the southwestern corner of South Dakota. The county is largely agricultural, with wheat, corn, and hay being the main crops. Livestock production is also important, and the county has a thriving tourism industry. The population is largely white, with small percentages of Native American, African American, and Asian residents. The median household income is $41,945, and the median age is 44.7 years.
Common Questions
What is the Total Population of Mellette County?
Total Population of Mellette County is 1,989.
What is the Total Male Population of Mellette County?
Total Male Population of Mellette County is 969.
What is the Total Female Population of Mellette County?
Total Female Population of Mellette County is 1,020.
What is the Ratio of Males per 100 Females in Mellette County?
There are 95.00 Males per 100 Females in Mellette County.
What is the Ratio of Females per 100 Males in Mellette County?
There are 105.26 Females per 100 Males in Mellette County.
What is the Median Population Age in Mellette County?
Median Population Age in Mellette County is 36.3 Years.
What is the Average Family Size in Mellette County
Average Family Size in Mellette County is 4.0 People.
What is the Average Household Size in Mellette County
Average Household Size in Mellette County is 3.1 People.
What is Per Capita Income in Mellette County?
Per Capita income in Mellette County is $16,826.
What is the Median Family Income in Mellette County?
Median Family Income in Mellette County is $50,707.
What is the Median Household income in Mellette County?
Median Household Income in Mellette County is $41,397.
What is Income or Wage Gap in Mellette County?
Income or Wage Gap in Mellette County is 19.7%.
Women in Mellette County earn 80.3 cents for every dollar earned by a man.
What is Family Income Deficit in Mellette County?
Family Income Deficit in Mellette County is $16,977.
Families that are below poverty line in Mellette County earn $16,977 less on average than the poverty threshold level.
What is Inequality or Gini Index in Mellette County?
Inequality or Gini Index in Mellette County is 0.46.
How Large is the Labor Force in Mellette County?
There are 703 People in the Labor Forcein in Mellette County.
What is the Percentage of People in the Labor Force in Mellette County?
47.5% of People are in the Labor Force in Mellette County.
What is the Unemployment Rate in Mellette County?
Unemployment Rate in Mellette County is 16.5%.