McCook County, SD
McCook County Map
McCook County Overview
5,714
TOTAL POPULATION
2,954
MALE POPULATION
2,760
FEMALE POPULATION
107.03
MALES / 100 FEMALES
93.43
FEMALES / 100 MALES
39.5
MEDIAN AGE
3.0
AVG FAMILY SIZE
2.5
AVG HOUSEHOLD SIZE
$34,242
PER CAPITA INCOME
$88,696
AVG FAMILY INCOME
$74,873
AVG HOUSEHOLD INCOME
27.9%
WAGE / INCOME GAP [ % ]
72.1¢/ $1
WAGE / INCOME GAP [ $ ]
$10,609
FAMILY INCOME DEFICIT
0.38
INEQUALITY / GINI INDEX
3,003
LABOR FORCE [ PEOPLE ]
70.3%
PERCENT IN LABOR FORCE
2.1%
UNEMPLOYMENT RATE
McCook County Area Codes
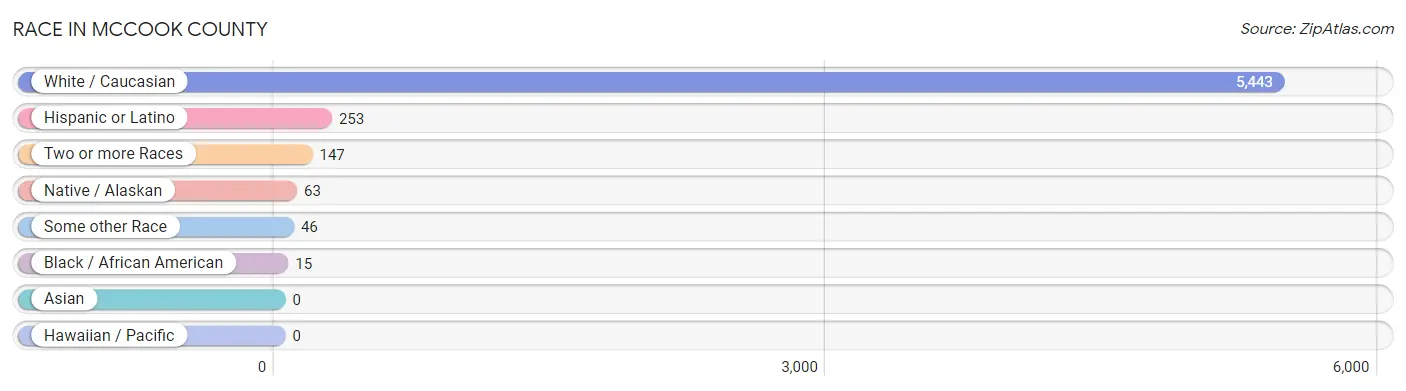
Race in McCook County
The most populous races in McCook County are White / Caucasian (5,443 | 95.3%), Hispanic or Latino (253 | 4.4%), and Two or more Races (147 | 2.6%).
| Race | # Population | % Population |
| Asian | 0 | 0.0% |
| Black / African American | 15 | 0.3% |
| Hawaiian / Pacific | 0 | 0.0% |
| Hispanic or Latino | 253 | 4.4% |
| Native / Alaskan | 63 | 1.1% |
| White / Caucasian | 5,443 | 95.3% |
| Two or more Races | 147 | 2.6% |
| Some other Race | 46 | 0.8% |
| Total | 5,714 | 100.0% |
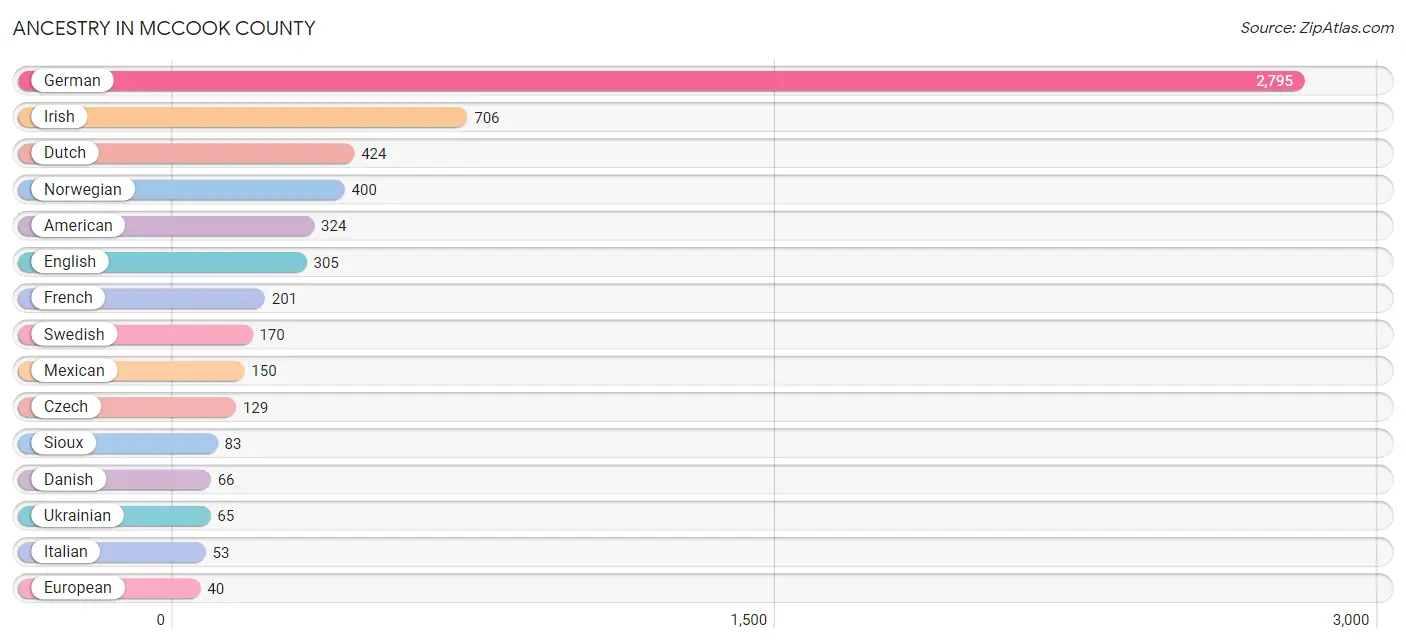
Ancestry in McCook County
The most populous ancestries reported in McCook County are German (2,795 | 48.9%), Irish (706 | 12.4%), Dutch (424 | 7.4%), Norwegian (400 | 7.0%), and American (324 | 5.7%), together accounting for 81.4% of all McCook County residents.
| Ancestry | # Population | % Population |
| African | 3 | 0.1% |
| American | 324 | 5.7% |
| Arab | 1 | 0.0% |
| Arapaho | 9 | 0.2% |
| Austrian | 33 | 0.6% |
| Basque | 3 | 0.1% |
| Belgian | 2 | 0.0% |
| Burmese | 4 | 0.1% |
| Canadian | 2 | 0.0% |
| Central American | 38 | 0.7% |
| Cherokee | 9 | 0.2% |
| Croatian | 1 | 0.0% |
| Czech | 129 | 2.3% |
| Czechoslovakian | 24 | 0.4% |
| Danish | 66 | 1.2% |
| Dutch | 424 | 7.4% |
| English | 305 | 5.3% |
| European | 40 | 0.7% |
| French | 201 | 3.5% |
| French Canadian | 13 | 0.2% |
| German | 2,795 | 48.9% |
| German Russian | 3 | 0.1% |
| Guatemalan | 31 | 0.5% |
| Indian (Asian) | 3 | 0.1% |
| Irish | 706 | 12.4% |
| Italian | 53 | 0.9% |
| Lebanese | 1 | 0.0% |
| Luxembourger | 3 | 0.1% |
| Mexican | 150 | 2.6% |
| Norwegian | 400 | 7.0% |
| Polish | 33 | 0.6% |
| Puerto Rican | 2 | 0.0% |
| Russian | 38 | 0.7% |
| Salvadoran | 7 | 0.1% |
| Scandinavian | 28 | 0.5% |
| Scotch-Irish | 35 | 0.6% |
| Scottish | 23 | 0.4% |
| Sioux | 83 | 1.5% |
| Slavic | 4 | 0.1% |
| Slovak | 34 | 0.6% |
| Spaniard | 39 | 0.7% |
| Subsaharan African | 3 | 0.1% |
| Swedish | 170 | 3.0% |
| Swiss | 7 | 0.1% |
| Ukrainian | 65 | 1.1% |
| Welsh | 9 | 0.2% | View All 46 Rows |
Immigrants in McCook County
The most numerous immigrant groups reported in McCook County came from Central America (44 | 0.8%), Latin America (44 | 0.8%), Guatemala (24 | 0.4%), Mexico (20 | 0.4%), and Europe (14 | 0.3%), together accounting for 2.6% of all McCook County residents.

| Immigration Origin | # Population | % Population |
| Canada | 1 | 0.0% |
| Central America | 44 | 0.8% |
| Eastern Europe | 4 | 0.1% |
| Europe | 14 | 0.3% |
| Germany | 2 | 0.0% |
| Guatemala | 24 | 0.4% |
| Latin America | 44 | 0.8% |
| Mexico | 20 | 0.4% |
| Northern Europe | 8 | 0.1% |
| Ukraine | 4 | 0.1% |
| Western Europe | 2 | 0.0% | View All 11 Rows |
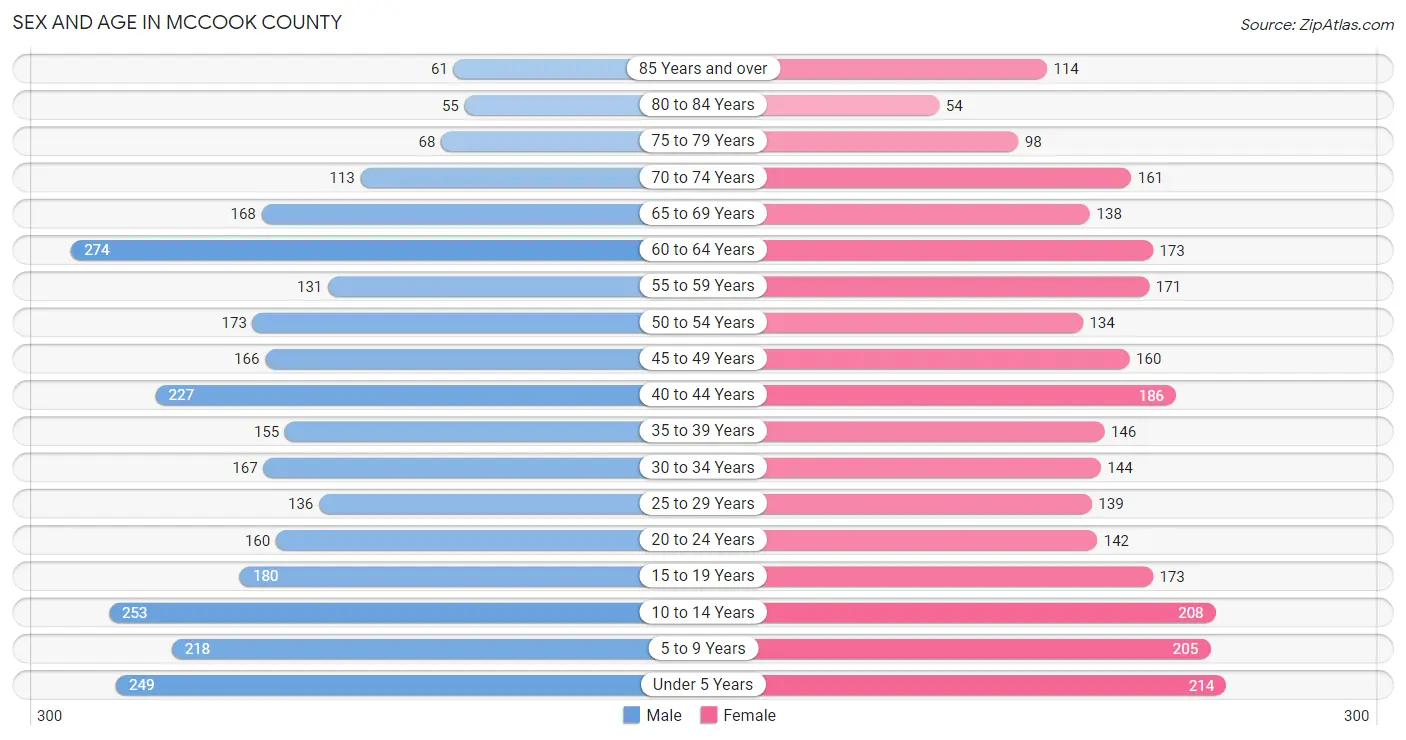
Sex and Age in McCook County
Sex and Age in McCook County
The most populous age groups in McCook County are 60 to 64 Years (274 | 9.3%) for men and Under 5 Years (214 | 7.7%) for women.
| Age Bracket | Male | Female |
| Under 5 Years | 249 (8.4%) | 214 (7.7%) |
| 5 to 9 Years | 218 (7.4%) | 205 (7.4%) |
| 10 to 14 Years | 253 (8.6%) | 208 (7.5%) |
| 15 to 19 Years | 180 (6.1%) | 173 (6.3%) |
| 20 to 24 Years | 160 (5.4%) | 142 (5.1%) |
| 25 to 29 Years | 136 (4.6%) | 139 (5.0%) |
| 30 to 34 Years | 167 (5.7%) | 144 (5.2%) |
| 35 to 39 Years | 155 (5.2%) | 146 (5.3%) |
| 40 to 44 Years | 227 (7.7%) | 186 (6.7%) |
| 45 to 49 Years | 166 (5.6%) | 160 (5.8%) |
| 50 to 54 Years | 173 (5.9%) | 134 (4.9%) |
| 55 to 59 Years | 131 (4.4%) | 171 (6.2%) |
| 60 to 64 Years | 274 (9.3%) | 173 (6.3%) |
| 65 to 69 Years | 168 (5.7%) | 138 (5.0%) |
| 70 to 74 Years | 113 (3.8%) | 161 (5.8%) |
| 75 to 79 Years | 68 (2.3%) | 98 (3.5%) |
| 80 to 84 Years | 55 (1.9%) | 54 (2.0%) |
| 85 Years and over | 61 (2.1%) | 114 (4.1%) |
| Total | 2,954 (100.0%) | 2,760 (100.0%) |
Families and Households in McCook County
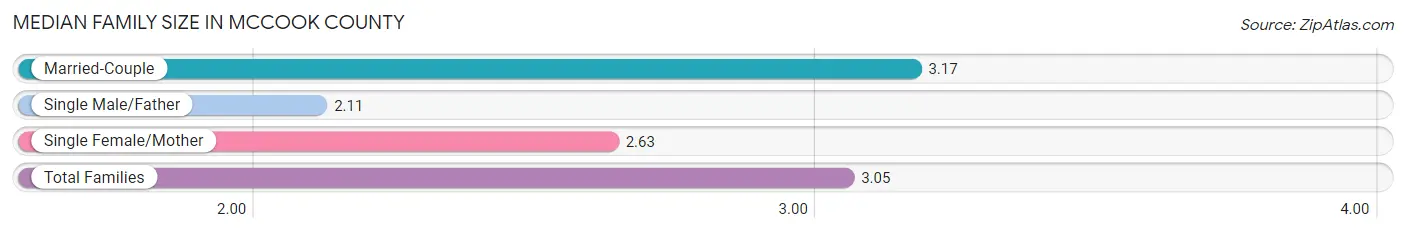
Median Family Size in McCook County
The median family size in McCook County is 3.05 persons per family, with married-couple families (1,256 | 84.0%) accounting for the largest median family size of 3.17 persons per family. On the other hand, single male/father families (104 | 7.0%) represent the smallest median family size with 2.11 persons per family.
| Family Type | # Families | Family Size |
| Married-Couple | 1,256 (84.0%) | 3.17 |
| Single Male/Father | 104 (7.0%) | 2.11 |
| Single Female/Mother | 136 (9.1%) | 2.63 |
| Total Families | 1,496 (100.0%) | 3.05 |
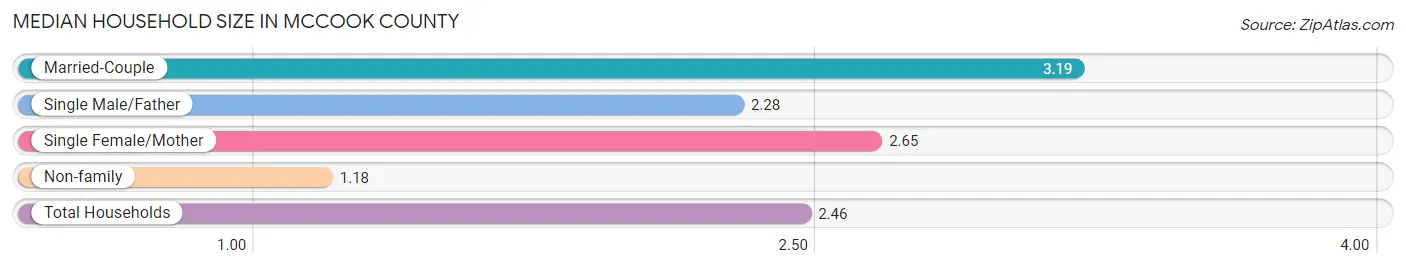
Median Household Size in McCook County
The median household size in McCook County is 2.46 persons per household, with married-couple households (1,256 | 56.6%) accounting for the largest median household size of 3.19 persons per household. non-family households (722 | 32.6%) represent the smallest median household size with 1.18 persons per household.
| Household Type | # Households | Household Size |
| Married-Couple | 1,256 (56.6%) | 3.19 |
| Single Male/Father | 104 (4.7%) | 2.28 |
| Single Female/Mother | 136 (6.1%) | 2.65 |
| Non-family | 722 (32.6%) | 1.18 |
| Total Households | 2,218 (100.0%) | 2.46 |
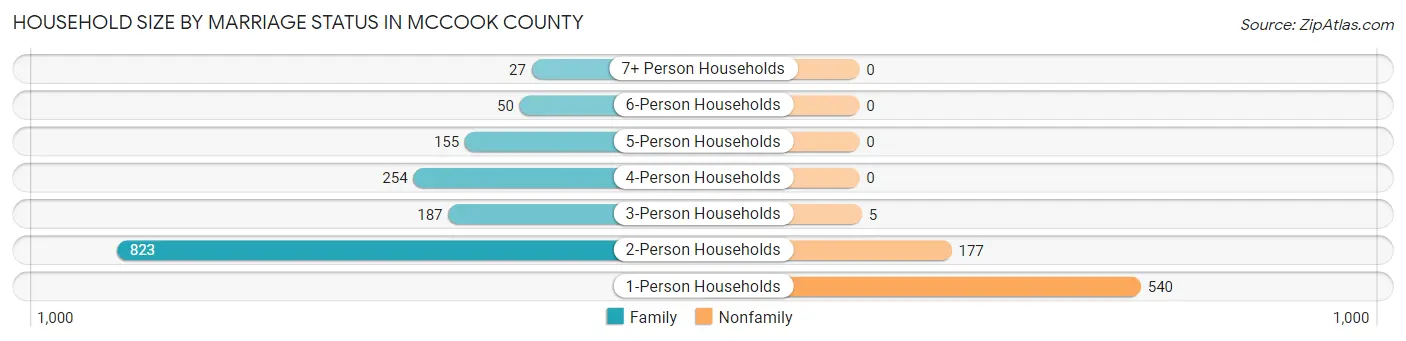
Household Size by Marriage Status in McCook County
Out of a total of 2,218 households in McCook County, 1,496 (67.4%) are family households, while 722 (32.6%) are nonfamily households. The most numerous type of family households are 2-person households, comprising 823, and the most common type of nonfamily households are 1-person households, comprising 540.
| Household Size | Family Households | Nonfamily Households |
| 1-Person Households | - | 540 (24.3%) |
| 2-Person Households | 823 (37.1%) | 177 (8.0%) |
| 3-Person Households | 187 (8.4%) | 5 (0.2%) |
| 4-Person Households | 254 (11.5%) | 0 (0.0%) |
| 5-Person Households | 155 (7.0%) | 0 (0.0%) |
| 6-Person Households | 50 (2.2%) | 0 (0.0%) |
| 7+ Person Households | 27 (1.2%) | 0 (0.0%) |
| Total | 1,496 (67.4%) | 722 (32.6%) |
Female Fertility in McCook County
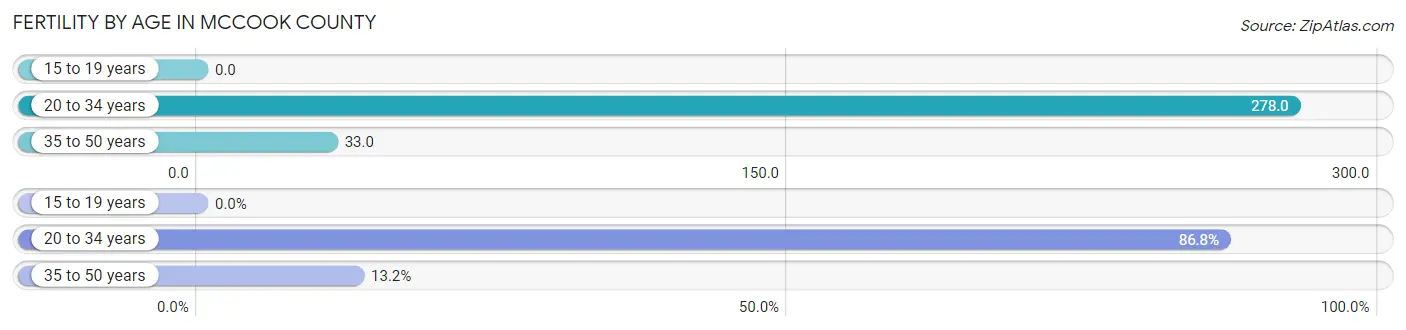
Fertility by Age in McCook County
Average fertility rate in McCook County is 120.0 births per 1,000 women. Women in the age bracket of 20 to 34 years have the highest fertility rate with 278.0 births per 1,000 women. Women in the age bracket of 20 to 34 years acount for 86.8% of all women with births.
| Age Bracket | Women with Births | Births / 1,000 Women |
| 15 to 19 years | 0 (0.0%) | 0.0 |
| 20 to 34 years | 118 (86.8%) | 278.0 |
| 35 to 50 years | 18 (13.2%) | 33.0 |
| Total | 136 (100.0%) | 120.0 |
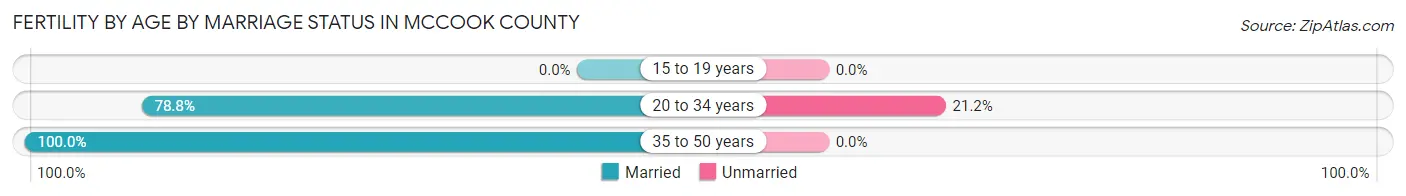
Fertility by Age by Marriage Status in McCook County
81.6% of women with births (136) in McCook County are married. The highest percentage of unmarried women with births falls into 20 to 34 years age bracket with 21.2% of them unmarried at the time of birth, while the lowest percentage of unmarried women with births belong to 35 to 50 years age bracket with 0.0% of them unmarried.
| Age Bracket | Married | Unmarried |
| 15 to 19 years | 0 (0.0%) | 0 (0.0%) |
| 20 to 34 years | 93 (78.8%) | 25 (21.2%) |
| 35 to 50 years | 18 (100.0%) | 0 (0.0%) |
| Total | 111 (81.6%) | 25 (18.4%) |
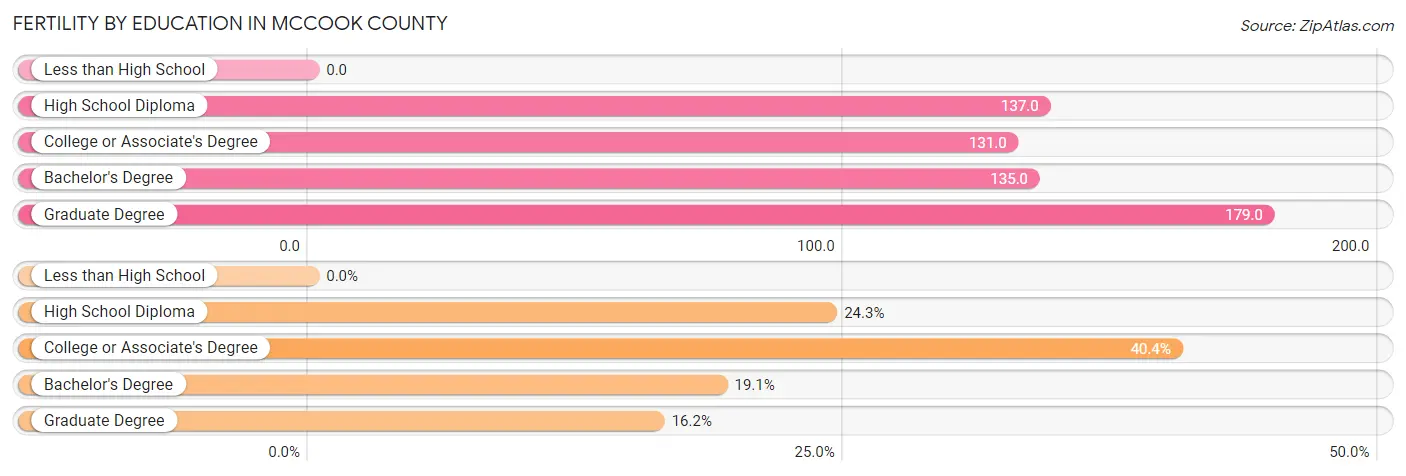
Fertility by Education in McCook County
| Educational Attainment | Women with Births | Births / 1,000 Women |
| Less than High School | 0 (0.0%) | 0.0 |
| High School Diploma | 33 (24.3%) | 137.0 |
| College or Associate's Degree | 55 (40.4%) | 131.0 |
| Bachelor's Degree | 26 (19.1%) | 135.0 |
| Graduate Degree | 22 (16.2%) | 179.0 |
| Total | 136 (100.0%) | 120.0 |
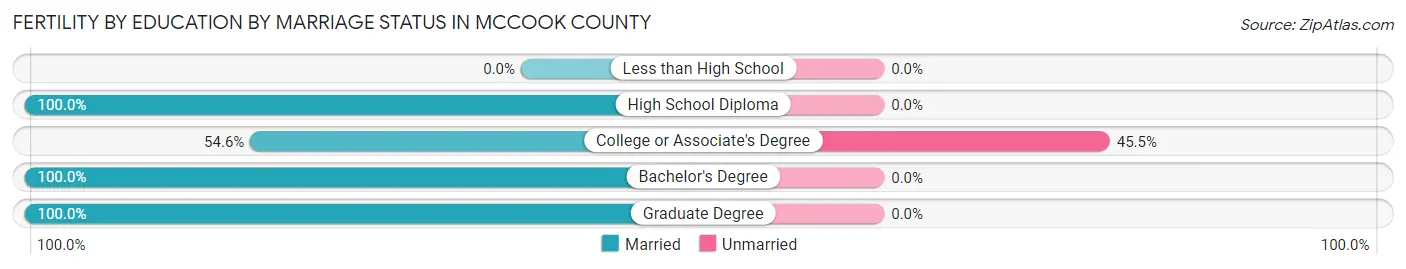
Fertility by Education by Marriage Status in McCook County
18.4% of women with births in McCook County are unmarried. Women with the educational attainment of high school diploma are most likely to be married with 100.0% of them married at childbirth, while women with the educational attainment of college or associate's degree are least likely to be married with 45.5% of them unmarried at childbirth.
| Educational Attainment | Married | Unmarried |
| Less than High School | 0 (0.0%) | 0 (0.0%) |
| High School Diploma | 33 (100.0%) | 0 (0.0%) |
| College or Associate's Degree | 30 (54.5%) | 25 (45.5%) |
| Bachelor's Degree | 26 (100.0%) | 0 (0.0%) |
| Graduate Degree | 22 (100.0%) | 0 (0.0%) |
| Total | 111 (81.6%) | 25 (18.4%) |
Income in McCook County
Income Overview in McCook County
Per Capita Income in McCook County is $34,242, while median incomes of families and households are $88,696 and $74,873 respectively.
| Characteristic | Number | Measure |
| Per Capita Income | 5,714 | $34,242 |
| Median Family Income | 1,496 | $88,696 |
| Mean Family Income | 1,496 | $104,133 |
| Median Household Income | 2,218 | $74,873 |
| Mean Household Income | 2,218 | $89,299 |
| Income Deficit | 1,496 | $10,609 |
| Wage / Income Gap (%) | 5,714 | 27.92% |
| Wage / Income Gap ($) | 5,714 | 72.08¢ per $1 |
| Gini / Inequality Index | 5,714 | 0.38 |
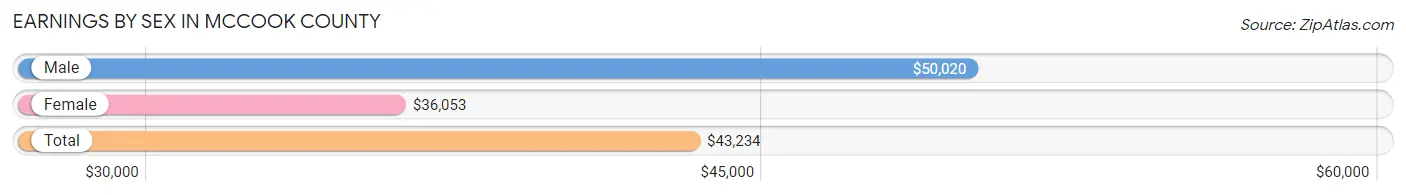
Earnings by Sex in McCook County
Average Earnings in McCook County are $43,234, $50,020 for men and $36,053 for women, a difference of 27.9%.
| Sex | Number | Average Earnings |
| Male | 1,757 (55.0%) | $50,020 |
| Female | 1,438 (45.0%) | $36,053 |
| Total | 3,195 (100.0%) | $43,234 |
Earnings by Sex by Income Bracket in McCook County
The most common earnings brackets in McCook County are $55,000 to $64,999 for men (259 | 14.7%) and $35,000 to $39,999 for women (128 | 8.9%).
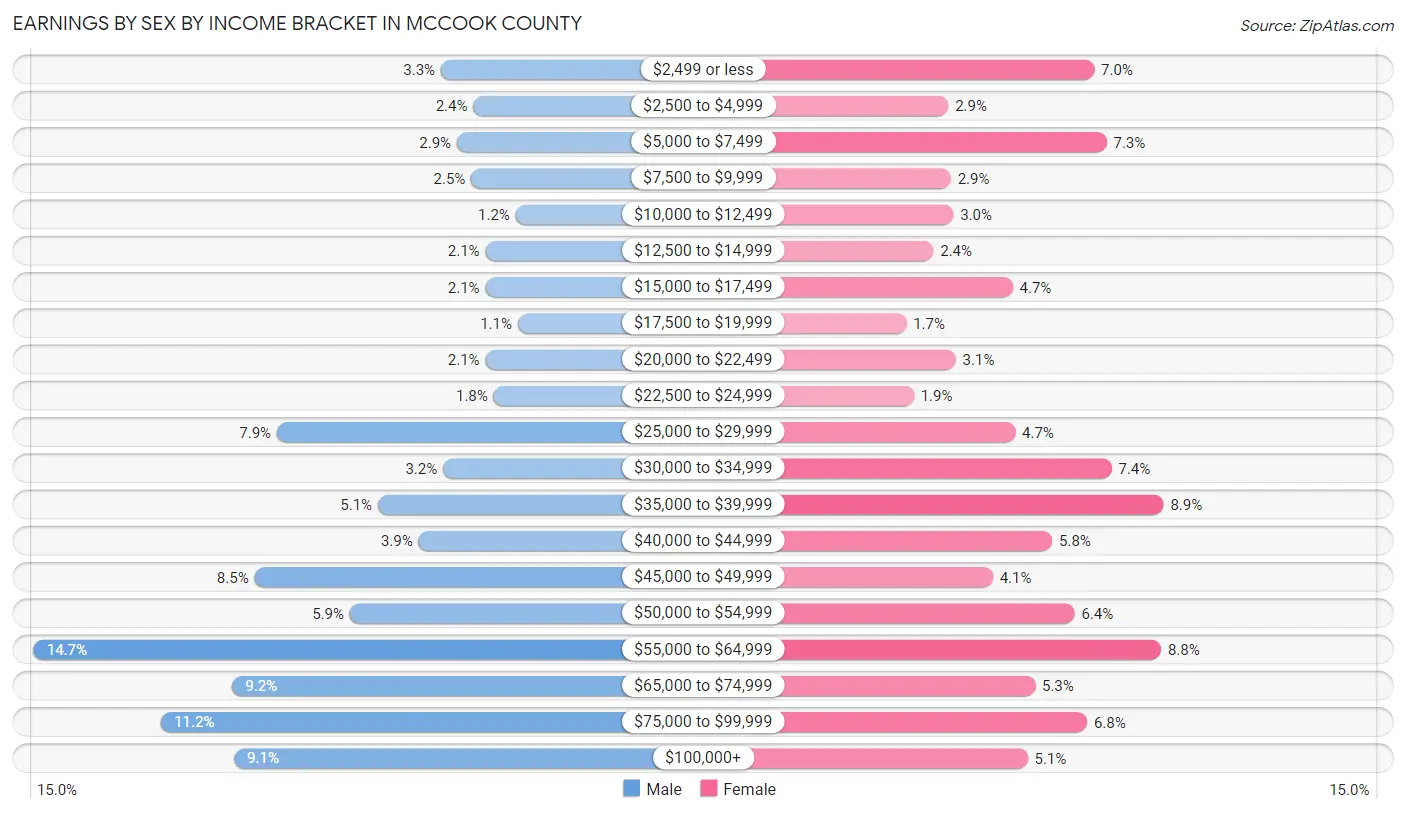
| Income | Male | Female |
| $2,499 or less | 58 (3.3%) | 100 (7.0%) |
| $2,500 to $4,999 | 42 (2.4%) | 41 (2.9%) |
| $5,000 to $7,499 | 50 (2.9%) | 105 (7.3%) |
| $7,500 to $9,999 | 43 (2.5%) | 42 (2.9%) |
| $10,000 to $12,499 | 21 (1.2%) | 43 (3.0%) |
| $12,500 to $14,999 | 36 (2.1%) | 35 (2.4%) |
| $15,000 to $17,499 | 36 (2.1%) | 67 (4.7%) |
| $17,500 to $19,999 | 20 (1.1%) | 24 (1.7%) |
| $20,000 to $22,499 | 36 (2.1%) | 44 (3.1%) |
| $22,500 to $24,999 | 32 (1.8%) | 27 (1.9%) |
| $25,000 to $29,999 | 139 (7.9%) | 68 (4.7%) |
| $30,000 to $34,999 | 57 (3.2%) | 107 (7.4%) |
| $35,000 to $39,999 | 89 (5.1%) | 128 (8.9%) |
| $40,000 to $44,999 | 69 (3.9%) | 83 (5.8%) |
| $45,000 to $49,999 | 150 (8.5%) | 59 (4.1%) |
| $50,000 to $54,999 | 103 (5.9%) | 92 (6.4%) |
| $55,000 to $64,999 | 259 (14.7%) | 127 (8.8%) |
| $65,000 to $74,999 | 161 (9.2%) | 76 (5.3%) |
| $75,000 to $99,999 | 196 (11.2%) | 97 (6.8%) |
| $100,000+ | 160 (9.1%) | 73 (5.1%) |
| Total | 1,757 (100.0%) | 1,438 (100.0%) |
Earnings by Sex by Educational Attainment in McCook County
Average earnings in McCook County are $52,530 for men and $39,779 for women, a difference of 24.3%. Men with an educational attainment of bachelor's degree enjoy the highest average annual earnings of $55,536, while those with less than high school education earn the least with $28,895. Women with an educational attainment of graduate degree earn the most with the average annual earnings of $60,739, while those with college or associate's degree education have the smallest earnings of $34,421.
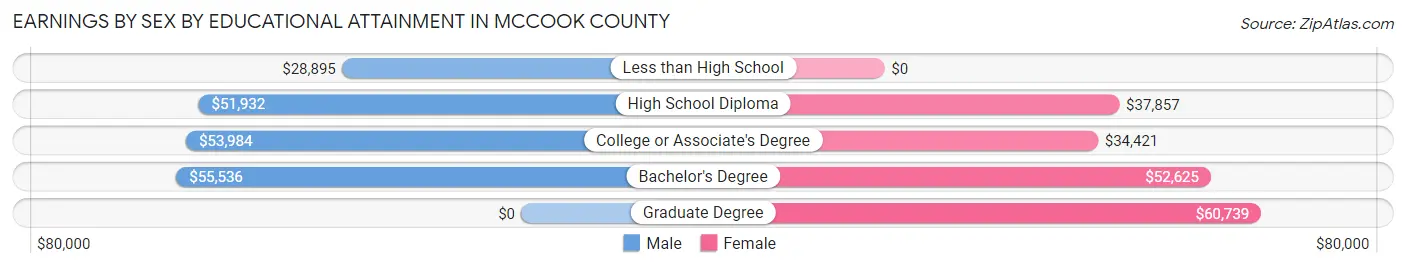
| Educational Attainment | Male Income | Female Income |
| Less than High School | $28,895 | $0 |
| High School Diploma | $51,932 | $37,857 |
| College or Associate's Degree | $53,984 | $34,421 |
| Bachelor's Degree | $55,536 | $52,625 |
| Graduate Degree | - | - |
| Total | $52,530 | $39,779 |
Family Income in McCook County
Family Income Brackets in McCook County
According to the McCook County family income data, there are 352 families falling into the $100,000 to $149,999 income range, which is the most common income bracket and makes up 23.5% of all families. Conversely, the $10,000 to $14,999 income bracket is the least frequent group with only 13 families (0.9%) belonging to this category.
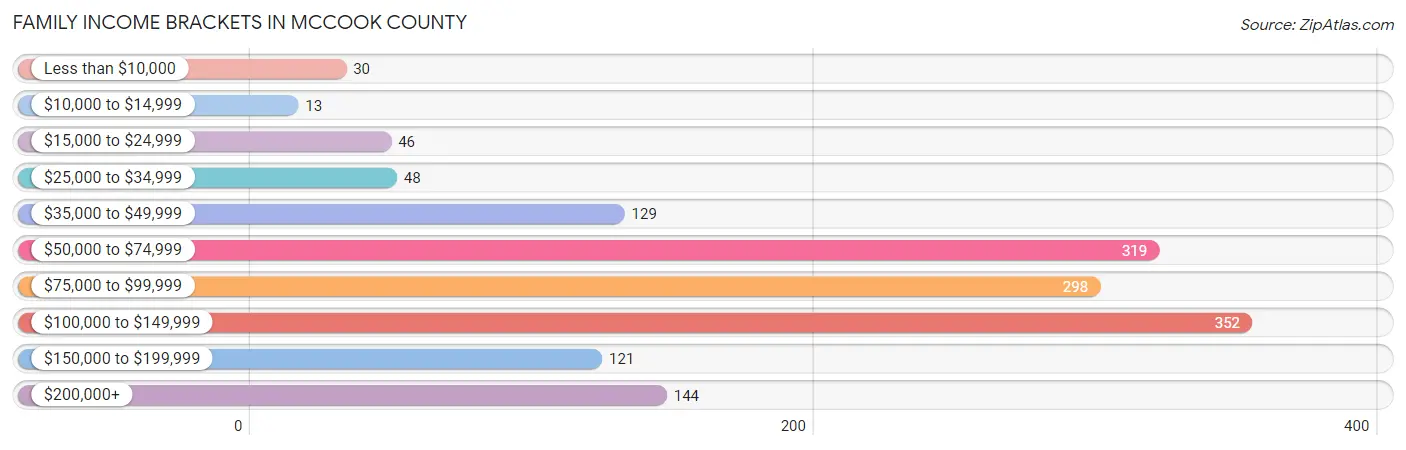
| Income Bracket | # Families | % Families |
| Less than $10,000 | 30 | 2.0% |
| $10,000 to $14,999 | 13 | 0.9% |
| $15,000 to $24,999 | 46 | 3.1% |
| $25,000 to $34,999 | 48 | 3.2% |
| $35,000 to $49,999 | 129 | 8.6% |
| $50,000 to $74,999 | 319 | 21.3% |
| $75,000 to $99,999 | 298 | 19.9% |
| $100,000 to $149,999 | 352 | 23.5% |
| $150,000 to $199,999 | 121 | 8.1% |
| $200,000+ | 144 | 9.6% |
Family Income by Famaliy Size in McCook County
4-person families (266 | 17.8%) account for the highest median family income in McCook County with $102,083 per family, while 2-person families (836 | 55.9%) have the highest median income of $40,357 per family member.
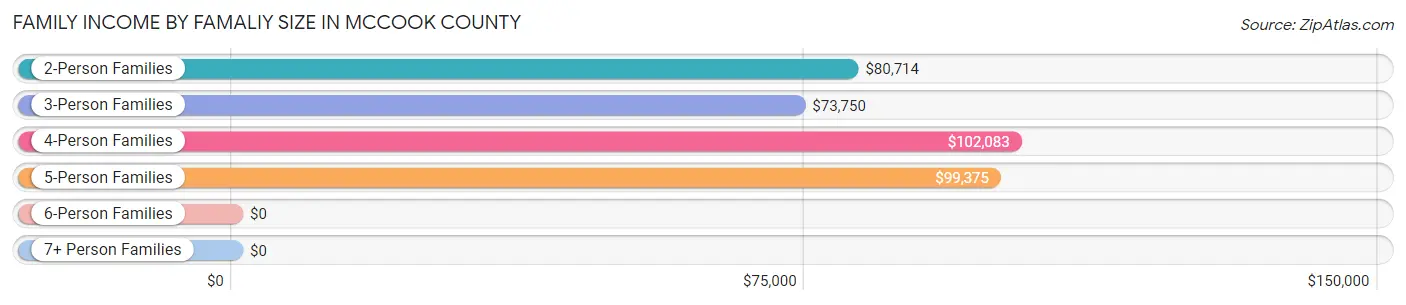
| Income Bracket | # Families | Median Income |
| 2-Person Families | 836 (55.9%) | $80,714 |
| 3-Person Families | 181 (12.1%) | $73,750 |
| 4-Person Families | 266 (17.8%) | $102,083 |
| 5-Person Families | 151 (10.1%) | $99,375 |
| 6-Person Families | 38 (2.5%) | $0 |
| 7+ Person Families | 24 (1.6%) | $0 |
| Total | 1,496 (100.0%) | $88,696 |
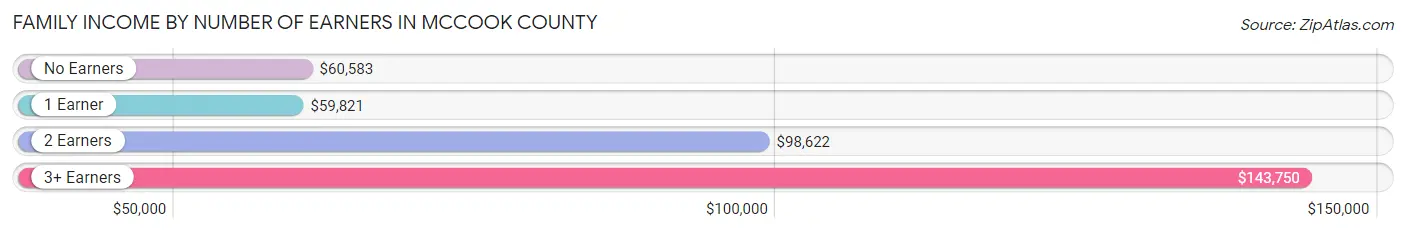
Family Income by Number of Earners in McCook County
The median family income in McCook County is $88,696, with families comprising 3+ earners (147) having the highest median family income of $143,750, while families with 1 earner (335) have the lowest median family income of $59,821, accounting for 9.8% and 22.4% of families, respectively.
| Number of Earners | # Families | Median Income |
| No Earners | 137 (9.2%) | $60,583 |
| 1 Earner | 335 (22.4%) | $59,821 |
| 2 Earners | 877 (58.6%) | $98,622 |
| 3+ Earners | 147 (9.8%) | $143,750 |
| Total | 1,496 (100.0%) | $88,696 |
Household Income in McCook County
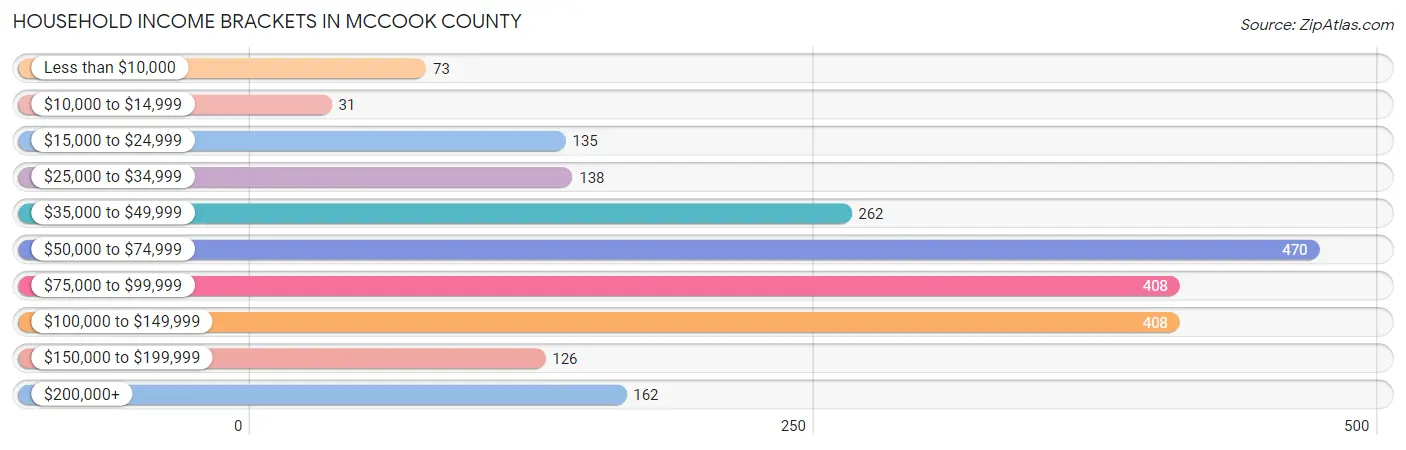
Household Income Brackets in McCook County
With 470 households falling in the category, the $50,000 to $74,999 income range is the most frequent in McCook County, accounting for 21.2% of all households. In contrast, only 31 households (1.4%) fall into the $10,000 to $14,999 income bracket, making it the least populous group.
| Income Bracket | # Households | % Households |
| Less than $10,000 | 73 | 3.3% |
| $10,000 to $14,999 | 31 | 1.4% |
| $15,000 to $24,999 | 135 | 6.1% |
| $25,000 to $34,999 | 138 | 6.2% |
| $35,000 to $49,999 | 262 | 11.8% |
| $50,000 to $74,999 | 470 | 21.2% |
| $75,000 to $99,999 | 408 | 18.4% |
| $100,000 to $149,999 | 408 | 18.4% |
| $150,000 to $199,999 | 126 | 5.7% |
| $200,000+ | 162 | 7.3% |
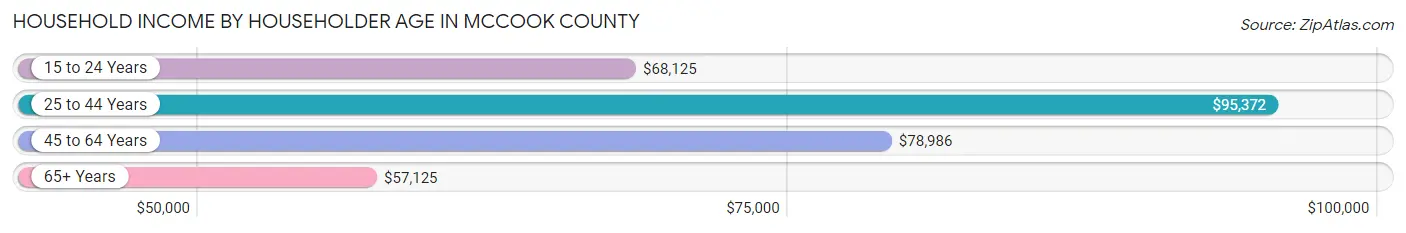
Household Income by Householder Age in McCook County
The median household income in McCook County is $74,873, with the highest median household income of $95,372 found in the 25 to 44 years age bracket for the primary householder. A total of 673 households (30.3%) fall into this category. Meanwhile, the 65+ years age bracket for the primary householder has the lowest median household income of $57,125, with 539 households (24.3%) in this group.
| Income Bracket | # Households | Median Income |
| 15 to 24 Years | 174 (7.8%) | $68,125 |
| 25 to 44 Years | 673 (30.3%) | $95,372 |
| 45 to 64 Years | 832 (37.5%) | $78,986 |
| 65+ Years | 539 (24.3%) | $57,125 |
| Total | 2,218 (100.0%) | $74,873 |
Poverty in McCook County
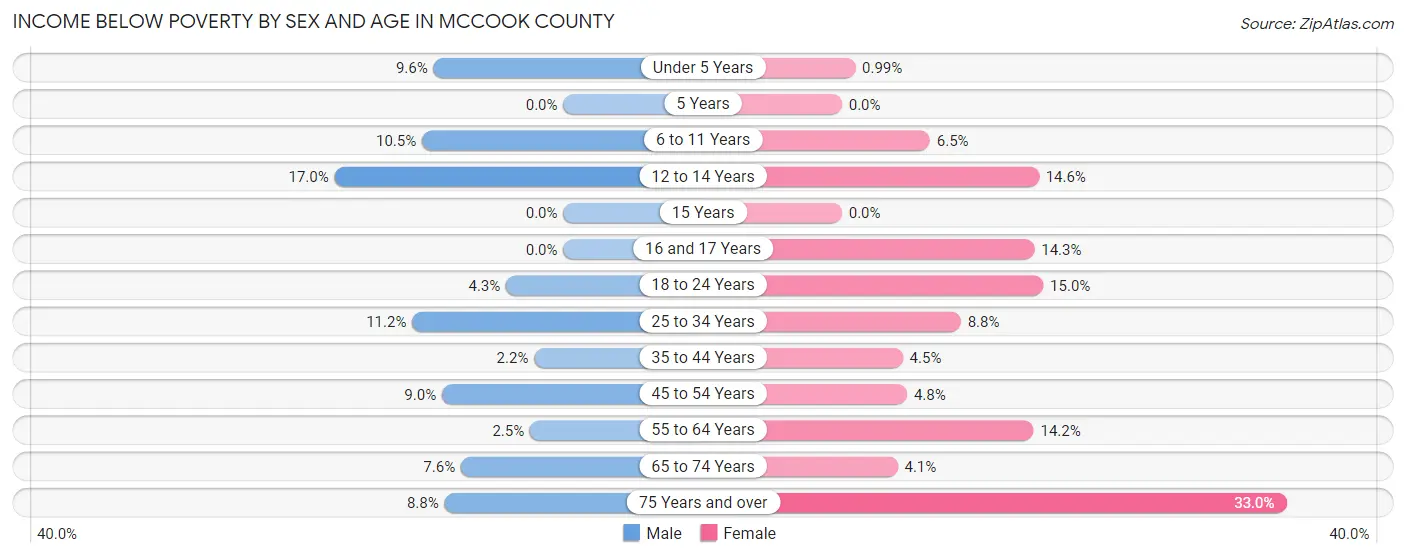
Income Below Poverty by Sex and Age in McCook County
With 7.0% poverty level for males and 9.8% for females among the residents of McCook County, 12 to 14 year old males and 75 year old and over females are the most vulnerable to poverty, with 26 males (17.0%) and 67 females (33.0%) in their respective age groups living below the poverty level.
| Age Bracket | Male | Female |
| Under 5 Years | 24 (9.6%) | 2 (1.0%) |
| 5 Years | 0 (0.0%) | 0 (0.0%) |
| 6 to 11 Years | 28 (10.5%) | 17 (6.5%) |
| 12 to 14 Years | 26 (17.0%) | 19 (14.6%) |
| 15 Years | 0 (0.0%) | 0 (0.0%) |
| 16 and 17 Years | 0 (0.0%) | 13 (14.3%) |
| 18 to 24 Years | 9 (4.3%) | 29 (14.9%) |
| 25 to 34 Years | 34 (11.2%) | 25 (8.8%) |
| 35 to 44 Years | 8 (2.2%) | 15 (4.5%) |
| 45 to 54 Years | 30 (9.0%) | 14 (4.8%) |
| 55 to 64 Years | 10 (2.5%) | 48 (14.2%) |
| 65 to 74 Years | 19 (7.6%) | 12 (4.1%) |
| 75 Years and over | 15 (8.8%) | 67 (33.0%) |
| Total | 203 (7.0%) | 261 (9.8%) |
Income Above Poverty by Sex and Age in McCook County
According to the poverty statistics in McCook County, males aged 5 years and females aged 5 years are the age groups that are most secure financially, with 100.0% of males and 100.0% of females in these age groups living above the poverty line.
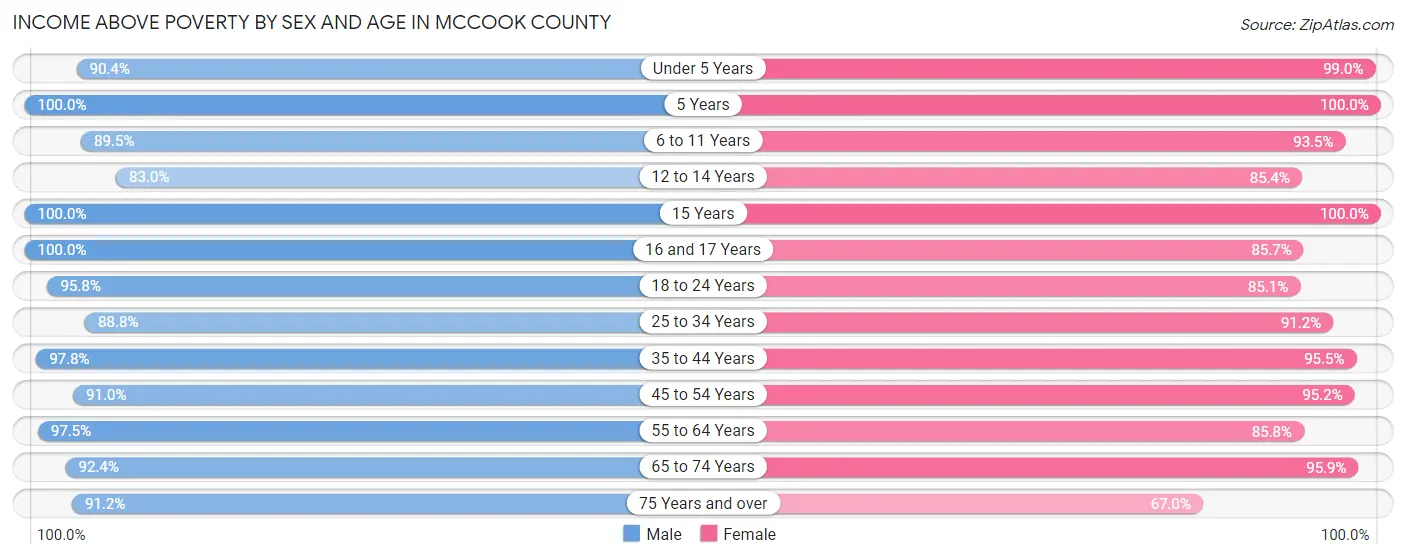
| Age Bracket | Male | Female |
| Under 5 Years | 225 (90.4%) | 201 (99.0%) |
| 5 Years | 47 (100.0%) | 23 (100.0%) |
| 6 to 11 Years | 239 (89.5%) | 243 (93.5%) |
| 12 to 14 Years | 127 (83.0%) | 111 (85.4%) |
| 15 Years | 65 (100.0%) | 30 (100.0%) |
| 16 and 17 Years | 63 (100.0%) | 78 (85.7%) |
| 18 to 24 Years | 203 (95.8%) | 165 (85.1%) |
| 25 to 34 Years | 269 (88.8%) | 258 (91.2%) |
| 35 to 44 Years | 362 (97.8%) | 317 (95.5%) |
| 45 to 54 Years | 303 (91.0%) | 275 (95.2%) |
| 55 to 64 Years | 395 (97.5%) | 289 (85.8%) |
| 65 to 74 Years | 231 (92.4%) | 278 (95.9%) |
| 75 Years and over | 155 (91.2%) | 136 (67.0%) |
| Total | 2,684 (93.0%) | 2,404 (90.2%) |
Income Below Poverty Among Married-Couple Families in McCook County
The poverty statistics for married-couple families in McCook County show that 5.2% or 65 of the total 1,256 families live below the poverty line. Families with 3 or 4 children have the highest poverty rate of 15.4%, comprising of 24 families. On the other hand, families with 5 or more children have the lowest poverty rate of 0.0%, which includes 0 families.
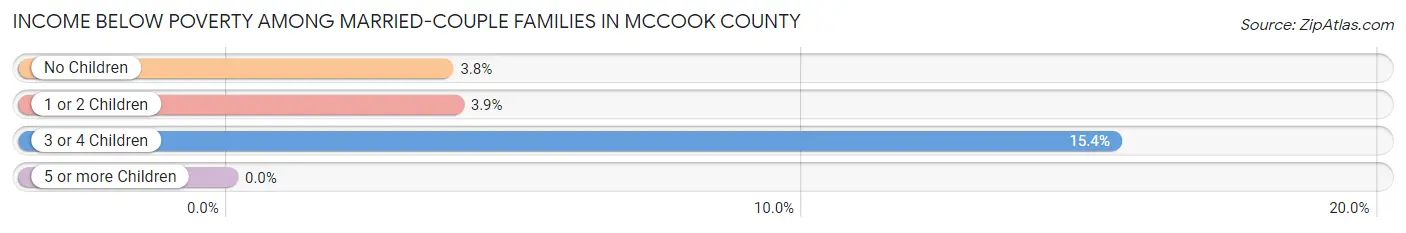
| Children | Above Poverty | Below Poverty |
| No Children | 719 (96.3%) | 28 (3.7%) |
| 1 or 2 Children | 318 (96.1%) | 13 (3.9%) |
| 3 or 4 Children | 132 (84.6%) | 24 (15.4%) |
| 5 or more Children | 22 (100.0%) | 0 (0.0%) |
| Total | 1,191 (94.8%) | 65 (5.2%) |
Income Below Poverty Among Single-Parent Households in McCook County
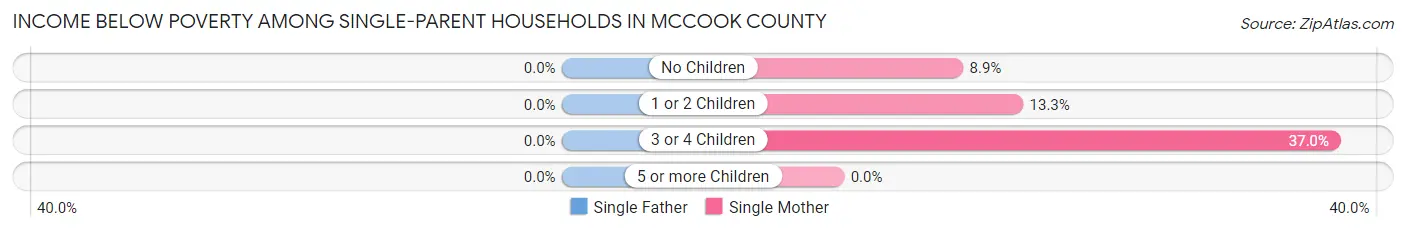
| Children | Single Father | Single Mother |
| No Children | 0 (0.0%) | 7 (8.9%) |
| 1 or 2 Children | 0 (0.0%) | 4 (13.3%) |
| 3 or 4 Children | 0 (0.0%) | 10 (37.0%) |
| 5 or more Children | 0 (0.0%) | 0 (0.0%) |
| Total | 0 (0.0%) | 21 (15.4%) |
Income Below Poverty Among Married-Couple vs Single-Parent Households in McCook County
The poverty data for McCook County shows that 65 of the married-couple family households (5.2%) and 21 of the single-parent households (8.7%) are living below the poverty level. Within the married-couple family households, those with 3 or 4 children have the highest poverty rate, with 24 households (15.4%) falling below the poverty line. Among the single-parent households, those with 3 or 4 children have the highest poverty rate, with 10 household (27.0%) living below poverty.
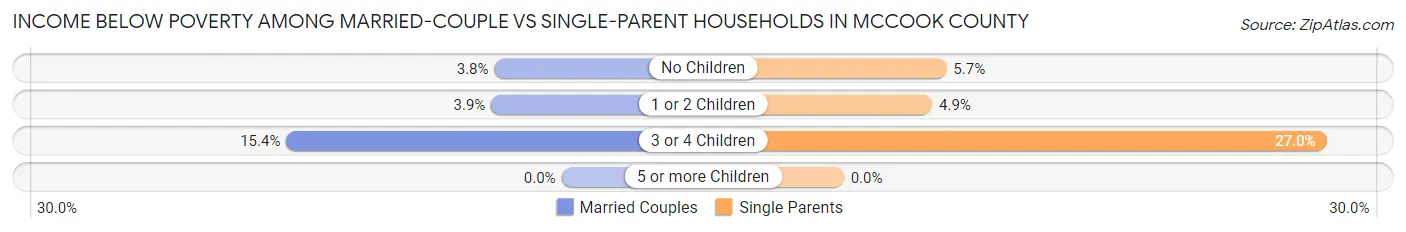
| Children | Married-Couple Families | Single-Parent Households |
| No Children | 28 (3.7%) | 7 (5.7%) |
| 1 or 2 Children | 13 (3.9%) | 4 (4.9%) |
| 3 or 4 Children | 24 (15.4%) | 10 (27.0%) |
| 5 or more Children | 0 (0.0%) | 0 (0.0%) |
| Total | 65 (5.2%) | 21 (8.7%) |
Employment Characteristics in McCook County
Employment by Class of Employer in McCook County
Among the 2,927 employed individuals in McCook County, private company employees (1,690 | 57.7%), self-employed (not incorporated) (446 | 15.2%), and not-for-profit organizations (342 | 11.7%) make up the most common classes of employment.
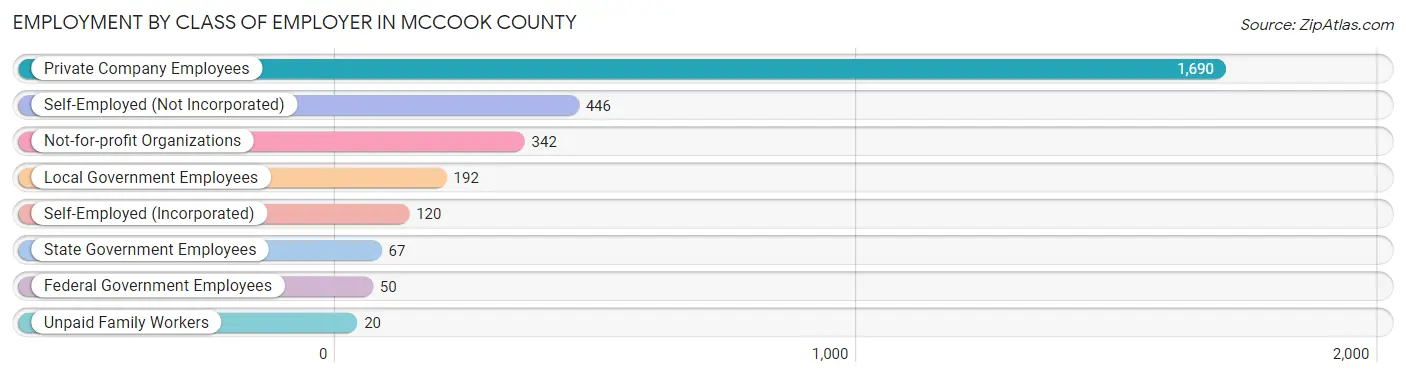
| Employer Class | # Employees | % Employees |
| Private Company Employees | 1,690 | 57.7% |
| Self-Employed (Incorporated) | 120 | 4.1% |
| Self-Employed (Not Incorporated) | 446 | 15.2% |
| Not-for-profit Organizations | 342 | 11.7% |
| Local Government Employees | 192 | 6.6% |
| State Government Employees | 67 | 2.3% |
| Federal Government Employees | 50 | 1.7% |
| Unpaid Family Workers | 20 | 0.7% |
| Total | 2,927 | 100.0% |
Employment Status by Age in McCook County
According to the labor force statistics for McCook County, out of the total population over 16 years of age (4,272), 70.3% or 3,003 individuals are in the labor force, with 2.1% or 63 of them unemployed. The age group with the highest labor force participation rate is 25 to 29 years, with 95.6% or 263 individuals in the labor force. Within the labor force, the 60 to 64 years age range has the highest percentage of unemployed individuals, with 5.1% or 18 of them being unemployed.
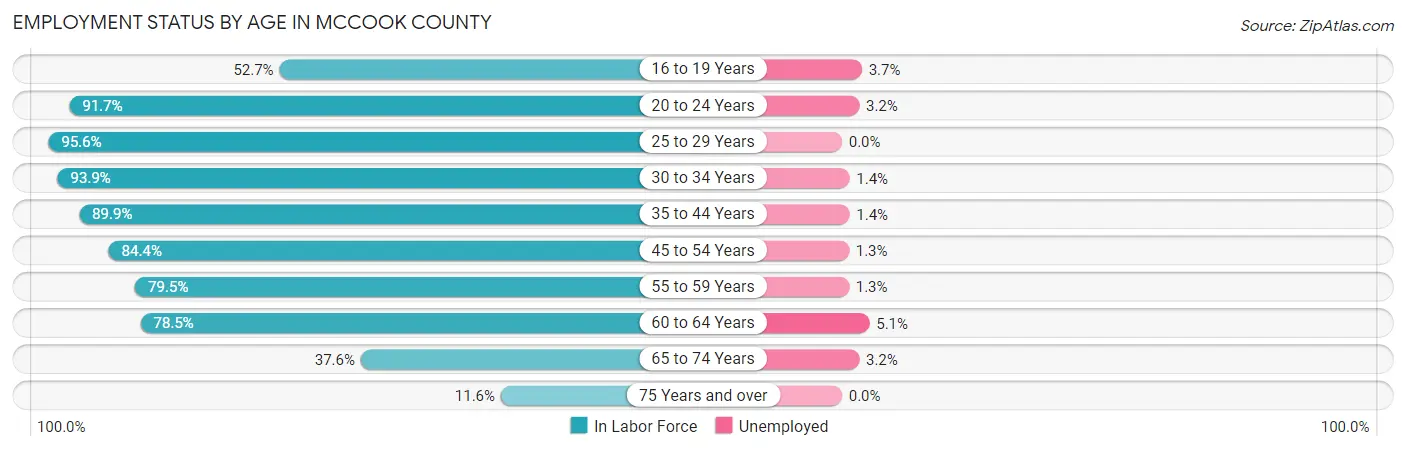
| Age Bracket | In Labor Force | Unemployed |
| 16 to 19 Years | 136 (52.7%) | 5 (3.7%) |
| 20 to 24 Years | 277 (91.7%) | 9 (3.2%) |
| 25 to 29 Years | 263 (95.6%) | 0 (0.0%) |
| 30 to 34 Years | 292 (93.9%) | 4 (1.4%) |
| 35 to 44 Years | 642 (89.9%) | 9 (1.4%) |
| 45 to 54 Years | 534 (84.4%) | 7 (1.3%) |
| 55 to 59 Years | 240 (79.5%) | 3 (1.3%) |
| 60 to 64 Years | 351 (78.5%) | 18 (5.1%) |
| 65 to 74 Years | 218 (37.6%) | 7 (3.2%) |
| 75 Years and over | 52 (11.6%) | 0 (0.0%) |
| Total | 3,003 (70.3%) | 63 (2.1%) |
Employment Status by Educational Attainment in McCook County
According to labor force statistics for McCook County, 86.6% of individuals (2,323) out of the total population between 25 and 64 years of age (2,682) are in the labor force, with 1.8% or 42 of them being unemployed. The group with the highest labor force participation rate are those with the educational attainment of college / associate degree, with 90.4% or 877 individuals in the labor force. Within the labor force, individuals with high school diploma education have the highest percentage of unemployment, with 2.5% or 16 of them being unemployed.
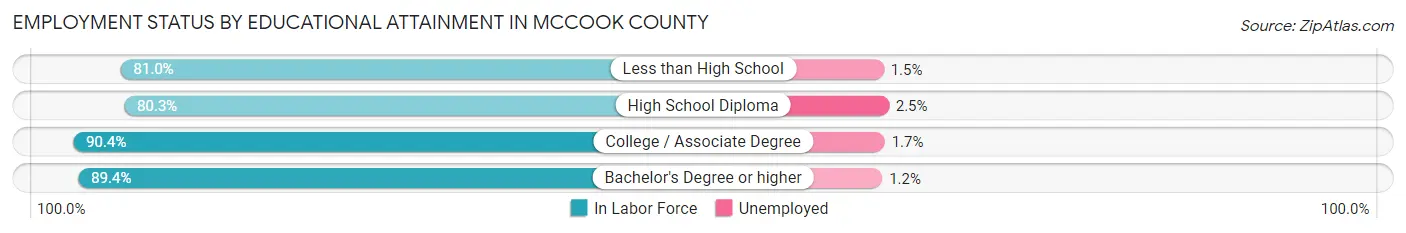
| Educational Attainment | In Labor Force | Unemployed |
| Less than High School | 132 (81.0%) | 2 (1.5%) |
| High School Diploma | 635 (80.3%) | 20 (2.5%) |
| College / Associate Degree | 877 (90.4%) | 16 (1.7%) |
| Bachelor's Degree or higher | 678 (89.4%) | 9 (1.2%) |
| Total | 2,323 (86.6%) | 48 (1.8%) |
Employment Occupations by Sex in McCook County
Management, Business, Science and Arts Occupations
The most common Management, Business, Science and Arts occupations in McCook County are Management (530 | 18.0%), Community & Social Service (225 | 7.7%), Health Diagnosing & Treating (217 | 7.4%), Business & Financial (158 | 5.4%), and Education Instruction & Library (127 | 4.3%).
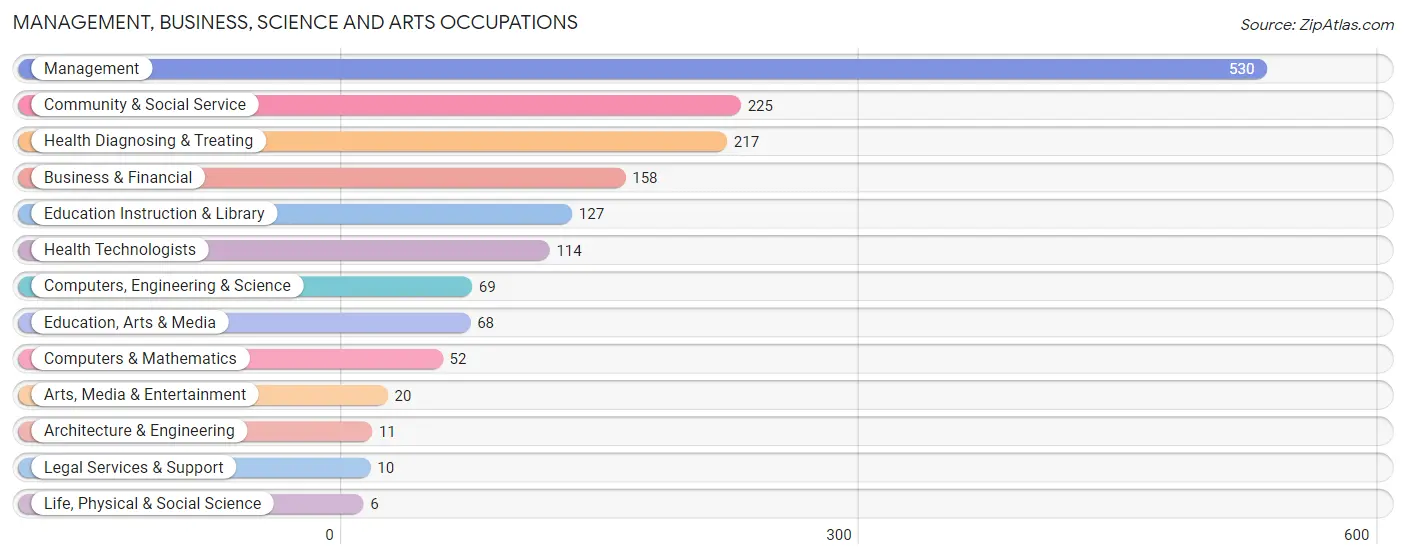
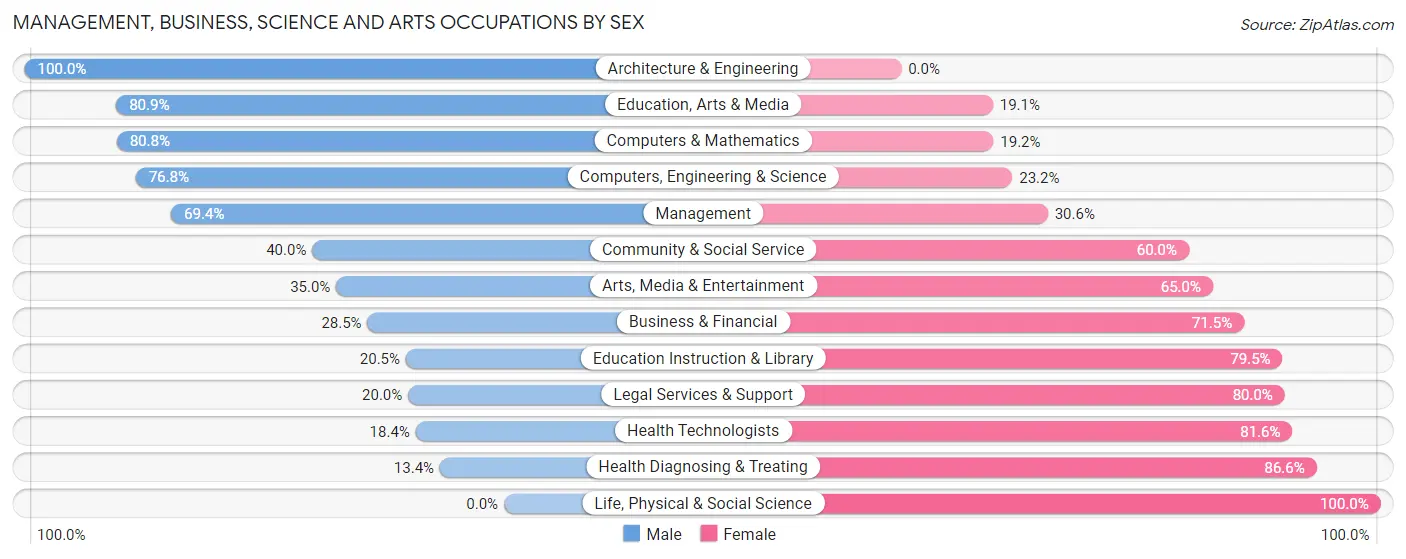
Management, Business, Science and Arts Occupations by Sex
Within the Management, Business, Science and Arts occupations in McCook County, the most male-oriented occupations are Architecture & Engineering (100.0%), Education, Arts & Media (80.9%), and Computers & Mathematics (80.8%), while the most female-oriented occupations are Life, Physical & Social Science (100.0%), Health Diagnosing & Treating (86.6%), and Health Technologists (81.6%).
| Occupation | Male | Female |
| Management | 368 (69.4%) | 162 (30.6%) |
| Business & Financial | 45 (28.5%) | 113 (71.5%) |
| Computers, Engineering & Science | 53 (76.8%) | 16 (23.2%) |
| Computers & Mathematics | 42 (80.8%) | 10 (19.2%) |
| Architecture & Engineering | 11 (100.0%) | 0 (0.0%) |
| Life, Physical & Social Science | 0 (0.0%) | 6 (100.0%) |
| Community & Social Service | 90 (40.0%) | 135 (60.0%) |
| Education, Arts & Media | 55 (80.9%) | 13 (19.1%) |
| Legal Services & Support | 2 (20.0%) | 8 (80.0%) |
| Education Instruction & Library | 26 (20.5%) | 101 (79.5%) |
| Arts, Media & Entertainment | 7 (35.0%) | 13 (65.0%) |
| Health Diagnosing & Treating | 29 (13.4%) | 188 (86.6%) |
| Health Technologists | 21 (18.4%) | 93 (81.6%) |
| Total (Category) | 585 (48.8%) | 614 (51.2%) |
| Total (Overall) | 1,614 (54.9%) | 1,323 (45.1%) |
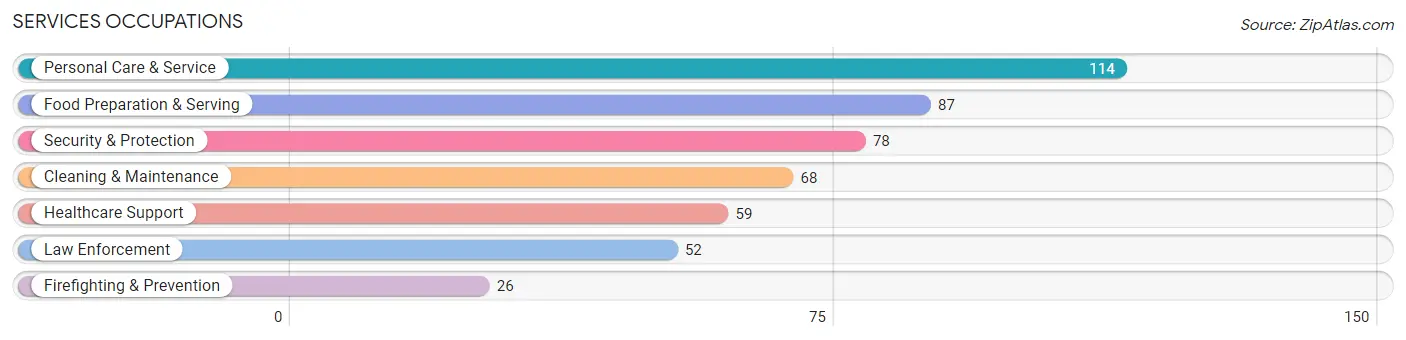
Services Occupations
The most common Services occupations in McCook County are Personal Care & Service (114 | 3.9%), Food Preparation & Serving (87 | 3.0%), Security & Protection (78 | 2.7%), Cleaning & Maintenance (68 | 2.3%), and Healthcare Support (59 | 2.0%).
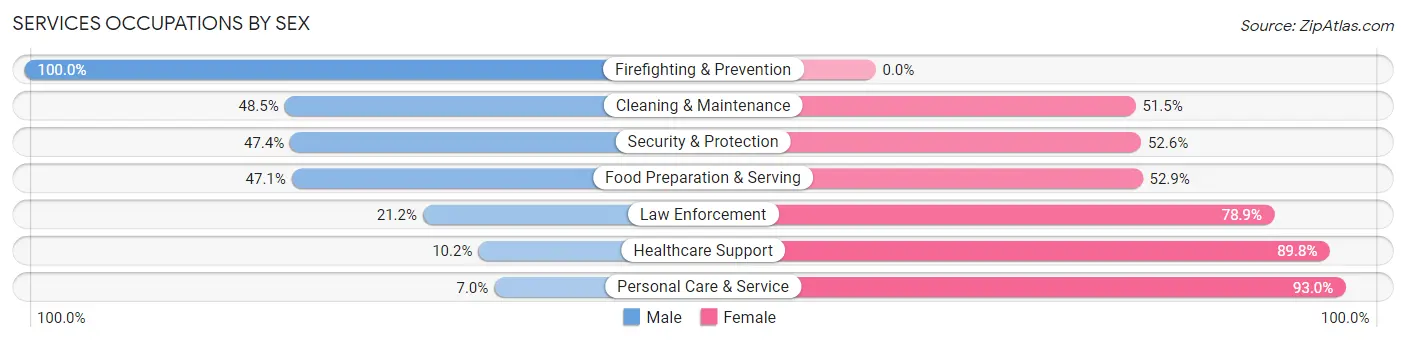
Services Occupations by Sex
Within the Services occupations in McCook County, the most male-oriented occupations are Firefighting & Prevention (100.0%), Cleaning & Maintenance (48.5%), and Security & Protection (47.4%), while the most female-oriented occupations are Personal Care & Service (93.0%), Healthcare Support (89.8%), and Law Enforcement (78.8%).
| Occupation | Male | Female |
| Healthcare Support | 6 (10.2%) | 53 (89.8%) |
| Security & Protection | 37 (47.4%) | 41 (52.6%) |
| Firefighting & Prevention | 26 (100.0%) | 0 (0.0%) |
| Law Enforcement | 11 (21.1%) | 41 (78.8%) |
| Food Preparation & Serving | 41 (47.1%) | 46 (52.9%) |
| Cleaning & Maintenance | 33 (48.5%) | 35 (51.5%) |
| Personal Care & Service | 8 (7.0%) | 106 (93.0%) |
| Total (Category) | 125 (30.8%) | 281 (69.2%) |
| Total (Overall) | 1,614 (54.9%) | 1,323 (45.1%) |
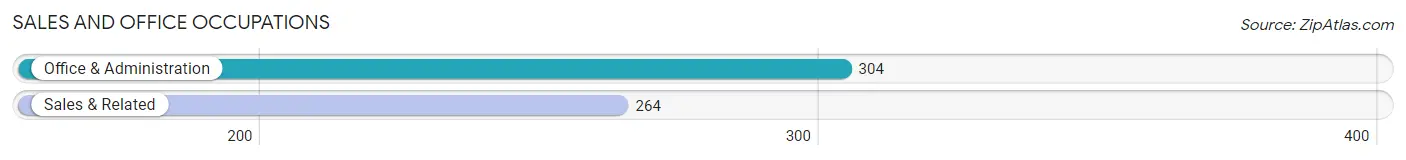
Sales and Office Occupations
The most common Sales and Office occupations in McCook County are Office & Administration (304 | 10.3%), and Sales & Related (264 | 9.0%).
Sales and Office Occupations by Sex
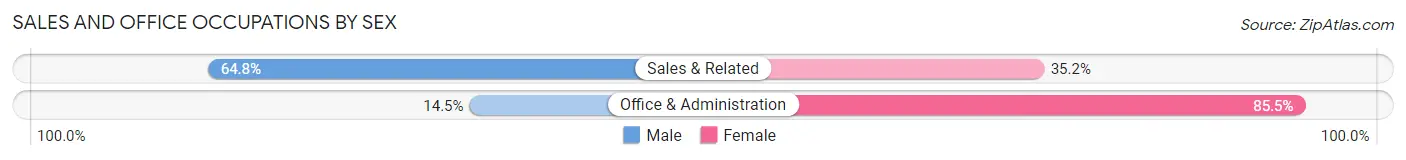
| Occupation | Male | Female |
| Sales & Related | 171 (64.8%) | 93 (35.2%) |
| Office & Administration | 44 (14.5%) | 260 (85.5%) |
| Total (Category) | 215 (37.9%) | 353 (62.2%) |
| Total (Overall) | 1,614 (54.9%) | 1,323 (45.1%) |
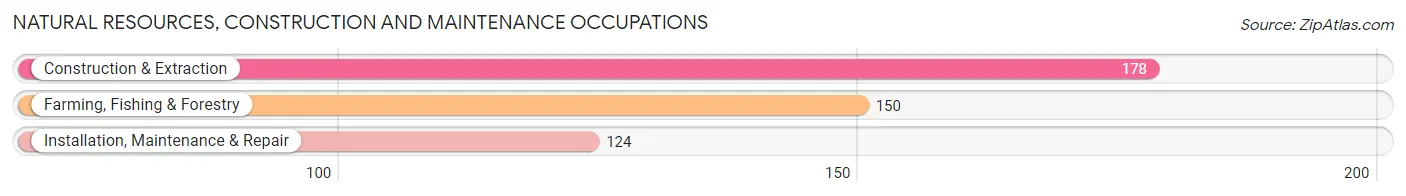
Natural Resources, Construction and Maintenance Occupations
The most common Natural Resources, Construction and Maintenance occupations in McCook County are Construction & Extraction (178 | 6.1%), Farming, Fishing & Forestry (150 | 5.1%), and Installation, Maintenance & Repair (124 | 4.2%).
Natural Resources, Construction and Maintenance Occupations by Sex
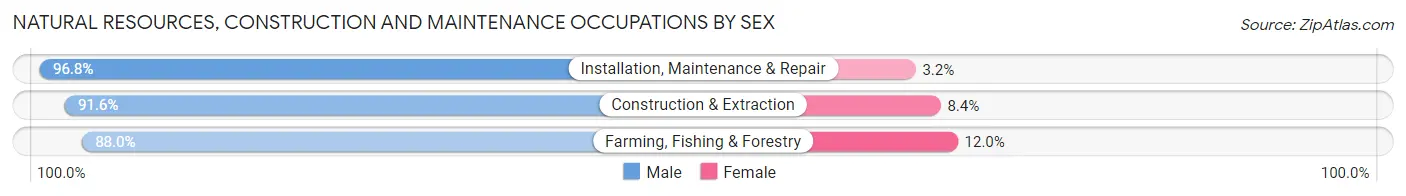
| Occupation | Male | Female |
| Farming, Fishing & Forestry | 132 (88.0%) | 18 (12.0%) |
| Construction & Extraction | 163 (91.6%) | 15 (8.4%) |
| Installation, Maintenance & Repair | 120 (96.8%) | 4 (3.2%) |
| Total (Category) | 415 (91.8%) | 37 (8.2%) |
| Total (Overall) | 1,614 (54.9%) | 1,323 (45.1%) |
Production, Transportation and Moving Occupations
The most common Production, Transportation and Moving occupations in McCook County are Transportation (150 | 5.1%), Production (113 | 3.8%), and Material Moving (49 | 1.7%).
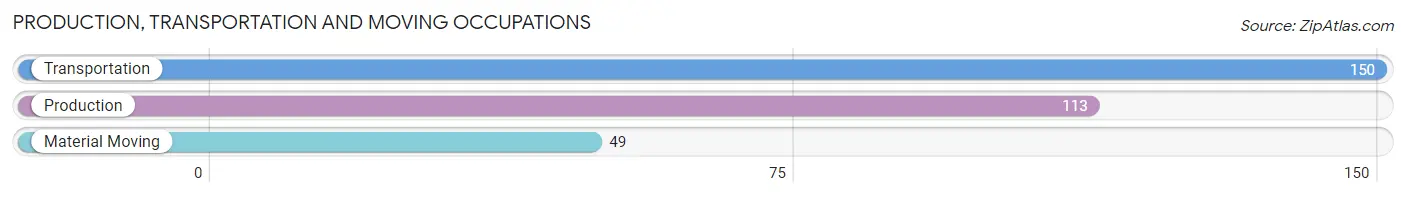
Production, Transportation and Moving Occupations by Sex
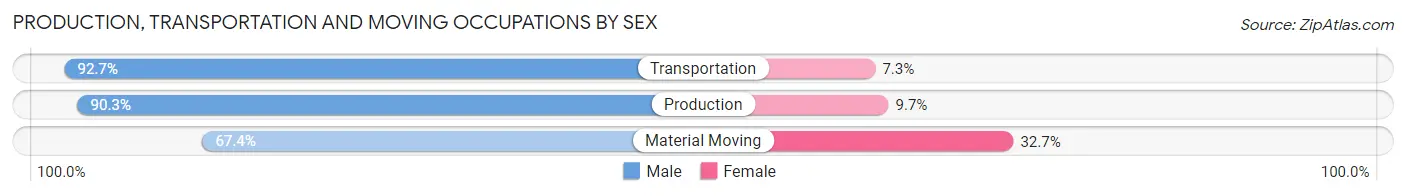
| Occupation | Male | Female |
| Production | 102 (90.3%) | 11 (9.7%) |
| Transportation | 139 (92.7%) | 11 (7.3%) |
| Material Moving | 33 (67.3%) | 16 (32.7%) |
| Total (Category) | 274 (87.8%) | 38 (12.2%) |
| Total (Overall) | 1,614 (54.9%) | 1,323 (45.1%) |
Employment Industries by Sex in McCook County
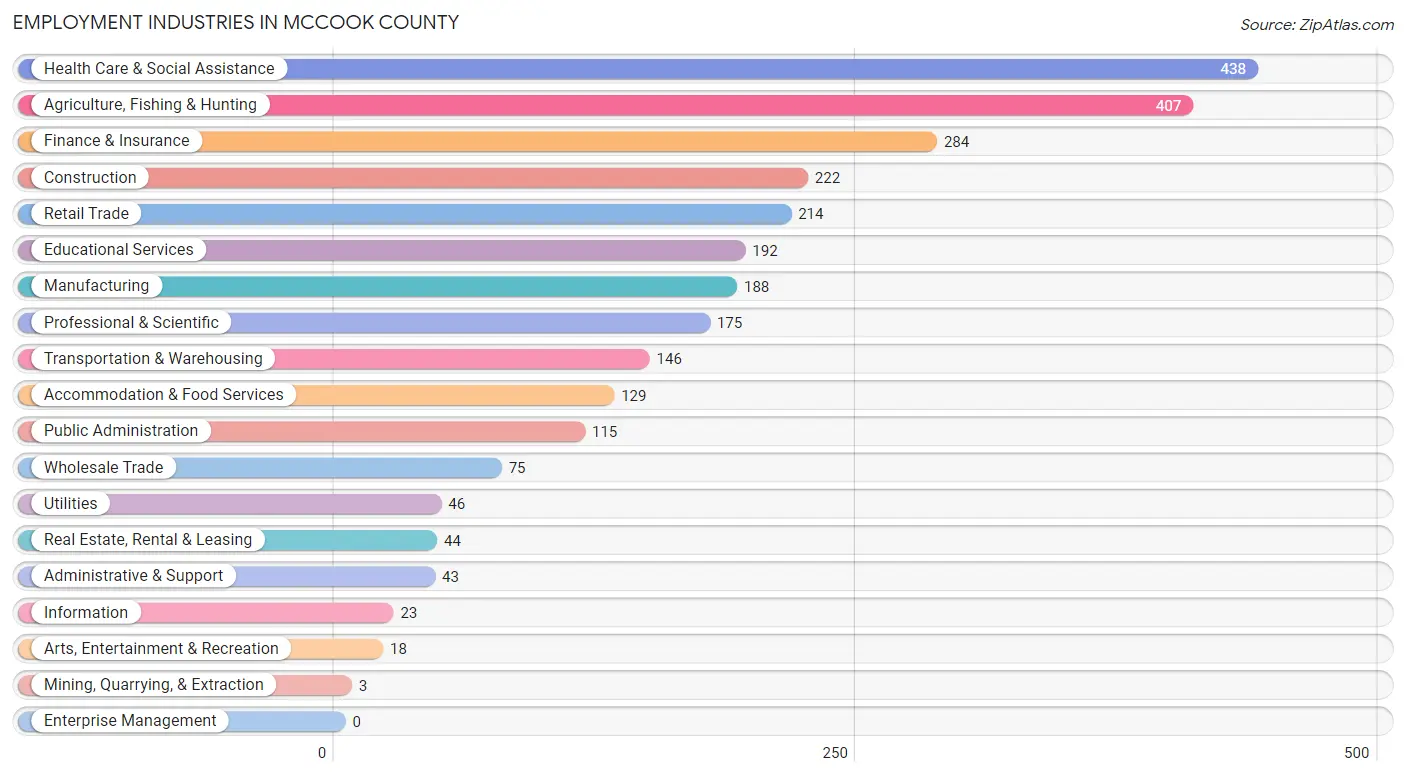
Employment Industries in McCook County
The major employment industries in McCook County include Health Care & Social Assistance (438 | 14.9%), Agriculture, Fishing & Hunting (407 | 13.9%), Finance & Insurance (284 | 9.7%), Construction (222 | 7.6%), and Retail Trade (214 | 7.3%).
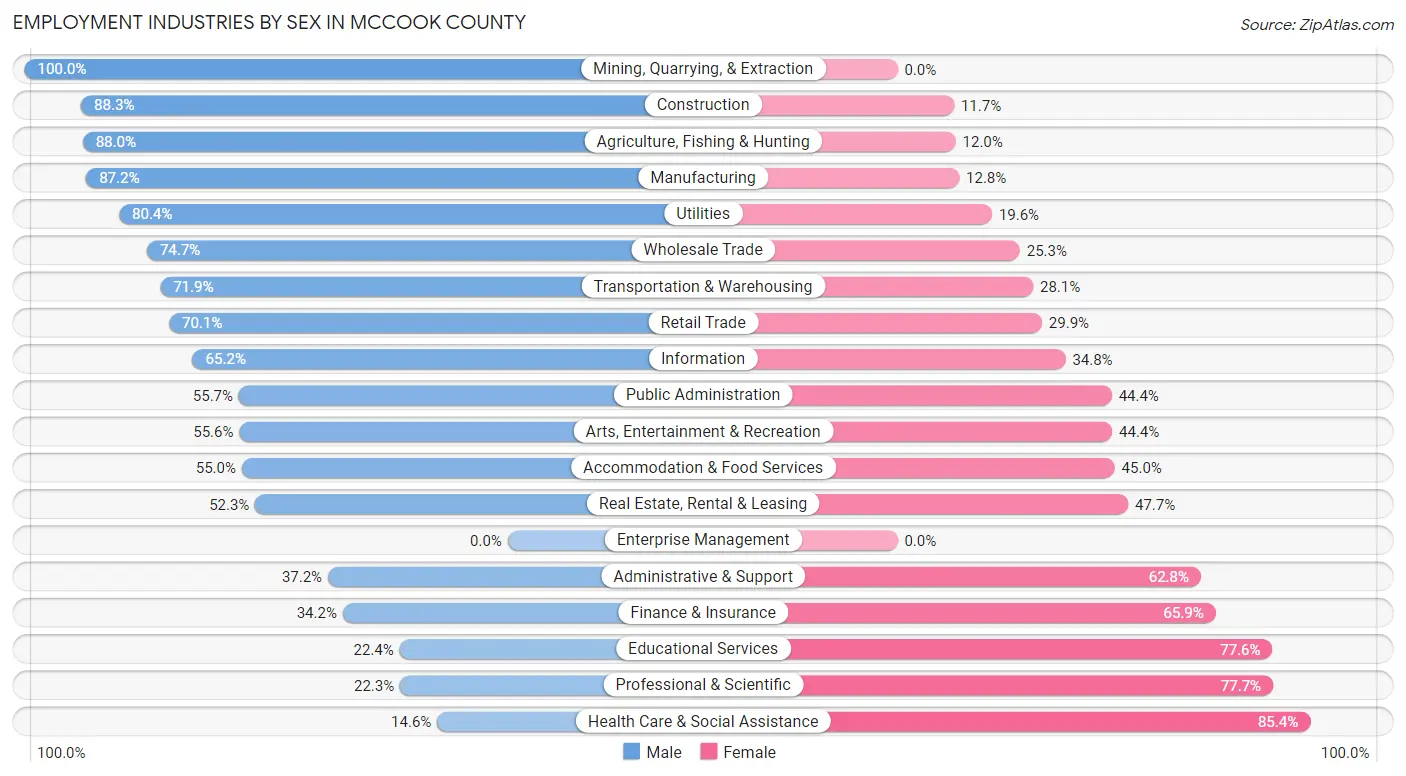
Employment Industries by Sex in McCook County
The McCook County industries that see more men than women are Mining, Quarrying, & Extraction (100.0%), Construction (88.3%), and Agriculture, Fishing & Hunting (88.0%), whereas the industries that tend to have a higher number of women are Health Care & Social Assistance (85.4%), Professional & Scientific (77.7%), and Educational Services (77.6%).
| Industry | Male | Female |
| Agriculture, Fishing & Hunting | 358 (88.0%) | 49 (12.0%) |
| Mining, Quarrying, & Extraction | 3 (100.0%) | 0 (0.0%) |
| Construction | 196 (88.3%) | 26 (11.7%) |
| Manufacturing | 164 (87.2%) | 24 (12.8%) |
| Wholesale Trade | 56 (74.7%) | 19 (25.3%) |
| Retail Trade | 150 (70.1%) | 64 (29.9%) |
| Transportation & Warehousing | 105 (71.9%) | 41 (28.1%) |
| Utilities | 37 (80.4%) | 9 (19.6%) |
| Information | 15 (65.2%) | 8 (34.8%) |
| Finance & Insurance | 97 (34.2%) | 187 (65.8%) |
| Real Estate, Rental & Leasing | 23 (52.3%) | 21 (47.7%) |
| Professional & Scientific | 39 (22.3%) | 136 (77.7%) |
| Enterprise Management | 0 (0.0%) | 0 (0.0%) |
| Administrative & Support | 16 (37.2%) | 27 (62.8%) |
| Educational Services | 43 (22.4%) | 149 (77.6%) |
| Health Care & Social Assistance | 64 (14.6%) | 374 (85.4%) |
| Arts, Entertainment & Recreation | 10 (55.6%) | 8 (44.4%) |
| Accommodation & Food Services | 71 (55.0%) | 58 (45.0%) |
| Public Administration | 64 (55.6%) | 51 (44.4%) |
| Total | 1,614 (54.9%) | 1,323 (45.1%) |
Education in McCook County
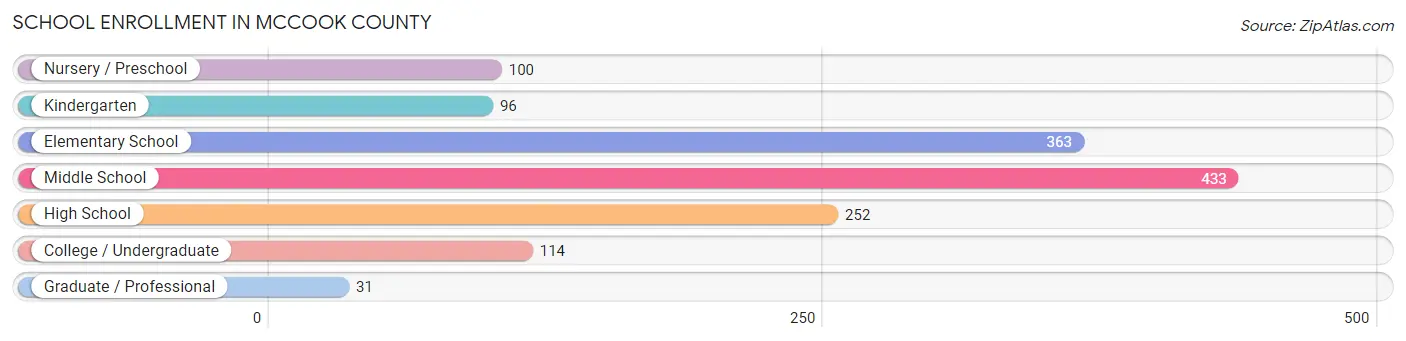
School Enrollment in McCook County
The most common levels of schooling among the 1,389 students in McCook County are middle school (433 | 31.2%), elementary school (363 | 26.1%), and high school (252 | 18.1%).
| School Level | # Students | % Students |
| Nursery / Preschool | 100 | 7.2% |
| Kindergarten | 96 | 6.9% |
| Elementary School | 363 | 26.1% |
| Middle School | 433 | 31.2% |
| High School | 252 | 18.1% |
| College / Undergraduate | 114 | 8.2% |
| Graduate / Professional | 31 | 2.2% |
| Total | 1,389 | 100.0% |
School Enrollment by Age by Funding Source in McCook County
Out of a total of 1,389 students who are enrolled in schools in McCook County, 125 (9.0%) attend a private institution, while the remaining 1,264 (91.0%) are enrolled in public schools. The age group of 3 to 4 year olds has the highest likelihood of being enrolled in private schools, with 24 (26.1% in the age bracket) enrolled. Conversely, the age group of 15 to 17 year olds has the lowest likelihood of being enrolled in a private school, with 235 (100.0% in the age bracket) attending a public institution.
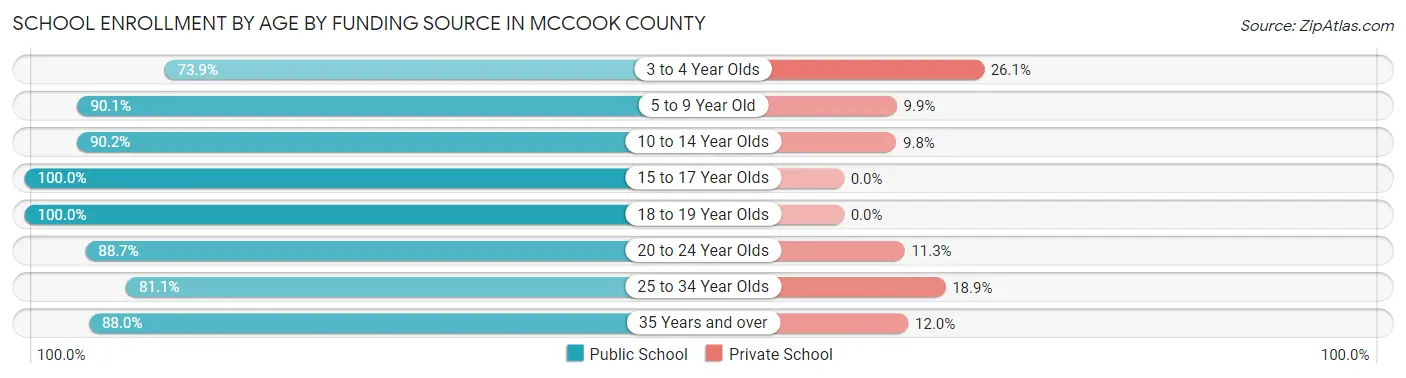
| Age Bracket | Public School | Private School |
| 3 to 4 Year Olds | 68 (73.9%) | 24 (26.1%) |
| 5 to 9 Year Old | 375 (90.1%) | 41 (9.9%) |
| 10 to 14 Year Olds | 407 (90.2%) | 44 (9.8%) |
| 15 to 17 Year Olds | 235 (100.0%) | 0 (0.0%) |
| 18 to 19 Year Olds | 80 (100.0%) | 0 (0.0%) |
| 20 to 24 Year Olds | 47 (88.7%) | 6 (11.3%) |
| 25 to 34 Year Olds | 30 (81.1%) | 7 (18.9%) |
| 35 Years and over | 22 (88.0%) | 3 (12.0%) |
| Total | 1,264 (91.0%) | 125 (9.0%) |
Educational Attainment by Field of Study in McCook County
Education (296 | 26.6%), science & technology (184 | 16.5%), business (154 | 13.8%), bio, nature & agricultural (127 | 11.4%), and arts & humanities (60 | 5.4%) are the most common fields of study among 1,113 individuals in McCook County who have obtained a bachelor's degree or higher.
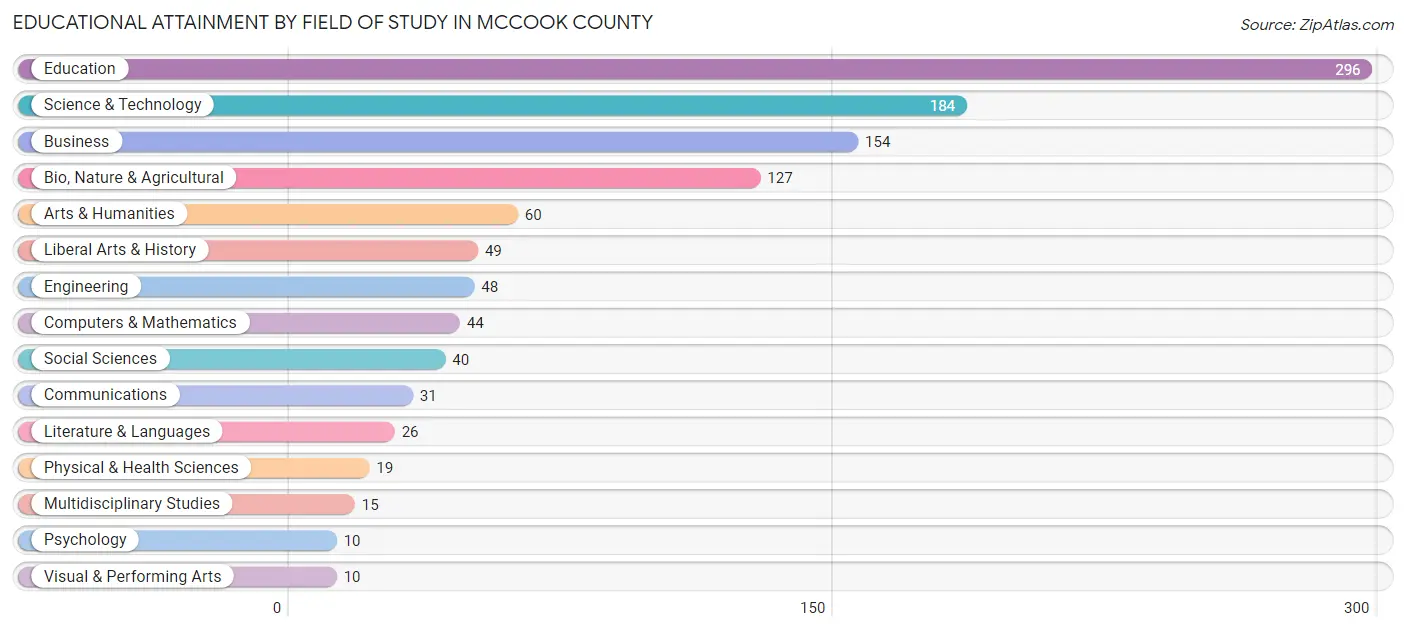
| Field of Study | # Graduates | % Graduates |
| Computers & Mathematics | 44 | 4.0% |
| Bio, Nature & Agricultural | 127 | 11.4% |
| Physical & Health Sciences | 19 | 1.7% |
| Psychology | 10 | 0.9% |
| Social Sciences | 40 | 3.6% |
| Engineering | 48 | 4.3% |
| Multidisciplinary Studies | 15 | 1.3% |
| Science & Technology | 184 | 16.5% |
| Business | 154 | 13.8% |
| Education | 296 | 26.6% |
| Literature & Languages | 26 | 2.3% |
| Liberal Arts & History | 49 | 4.4% |
| Visual & Performing Arts | 10 | 0.9% |
| Communications | 31 | 2.8% |
| Arts & Humanities | 60 | 5.4% |
| Total | 1,113 | 100.0% |
Transportation & Commute in McCook County
Vehicle Availability by Sex in McCook County
The most prevalent vehicle ownership categories in McCook County are males with 2 vehicles (501, accounting for 31.8%) and females with 2 vehicles (368, making up 38.6%).
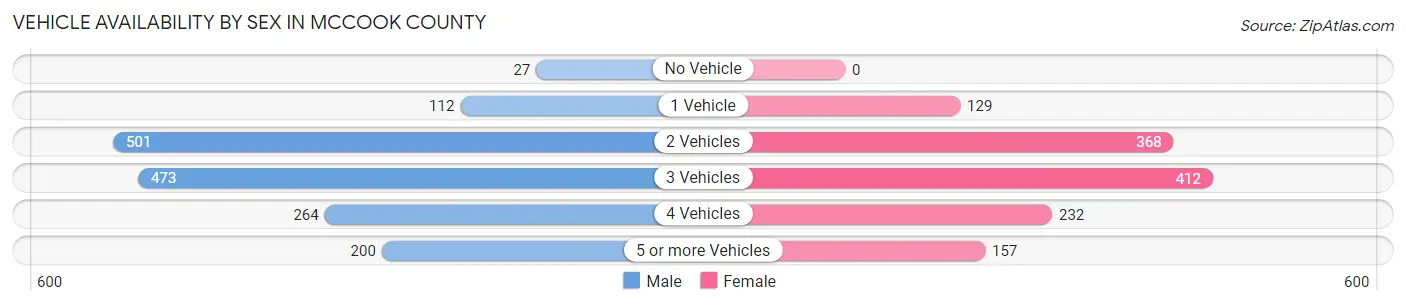
| Vehicles Available | Male | Female |
| No Vehicle | 27 (1.7%) | 0 (0.0%) |
| 1 Vehicle | 112 (7.1%) | 129 (9.9%) |
| 2 Vehicles | 501 (31.8%) | 368 (28.3%) |
| 3 Vehicles | 473 (30.0%) | 412 (31.7%) |
| 4 Vehicles | 264 (16.7%) | 232 (17.9%) |
| 5 or more Vehicles | 200 (12.7%) | 157 (12.1%) |
| Total | 1,577 (100.0%) | 1,298 (100.0%) |
Commute Time in McCook County
The most frequently occuring commute durations in McCook County are less than 5 minutes (463 commuters, 17.4%), 45 to 59 minutes (451 commuters, 17.0%), and 5 to 9 minutes (315 commuters, 11.9%).
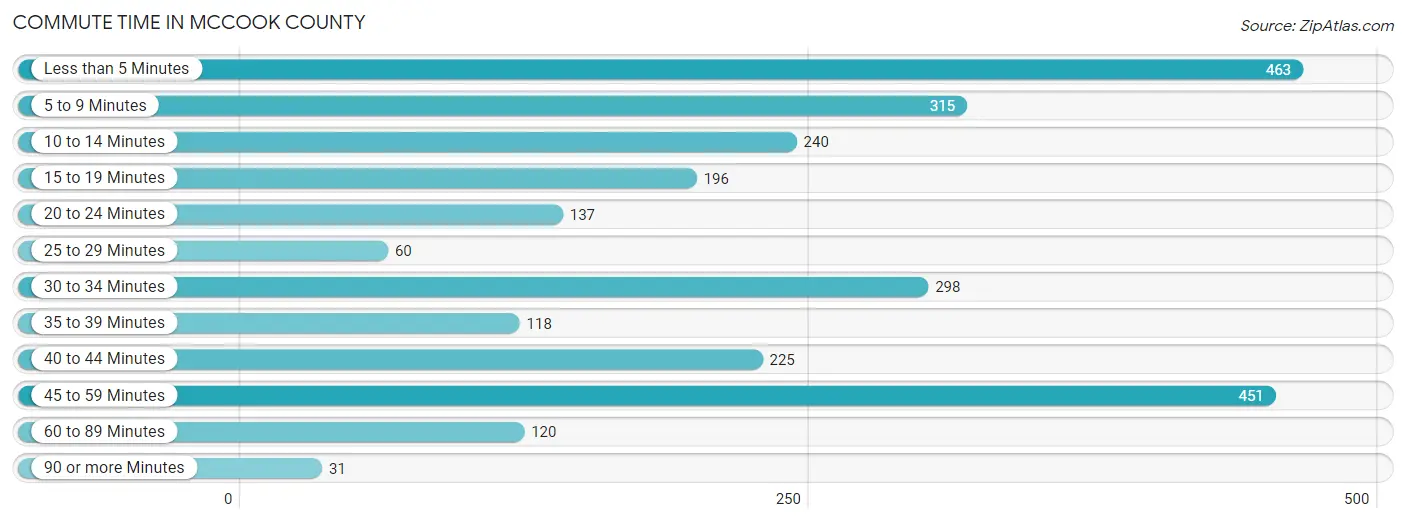
| Commute Time | # Commuters | % Commuters |
| Less than 5 Minutes | 463 | 17.4% |
| 5 to 9 Minutes | 315 | 11.9% |
| 10 to 14 Minutes | 240 | 9.0% |
| 15 to 19 Minutes | 196 | 7.4% |
| 20 to 24 Minutes | 137 | 5.2% |
| 25 to 29 Minutes | 60 | 2.3% |
| 30 to 34 Minutes | 298 | 11.2% |
| 35 to 39 Minutes | 118 | 4.4% |
| 40 to 44 Minutes | 225 | 8.5% |
| 45 to 59 Minutes | 451 | 17.0% |
| 60 to 89 Minutes | 120 | 4.5% |
| 90 or more Minutes | 31 | 1.2% |
Commute Time by Sex in McCook County
The most common commute times in McCook County are less than 5 minutes (313 commuters, 21.2%) for males and 45 to 59 minutes (196 commuters, 16.6%) for females.
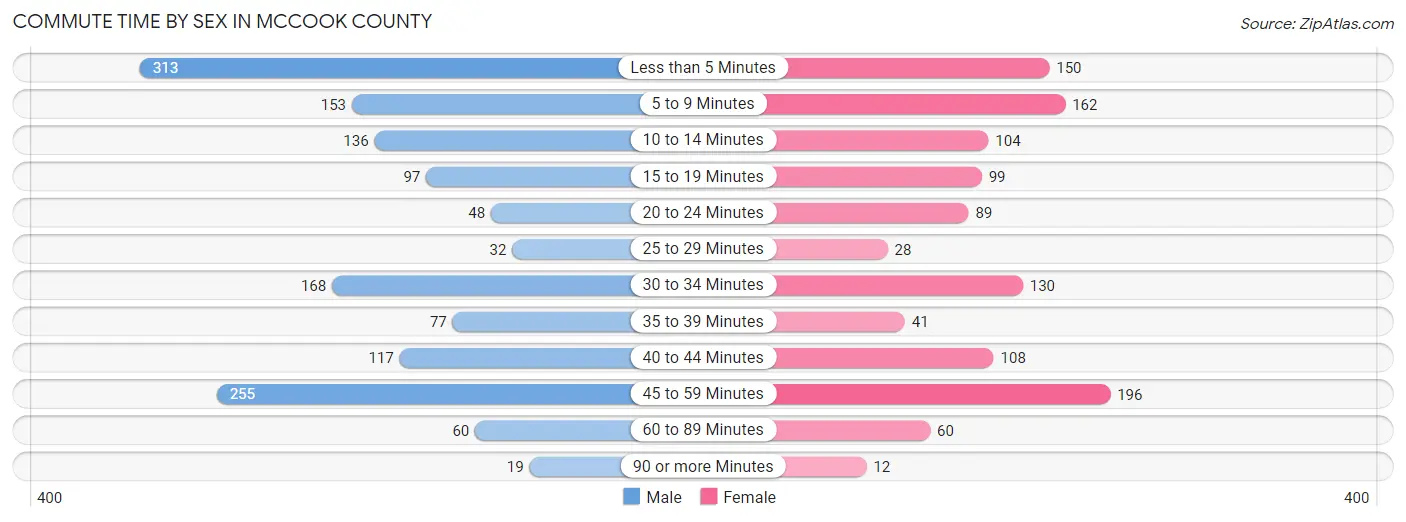
| Commute Time | Male | Female |
| Less than 5 Minutes | 313 (21.2%) | 150 (12.7%) |
| 5 to 9 Minutes | 153 (10.4%) | 162 (13.7%) |
| 10 to 14 Minutes | 136 (9.2%) | 104 (8.8%) |
| 15 to 19 Minutes | 97 (6.6%) | 99 (8.4%) |
| 20 to 24 Minutes | 48 (3.3%) | 89 (7.5%) |
| 25 to 29 Minutes | 32 (2.2%) | 28 (2.4%) |
| 30 to 34 Minutes | 168 (11.4%) | 130 (11.0%) |
| 35 to 39 Minutes | 77 (5.2%) | 41 (3.5%) |
| 40 to 44 Minutes | 117 (7.9%) | 108 (9.2%) |
| 45 to 59 Minutes | 255 (17.3%) | 196 (16.6%) |
| 60 to 89 Minutes | 60 (4.1%) | 60 (5.1%) |
| 90 or more Minutes | 19 (1.3%) | 12 (1.0%) |
Time of Departure to Work by Sex in McCook County
The most frequent times of departure to work in McCook County are 7:00 AM to 7:29 AM (248, 16.8%) for males and 7:30 AM to 7:59 AM (249, 21.1%) for females.
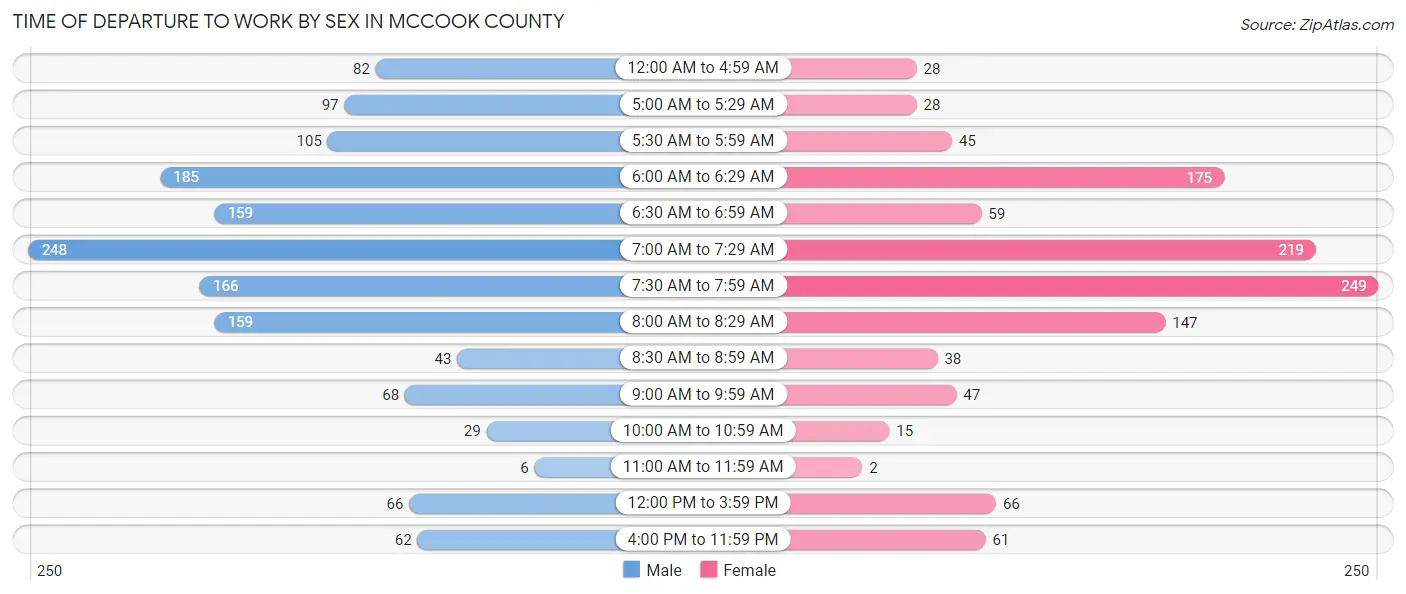
| Time of Departure | Male | Female |
| 12:00 AM to 4:59 AM | 82 (5.6%) | 28 (2.4%) |
| 5:00 AM to 5:29 AM | 97 (6.6%) | 28 (2.4%) |
| 5:30 AM to 5:59 AM | 105 (7.1%) | 45 (3.8%) |
| 6:00 AM to 6:29 AM | 185 (12.5%) | 175 (14.8%) |
| 6:30 AM to 6:59 AM | 159 (10.8%) | 59 (5.0%) |
| 7:00 AM to 7:29 AM | 248 (16.8%) | 219 (18.6%) |
| 7:30 AM to 7:59 AM | 166 (11.3%) | 249 (21.1%) |
| 8:00 AM to 8:29 AM | 159 (10.8%) | 147 (12.5%) |
| 8:30 AM to 8:59 AM | 43 (2.9%) | 38 (3.2%) |
| 9:00 AM to 9:59 AM | 68 (4.6%) | 47 (4.0%) |
| 10:00 AM to 10:59 AM | 29 (2.0%) | 15 (1.3%) |
| 11:00 AM to 11:59 AM | 6 (0.4%) | 2 (0.2%) |
| 12:00 PM to 3:59 PM | 66 (4.5%) | 66 (5.6%) |
| 4:00 PM to 11:59 PM | 62 (4.2%) | 61 (5.2%) |
| Total | 1,475 (100.0%) | 1,179 (100.0%) |
Housing Occupancy in McCook County
Occupancy by Ownership in McCook County
Of the total 2,218 dwellings in McCook County, owner-occupied units account for 1,820 (82.1%), while renter-occupied units make up 398 (17.9%).
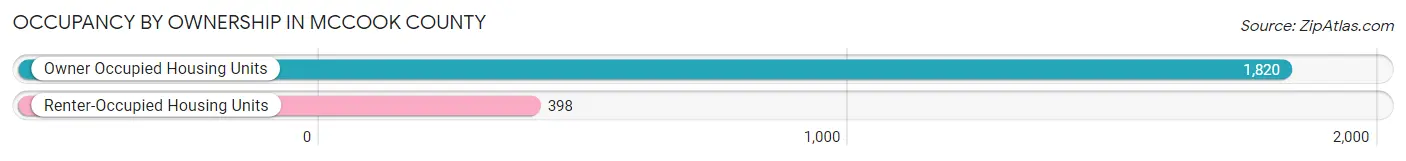
| Occupancy | # Housing Units | % Housing Units |
| Owner Occupied Housing Units | 1,820 | 82.1% |
| Renter-Occupied Housing Units | 398 | 17.9% |
| Total Occupied Housing Units | 2,218 | 100.0% |
Occupancy by Household Size in McCook County
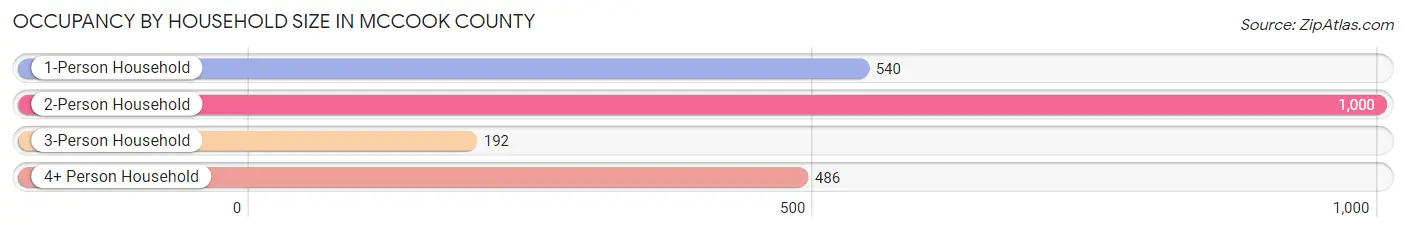
| Household Size | # Housing Units | % Housing Units |
| 1-Person Household | 540 | 24.3% |
| 2-Person Household | 1,000 | 45.1% |
| 3-Person Household | 192 | 8.7% |
| 4+ Person Household | 486 | 21.9% |
| Total Housing Units | 2,218 | 100.0% |
Occupancy by Ownership by Household Size in McCook County
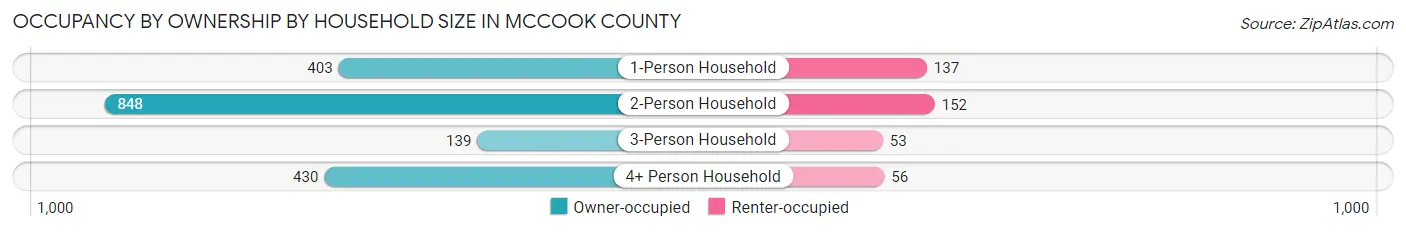
| Household Size | Owner-occupied | Renter-occupied |
| 1-Person Household | 403 (74.6%) | 137 (25.4%) |
| 2-Person Household | 848 (84.8%) | 152 (15.2%) |
| 3-Person Household | 139 (72.4%) | 53 (27.6%) |
| 4+ Person Household | 430 (88.5%) | 56 (11.5%) |
| Total Housing Units | 1,820 (82.1%) | 398 (17.9%) |
Occupancy by Educational Attainment in McCook County
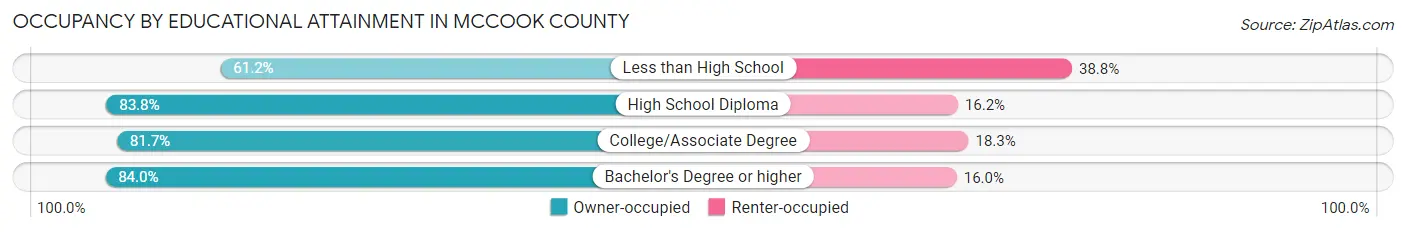
| Household Size | Owner-occupied | Renter-occupied |
| Less than High School | 63 (61.2%) | 40 (38.8%) |
| High School Diploma | 641 (83.8%) | 124 (16.2%) |
| College/Associate Degree | 638 (81.7%) | 143 (18.3%) |
| Bachelor's Degree or higher | 478 (84.0%) | 91 (16.0%) |
Occupancy by Age of Householder in McCook County
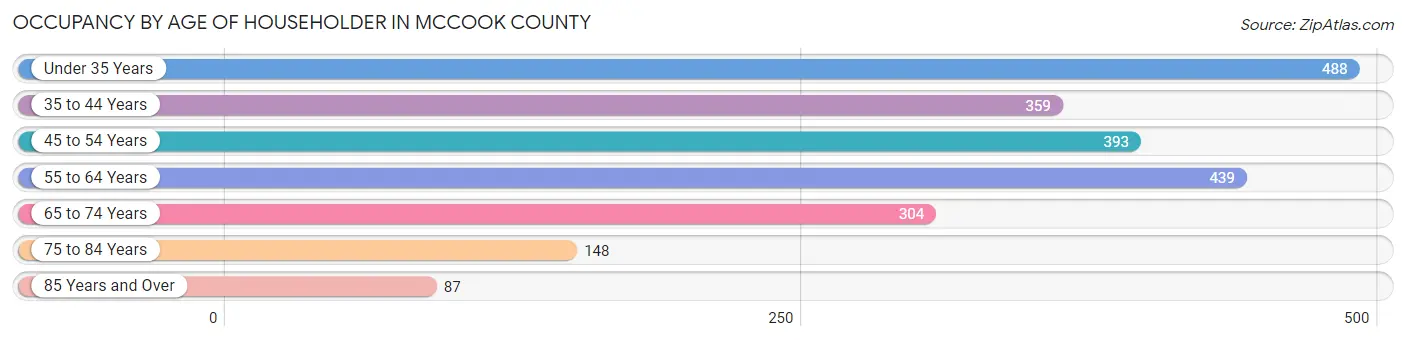
| Age Bracket | # Households | % Households |
| Under 35 Years | 488 | 22.0% |
| 35 to 44 Years | 359 | 16.2% |
| 45 to 54 Years | 393 | 17.7% |
| 55 to 64 Years | 439 | 19.8% |
| 65 to 74 Years | 304 | 13.7% |
| 75 to 84 Years | 148 | 6.7% |
| 85 Years and Over | 87 | 3.9% |
| Total | 2,218 | 100.0% |
Housing Finances in McCook County
Median Income by Occupancy in McCook County
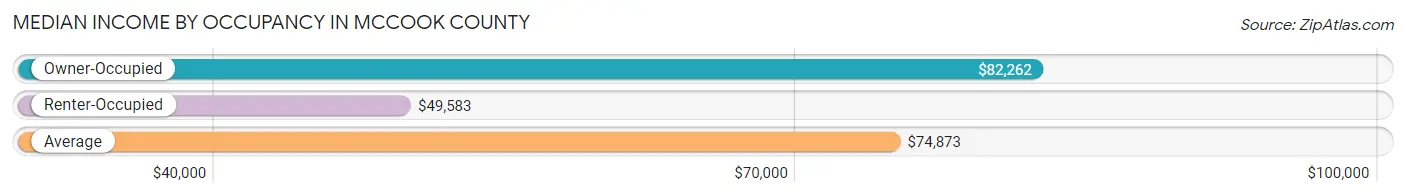
| Occupancy Type | # Households | Median Income |
| Owner-Occupied | 1,820 (82.1%) | $82,262 |
| Renter-Occupied | 398 (17.9%) | $49,583 |
| Average | 2,218 (100.0%) | $74,873 |
Occupancy by Householder Income Bracket in McCook County
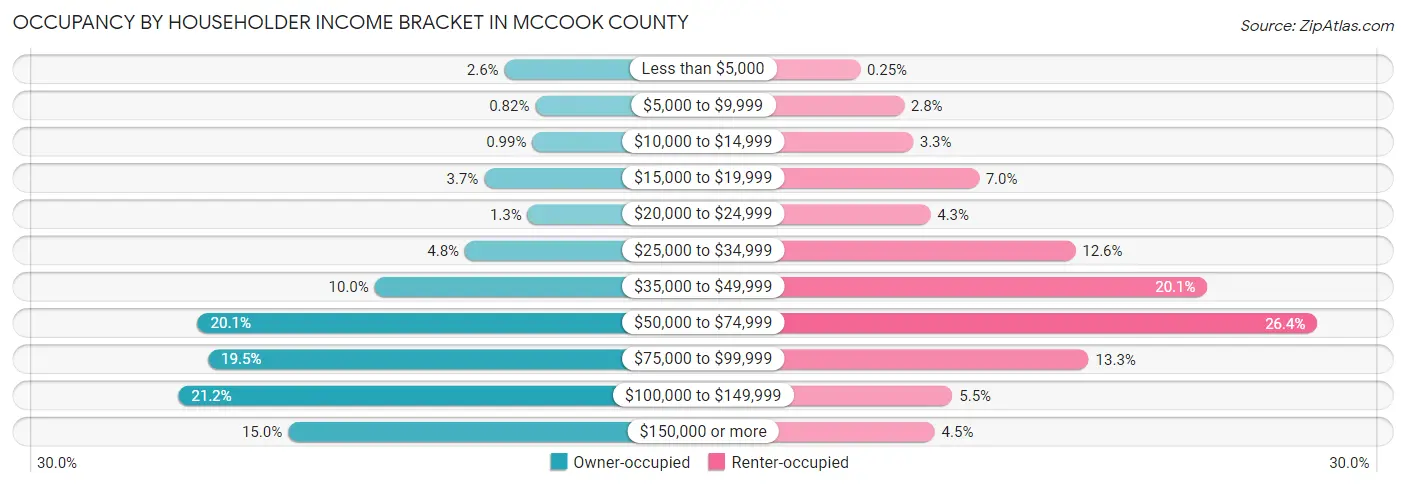
| Income Bracket | Owner-occupied | Renter-occupied |
| Less than $5,000 | 47 (2.6%) | 1 (0.3%) |
| $5,000 to $9,999 | 15 (0.8%) | 11 (2.8%) |
| $10,000 to $14,999 | 18 (1.0%) | 13 (3.3%) |
| $15,000 to $19,999 | 68 (3.7%) | 28 (7.0%) |
| $20,000 to $24,999 | 23 (1.3%) | 17 (4.3%) |
| $25,000 to $34,999 | 88 (4.8%) | 50 (12.6%) |
| $35,000 to $49,999 | 182 (10.0%) | 80 (20.1%) |
| $50,000 to $74,999 | 366 (20.1%) | 105 (26.4%) |
| $75,000 to $99,999 | 355 (19.5%) | 53 (13.3%) |
| $100,000 to $149,999 | 386 (21.2%) | 22 (5.5%) |
| $150,000 or more | 272 (14.9%) | 18 (4.5%) |
| Total | 1,820 (100.0%) | 398 (100.0%) |
Monthly Housing Cost Tiers in McCook County
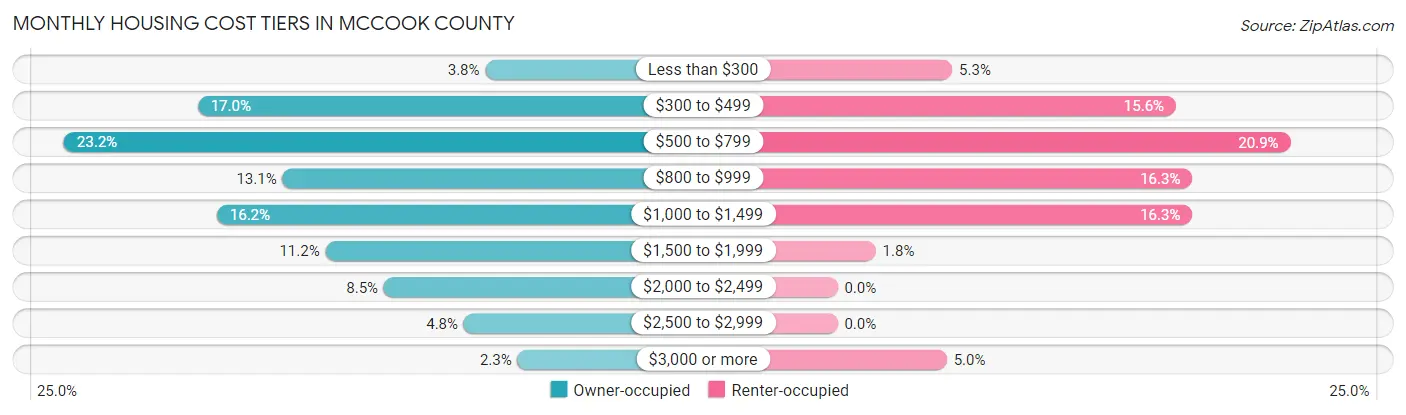
| Monthly Cost | Owner-occupied | Renter-occupied |
| Less than $300 | 69 (3.8%) | 21 (5.3%) |
| $300 to $499 | 310 (17.0%) | 62 (15.6%) |
| $500 to $799 | 422 (23.2%) | 83 (20.8%) |
| $800 to $999 | 239 (13.1%) | 65 (16.3%) |
| $1,000 to $1,499 | 294 (16.2%) | 65 (16.3%) |
| $1,500 to $1,999 | 203 (11.2%) | 7 (1.8%) |
| $2,000 to $2,499 | 154 (8.5%) | 0 (0.0%) |
| $2,500 to $2,999 | 87 (4.8%) | 0 (0.0%) |
| $3,000 or more | 42 (2.3%) | 20 (5.0%) |
| Total | 1,820 (100.0%) | 398 (100.0%) |
Physical Housing Characteristics in McCook County
Housing Structures in McCook County
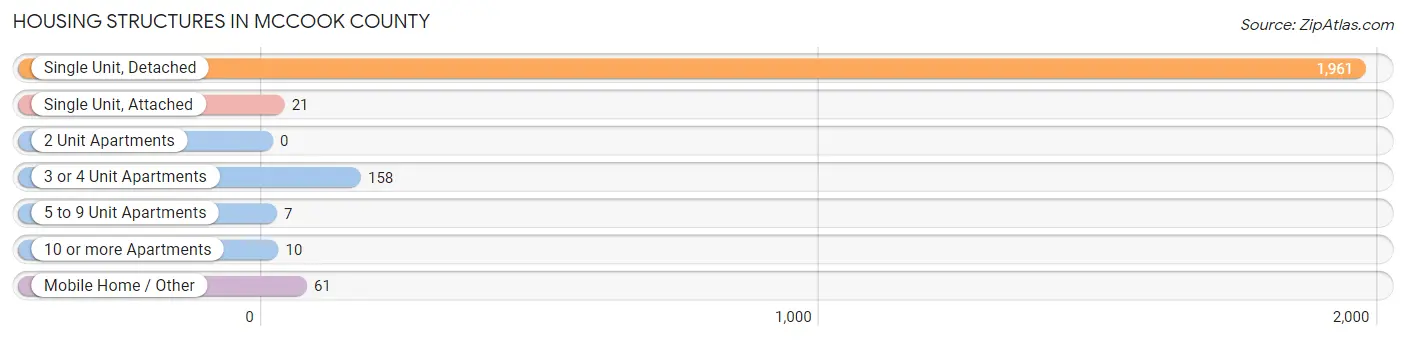
| Structure Type | # Housing Units | % Housing Units |
| Single Unit, Detached | 1,961 | 88.4% |
| Single Unit, Attached | 21 | 0.9% |
| 2 Unit Apartments | 0 | 0.0% |
| 3 or 4 Unit Apartments | 158 | 7.1% |
| 5 to 9 Unit Apartments | 7 | 0.3% |
| 10 or more Apartments | 10 | 0.4% |
| Mobile Home / Other | 61 | 2.8% |
| Total | 2,218 | 100.0% |
Housing Structures by Occupancy in McCook County
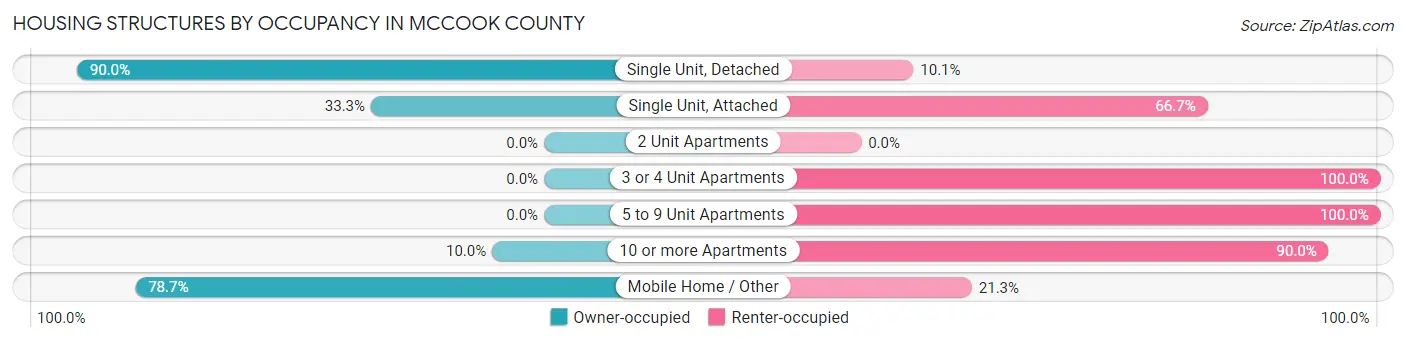
| Structure Type | Owner-occupied | Renter-occupied |
| Single Unit, Detached | 1,764 (89.9%) | 197 (10.1%) |
| Single Unit, Attached | 7 (33.3%) | 14 (66.7%) |
| 2 Unit Apartments | 0 (0.0%) | 0 (0.0%) |
| 3 or 4 Unit Apartments | 0 (0.0%) | 158 (100.0%) |
| 5 to 9 Unit Apartments | 0 (0.0%) | 7 (100.0%) |
| 10 or more Apartments | 1 (10.0%) | 9 (90.0%) |
| Mobile Home / Other | 48 (78.7%) | 13 (21.3%) |
| Total | 1,820 (82.1%) | 398 (17.9%) |
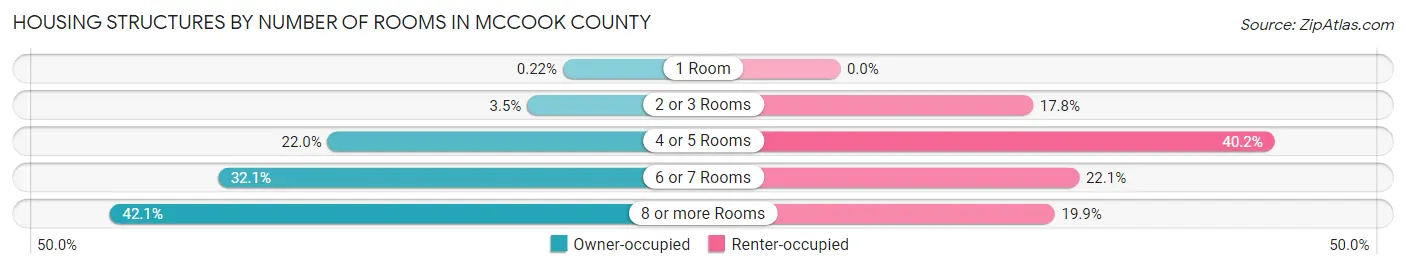
Housing Structures by Number of Rooms in McCook County
| Number of Rooms | Owner-occupied | Renter-occupied |
| 1 Room | 4 (0.2%) | 0 (0.0%) |
| 2 or 3 Rooms | 64 (3.5%) | 71 (17.8%) |
| 4 or 5 Rooms | 400 (22.0%) | 160 (40.2%) |
| 6 or 7 Rooms | 585 (32.1%) | 88 (22.1%) |
| 8 or more Rooms | 767 (42.1%) | 79 (19.9%) |
| Total | 1,820 (100.0%) | 398 (100.0%) |
Housing Structure by Heating Type in McCook County
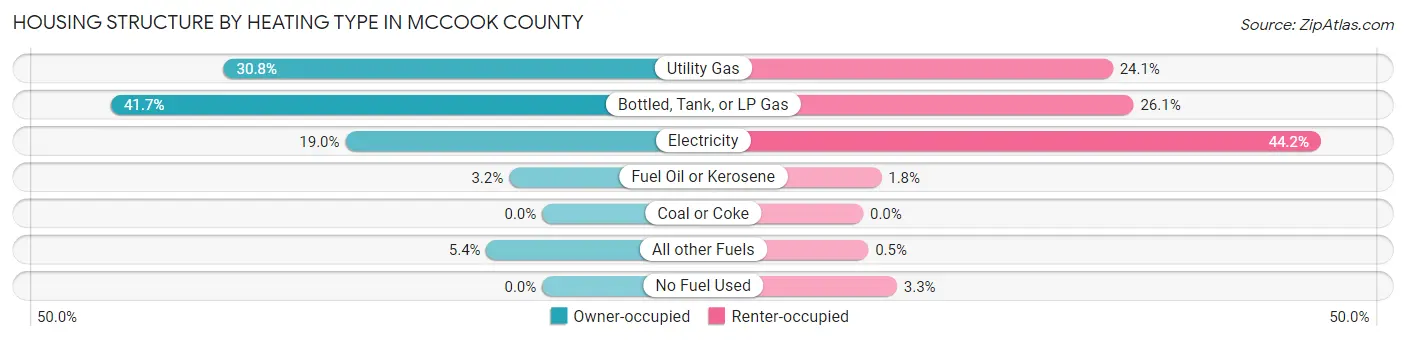
| Heating Type | Owner-occupied | Renter-occupied |
| Utility Gas | 560 (30.8%) | 96 (24.1%) |
| Bottled, Tank, or LP Gas | 758 (41.6%) | 104 (26.1%) |
| Electricity | 346 (19.0%) | 176 (44.2%) |
| Fuel Oil or Kerosene | 58 (3.2%) | 7 (1.8%) |
| Coal or Coke | 0 (0.0%) | 0 (0.0%) |
| All other Fuels | 98 (5.4%) | 2 (0.5%) |
| No Fuel Used | 0 (0.0%) | 13 (3.3%) |
| Total | 1,820 (100.0%) | 398 (100.0%) |
Household Vehicle Usage in McCook County
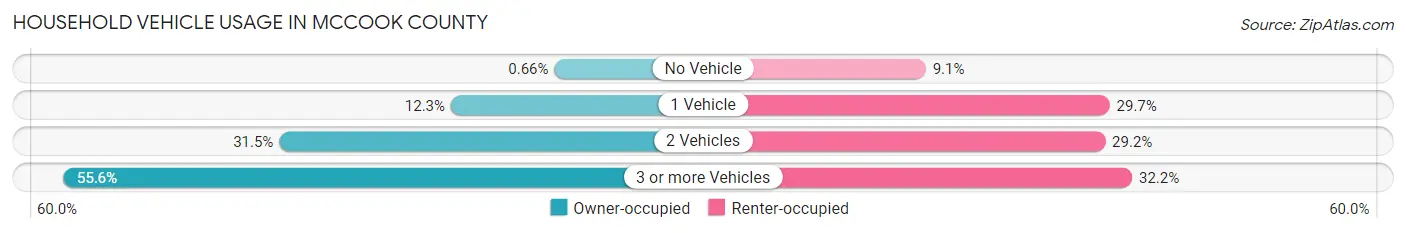
| Vehicles per Household | Owner-occupied | Renter-occupied |
| No Vehicle | 12 (0.7%) | 36 (9.0%) |
| 1 Vehicle | 223 (12.2%) | 118 (29.6%) |
| 2 Vehicles | 573 (31.5%) | 116 (29.1%) |
| 3 or more Vehicles | 1,012 (55.6%) | 128 (32.2%) |
| Total | 1,820 (100.0%) | 398 (100.0%) |
Real Estate & Mortgages in McCook County
Real Estate and Mortgage Overview in McCook County
| Characteristic | Without Mortgage | With Mortgage |
| Housing Units | 854 | 966 |
| Median Property Value | $152,900 | $218,700 |
| Median Household Income | $68,971 | $158 |
| Monthly Housing Costs | $527 | $42 |
| Real Estate Taxes | $1,849 | $4 |
Property Value by Mortgage Status in McCook County
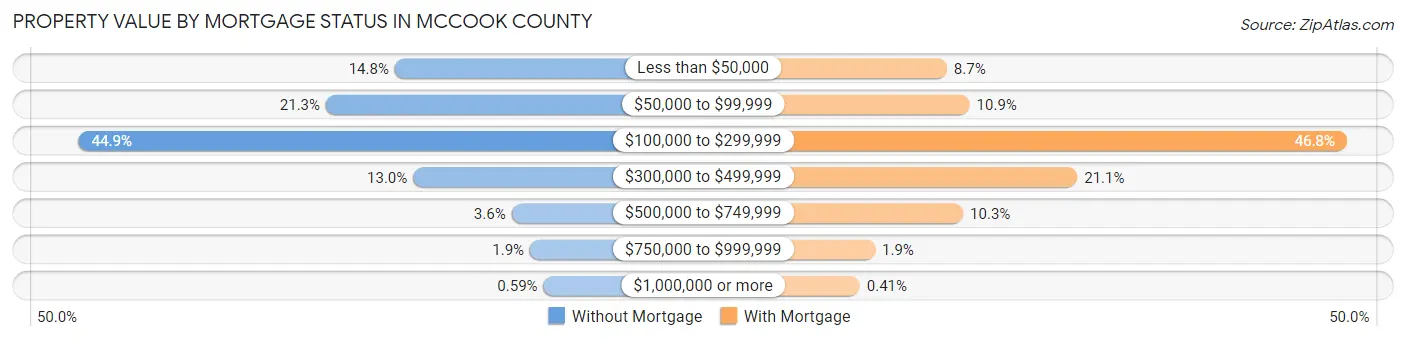
| Property Value | Without Mortgage | With Mortgage |
| Less than $50,000 | 126 (14.7%) | 84 (8.7%) |
| $50,000 to $99,999 | 182 (21.3%) | 105 (10.9%) |
| $100,000 to $299,999 | 383 (44.9%) | 452 (46.8%) |
| $300,000 to $499,999 | 111 (13.0%) | 204 (21.1%) |
| $500,000 to $749,999 | 31 (3.6%) | 99 (10.2%) |
| $750,000 to $999,999 | 16 (1.9%) | 18 (1.9%) |
| $1,000,000 or more | 5 (0.6%) | 4 (0.4%) |
| Total | 854 (100.0%) | 966 (100.0%) |
Household Income by Mortgage Status in McCook County
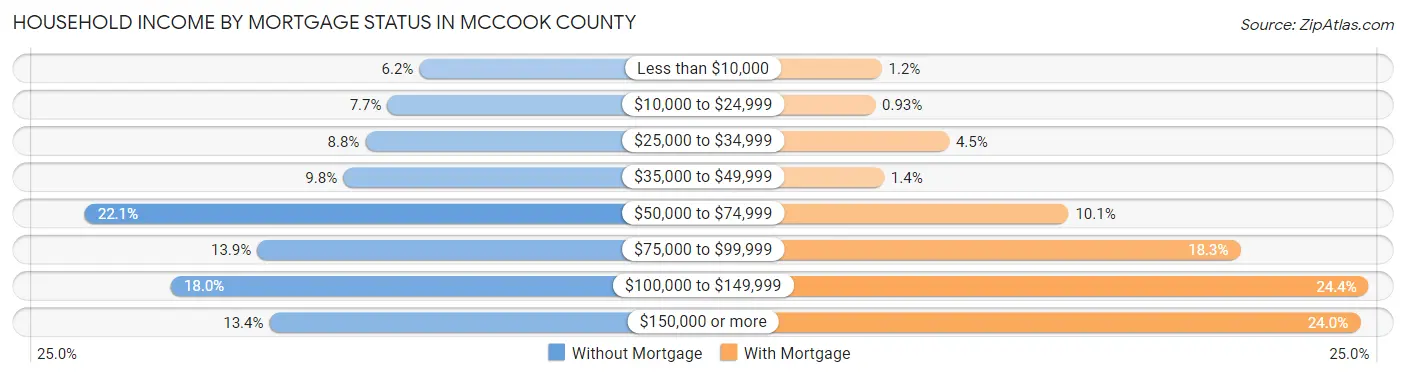
| Household Income | Without Mortgage | With Mortgage |
| Less than $10,000 | 53 (6.2%) | 12 (1.2%) |
| $10,000 to $24,999 | 66 (7.7%) | 9 (0.9%) |
| $25,000 to $34,999 | 75 (8.8%) | 43 (4.4%) |
| $35,000 to $49,999 | 84 (9.8%) | 13 (1.3%) |
| $50,000 to $74,999 | 189 (22.1%) | 98 (10.1%) |
| $75,000 to $99,999 | 119 (13.9%) | 177 (18.3%) |
| $100,000 to $149,999 | 154 (18.0%) | 236 (24.4%) |
| $150,000 or more | 114 (13.4%) | 232 (24.0%) |
| Total | 854 (100.0%) | 966 (100.0%) |
Property Value to Household Income Ratio in McCook County
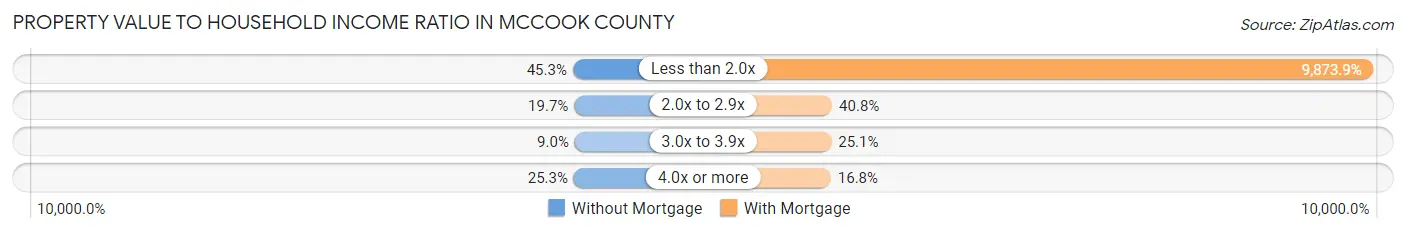
| Value-to-Income Ratio | Without Mortgage | With Mortgage |
| Less than 2.0x | 387 (45.3%) | 95,382 (9,873.9%) |
| 2.0x to 2.9x | 168 (19.7%) | 394 (40.8%) |
| 3.0x to 3.9x | 77 (9.0%) | 242 (25.1%) |
| 4.0x or more | 216 (25.3%) | 162 (16.8%) |
| Total | 854 (100.0%) | 966 (100.0%) |
Real Estate Taxes by Mortgage Status in McCook County
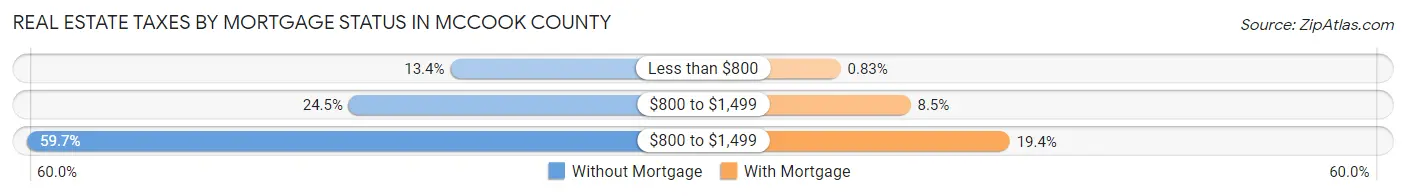
| Property Taxes | Without Mortgage | With Mortgage |
| Less than $800 | 114 (13.4%) | 8 (0.8%) |
| $800 to $1,499 | 209 (24.5%) | 82 (8.5%) |
| $800 to $1,499 | 510 (59.7%) | 187 (19.4%) |
| Total | 854 (100.0%) | 966 (100.0%) |
Health & Disability in McCook County
Health Insurance Coverage by Age in McCook County
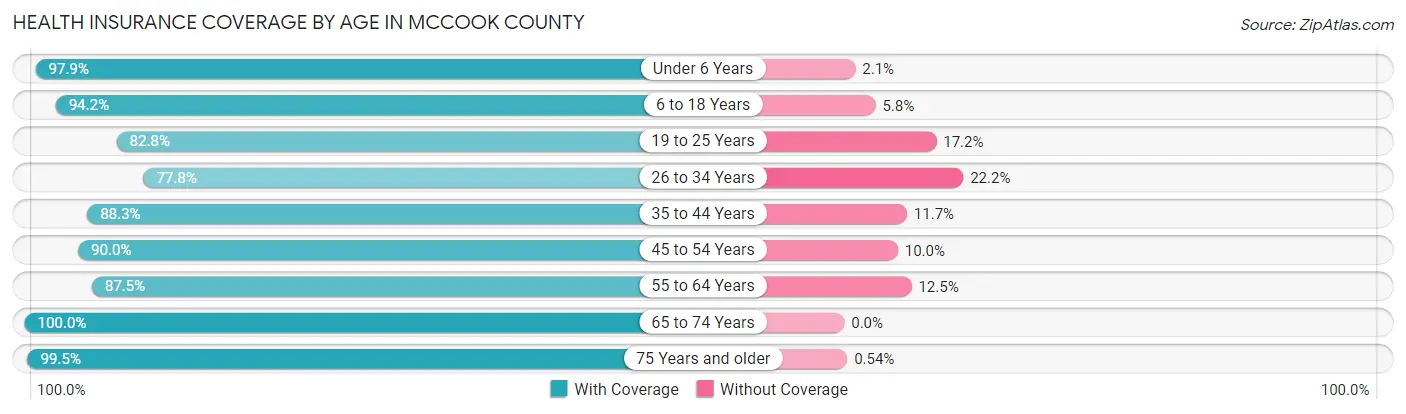
| Age Bracket | With Coverage | Without Coverage |
| Under 6 Years | 522 (97.9%) | 11 (2.1%) |
| 6 to 18 Years | 1,053 (94.2%) | 65 (5.8%) |
| 19 to 25 Years | 338 (82.8%) | 70 (17.2%) |
| 26 to 34 Years | 407 (77.8%) | 116 (22.2%) |
| 35 to 44 Years | 620 (88.3%) | 82 (11.7%) |
| 45 to 54 Years | 560 (90.0%) | 62 (10.0%) |
| 55 to 64 Years | 649 (87.5%) | 93 (12.5%) |
| 65 to 74 Years | 540 (100.0%) | 0 (0.0%) |
| 75 Years and older | 371 (99.5%) | 2 (0.5%) |
| Total | 5,060 (91.0%) | 501 (9.0%) |
Health Insurance Coverage by Citizenship Status in McCook County
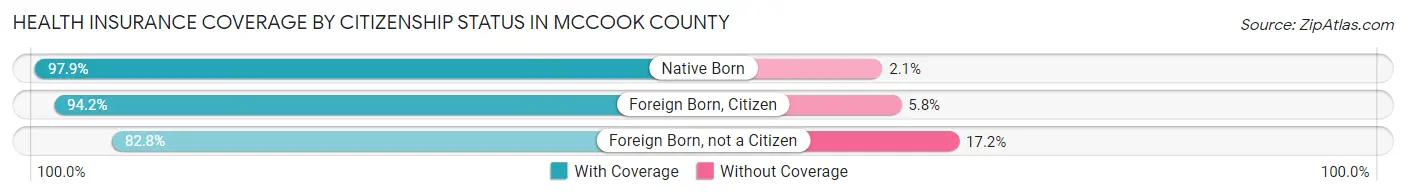
| Citizenship Status | With Coverage | Without Coverage |
| Native Born | 522 (97.9%) | 11 (2.1%) |
| Foreign Born, Citizen | 1,053 (94.2%) | 65 (5.8%) |
| Foreign Born, not a Citizen | 338 (82.8%) | 70 (17.2%) |
Health Insurance Coverage by Household Income in McCook County
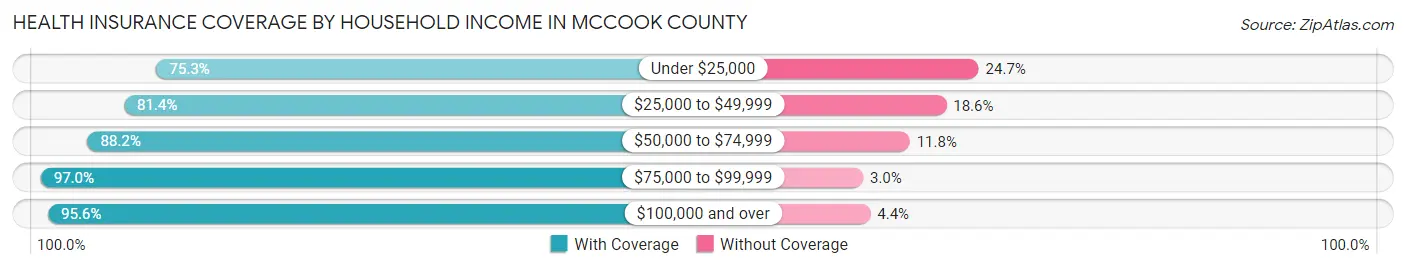
| Household Income | With Coverage | Without Coverage |
| Under $25,000 | 314 (75.3%) | 103 (24.7%) |
| $25,000 to $49,999 | 563 (81.4%) | 129 (18.6%) |
| $50,000 to $74,999 | 920 (88.2%) | 123 (11.8%) |
| $75,000 to $99,999 | 957 (97.0%) | 30 (3.0%) |
| $100,000 and over | 2,213 (95.6%) | 102 (4.4%) |
Public vs Private Health Insurance Coverage by Age in McCook County
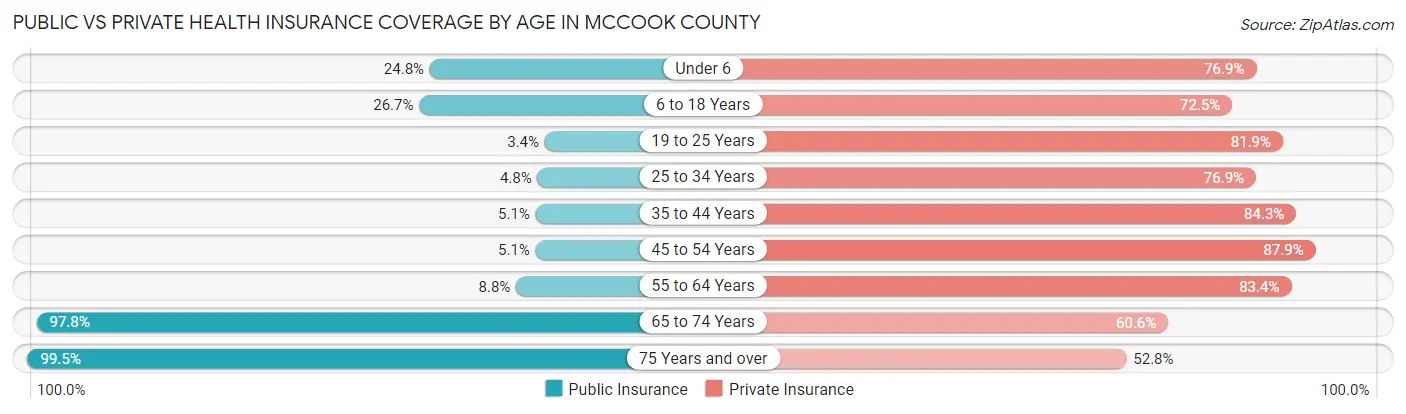
| Age Bracket | Public Insurance | Private Insurance |
| Under 6 | 132 (24.8%) | 410 (76.9%) |
| 6 to 18 Years | 299 (26.7%) | 810 (72.5%) |
| 19 to 25 Years | 14 (3.4%) | 334 (81.9%) |
| 25 to 34 Years | 25 (4.8%) | 402 (76.9%) |
| 35 to 44 Years | 36 (5.1%) | 592 (84.3%) |
| 45 to 54 Years | 32 (5.1%) | 547 (87.9%) |
| 55 to 64 Years | 65 (8.8%) | 619 (83.4%) |
| 65 to 74 Years | 528 (97.8%) | 327 (60.6%) |
| 75 Years and over | 371 (99.5%) | 197 (52.8%) |
| Total | 1,502 (27.0%) | 4,238 (76.2%) |
Disability Status by Sex by Age in McCook County
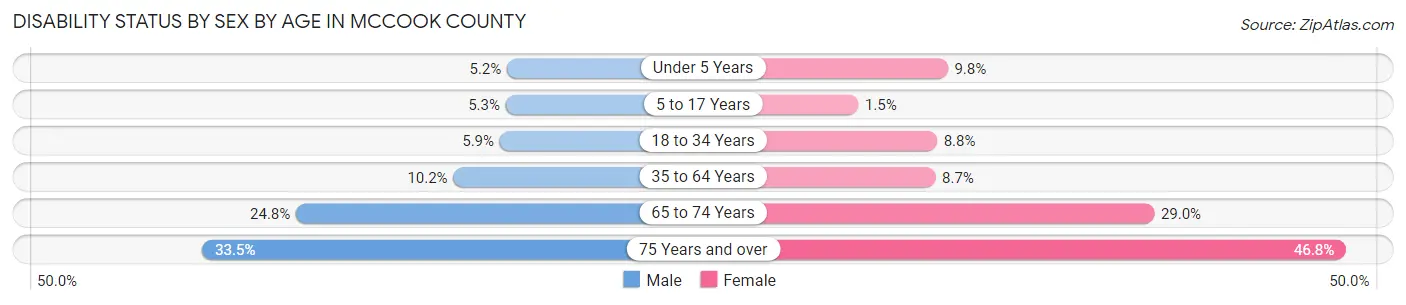
| Age Bracket | Male | Female |
| Under 5 Years | 13 (5.2%) | 21 (9.8%) |
| 5 to 17 Years | 32 (5.3%) | 8 (1.5%) |
| 18 to 34 Years | 30 (5.9%) | 42 (8.8%) |
| 35 to 64 Years | 113 (10.2%) | 83 (8.7%) |
| 65 to 74 Years | 62 (24.8%) | 84 (29.0%) |
| 75 Years and over | 57 (33.5%) | 95 (46.8%) |
Disability Class by Sex by Age in McCook County
Disability Class: Hearing Difficulty
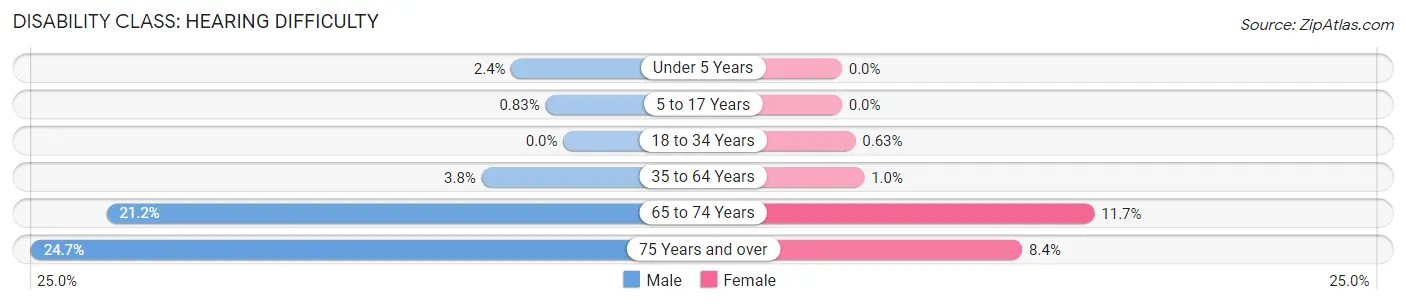
| Age Bracket | Male | Female |
| Under 5 Years | 6 (2.4%) | 0 (0.0%) |
| 5 to 17 Years | 5 (0.8%) | 0 (0.0%) |
| 18 to 34 Years | 0 (0.0%) | 3 (0.6%) |
| 35 to 64 Years | 42 (3.8%) | 10 (1.0%) |
| 65 to 74 Years | 53 (21.2%) | 34 (11.7%) |
| 75 Years and over | 42 (24.7%) | 17 (8.4%) |
Disability Class: Vision Difficulty
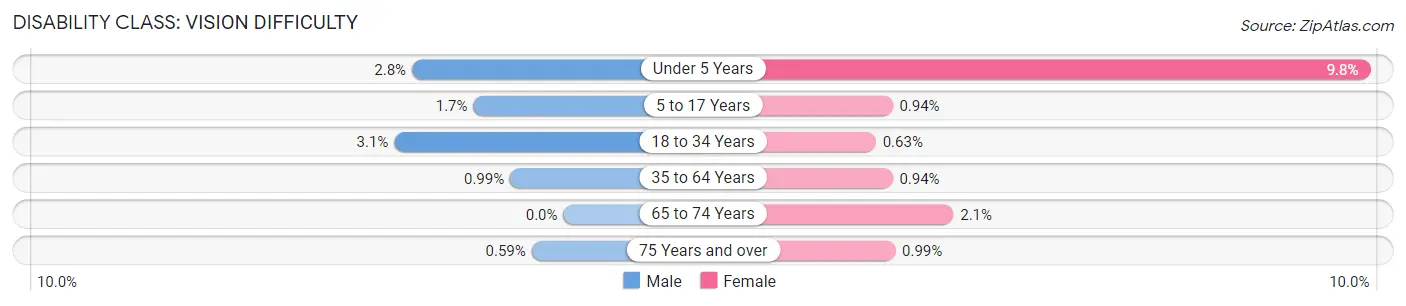
| Age Bracket | Male | Female |
| Under 5 Years | 7 (2.8%) | 21 (9.8%) |
| 5 to 17 Years | 10 (1.7%) | 5 (0.9%) |
| 18 to 34 Years | 16 (3.1%) | 3 (0.6%) |
| 35 to 64 Years | 11 (1.0%) | 9 (0.9%) |
| 65 to 74 Years | 0 (0.0%) | 6 (2.1%) |
| 75 Years and over | 1 (0.6%) | 2 (1.0%) |
Disability Class: Cognitive Difficulty
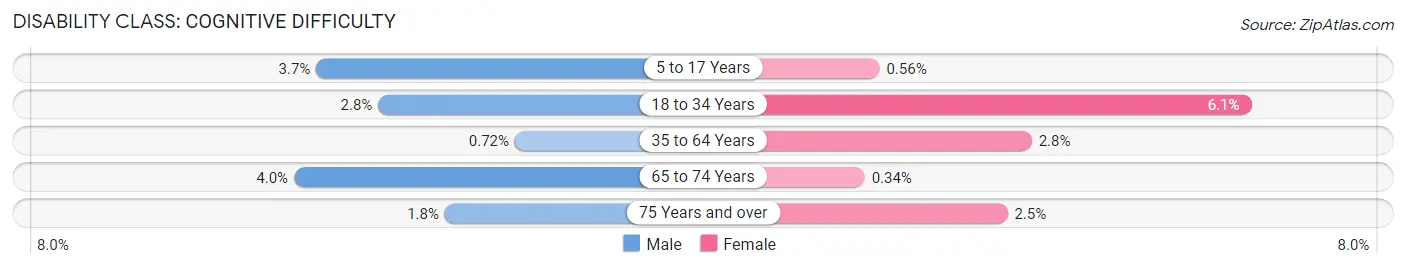
| Age Bracket | Male | Female |
| 5 to 17 Years | 22 (3.7%) | 3 (0.6%) |
| 18 to 34 Years | 14 (2.8%) | 29 (6.1%) |
| 35 to 64 Years | 8 (0.7%) | 27 (2.8%) |
| 65 to 74 Years | 10 (4.0%) | 1 (0.3%) |
| 75 Years and over | 3 (1.8%) | 5 (2.5%) |
Disability Class: Ambulatory Difficulty
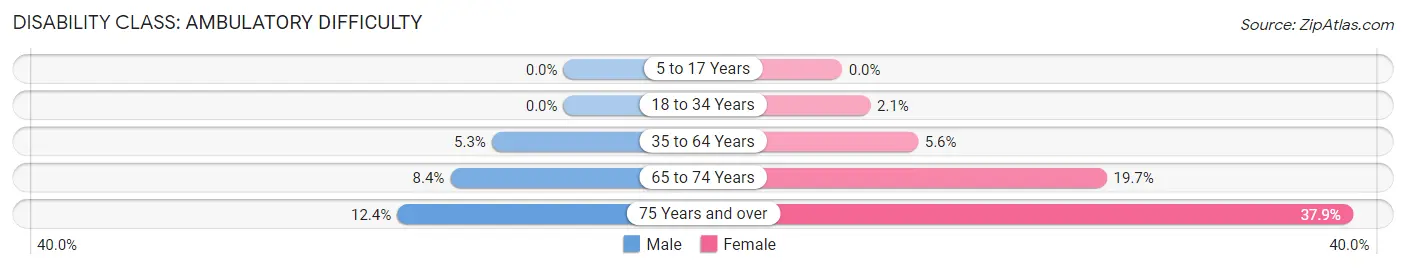
| Age Bracket | Male | Female |
| 5 to 17 Years | 0 (0.0%) | 0 (0.0%) |
| 18 to 34 Years | 0 (0.0%) | 10 (2.1%) |
| 35 to 64 Years | 59 (5.3%) | 54 (5.6%) |
| 65 to 74 Years | 21 (8.4%) | 57 (19.7%) |
| 75 Years and over | 21 (12.3%) | 77 (37.9%) |
Disability Class: Self-Care Difficulty
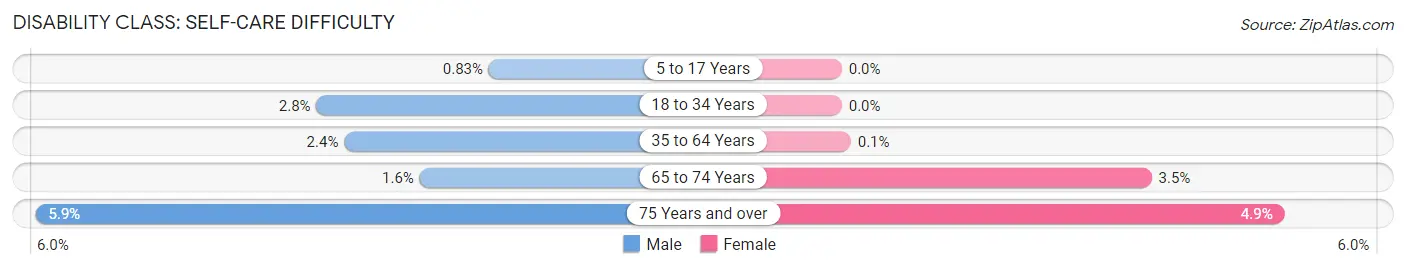
| Age Bracket | Male | Female |
| 5 to 17 Years | 5 (0.8%) | 0 (0.0%) |
| 18 to 34 Years | 14 (2.8%) | 0 (0.0%) |
| 35 to 64 Years | 27 (2.4%) | 1 (0.1%) |
| 65 to 74 Years | 4 (1.6%) | 10 (3.5%) |
| 75 Years and over | 10 (5.9%) | 10 (4.9%) |
Technology Access in McCook County
Computing Device Access in McCook County
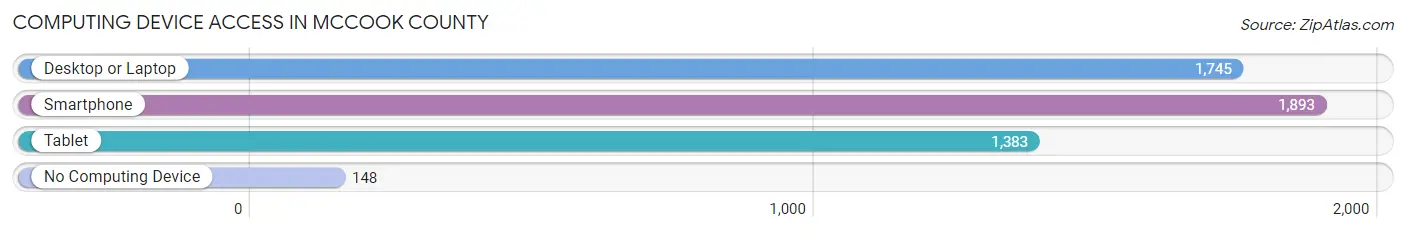
| Device Type | # Households | % Households |
| Desktop or Laptop | 1,745 | 78.7% |
| Smartphone | 1,893 | 85.4% |
| Tablet | 1,383 | 62.4% |
| No Computing Device | 148 | 6.7% |
| Total | 2,218 | 100.0% |
Internet Access in McCook County
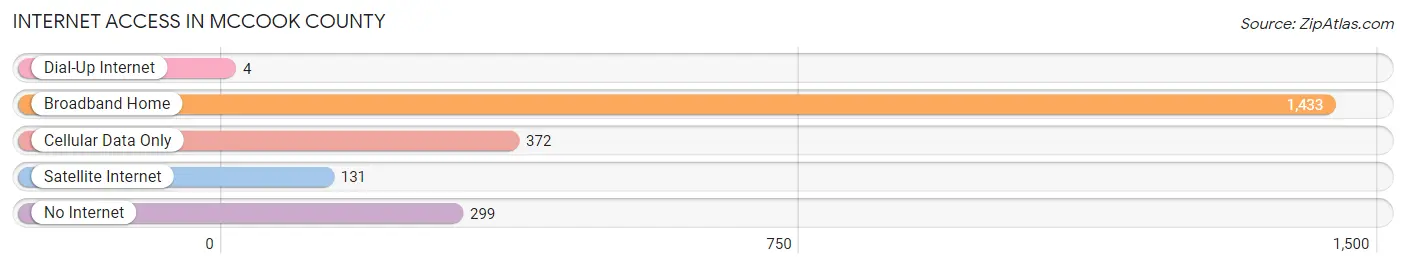
| Internet Type | # Households | % Households |
| Dial-Up Internet | 4 | 0.2% |
| Broadband Home | 1,433 | 64.6% |
| Cellular Data Only | 372 | 16.8% |
| Satellite Internet | 131 | 5.9% |
| No Internet | 299 | 13.5% |
| Total | 2,218 | 100.0% |
McCook County Summary
Mccook County, South Dakota is located in the southeastern corner of the state, bordered by the Missouri River to the east and the Big Sioux River to the south. The county seat is Salem, and the county is home to a population of approximately 8,000 people.
History
Mccook County was established in 1873, and was named after Major General Alexander McDowell McCook, a Union Army officer during the Civil War. The county was originally part of the Dakota Territory, and was part of the original land grant given to the Sioux Nation in 1868. The county was organized in 1873, and the first county seat was located in Salem.
Geography
Mccook County is located in the southeastern corner of South Dakota, and is bordered by the Missouri River to the east and the Big Sioux River to the south. The county covers an area of 845 square miles, and is mostly rural, with a few small towns and villages scattered throughout. The terrain is mostly flat, with rolling hills in the western part of the county. The county is home to several lakes, including Lake Farley, Lake Poinsett, and Lake Vermillion.
Economy
Mccook County’s economy is largely based on agriculture, with corn, soybeans, and wheat being the main crops. Livestock production is also important, with cattle, hogs, and sheep being raised in the county. The county is also home to several manufacturing companies, including a furniture factory, a grain elevator, and a feed mill.
Demographics
As of the 2010 census, Mccook County had a population of 8,072 people. The population is mostly white (94.2%), with small percentages of African American (1.2%), Native American (1.1%), Asian (0.4%), and other races (2.1%). The median household income is $45,813, and the median age is 41.7 years.
Conclusion
Mccook County, South Dakota is a rural county located in the southeastern corner of the state. The county was established in 1873, and is home to a population of approximately 8,000 people. The economy is largely based on agriculture, with corn, soybeans, and wheat being the main crops. The population is mostly white, with small percentages of African American, Native American, Asian, and other races. The median household income is $45,813, and the median age is 41.7 years.
Common Questions
What is the Total Population of McCook County?
Total Population of McCook County is 5,714.
What is the Total Male Population of McCook County?
Total Male Population of McCook County is 2,954.
What is the Total Female Population of McCook County?
Total Female Population of McCook County is 2,760.
What is the Ratio of Males per 100 Females in McCook County?
There are 107.03 Males per 100 Females in McCook County.
What is the Ratio of Females per 100 Males in McCook County?
There are 93.43 Females per 100 Males in McCook County.
What is the Median Population Age in McCook County?
Median Population Age in McCook County is 39.5 Years.
What is the Average Family Size in McCook County
Average Family Size in McCook County is 3.0 People.
What is the Average Household Size in McCook County
Average Household Size in McCook County is 2.5 People.
What is Per Capita Income in McCook County?
Per Capita income in McCook County is $34,242.
What is the Median Family Income in McCook County?
Median Family Income in McCook County is $88,696.
What is the Median Household income in McCook County?
Median Household Income in McCook County is $74,873.
What is Income or Wage Gap in McCook County?
Income or Wage Gap in McCook County is 27.9%.
Women in McCook County earn 72.1 cents for every dollar earned by a man.
What is Family Income Deficit in McCook County?
Family Income Deficit in McCook County is $10,609.
Families that are below poverty line in McCook County earn $10,609 less on average than the poverty threshold level.
What is Inequality or Gini Index in McCook County?
Inequality or Gini Index in McCook County is 0.38.
How Large is the Labor Force in McCook County?
There are 3,003 People in the Labor Forcein in McCook County.
What is the Percentage of People in the Labor Force in McCook County?
70.3% of People are in the Labor Force in McCook County.
What is the Unemployment Rate in McCook County?
Unemployment Rate in McCook County is 2.1%.