Lyman County, SD
Lyman County Map
Lyman County Overview
3,719
TOTAL POPULATION
1,966
MALE POPULATION
1,753
FEMALE POPULATION
112.15
MALES / 100 FEMALES
89.17
FEMALES / 100 MALES
36.0
MEDIAN AGE
3.7
AVG FAMILY SIZE
3.0
AVG HOUSEHOLD SIZE
$25,997
PER CAPITA INCOME
$66,250
AVG FAMILY INCOME
$60,284
AVG HOUSEHOLD INCOME
39.5%
WAGE / INCOME GAP [ % ]
60.5¢/ $1
WAGE / INCOME GAP [ $ ]
$13,225
FAMILY INCOME DEFICIT
0.44
INEQUALITY / GINI INDEX
1,558
LABOR FORCE [ PEOPLE ]
56.3%
PERCENT IN LABOR FORCE
5.0%
UNEMPLOYMENT RATE
Lyman County Area Codes
Race in Lyman County
The most populous races in Lyman County are White / Caucasian (2,005 | 53.9%), Native / Alaskan (1,646 | 44.3%), and Hispanic or Latino (45 | 1.2%).

| Race | # Population | % Population |
| Asian | 7 | 0.2% |
| Black / African American | 0 | 0.0% |
| Hawaiian / Pacific | 0 | 0.0% |
| Hispanic or Latino | 45 | 1.2% |
| Native / Alaskan | 1,646 | 44.3% |
| White / Caucasian | 2,005 | 53.9% |
| Two or more Races | 34 | 0.9% |
| Some other Race | 27 | 0.7% |
| Total | 3,719 | 100.0% |
Ancestry in Lyman County
The most populous ancestries reported in Lyman County are Sioux (1,544 | 41.5%), German (821 | 22.1%), Irish (304 | 8.2%), American (292 | 7.9%), and Norwegian (199 | 5.3%), together accounting for 85.0% of all Lyman County residents.

| Ancestry | # Population | % Population |
| African | 1 | 0.0% |
| American | 292 | 7.9% |
| Belgian | 4 | 0.1% |
| Bhutanese | 7 | 0.2% |
| Blackfeet | 8 | 0.2% |
| British | 1 | 0.0% |
| Central American | 22 | 0.6% |
| Cherokee | 10 | 0.3% |
| Cheyenne | 23 | 0.6% |
| Creek | 5 | 0.1% |
| Crow | 5 | 0.1% |
| Czech | 142 | 3.8% |
| Czechoslovakian | 9 | 0.2% |
| Danish | 40 | 1.1% |
| Dutch | 64 | 1.7% |
| English | 135 | 3.6% |
| European | 26 | 0.7% |
| French | 39 | 1.1% |
| French Canadian | 5 | 0.1% |
| German | 821 | 22.1% |
| Guatemalan | 6 | 0.2% |
| Honduran | 16 | 0.4% |
| Indian (Asian) | 11 | 0.3% |
| Irish | 304 | 8.2% |
| Italian | 22 | 0.6% |
| Korean | 12 | 0.3% |
| Mexican | 14 | 0.4% |
| Norwegian | 199 | 5.3% |
| Polish | 41 | 1.1% |
| Russian | 21 | 0.6% |
| Scandinavian | 4 | 0.1% |
| Scotch-Irish | 8 | 0.2% |
| Scottish | 16 | 0.4% |
| Sioux | 1,544 | 41.5% |
| Spaniard | 6 | 0.2% |
| Spanish | 3 | 0.1% |
| Subsaharan African | 1 | 0.0% |
| Swedish | 43 | 1.2% |
| Swiss | 12 | 0.3% |
| Ukrainian | 12 | 0.3% |
| Welsh | 5 | 0.1% |
| Yugoslavian | 4 | 0.1% | View All 42 Rows |
Immigrants in Lyman County
The most numerous immigrant groups reported in Lyman County came from Central America (26 | 0.7%), Latin America (26 | 0.7%), Honduras (16 | 0.4%), Mexico (10 | 0.3%), and Asia (7 | 0.2%), together accounting for 2.3% of all Lyman County residents.

| Immigration Origin | # Population | % Population |
| Asia | 7 | 0.2% |
| Central America | 26 | 0.7% |
| Honduras | 16 | 0.4% |
| Latin America | 26 | 0.7% |
| Mexico | 10 | 0.3% |
| Philippines | 7 | 0.2% |
| South Eastern Asia | 7 | 0.2% | View All 7 Rows |
Sex and Age in Lyman County
Sex and Age in Lyman County
The most populous age groups in Lyman County are Under 5 Years (182 | 9.3%) for men and 5 to 9 Years (152 | 8.7%) for women.

| Age Bracket | Male | Female |
| Under 5 Years | 182 (9.3%) | 128 (7.3%) |
| 5 to 9 Years | 150 (7.6%) | 152 (8.7%) |
| 10 to 14 Years | 143 (7.3%) | 131 (7.5%) |
| 15 to 19 Years | 122 (6.2%) | 114 (6.5%) |
| 20 to 24 Years | 157 (8.0%) | 123 (7.0%) |
| 25 to 29 Years | 102 (5.2%) | 73 (4.2%) |
| 30 to 34 Years | 99 (5.0%) | 98 (5.6%) |
| 35 to 39 Years | 115 (5.9%) | 141 (8.0%) |
| 40 to 44 Years | 89 (4.5%) | 72 (4.1%) |
| 45 to 49 Years | 136 (6.9%) | 69 (3.9%) |
| 50 to 54 Years | 82 (4.2%) | 85 (4.9%) |
| 55 to 59 Years | 94 (4.8%) | 117 (6.7%) |
| 60 to 64 Years | 182 (9.3%) | 127 (7.2%) |
| 65 to 69 Years | 129 (6.6%) | 99 (5.7%) |
| 70 to 74 Years | 77 (3.9%) | 76 (4.3%) |
| 75 to 79 Years | 59 (3.0%) | 57 (3.3%) |
| 80 to 84 Years | 36 (1.8%) | 31 (1.8%) |
| 85 Years and over | 12 (0.6%) | 60 (3.4%) |
| Total | 1,966 (100.0%) | 1,753 (100.0%) |
Families and Households in Lyman County
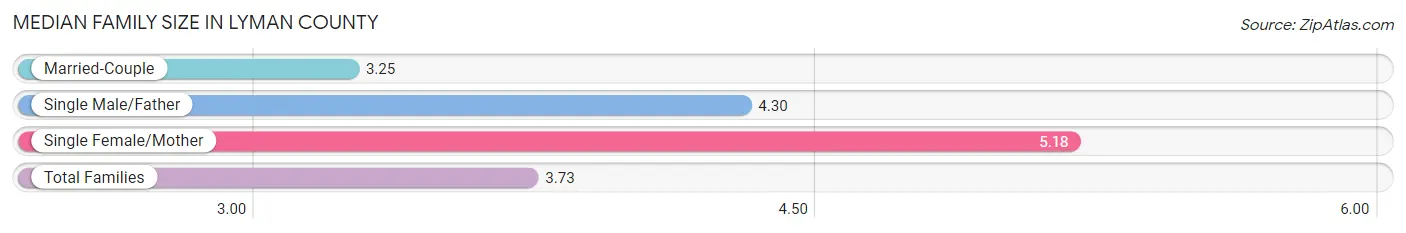
Median Family Size in Lyman County
The median family size in Lyman County is 3.73 persons per family, with single female/mother families (147 | 17.9%) accounting for the largest median family size of 5.18 persons per family. On the other hand, married-couple families (569 | 69.5%) represent the smallest median family size with 3.25 persons per family.
| Family Type | # Families | Family Size |
| Married-Couple | 569 (69.5%) | 3.25 |
| Single Male/Father | 103 (12.6%) | 4.30 |
| Single Female/Mother | 147 (17.9%) | 5.18 |
| Total Families | 819 (100.0%) | 3.73 |
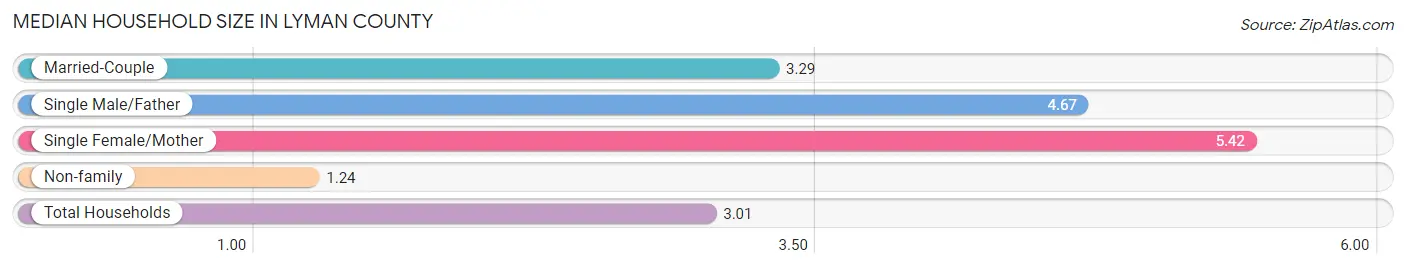
Median Household Size in Lyman County
The median household size in Lyman County is 3.01 persons per household, with single female/mother households (147 | 12.2%) accounting for the largest median household size of 5.42 persons per household. non-family households (385 | 32.0%) represent the smallest median household size with 1.24 persons per household.
| Household Type | # Households | Household Size |
| Married-Couple | 569 (47.3%) | 3.29 |
| Single Male/Father | 103 (8.6%) | 4.67 |
| Single Female/Mother | 147 (12.2%) | 5.42 |
| Non-family | 385 (32.0%) | 1.24 |
| Total Households | 1,204 (100.0%) | 3.01 |
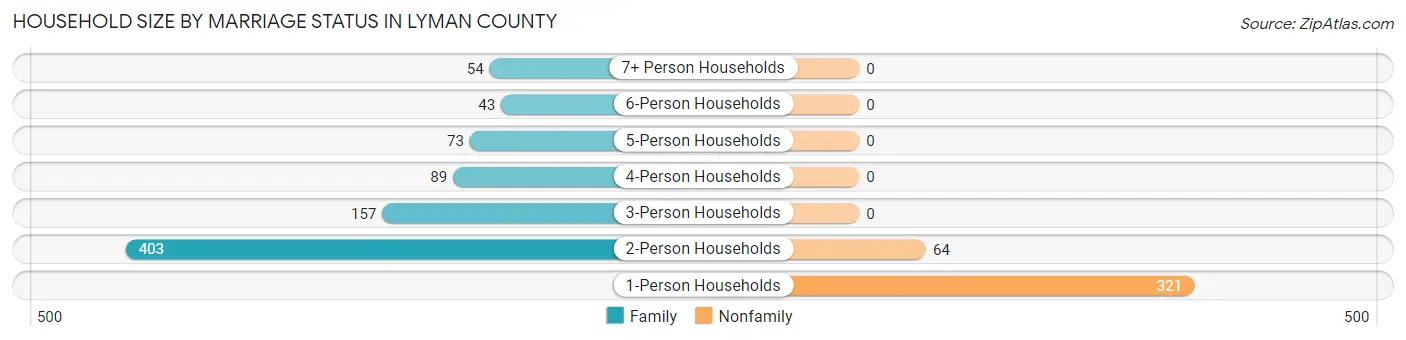
Household Size by Marriage Status in Lyman County
Out of a total of 1,204 households in Lyman County, 819 (68.0%) are family households, while 385 (32.0%) are nonfamily households. The most numerous type of family households are 2-person households, comprising 403, and the most common type of nonfamily households are 1-person households, comprising 321.
| Household Size | Family Households | Nonfamily Households |
| 1-Person Households | - | 321 (26.7%) |
| 2-Person Households | 403 (33.5%) | 64 (5.3%) |
| 3-Person Households | 157 (13.0%) | 0 (0.0%) |
| 4-Person Households | 89 (7.4%) | 0 (0.0%) |
| 5-Person Households | 73 (6.1%) | 0 (0.0%) |
| 6-Person Households | 43 (3.6%) | 0 (0.0%) |
| 7+ Person Households | 54 (4.5%) | 0 (0.0%) |
| Total | 819 (68.0%) | 385 (32.0%) |
Female Fertility in Lyman County
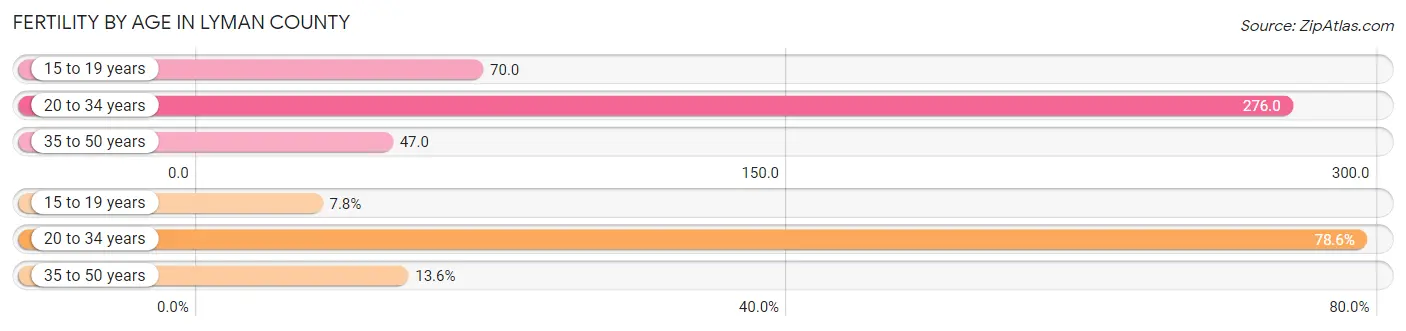
Fertility by Age in Lyman County
Average fertility rate in Lyman County is 147.0 births per 1,000 women. Women in the age bracket of 20 to 34 years have the highest fertility rate with 276.0 births per 1,000 women. Women in the age bracket of 20 to 34 years acount for 78.6% of all women with births.
| Age Bracket | Women with Births | Births / 1,000 Women |
| 15 to 19 years | 8 (7.8%) | 70.0 |
| 20 to 34 years | 81 (78.6%) | 276.0 |
| 35 to 50 years | 14 (13.6%) | 47.0 |
| Total | 103 (100.0%) | 147.0 |
Fertility by Age by Marriage Status in Lyman County
59.2% of women with births (103) in Lyman County are married. The highest percentage of unmarried women with births falls into 15 to 19 years age bracket with 100.0% of them unmarried at the time of birth, while the lowest percentage of unmarried women with births belong to 20 to 34 years age bracket with 30.9% of them unmarried.

| Age Bracket | Married | Unmarried |
| 15 to 19 years | 0 (0.0%) | 8 (100.0%) |
| 20 to 34 years | 56 (69.1%) | 25 (30.9%) |
| 35 to 50 years | 5 (35.7%) | 9 (64.3%) |
| Total | 61 (59.2%) | 42 (40.8%) |
Fertility by Education in Lyman County
Average fertility rate in Lyman County is 147.0 births per 1,000 women. Women with the education attainment of bachelor's degree have the highest fertility rate of 259.0 births per 1,000 women, while women with the education attainment of less than high school have the lowest fertility at 68.0 births per 1,000 women. Women with the education attainment of college or associate's degree represent 32.0% of all women with births.

| Educational Attainment | Women with Births | Births / 1,000 Women |
| Less than High School | 10 (9.7%) | 68.0 |
| High School Diploma | 26 (25.2%) | 96.0 |
| College or Associate's Degree | 33 (32.0%) | 232.0 |
| Bachelor's Degree | 28 (27.2%) | 259.0 |
| Graduate Degree | 6 (5.8%) | 171.0 |
| Total | 103 (100.0%) | 147.0 |
Fertility by Education by Marriage Status in Lyman County
40.8% of women with births in Lyman County are unmarried. Women with the educational attainment of graduate degree are most likely to be married with 100.0% of them married at childbirth, while women with the educational attainment of less than high school are least likely to be married with 60.0% of them unmarried at childbirth.

| Educational Attainment | Married | Unmarried |
| Less than High School | 4 (40.0%) | 6 (60.0%) |
| High School Diploma | 14 (53.8%) | 12 (46.2%) |
| College or Associate's Degree | 17 (51.5%) | 16 (48.5%) |
| Bachelor's Degree | 20 (71.4%) | 8 (28.6%) |
| Graduate Degree | 6 (100.0%) | 0 (0.0%) |
| Total | 61 (59.2%) | 42 (40.8%) |
Income in Lyman County
Income Overview in Lyman County
Per Capita Income in Lyman County is $25,997, while median incomes of families and households are $66,250 and $60,284 respectively.
| Characteristic | Number | Measure |
| Per Capita Income | 3,719 | $25,997 |
| Median Family Income | 819 | $66,250 |
| Mean Family Income | 819 | $85,271 |
| Median Household Income | 1,204 | $60,284 |
| Mean Household Income | 1,204 | $74,735 |
| Income Deficit | 819 | $13,225 |
| Wage / Income Gap (%) | 3,719 | 39.46% |
| Wage / Income Gap ($) | 3,719 | 60.54¢ per $1 |
| Gini / Inequality Index | 3,719 | 0.44 |
Earnings by Sex in Lyman County
Average Earnings in Lyman County are $32,458, $46,088 for men and $27,901 for women, a difference of 39.5%.

| Sex | Number | Average Earnings |
| Male | 881 (51.6%) | $46,088 |
| Female | 825 (48.4%) | $27,901 |
| Total | 1,706 (100.0%) | $32,458 |
Earnings by Sex by Income Bracket in Lyman County
The most common earnings brackets in Lyman County are $55,000 to $64,999 for men (110 | 12.5%) and $25,000 to $29,999 for women (98 | 11.9%).

| Income | Male | Female |
| $2,499 or less | 35 (4.0%) | 51 (6.2%) |
| $2,500 to $4,999 | 17 (1.9%) | 54 (6.6%) |
| $5,000 to $7,499 | 35 (4.0%) | 52 (6.3%) |
| $7,500 to $9,999 | 33 (3.7%) | 52 (6.3%) |
| $10,000 to $12,499 | 46 (5.2%) | 35 (4.2%) |
| $12,500 to $14,999 | 20 (2.3%) | 18 (2.2%) |
| $15,000 to $17,499 | 17 (1.9%) | 41 (5.0%) |
| $17,500 to $19,999 | 17 (1.9%) | 17 (2.1%) |
| $20,000 to $22,499 | 12 (1.4%) | 34 (4.1%) |
| $22,500 to $24,999 | 40 (4.5%) | 26 (3.2%) |
| $25,000 to $29,999 | 45 (5.1%) | 98 (11.9%) |
| $30,000 to $34,999 | 31 (3.5%) | 44 (5.3%) |
| $35,000 to $39,999 | 36 (4.1%) | 41 (5.0%) |
| $40,000 to $44,999 | 33 (3.7%) | 49 (5.9%) |
| $45,000 to $49,999 | 86 (9.8%) | 44 (5.3%) |
| $50,000 to $54,999 | 47 (5.3%) | 32 (3.9%) |
| $55,000 to $64,999 | 110 (12.5%) | 52 (6.3%) |
| $65,000 to $74,999 | 64 (7.3%) | 6 (0.7%) |
| $75,000 to $99,999 | 85 (9.7%) | 65 (7.9%) |
| $100,000+ | 72 (8.2%) | 14 (1.7%) |
| Total | 881 (100.0%) | 825 (100.0%) |
Earnings by Sex by Educational Attainment in Lyman County
Average earnings in Lyman County are $49,727 for men and $29,538 for women, a difference of 40.6%. Men with an educational attainment of college or associate's degree enjoy the highest average annual earnings of $59,900, while those with less than high school education earn the least with $40,000. Women with an educational attainment of graduate degree earn the most with the average annual earnings of $55,417, while those with college or associate's degree education have the smallest earnings of $27,667.

| Educational Attainment | Male Income | Female Income |
| Less than High School | $40,000 | $0 |
| High School Diploma | $46,216 | $29,363 |
| College or Associate's Degree | $59,900 | $27,667 |
| Bachelor's Degree | $57,708 | $40,288 |
| Graduate Degree | $55,417 | $55,417 |
| Total | $49,727 | $29,538 |
Family Income in Lyman County
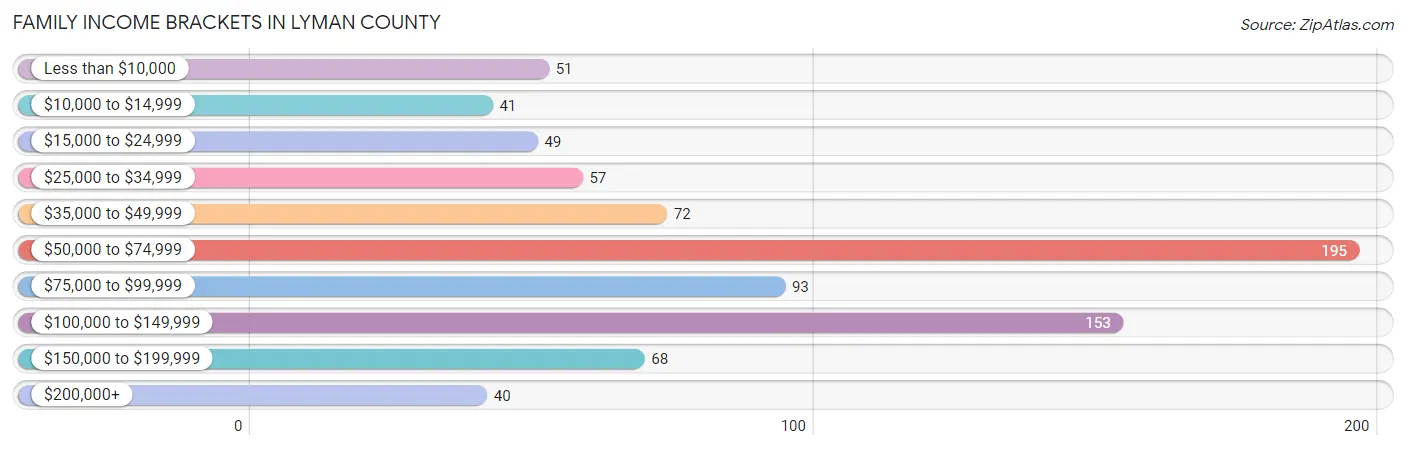
Family Income Brackets in Lyman County
According to the Lyman County family income data, there are 195 families falling into the $50,000 to $74,999 income range, which is the most common income bracket and makes up 23.8% of all families. Conversely, the $200,000+ income bracket is the least frequent group with only 40 families (4.9%) belonging to this category.
| Income Bracket | # Families | % Families |
| Less than $10,000 | 51 | 6.2% |
| $10,000 to $14,999 | 41 | 5.0% |
| $15,000 to $24,999 | 49 | 6.0% |
| $25,000 to $34,999 | 57 | 7.0% |
| $35,000 to $49,999 | 72 | 8.8% |
| $50,000 to $74,999 | 195 | 23.8% |
| $75,000 to $99,999 | 93 | 11.4% |
| $100,000 to $149,999 | 153 | 18.7% |
| $150,000 to $199,999 | 68 | 8.3% |
| $200,000+ | 40 | 4.9% |
Family Income by Famaliy Size in Lyman County
3-person families (146 | 17.8%) account for the highest median family income in Lyman County with $70,938 per family, while 2-person families (423 | 51.6%) have the highest median income of $34,258 per family member.

| Income Bracket | # Families | Median Income |
| 2-Person Families | 423 (51.6%) | $68,516 |
| 3-Person Families | 146 (17.8%) | $70,938 |
| 4-Person Families | 102 (12.4%) | $70,833 |
| 5-Person Families | 60 (7.3%) | $0 |
| 6-Person Families | 45 (5.5%) | $0 |
| 7+ Person Families | 43 (5.2%) | $0 |
| Total | 819 (100.0%) | $66,250 |
Family Income by Number of Earners in Lyman County
The median family income in Lyman County is $66,250, with families comprising 2 earners (332) having the highest median family income of $103,214, while families with no earners (179) have the lowest median family income of $29,375, accounting for 40.5% and 21.9% of families, respectively.

| Number of Earners | # Families | Median Income |
| No Earners | 179 (21.9%) | $29,375 |
| 1 Earner | 224 (27.4%) | $50,776 |
| 2 Earners | 332 (40.5%) | $103,214 |
| 3+ Earners | 84 (10.3%) | $97,500 |
| Total | 819 (100.0%) | $66,250 |
Household Income in Lyman County
Household Income Brackets in Lyman County
With 284 households falling in the category, the $50,000 to $74,999 income range is the most frequent in Lyman County, accounting for 23.6% of all households. In contrast, only 41 households (3.4%) fall into the $200,000+ income bracket, making it the least populous group.

| Income Bracket | # Households | % Households |
| Less than $10,000 | 88 | 7.3% |
| $10,000 to $14,999 | 61 | 5.1% |
| $15,000 to $24,999 | 104 | 8.6% |
| $25,000 to $34,999 | 107 | 8.9% |
| $35,000 to $49,999 | 114 | 9.5% |
| $50,000 to $74,999 | 284 | 23.6% |
| $75,000 to $99,999 | 146 | 12.1% |
| $100,000 to $149,999 | 182 | 15.1% |
| $150,000 to $199,999 | 76 | 6.3% |
| $200,000+ | 41 | 3.4% |
Household Income by Householder Age in Lyman County
The median household income in Lyman County is $60,284, with the highest median household income of $66,563 found in the 45 to 64 years age bracket for the primary householder. A total of 449 households (37.3%) fall into this category. Meanwhile, the 15 to 24 years age bracket for the primary householder has the lowest median household income of $0, with 44 households (3.6%) in this group.

| Income Bracket | # Households | Median Income |
| 15 to 24 Years | 44 (3.6%) | $0 |
| 25 to 44 Years | 323 (26.8%) | $62,396 |
| 45 to 64 Years | 449 (37.3%) | $66,563 |
| 65+ Years | 388 (32.2%) | $51,768 |
| Total | 1,204 (100.0%) | $60,284 |
Poverty in Lyman County
Income Below Poverty by Sex and Age in Lyman County
With 22.7% poverty level for males and 27.7% for females among the residents of Lyman County, 18 to 24 year old males and 12 to 14 year old females are the most vulnerable to poverty, with 77 males (43.8%) and 44 females (57.9%) in their respective age groups living below the poverty level.

| Age Bracket | Male | Female |
| Under 5 Years | 66 (37.7%) | 18 (14.1%) |
| 5 Years | 20 (38.5%) | 7 (24.1%) |
| 6 to 11 Years | 51 (41.1%) | 76 (44.4%) |
| 12 to 14 Years | 36 (37.5%) | 44 (57.9%) |
| 15 Years | 10 (41.7%) | 20 (47.6%) |
| 16 and 17 Years | 5 (7.5%) | 12 (29.3%) |
| 18 to 24 Years | 77 (43.8%) | 63 (40.9%) |
| 25 to 34 Years | 15 (7.6%) | 31 (18.1%) |
| 35 to 44 Years | 45 (22.1%) | 63 (29.6%) |
| 45 to 54 Years | 36 (16.6%) | 38 (24.7%) |
| 55 to 64 Years | 45 (16.3%) | 43 (17.6%) |
| 65 to 74 Years | 21 (10.2%) | 25 (14.3%) |
| 75 Years and over | 9 (8.4%) | 43 (29.4%) |
| Total | 436 (22.7%) | 483 (27.7%) |
Income Above Poverty by Sex and Age in Lyman County
According to the poverty statistics in Lyman County, males aged 16 and 17 years and females aged under 5 years are the age groups that are most secure financially, with 92.5% of males and 85.9% of females in these age groups living above the poverty line.

| Age Bracket | Male | Female |
| Under 5 Years | 109 (62.3%) | 110 (85.9%) |
| 5 Years | 32 (61.5%) | 22 (75.9%) |
| 6 to 11 Years | 73 (58.9%) | 95 (55.6%) |
| 12 to 14 Years | 60 (62.5%) | 32 (42.1%) |
| 15 Years | 14 (58.3%) | 22 (52.4%) |
| 16 and 17 Years | 62 (92.5%) | 29 (70.7%) |
| 18 to 24 Years | 99 (56.2%) | 91 (59.1%) |
| 25 to 34 Years | 181 (92.3%) | 140 (81.9%) |
| 35 to 44 Years | 159 (77.9%) | 150 (70.4%) |
| 45 to 54 Years | 181 (83.4%) | 116 (75.3%) |
| 55 to 64 Years | 231 (83.7%) | 201 (82.4%) |
| 65 to 74 Years | 185 (89.8%) | 150 (85.7%) |
| 75 Years and over | 98 (91.6%) | 103 (70.6%) |
| Total | 1,484 (77.3%) | 1,261 (72.3%) |
Income Below Poverty Among Married-Couple Families in Lyman County
The poverty statistics for married-couple families in Lyman County show that 4.9% or 28 of the total 569 families live below the poverty line. Families with 5 or more children have the highest poverty rate of 50.0%, comprising of 4 families. On the other hand, families with 1 or 2 children have the lowest poverty rate of 0.0%, which includes 0 families.

| Children | Above Poverty | Below Poverty |
| No Children | 358 (94.5%) | 21 (5.5%) |
| 1 or 2 Children | 124 (100.0%) | 0 (0.0%) |
| 3 or 4 Children | 55 (94.8%) | 3 (5.2%) |
| 5 or more Children | 4 (50.0%) | 4 (50.0%) |
| Total | 541 (95.1%) | 28 (4.9%) |
Income Below Poverty Among Single-Parent Households in Lyman County
According to the poverty data in Lyman County, 44.7% or 46 single-father households and 56.5% or 83 single-mother households are living below the poverty line. Among single-father households, those with 3 or 4 children have the highest poverty rate, with 6 households (54.5%) experiencing poverty. Likewise, among single-mother households, those with 5 or more children have the highest poverty rate, with 11 households (78.6%) falling below the poverty line.

| Children | Single Father | Single Mother |
| No Children | 31 (54.4%) | 11 (44.0%) |
| 1 or 2 Children | 9 (29.0%) | 25 (45.5%) |
| 3 or 4 Children | 6 (54.5%) | 36 (67.9%) |
| 5 or more Children | 0 (0.0%) | 11 (78.6%) |
| Total | 46 (44.7%) | 83 (56.5%) |
Income Below Poverty Among Married-Couple vs Single-Parent Households in Lyman County
The poverty data for Lyman County shows that 28 of the married-couple family households (4.9%) and 129 of the single-parent households (51.6%) are living below the poverty level. Within the married-couple family households, those with 5 or more children have the highest poverty rate, with 4 households (50.0%) falling below the poverty line. Among the single-parent households, those with 3 or 4 children have the highest poverty rate, with 42 household (65.6%) living below poverty.

| Children | Married-Couple Families | Single-Parent Households |
| No Children | 21 (5.5%) | 42 (51.2%) |
| 1 or 2 Children | 0 (0.0%) | 34 (39.5%) |
| 3 or 4 Children | 3 (5.2%) | 42 (65.6%) |
| 5 or more Children | 4 (50.0%) | 11 (61.1%) |
| Total | 28 (4.9%) | 129 (51.6%) |
Employment Characteristics in Lyman County
Employment by Class of Employer in Lyman County
Among the 1,456 employed individuals in Lyman County, private company employees (492 | 33.8%), local government employees (365 | 25.1%), and self-employed (not incorporated) (247 | 17.0%) make up the most common classes of employment.

| Employer Class | # Employees | % Employees |
| Private Company Employees | 492 | 33.8% |
| Self-Employed (Incorporated) | 65 | 4.5% |
| Self-Employed (Not Incorporated) | 247 | 17.0% |
| Not-for-profit Organizations | 101 | 6.9% |
| Local Government Employees | 365 | 25.1% |
| State Government Employees | 114 | 7.8% |
| Federal Government Employees | 60 | 4.1% |
| Unpaid Family Workers | 12 | 0.8% |
| Total | 1,456 | 100.0% |
Employment Status by Age in Lyman County
According to the labor force statistics for Lyman County, out of the total population over 16 years of age (2,767), 56.3% or 1,558 individuals are in the labor force, with 5.0% or 78 of them unemployed. The age group with the highest labor force participation rate is 55 to 59 years, with 83.9% or 177 individuals in the labor force. Within the labor force, the 55 to 59 years age range has the highest percentage of unemployed individuals, with 10.2% or 18 of them being unemployed.

| Age Bracket | In Labor Force | Unemployed |
| 16 to 19 Years | 56 (32.9%) | 5 (8.9%) |
| 20 to 24 Years | 130 (46.4%) | 11 (8.5%) |
| 25 to 29 Years | 129 (73.7%) | 13 (10.1%) |
| 30 to 34 Years | 161 (81.7%) | 10 (6.2%) |
| 35 to 44 Years | 289 (69.3%) | 1 (0.3%) |
| 45 to 54 Years | 277 (74.5%) | 20 (7.2%) |
| 55 to 59 Years | 177 (83.9%) | 18 (10.2%) |
| 60 to 64 Years | 207 (67.0%) | 0 (0.0%) |
| 65 to 74 Years | 114 (29.9%) | 0 (0.0%) |
| 75 Years and over | 19 (7.5%) | 0 (0.0%) |
| Total | 1,558 (56.3%) | 78 (5.0%) |
Employment Status by Educational Attainment in Lyman County
According to labor force statistics for Lyman County, 73.8% of individuals (1,241) out of the total population between 25 and 64 years of age (1,681) are in the labor force, with 5.0% or 62 of them being unemployed. The group with the highest labor force participation rate are those with the educational attainment of bachelor's degree or higher, with 90.1% or 336 individuals in the labor force. Within the labor force, individuals with less than high school education have the highest percentage of unemployment, with 34.4% or 21 of them being unemployed.

| Educational Attainment | In Labor Force | Unemployed |
| Less than High School | 61 (38.6%) | 54 (34.4%) |
| High School Diploma | 471 (69.8%) | 34 (5.1%) |
| College / Associate Degree | 372 (78.3%) | 20 (4.3%) |
| Bachelor's Degree or higher | 336 (90.1%) | 1 (0.3%) |
| Total | 1,241 (73.8%) | 84 (5.0%) |
Employment Occupations by Sex in Lyman County
Management, Business, Science and Arts Occupations
The most common Management, Business, Science and Arts occupations in Lyman County are Management (250 | 16.9%), Community & Social Service (219 | 14.8%), Education Instruction & Library (141 | 9.5%), Health Diagnosing & Treating (58 | 3.9%), and Business & Financial (56 | 3.8%).

Management, Business, Science and Arts Occupations by Sex
Within the Management, Business, Science and Arts occupations in Lyman County, the most male-oriented occupations are Computers & Mathematics (100.0%), Architecture & Engineering (100.0%), and Management (74.8%), while the most female-oriented occupations are Arts, Media & Entertainment (97.2%), Health Technologists (96.4%), and Health Diagnosing & Treating (91.4%).

| Occupation | Male | Female |
| Management | 187 (74.8%) | 63 (25.2%) |
| Business & Financial | 24 (42.9%) | 32 (57.1%) |
| Computers, Engineering & Science | 11 (73.3%) | 4 (26.7%) |
| Computers & Mathematics | 4 (100.0%) | 0 (0.0%) |
| Architecture & Engineering | 3 (100.0%) | 0 (0.0%) |
| Life, Physical & Social Science | 4 (50.0%) | 4 (50.0%) |
| Community & Social Service | 47 (21.5%) | 172 (78.5%) |
| Education, Arts & Media | 9 (21.4%) | 33 (78.6%) |
| Legal Services & Support | 0 (0.0%) | 0 (0.0%) |
| Education Instruction & Library | 37 (26.2%) | 104 (73.8%) |
| Arts, Media & Entertainment | 1 (2.8%) | 35 (97.2%) |
| Health Diagnosing & Treating | 5 (8.6%) | 53 (91.4%) |
| Health Technologists | 1 (3.6%) | 27 (96.4%) |
| Total (Category) | 274 (45.8%) | 324 (54.2%) |
| Total (Overall) | 750 (50.7%) | 728 (49.3%) |
Services Occupations
The most common Services occupations in Lyman County are Cleaning & Maintenance (96 | 6.5%), Personal Care & Service (64 | 4.3%), Food Preparation & Serving (45 | 3.0%), Security & Protection (38 | 2.6%), and Healthcare Support (24 | 1.6%).

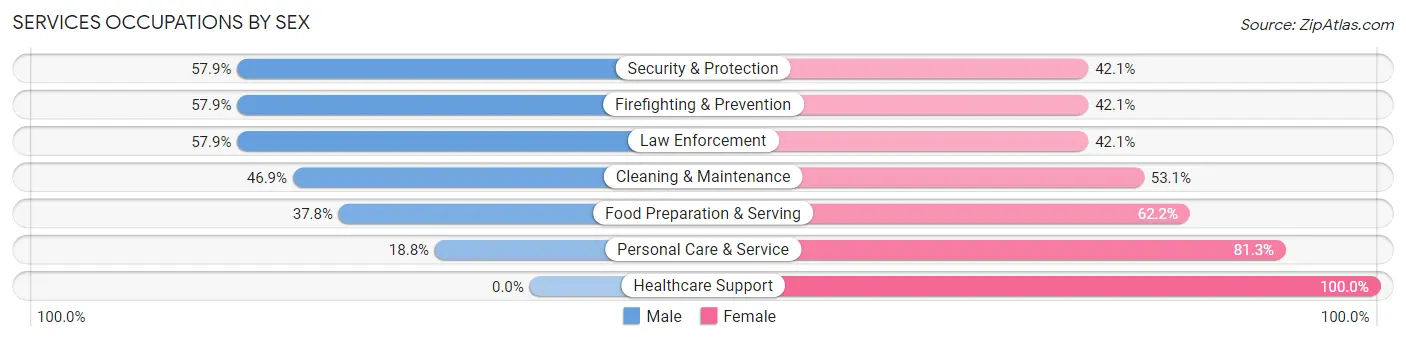
Services Occupations by Sex
Within the Services occupations in Lyman County, the most male-oriented occupations are Security & Protection (57.9%), Firefighting & Prevention (57.9%), and Law Enforcement (57.9%), while the most female-oriented occupations are Healthcare Support (100.0%), Personal Care & Service (81.2%), and Food Preparation & Serving (62.2%).
| Occupation | Male | Female |
| Healthcare Support | 0 (0.0%) | 24 (100.0%) |
| Security & Protection | 22 (57.9%) | 16 (42.1%) |
| Firefighting & Prevention | 11 (57.9%) | 8 (42.1%) |
| Law Enforcement | 11 (57.9%) | 8 (42.1%) |
| Food Preparation & Serving | 17 (37.8%) | 28 (62.2%) |
| Cleaning & Maintenance | 45 (46.9%) | 51 (53.1%) |
| Personal Care & Service | 12 (18.8%) | 52 (81.2%) |
| Total (Category) | 96 (36.0%) | 171 (64.0%) |
| Total (Overall) | 750 (50.7%) | 728 (49.3%) |
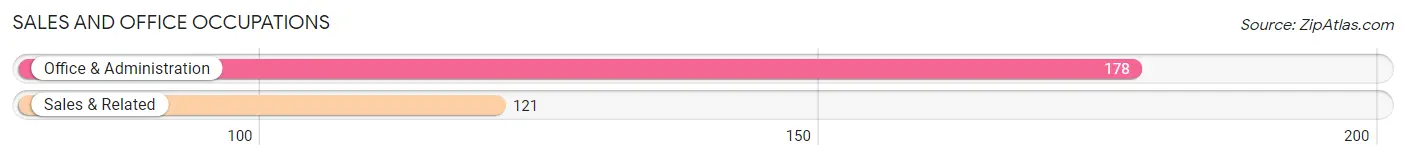
Sales and Office Occupations
The most common Sales and Office occupations in Lyman County are Office & Administration (178 | 12.0%), and Sales & Related (121 | 8.2%).
Sales and Office Occupations by Sex

| Occupation | Male | Female |
| Sales & Related | 66 (54.5%) | 55 (45.5%) |
| Office & Administration | 26 (14.6%) | 152 (85.4%) |
| Total (Category) | 92 (30.8%) | 207 (69.2%) |
| Total (Overall) | 750 (50.7%) | 728 (49.3%) |
Natural Resources, Construction and Maintenance Occupations
The most common Natural Resources, Construction and Maintenance occupations in Lyman County are Construction & Extraction (83 | 5.6%), Farming, Fishing & Forestry (81 | 5.5%), and Installation, Maintenance & Repair (39 | 2.6%).

Natural Resources, Construction and Maintenance Occupations by Sex

| Occupation | Male | Female |
| Farming, Fishing & Forestry | 68 (84.0%) | 13 (16.1%) |
| Construction & Extraction | 78 (94.0%) | 5 (6.0%) |
| Installation, Maintenance & Repair | 39 (100.0%) | 0 (0.0%) |
| Total (Category) | 185 (91.1%) | 18 (8.9%) |
| Total (Overall) | 750 (50.7%) | 728 (49.3%) |
Production, Transportation and Moving Occupations
The most common Production, Transportation and Moving occupations in Lyman County are Transportation (53 | 3.6%), Material Moving (40 | 2.7%), and Production (18 | 1.2%).

Production, Transportation and Moving Occupations by Sex

| Occupation | Male | Female |
| Production | 18 (100.0%) | 0 (0.0%) |
| Transportation | 53 (100.0%) | 0 (0.0%) |
| Material Moving | 32 (80.0%) | 8 (20.0%) |
| Total (Category) | 103 (92.8%) | 8 (7.2%) |
| Total (Overall) | 750 (50.7%) | 728 (49.3%) |
Employment Industries by Sex in Lyman County
Employment Industries in Lyman County
The major employment industries in Lyman County include Educational Services (253 | 17.1%), Agriculture, Fishing & Hunting (228 | 15.4%), Public Administration (174 | 11.8%), Health Care & Social Assistance (170 | 11.5%), and Retail Trade (105 | 7.1%).

Employment Industries by Sex in Lyman County
The Lyman County industries that see more men than women are Manufacturing (100.0%), Transportation & Warehousing (100.0%), and Utilities (100.0%), whereas the industries that tend to have a higher number of women are Health Care & Social Assistance (95.9%), Information (76.0%), and Finance & Insurance (65.7%).

| Industry | Male | Female |
| Agriculture, Fishing & Hunting | 187 (82.0%) | 41 (18.0%) |
| Mining, Quarrying, & Extraction | 0 (0.0%) | 0 (0.0%) |
| Construction | 94 (91.3%) | 9 (8.7%) |
| Manufacturing | 12 (100.0%) | 0 (0.0%) |
| Wholesale Trade | 33 (78.6%) | 9 (21.4%) |
| Retail Trade | 40 (38.1%) | 65 (61.9%) |
| Transportation & Warehousing | 32 (100.0%) | 0 (0.0%) |
| Utilities | 7 (100.0%) | 0 (0.0%) |
| Information | 6 (24.0%) | 19 (76.0%) |
| Finance & Insurance | 12 (34.3%) | 23 (65.7%) |
| Real Estate, Rental & Leasing | 34 (82.9%) | 7 (17.1%) |
| Professional & Scientific | 22 (37.3%) | 37 (62.7%) |
| Enterprise Management | 0 (0.0%) | 0 (0.0%) |
| Administrative & Support | 19 (82.6%) | 4 (17.4%) |
| Educational Services | 98 (38.7%) | 155 (61.3%) |
| Health Care & Social Assistance | 7 (4.1%) | 163 (95.9%) |
| Arts, Entertainment & Recreation | 32 (50.8%) | 31 (49.2%) |
| Accommodation & Food Services | 25 (35.2%) | 46 (64.8%) |
| Public Administration | 67 (38.5%) | 107 (61.5%) |
| Total | 750 (50.7%) | 728 (49.3%) |
Education in Lyman County
School Enrollment in Lyman County
The most common levels of schooling among the 918 students in Lyman County are high school (217 | 23.6%), middle school (214 | 23.3%), and elementary school (208 | 22.7%).

| School Level | # Students | % Students |
| Nursery / Preschool | 104 | 11.3% |
| Kindergarten | 79 | 8.6% |
| Elementary School | 208 | 22.7% |
| Middle School | 214 | 23.3% |
| High School | 217 | 23.6% |
| College / Undergraduate | 83 | 9.0% |
| Graduate / Professional | 13 | 1.4% |
| Total | 918 | 100.0% |
School Enrollment by Age by Funding Source in Lyman County
Out of a total of 918 students who are enrolled in schools in Lyman County, 41 (4.5%) attend a private institution, while the remaining 877 (95.5%) are enrolled in public schools. The age group of 35 years and over has the highest likelihood of being enrolled in private schools, with 4 (20.0% in the age bracket) enrolled. Conversely, the age group of 15 to 17 year olds has the lowest likelihood of being enrolled in a private school, with 174 (100.0% in the age bracket) attending a public institution.

| Age Bracket | Public School | Private School |
| 3 to 4 Year Olds | 62 (91.2%) | 6 (8.8%) |
| 5 to 9 Year Old | 276 (96.5%) | 10 (3.5%) |
| 10 to 14 Year Olds | 250 (95.4%) | 12 (4.6%) |
| 15 to 17 Year Olds | 174 (100.0%) | 0 (0.0%) |
| 18 to 19 Year Olds | 27 (100.0%) | 0 (0.0%) |
| 20 to 24 Year Olds | 48 (84.2%) | 9 (15.8%) |
| 25 to 34 Year Olds | 24 (100.0%) | 0 (0.0%) |
| 35 Years and over | 16 (80.0%) | 4 (20.0%) |
| Total | 877 (95.5%) | 41 (4.5%) |
Educational Attainment by Field of Study in Lyman County
Education (196 | 34.7%), bio, nature & agricultural (104 | 18.4%), business (81 | 14.3%), science & technology (52 | 9.2%), and arts & humanities (34 | 6.0%) are the most common fields of study among 565 individuals in Lyman County who have obtained a bachelor's degree or higher.

| Field of Study | # Graduates | % Graduates |
| Computers & Mathematics | 8 | 1.4% |
| Bio, Nature & Agricultural | 104 | 18.4% |
| Physical & Health Sciences | 10 | 1.8% |
| Psychology | 8 | 1.4% |
| Social Sciences | 18 | 3.2% |
| Engineering | 18 | 3.2% |
| Multidisciplinary Studies | 1 | 0.2% |
| Science & Technology | 52 | 9.2% |
| Business | 81 | 14.3% |
| Education | 196 | 34.7% |
| Literature & Languages | 14 | 2.5% |
| Liberal Arts & History | 7 | 1.2% |
| Visual & Performing Arts | 9 | 1.6% |
| Communications | 5 | 0.9% |
| Arts & Humanities | 34 | 6.0% |
| Total | 565 | 100.0% |
Transportation & Commute in Lyman County
Vehicle Availability by Sex in Lyman County
The most prevalent vehicle ownership categories in Lyman County are males with 2 vehicles (308, accounting for 41.5%) and females with 2 vehicles (279, making up 43.1%).

| Vehicles Available | Male | Female |
| No Vehicle | 8 (1.1%) | 36 (5.0%) |
| 1 Vehicle | 107 (14.4%) | 131 (18.3%) |
| 2 Vehicles | 308 (41.5%) | 279 (39.1%) |
| 3 Vehicles | 144 (19.4%) | 124 (17.4%) |
| 4 Vehicles | 58 (7.8%) | 52 (7.3%) |
| 5 or more Vehicles | 117 (15.8%) | 92 (12.9%) |
| Total | 742 (100.0%) | 714 (100.0%) |
Commute Time in Lyman County
The most frequently occuring commute durations in Lyman County are 5 to 9 minutes (419 commuters, 32.9%), less than 5 minutes (242 commuters, 19.0%), and 10 to 14 minutes (183 commuters, 14.4%).

| Commute Time | # Commuters | % Commuters |
| Less than 5 Minutes | 242 | 19.0% |
| 5 to 9 Minutes | 419 | 32.9% |
| 10 to 14 Minutes | 183 | 14.4% |
| 15 to 19 Minutes | 136 | 10.7% |
| 20 to 24 Minutes | 71 | 5.6% |
| 25 to 29 Minutes | 39 | 3.1% |
| 30 to 34 Minutes | 65 | 5.1% |
| 35 to 39 Minutes | 12 | 0.9% |
| 40 to 44 Minutes | 16 | 1.3% |
| 45 to 59 Minutes | 47 | 3.7% |
| 60 to 89 Minutes | 20 | 1.6% |
| 90 or more Minutes | 24 | 1.9% |
Commute Time by Sex in Lyman County
The most common commute times in Lyman County are 5 to 9 minutes (224 commuters, 33.5%) for males and 5 to 9 minutes (195 commuters, 32.2%) for females.

| Commute Time | Male | Female |
| Less than 5 Minutes | 168 (25.1%) | 74 (12.2%) |
| 5 to 9 Minutes | 224 (33.5%) | 195 (32.2%) |
| 10 to 14 Minutes | 93 (13.9%) | 90 (14.9%) |
| 15 to 19 Minutes | 69 (10.3%) | 67 (11.1%) |
| 20 to 24 Minutes | 28 (4.2%) | 43 (7.1%) |
| 25 to 29 Minutes | 5 (0.7%) | 34 (5.6%) |
| 30 to 34 Minutes | 22 (3.3%) | 43 (7.1%) |
| 35 to 39 Minutes | 0 (0.0%) | 12 (2.0%) |
| 40 to 44 Minutes | 11 (1.6%) | 5 (0.8%) |
| 45 to 59 Minutes | 23 (3.4%) | 24 (4.0%) |
| 60 to 89 Minutes | 3 (0.4%) | 17 (2.8%) |
| 90 or more Minutes | 23 (3.4%) | 1 (0.2%) |
Time of Departure to Work by Sex in Lyman County
The most frequent times of departure to work in Lyman County are 8:00 AM to 8:29 AM (201, 30.0%) for males and 8:00 AM to 8:29 AM (167, 27.6%) for females.

| Time of Departure | Male | Female |
| 12:00 AM to 4:59 AM | 5 (0.7%) | 3 (0.5%) |
| 5:00 AM to 5:29 AM | 13 (1.9%) | 3 (0.5%) |
| 5:30 AM to 5:59 AM | 1 (0.2%) | 13 (2.1%) |
| 6:00 AM to 6:29 AM | 26 (3.9%) | 13 (2.1%) |
| 6:30 AM to 6:59 AM | 48 (7.2%) | 32 (5.3%) |
| 7:00 AM to 7:29 AM | 119 (17.8%) | 122 (20.2%) |
| 7:30 AM to 7:59 AM | 153 (22.9%) | 133 (22.0%) |
| 8:00 AM to 8:29 AM | 201 (30.0%) | 167 (27.6%) |
| 8:30 AM to 8:59 AM | 22 (3.3%) | 38 (6.3%) |
| 9:00 AM to 9:59 AM | 15 (2.2%) | 25 (4.1%) |
| 10:00 AM to 10:59 AM | 4 (0.6%) | 7 (1.2%) |
| 11:00 AM to 11:59 AM | 19 (2.8%) | 3 (0.5%) |
| 12:00 PM to 3:59 PM | 22 (3.3%) | 22 (3.6%) |
| 4:00 PM to 11:59 PM | 21 (3.1%) | 24 (4.0%) |
| Total | 669 (100.0%) | 605 (100.0%) |
Housing Occupancy in Lyman County
Occupancy by Ownership in Lyman County
Of the total 1,204 dwellings in Lyman County, owner-occupied units account for 805 (66.9%), while renter-occupied units make up 399 (33.1%).

| Occupancy | # Housing Units | % Housing Units |
| Owner Occupied Housing Units | 805 | 66.9% |
| Renter-Occupied Housing Units | 399 | 33.1% |
| Total Occupied Housing Units | 1,204 | 100.0% |
Occupancy by Household Size in Lyman County

| Household Size | # Housing Units | % Housing Units |
| 1-Person Household | 321 | 26.7% |
| 2-Person Household | 467 | 38.8% |
| 3-Person Household | 157 | 13.0% |
| 4+ Person Household | 259 | 21.5% |
| Total Housing Units | 1,204 | 100.0% |
Occupancy by Ownership by Household Size in Lyman County
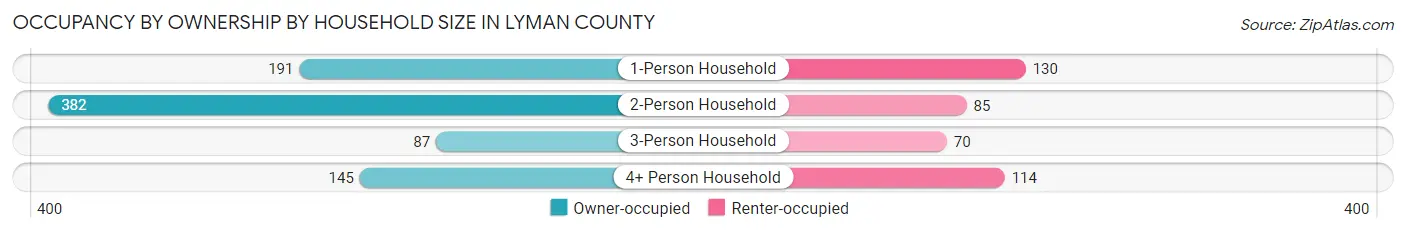
| Household Size | Owner-occupied | Renter-occupied |
| 1-Person Household | 191 (59.5%) | 130 (40.5%) |
| 2-Person Household | 382 (81.8%) | 85 (18.2%) |
| 3-Person Household | 87 (55.4%) | 70 (44.6%) |
| 4+ Person Household | 145 (56.0%) | 114 (44.0%) |
| Total Housing Units | 805 (66.9%) | 399 (33.1%) |
Occupancy by Educational Attainment in Lyman County

| Household Size | Owner-occupied | Renter-occupied |
| Less than High School | 32 (46.4%) | 37 (53.6%) |
| High School Diploma | 352 (71.8%) | 138 (28.2%) |
| College/Associate Degree | 220 (57.3%) | 164 (42.7%) |
| Bachelor's Degree or higher | 201 (77.0%) | 60 (23.0%) |
Occupancy by Age of Householder in Lyman County

| Age Bracket | # Households | % Households |
| Under 35 Years | 203 | 16.9% |
| 35 to 44 Years | 164 | 13.6% |
| 45 to 54 Years | 187 | 15.5% |
| 55 to 64 Years | 262 | 21.8% |
| 65 to 74 Years | 237 | 19.7% |
| 75 to 84 Years | 126 | 10.5% |
| 85 Years and Over | 25 | 2.1% |
| Total | 1,204 | 100.0% |
Housing Finances in Lyman County
Median Income by Occupancy in Lyman County

| Occupancy Type | # Households | Median Income |
| Owner-Occupied | 805 (66.9%) | $70,163 |
| Renter-Occupied | 399 (33.1%) | $30,536 |
| Average | 1,204 (100.0%) | $60,284 |
Occupancy by Householder Income Bracket in Lyman County

| Income Bracket | Owner-occupied | Renter-occupied |
| Less than $5,000 | 7 (0.9%) | 29 (7.3%) |
| $5,000 to $9,999 | 18 (2.2%) | 34 (8.5%) |
| $10,000 to $14,999 | 26 (3.2%) | 36 (9.0%) |
| $15,000 to $19,999 | 27 (3.4%) | 48 (12.0%) |
| $20,000 to $24,999 | 7 (0.9%) | 22 (5.5%) |
| $25,000 to $34,999 | 64 (8.0%) | 43 (10.8%) |
| $35,000 to $49,999 | 76 (9.4%) | 38 (9.5%) |
| $50,000 to $74,999 | 210 (26.1%) | 74 (18.5%) |
| $75,000 to $99,999 | 120 (14.9%) | 26 (6.5%) |
| $100,000 to $149,999 | 153 (19.0%) | 29 (7.3%) |
| $150,000 or more | 97 (12.0%) | 20 (5.0%) |
| Total | 805 (100.0%) | 399 (100.0%) |
Monthly Housing Cost Tiers in Lyman County

| Monthly Cost | Owner-occupied | Renter-occupied |
| Less than $300 | 98 (12.2%) | 62 (15.5%) |
| $300 to $499 | 192 (23.8%) | 72 (18.0%) |
| $500 to $799 | 202 (25.1%) | 133 (33.3%) |
| $800 to $999 | 70 (8.7%) | 59 (14.8%) |
| $1,000 to $1,499 | 147 (18.3%) | 18 (4.5%) |
| $1,500 to $1,999 | 17 (2.1%) | 2 (0.5%) |
| $2,000 to $2,499 | 23 (2.9%) | 0 (0.0%) |
| $2,500 to $2,999 | 18 (2.2%) | 0 (0.0%) |
| $3,000 or more | 38 (4.7%) | 0 (0.0%) |
| Total | 805 (100.0%) | 399 (100.0%) |
Physical Housing Characteristics in Lyman County
Housing Structures in Lyman County

| Structure Type | # Housing Units | % Housing Units |
| Single Unit, Detached | 967 | 80.3% |
| Single Unit, Attached | 17 | 1.4% |
| 2 Unit Apartments | 27 | 2.2% |
| 3 or 4 Unit Apartments | 4 | 0.3% |
| 5 to 9 Unit Apartments | 34 | 2.8% |
| 10 or more Apartments | 29 | 2.4% |
| Mobile Home / Other | 126 | 10.5% |
| Total | 1,204 | 100.0% |
Housing Structures by Occupancy in Lyman County
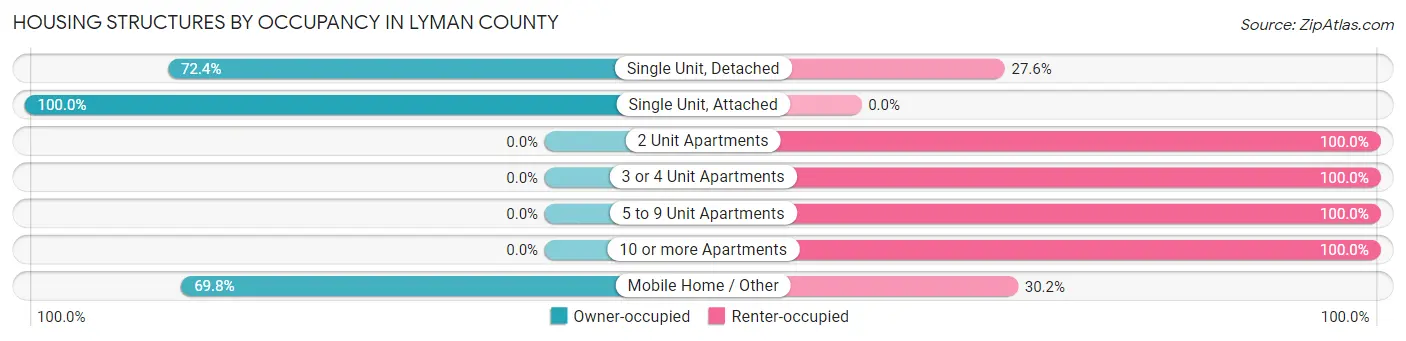
| Structure Type | Owner-occupied | Renter-occupied |
| Single Unit, Detached | 700 (72.4%) | 267 (27.6%) |
| Single Unit, Attached | 17 (100.0%) | 0 (0.0%) |
| 2 Unit Apartments | 0 (0.0%) | 27 (100.0%) |
| 3 or 4 Unit Apartments | 0 (0.0%) | 4 (100.0%) |
| 5 to 9 Unit Apartments | 0 (0.0%) | 34 (100.0%) |
| 10 or more Apartments | 0 (0.0%) | 29 (100.0%) |
| Mobile Home / Other | 88 (69.8%) | 38 (30.2%) |
| Total | 805 (66.9%) | 399 (33.1%) |
Housing Structures by Number of Rooms in Lyman County

| Number of Rooms | Owner-occupied | Renter-occupied |
| 1 Room | 0 (0.0%) | 2 (0.5%) |
| 2 or 3 Rooms | 33 (4.1%) | 70 (17.5%) |
| 4 or 5 Rooms | 222 (27.6%) | 185 (46.4%) |
| 6 or 7 Rooms | 236 (29.3%) | 124 (31.1%) |
| 8 or more Rooms | 314 (39.0%) | 18 (4.5%) |
| Total | 805 (100.0%) | 399 (100.0%) |
Housing Structure by Heating Type in Lyman County
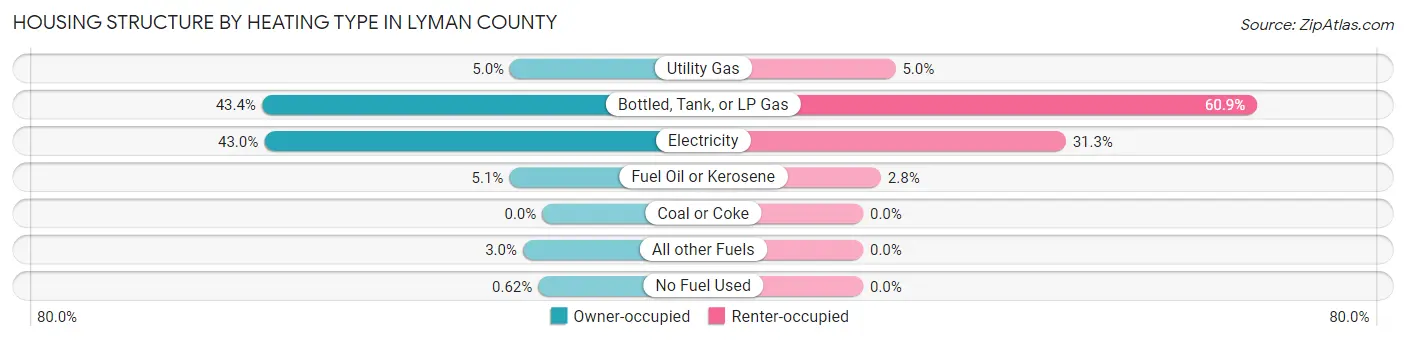
| Heating Type | Owner-occupied | Renter-occupied |
| Utility Gas | 40 (5.0%) | 20 (5.0%) |
| Bottled, Tank, or LP Gas | 349 (43.3%) | 243 (60.9%) |
| Electricity | 346 (43.0%) | 125 (31.3%) |
| Fuel Oil or Kerosene | 41 (5.1%) | 11 (2.8%) |
| Coal or Coke | 0 (0.0%) | 0 (0.0%) |
| All other Fuels | 24 (3.0%) | 0 (0.0%) |
| No Fuel Used | 5 (0.6%) | 0 (0.0%) |
| Total | 805 (100.0%) | 399 (100.0%) |
Household Vehicle Usage in Lyman County

| Vehicles per Household | Owner-occupied | Renter-occupied |
| No Vehicle | 26 (3.2%) | 96 (24.1%) |
| 1 Vehicle | 130 (16.2%) | 158 (39.6%) |
| 2 Vehicles | 329 (40.9%) | 98 (24.6%) |
| 3 or more Vehicles | 320 (39.8%) | 47 (11.8%) |
| Total | 805 (100.0%) | 399 (100.0%) |
Real Estate & Mortgages in Lyman County
Real Estate and Mortgage Overview in Lyman County
| Characteristic | Without Mortgage | With Mortgage |
| Housing Units | 594 | 211 |
| Median Property Value | $111,100 | $168,000 |
| Median Household Income | $64,063 | $30 |
| Monthly Housing Costs | $514 | $38 |
| Real Estate Taxes | $1,096 | $23 |
Property Value by Mortgage Status in Lyman County

| Property Value | Without Mortgage | With Mortgage |
| Less than $50,000 | 170 (28.6%) | 5 (2.4%) |
| $50,000 to $99,999 | 99 (16.7%) | 25 (11.8%) |
| $100,000 to $299,999 | 249 (41.9%) | 128 (60.7%) |
| $300,000 to $499,999 | 45 (7.6%) | 26 (12.3%) |
| $500,000 to $749,999 | 20 (3.4%) | 26 (12.3%) |
| $750,000 to $999,999 | 11 (1.8%) | 1 (0.5%) |
| $1,000,000 or more | 0 (0.0%) | 0 (0.0%) |
| Total | 594 (100.0%) | 211 (100.0%) |
Household Income by Mortgage Status in Lyman County
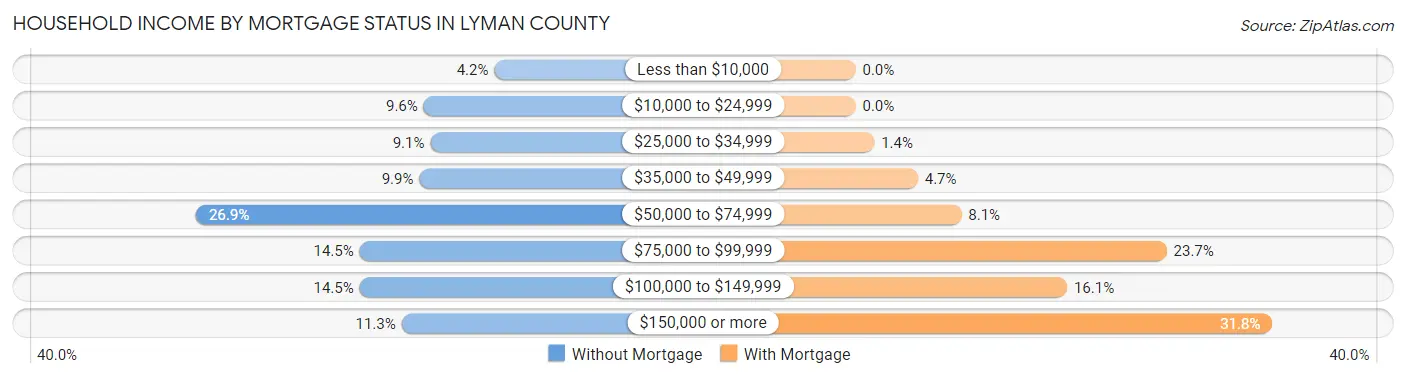
| Household Income | Without Mortgage | With Mortgage |
| Less than $10,000 | 25 (4.2%) | 0 (0.0%) |
| $10,000 to $24,999 | 57 (9.6%) | 0 (0.0%) |
| $25,000 to $34,999 | 54 (9.1%) | 3 (1.4%) |
| $35,000 to $49,999 | 59 (9.9%) | 10 (4.7%) |
| $50,000 to $74,999 | 160 (26.9%) | 17 (8.1%) |
| $75,000 to $99,999 | 86 (14.5%) | 50 (23.7%) |
| $100,000 to $149,999 | 86 (14.5%) | 34 (16.1%) |
| $150,000 or more | 67 (11.3%) | 67 (31.8%) |
| Total | 594 (100.0%) | 211 (100.0%) |
Property Value to Household Income Ratio in Lyman County
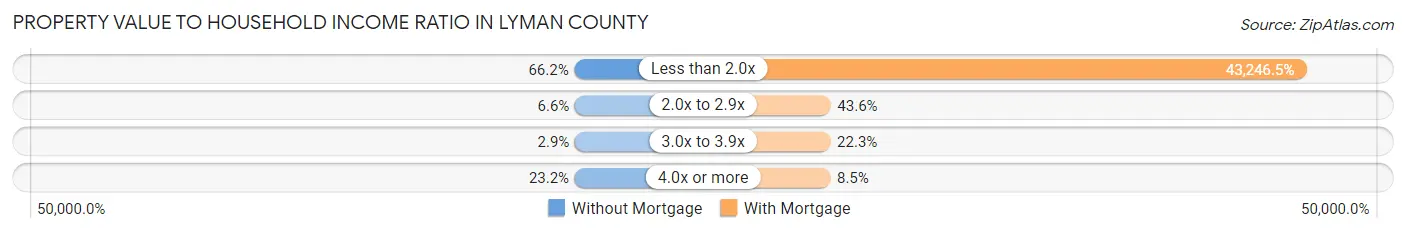
| Value-to-Income Ratio | Without Mortgage | With Mortgage |
| Less than 2.0x | 393 (66.2%) | 91,250 (43,246.4%) |
| 2.0x to 2.9x | 39 (6.6%) | 92 (43.6%) |
| 3.0x to 3.9x | 17 (2.9%) | 47 (22.3%) |
| 4.0x or more | 138 (23.2%) | 18 (8.5%) |
| Total | 594 (100.0%) | 211 (100.0%) |
Real Estate Taxes by Mortgage Status in Lyman County
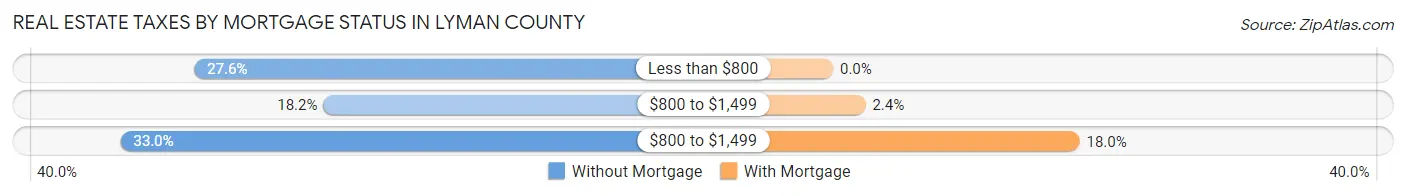
| Property Taxes | Without Mortgage | With Mortgage |
| Less than $800 | 164 (27.6%) | 0 (0.0%) |
| $800 to $1,499 | 108 (18.2%) | 5 (2.4%) |
| $800 to $1,499 | 196 (33.0%) | 38 (18.0%) |
| Total | 594 (100.0%) | 211 (100.0%) |
Health & Disability in Lyman County
Health Insurance Coverage by Age in Lyman County

| Age Bracket | With Coverage | Without Coverage |
| Under 6 Years | 307 (75.6%) | 99 (24.4%) |
| 6 to 18 Years | 542 (80.6%) | 130 (19.4%) |
| 19 to 25 Years | 229 (66.4%) | 116 (33.6%) |
| 26 to 34 Years | 262 (78.4%) | 72 (21.6%) |
| 35 to 44 Years | 315 (75.9%) | 100 (24.1%) |
| 45 to 54 Years | 241 (65.1%) | 129 (34.9%) |
| 55 to 64 Years | 419 (80.6%) | 101 (19.4%) |
| 65 to 74 Years | 366 (96.1%) | 15 (3.9%) |
| 75 Years and older | 253 (100.0%) | 0 (0.0%) |
| Total | 2,934 (79.4%) | 762 (20.6%) |
Health Insurance Coverage by Citizenship Status in Lyman County
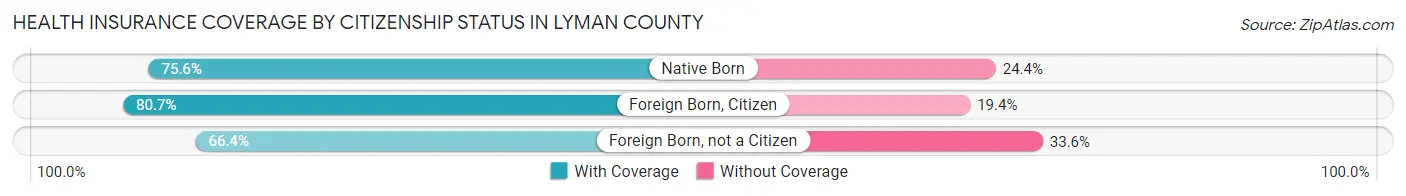
| Citizenship Status | With Coverage | Without Coverage |
| Native Born | 307 (75.6%) | 99 (24.4%) |
| Foreign Born, Citizen | 542 (80.6%) | 130 (19.4%) |
| Foreign Born, not a Citizen | 229 (66.4%) | 116 (33.6%) |
Health Insurance Coverage by Household Income in Lyman County

| Household Income | With Coverage | Without Coverage |
| Under $25,000 | 412 (57.0%) | 311 (43.0%) |
| $25,000 to $49,999 | 455 (76.7%) | 138 (23.3%) |
| $50,000 to $74,999 | 735 (79.4%) | 191 (20.6%) |
| $75,000 to $99,999 | 369 (83.9%) | 71 (16.1%) |
| $100,000 and over | 909 (96.2%) | 36 (3.8%) |
Public vs Private Health Insurance Coverage by Age in Lyman County

| Age Bracket | Public Insurance | Private Insurance |
| Under 6 | 131 (32.3%) | 176 (43.3%) |
| 6 to 18 Years | 252 (37.5%) | 291 (43.3%) |
| 19 to 25 Years | 45 (13.0%) | 184 (53.3%) |
| 25 to 34 Years | 90 (27.0%) | 190 (56.9%) |
| 35 to 44 Years | 117 (28.2%) | 251 (60.5%) |
| 45 to 54 Years | 36 (9.7%) | 206 (55.7%) |
| 55 to 64 Years | 64 (12.3%) | 365 (70.2%) |
| 65 to 74 Years | 355 (93.2%) | 205 (53.8%) |
| 75 Years and over | 253 (100.0%) | 135 (53.4%) |
| Total | 1,343 (36.3%) | 2,003 (54.2%) |
Disability Status by Sex by Age in Lyman County

| Age Bracket | Male | Female |
| Under 5 Years | 0 (0.0%) | 0 (0.0%) |
| 5 to 17 Years | 0 (0.0%) | 11 (3.0%) |
| 18 to 34 Years | 30 (8.1%) | 36 (11.1%) |
| 35 to 64 Years | 169 (24.3%) | 100 (16.4%) |
| 65 to 74 Years | 82 (39.8%) | 54 (30.9%) |
| 75 Years and over | 36 (33.6%) | 85 (58.2%) |
Disability Class by Sex by Age in Lyman County
Disability Class: Hearing Difficulty

| Age Bracket | Male | Female |
| Under 5 Years | 0 (0.0%) | 0 (0.0%) |
| 5 to 17 Years | 0 (0.0%) | 0 (0.0%) |
| 18 to 34 Years | 16 (4.3%) | 15 (4.6%) |
| 35 to 64 Years | 42 (6.0%) | 36 (5.9%) |
| 65 to 74 Years | 50 (24.3%) | 24 (13.7%) |
| 75 Years and over | 15 (14.0%) | 22 (15.1%) |
Disability Class: Vision Difficulty

| Age Bracket | Male | Female |
| Under 5 Years | 0 (0.0%) | 0 (0.0%) |
| 5 to 17 Years | 0 (0.0%) | 0 (0.0%) |
| 18 to 34 Years | 2 (0.5%) | 18 (5.5%) |
| 35 to 64 Years | 7 (1.0%) | 35 (5.7%) |
| 65 to 74 Years | 11 (5.3%) | 9 (5.1%) |
| 75 Years and over | 3 (2.8%) | 8 (5.5%) |
Disability Class: Cognitive Difficulty

| Age Bracket | Male | Female |
| 5 to 17 Years | 0 (0.0%) | 0 (0.0%) |
| 18 to 34 Years | 20 (5.4%) | 14 (4.3%) |
| 35 to 64 Years | 41 (5.9%) | 6 (1.0%) |
| 65 to 74 Years | 8 (3.9%) | 0 (0.0%) |
| 75 Years and over | 0 (0.0%) | 14 (9.6%) |
Disability Class: Ambulatory Difficulty

| Age Bracket | Male | Female |
| 5 to 17 Years | 0 (0.0%) | 11 (3.0%) |
| 18 to 34 Years | 8 (2.1%) | 0 (0.0%) |
| 35 to 64 Years | 73 (10.5%) | 64 (10.5%) |
| 65 to 74 Years | 28 (13.6%) | 31 (17.7%) |
| 75 Years and over | 26 (24.3%) | 76 (52.0%) |
Disability Class: Self-Care Difficulty

| Age Bracket | Male | Female |
| 5 to 17 Years | 0 (0.0%) | 4 (1.1%) |
| 18 to 34 Years | 0 (0.0%) | 0 (0.0%) |
| 35 to 64 Years | 26 (3.7%) | 10 (1.6%) |
| 65 to 74 Years | 4 (1.9%) | 4 (2.3%) |
| 75 Years and over | 17 (15.9%) | 20 (13.7%) |
Technology Access in Lyman County
Computing Device Access in Lyman County

| Device Type | # Households | % Households |
| Desktop or Laptop | 738 | 61.3% |
| Smartphone | 980 | 81.4% |
| Tablet | 592 | 49.2% |
| No Computing Device | 133 | 11.1% |
| Total | 1,204 | 100.0% |
Internet Access in Lyman County

| Internet Type | # Households | % Households |
| Dial-Up Internet | 14 | 1.2% |
| Broadband Home | 703 | 58.4% |
| Cellular Data Only | 225 | 18.7% |
| Satellite Internet | 58 | 4.8% |
| No Internet | 232 | 19.3% |
| Total | 1,204 | 100.0% |
Lyman County Summary
Lyman County is located in the southeastern corner of South Dakota, and is bordered by Gregory, Charles Mix, Brule, Buffalo, and Jones counties. The county seat is Kennebec, and the county was named after Charles Lyman, a former territorial legislator. The county has a total area of 1,072 square miles, and a population of 3,845 as of the 2010 census.
History
Lyman County was established in 1873, and was originally part of the Dakota Territory. The county was named after Charles Lyman, a former territorial legislator. The first settlers arrived in the area in 1873, and the county was officially organized in 1883. The county seat was originally located in Oacoma, but was moved to Kennebec in 1884.
The county was largely agricultural in its early years, with the main crops being wheat, corn, and oats. The county also had a thriving livestock industry, with cattle, sheep, and hogs being the main animals raised. The county also had a number of small businesses, including a flour mill, a creamery, and a lumber mill.
Geography
Lyman County is located in the southeastern corner of South Dakota, and is bordered by Gregory, Charles Mix, Brule, Buffalo, and Jones counties. The county has a total area of 1,072 square miles, and is mostly flat, with some rolling hills in the western part of the county. The county is drained by the Missouri River, which forms the eastern border of the county.
The county has a semi-arid climate, with hot summers and cold winters. The average annual temperature is 48°F, and the average annual precipitation is 17.5 inches.
Economy
The economy of Lyman County is largely based on agriculture. The main crops grown in the county are wheat, corn, soybeans, and oats. The county also has a thriving livestock industry, with cattle, sheep, and hogs being the main animals raised.
The county also has a number of small businesses, including a flour mill, a creamery, and a lumber mill. The county also has a number of tourist attractions, including the Badlands National Park, the Missouri National Recreational River, and the Lewis and Clark Trail.
Demographics
As of the 2010 census, there were 3,845 people, 1,541 households, and 1,039 families living in Lyman County. The population density was 3.6 people per square mile. The racial makeup of the county was 97.3% White, 0.3% African American, 0.3% Native American, 0.2% Asian, 0.1% Pacific Islander, 0.7% from other races, and 0.9% from two or more races. Hispanic or Latino of any race were 1.7% of the population.
The median income for a household in the county was $37,917, and the median income for a family was $45,938. The per capita income for the county was $17,945. About 11.2% of families and 14.2% of the population were below the poverty line, including 17.2% of those under age 18 and 11.2% of those age 65 or over.
Common Questions
What is the Total Population of Lyman County?
Total Population of Lyman County is 3,719.
What is the Total Male Population of Lyman County?
Total Male Population of Lyman County is 1,966.
What is the Total Female Population of Lyman County?
Total Female Population of Lyman County is 1,753.
What is the Ratio of Males per 100 Females in Lyman County?
There are 112.15 Males per 100 Females in Lyman County.
What is the Ratio of Females per 100 Males in Lyman County?
There are 89.17 Females per 100 Males in Lyman County.
What is the Median Population Age in Lyman County?
Median Population Age in Lyman County is 36.0 Years.
What is the Average Family Size in Lyman County
Average Family Size in Lyman County is 3.7 People.
What is the Average Household Size in Lyman County
Average Household Size in Lyman County is 3.0 People.
What is Per Capita Income in Lyman County?
Per Capita income in Lyman County is $25,997.
What is the Median Family Income in Lyman County?
Median Family Income in Lyman County is $66,250.
What is the Median Household income in Lyman County?
Median Household Income in Lyman County is $60,284.
What is Income or Wage Gap in Lyman County?
Income or Wage Gap in Lyman County is 39.5%.
Women in Lyman County earn 60.5 cents for every dollar earned by a man.
What is Family Income Deficit in Lyman County?
Family Income Deficit in Lyman County is $13,225.
Families that are below poverty line in Lyman County earn $13,225 less on average than the poverty threshold level.
What is Inequality or Gini Index in Lyman County?
Inequality or Gini Index in Lyman County is 0.44.
How Large is the Labor Force in Lyman County?
There are 1,558 People in the Labor Forcein in Lyman County.
What is the Percentage of People in the Labor Force in Lyman County?
56.3% of People are in the Labor Force in Lyman County.
What is the Unemployment Rate in Lyman County?
Unemployment Rate in Lyman County is 5.0%.