Lawrence County, SD
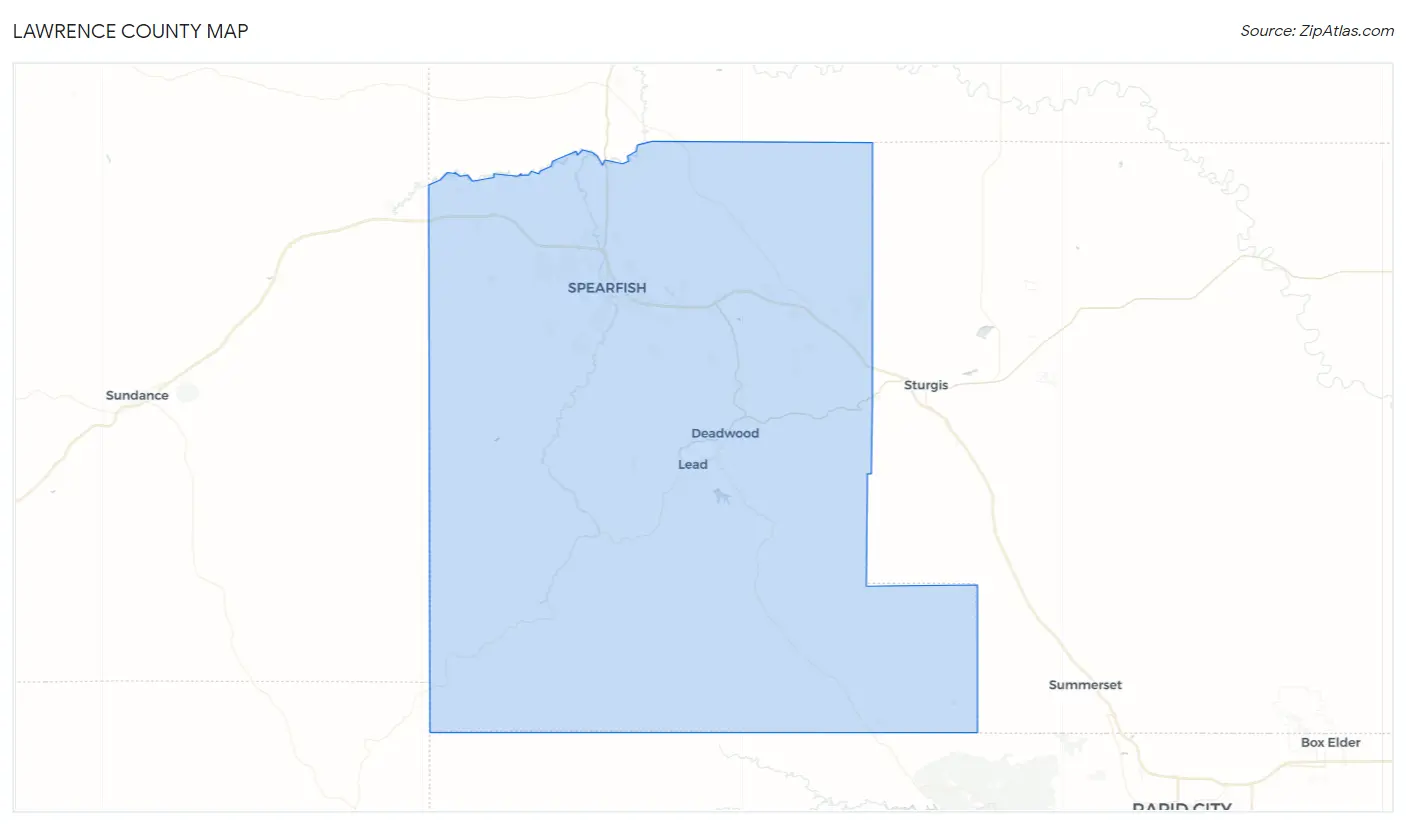
Lawrence County Map
Lawrence County Overview
26,047
TOTAL POPULATION
12,840
MALE POPULATION
13,207
FEMALE POPULATION
97.22
MALES / 100 FEMALES
102.86
FEMALES / 100 MALES
43.0
MEDIAN AGE
2.9
AVG FAMILY SIZE
2.2
AVG HOUSEHOLD SIZE
$41,086
PER CAPITA INCOME
$85,844
AVG FAMILY INCOME
$62,977
AVG HOUSEHOLD INCOME
35.1%
WAGE / INCOME GAP [ % ]
64.9¢/ $1
WAGE / INCOME GAP [ $ ]
$8,420
FAMILY INCOME DEFICIT
0.47
INEQUALITY / GINI INDEX
14,702
LABOR FORCE [ PEOPLE ]
65.9%
PERCENT IN LABOR FORCE
2.5%
UNEMPLOYMENT RATE
Lawrence County Area Codes
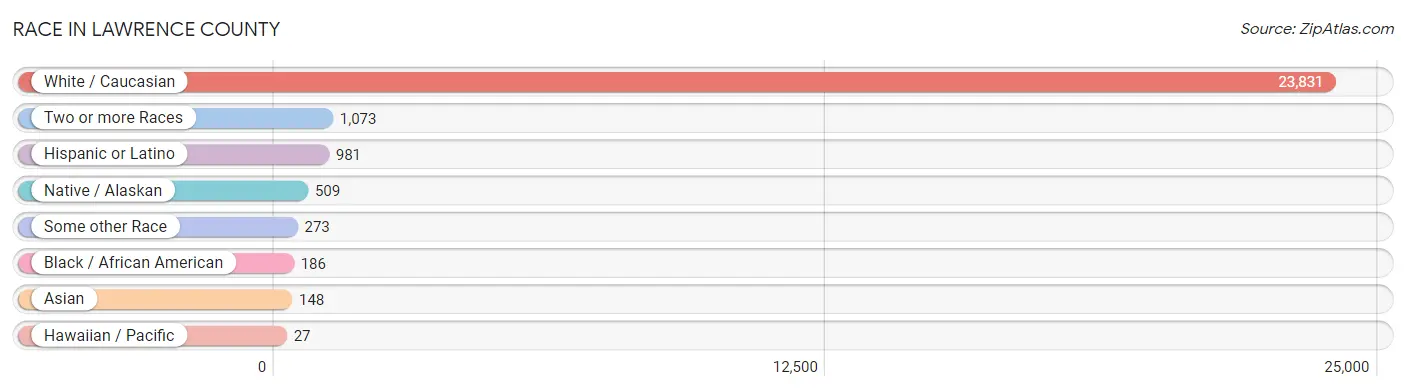
Race in Lawrence County
The most populous races in Lawrence County are White / Caucasian (23,831 | 91.5%), Two or more Races (1,073 | 4.1%), and Hispanic or Latino (981 | 3.8%).
| Race | # Population | % Population |
| Asian | 148 | 0.6% |
| Black / African American | 186 | 0.7% |
| Hawaiian / Pacific | 27 | 0.1% |
| Hispanic or Latino | 981 | 3.8% |
| Native / Alaskan | 509 | 1.9% |
| White / Caucasian | 23,831 | 91.5% |
| Two or more Races | 1,073 | 4.1% |
| Some other Race | 273 | 1.1% |
| Total | 26,047 | 100.0% |
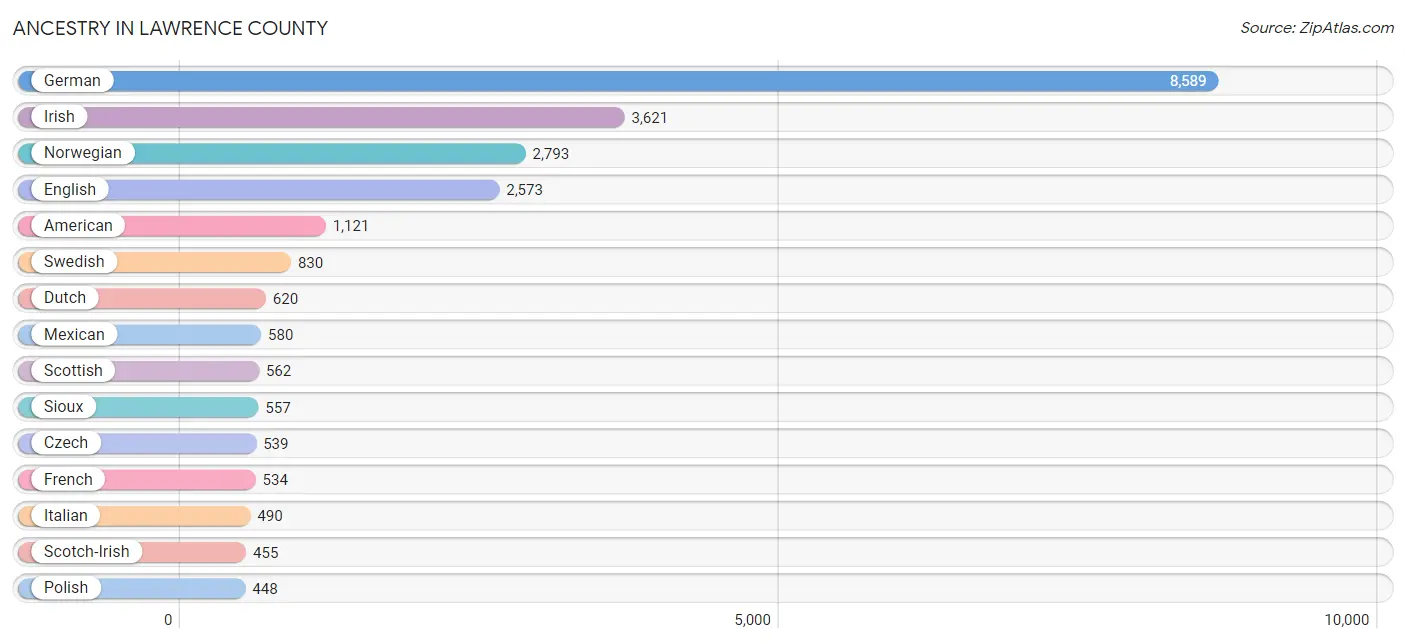
Ancestry in Lawrence County
The most populous ancestries reported in Lawrence County are German (8,589 | 33.0%), Irish (3,621 | 13.9%), Norwegian (2,793 | 10.7%), English (2,573 | 9.9%), and American (1,121 | 4.3%), together accounting for 71.8% of all Lawrence County residents.
| Ancestry | # Population | % Population |
| African | 26 | 0.1% |
| Aleut | 9 | 0.0% |
| American | 1,121 | 4.3% |
| Arab | 14 | 0.1% |
| Arapaho | 2 | 0.0% |
| Armenian | 4 | 0.0% |
| Austrian | 140 | 0.5% |
| Barbadian | 12 | 0.1% |
| Belgian | 58 | 0.2% |
| Bhutanese | 49 | 0.2% |
| British | 104 | 0.4% |
| Burmese | 44 | 0.2% |
| Canadian | 39 | 0.2% |
| Central American | 32 | 0.1% |
| Cherokee | 63 | 0.2% |
| Cheyenne | 177 | 0.7% |
| Chippewa | 19 | 0.1% |
| Choctaw | 67 | 0.3% |
| Costa Rican | 2 | 0.0% |
| Croatian | 15 | 0.1% |
| Cuban | 58 | 0.2% |
| Czech | 539 | 2.1% |
| Czechoslovakian | 111 | 0.4% |
| Danish | 421 | 1.6% |
| Dutch | 620 | 2.4% |
| Eastern European | 39 | 0.2% |
| English | 2,573 | 9.9% |
| Estonian | 29 | 0.1% |
| Ethiopian | 100 | 0.4% |
| European | 418 | 1.6% |
| Finnish | 329 | 1.3% |
| French | 534 | 2.1% |
| French Canadian | 394 | 1.5% |
| German | 8,589 | 33.0% |
| German Russian | 39 | 0.2% |
| Greek | 28 | 0.1% |
| Honduran | 2 | 0.0% |
| Hungarian | 47 | 0.2% |
| Icelander | 4 | 0.0% |
| Indian (Asian) | 81 | 0.3% |
| Irish | 3,621 | 13.9% |
| Italian | 490 | 1.9% |
| Jamaican | 6 | 0.0% |
| Korean | 263 | 1.0% |
| Lebanese | 1 | 0.0% |
| Lithuanian | 99 | 0.4% |
| Luxembourger | 39 | 0.2% |
| Macedonian | 9 | 0.0% |
| Mexican | 580 | 2.2% |
| Native Hawaiian | 27 | 0.1% |
| Northern European | 152 | 0.6% |
| Norwegian | 2,793 | 10.7% |
| Pakistani | 71 | 0.3% |
| Pennsylvania German | 1 | 0.0% |
| Polish | 448 | 1.7% |
| Potawatomi | 3 | 0.0% |
| Puerto Rican | 137 | 0.5% |
| Russian | 433 | 1.7% |
| Salvadoran | 28 | 0.1% |
| Scandinavian | 272 | 1.0% |
| Scotch-Irish | 455 | 1.8% |
| Scottish | 562 | 2.2% |
| Sioux | 557 | 2.1% |
| Slovak | 14 | 0.1% |
| Slovene | 10 | 0.0% |
| Spaniard | 78 | 0.3% |
| Spanish | 34 | 0.1% |
| Subsaharan African | 138 | 0.5% |
| Swedish | 830 | 3.2% |
| Swiss | 82 | 0.3% |
| Thai | 1 | 0.0% |
| Turkish | 29 | 0.1% |
| Ugandan | 12 | 0.1% |
| Ukrainian | 24 | 0.1% |
| Welsh | 211 | 0.8% |
| Yugoslavian | 47 | 0.2% | View All 76 Rows |
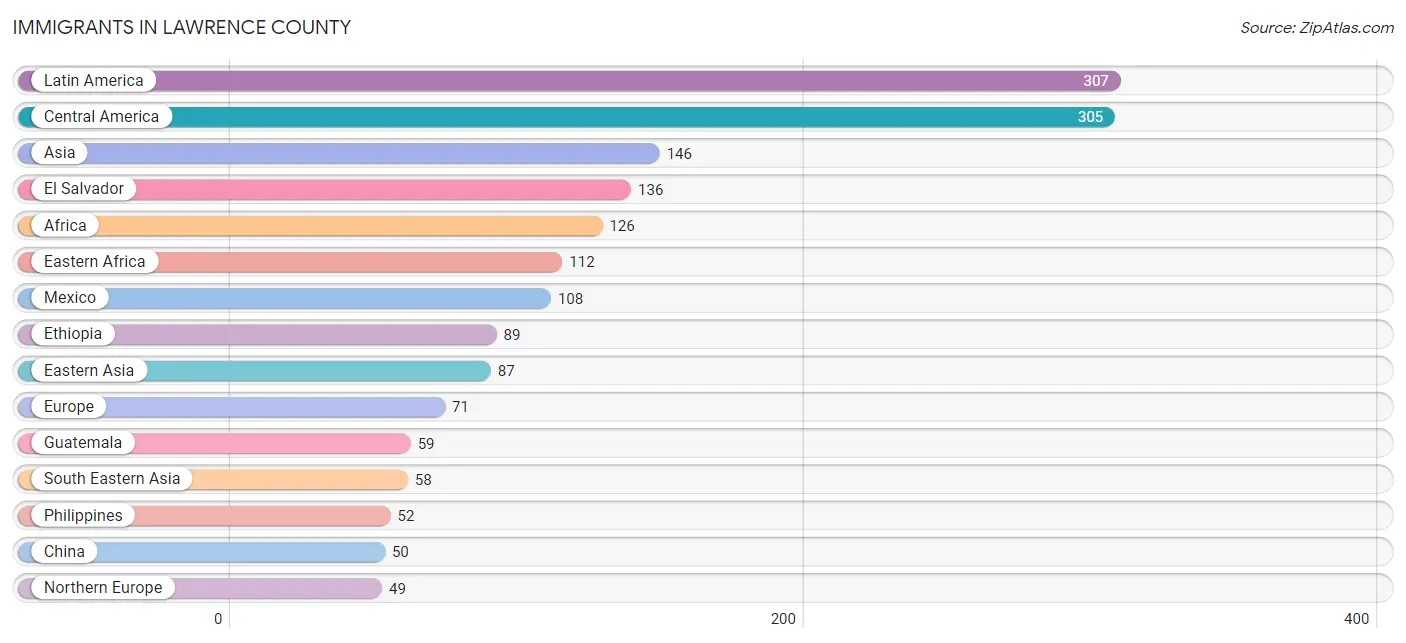
Immigrants in Lawrence County
The most numerous immigrant groups reported in Lawrence County came from Latin America (307 | 1.2%), Central America (305 | 1.2%), Asia (146 | 0.6%), El Salvador (136 | 0.5%), and Africa (126 | 0.5%), together accounting for 3.9% of all Lawrence County residents.
| Immigration Origin | # Population | % Population |
| Africa | 126 | 0.5% |
| Asia | 146 | 0.6% |
| Canada | 15 | 0.1% |
| Caribbean | 2 | 0.0% |
| Central America | 305 | 1.2% |
| China | 50 | 0.2% |
| Eastern Africa | 112 | 0.4% |
| Eastern Asia | 87 | 0.3% |
| Eastern Europe | 6 | 0.0% |
| El Salvador | 136 | 0.5% |
| England | 17 | 0.1% |
| Eritrea | 11 | 0.0% |
| Ethiopia | 89 | 0.3% |
| Europe | 71 | 0.3% |
| Germany | 16 | 0.1% |
| Guatemala | 59 | 0.2% |
| Honduras | 2 | 0.0% |
| Hong Kong | 16 | 0.1% |
| India | 1 | 0.0% |
| Jamaica | 2 | 0.0% |
| Japan | 6 | 0.0% |
| Korea | 31 | 0.1% |
| Latin America | 307 | 1.2% |
| Mexico | 108 | 0.4% |
| Northern Africa | 3 | 0.0% |
| Northern Europe | 49 | 0.2% |
| Philippines | 52 | 0.2% |
| Poland | 3 | 0.0% |
| Russia | 3 | 0.0% |
| South Central Asia | 1 | 0.0% |
| South Eastern Asia | 58 | 0.2% |
| Thailand | 6 | 0.0% |
| Uganda | 12 | 0.1% |
| Western Europe | 16 | 0.1% | View All 34 Rows |
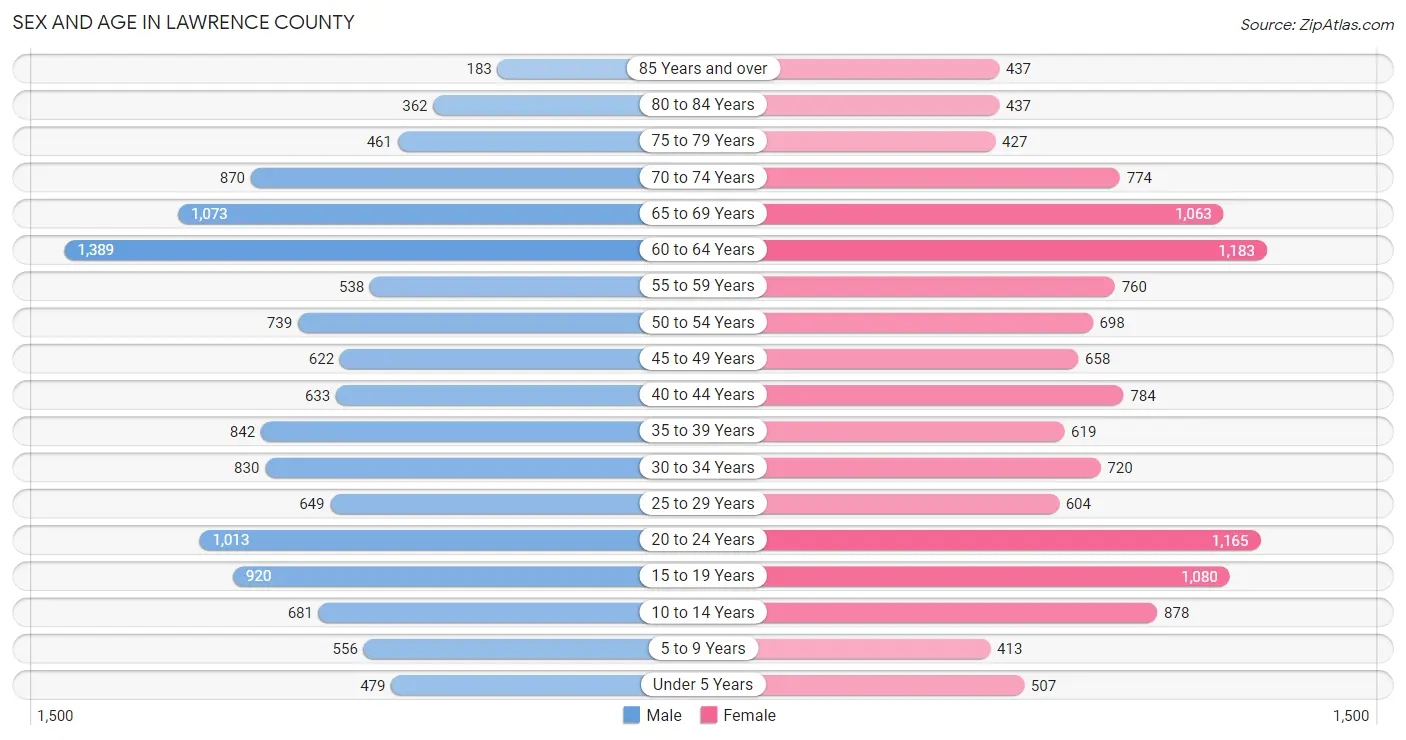
Sex and Age in Lawrence County
Sex and Age in Lawrence County
The most populous age groups in Lawrence County are 60 to 64 Years (1,389 | 10.8%) for men and 60 to 64 Years (1,183 | 9.0%) for women.
| Age Bracket | Male | Female |
| Under 5 Years | 479 (3.7%) | 507 (3.8%) |
| 5 to 9 Years | 556 (4.3%) | 413 (3.1%) |
| 10 to 14 Years | 681 (5.3%) | 878 (6.7%) |
| 15 to 19 Years | 920 (7.2%) | 1,080 (8.2%) |
| 20 to 24 Years | 1,013 (7.9%) | 1,165 (8.8%) |
| 25 to 29 Years | 649 (5.1%) | 604 (4.6%) |
| 30 to 34 Years | 830 (6.5%) | 720 (5.4%) |
| 35 to 39 Years | 842 (6.6%) | 619 (4.7%) |
| 40 to 44 Years | 633 (4.9%) | 784 (5.9%) |
| 45 to 49 Years | 622 (4.8%) | 658 (5.0%) |
| 50 to 54 Years | 739 (5.8%) | 698 (5.3%) |
| 55 to 59 Years | 538 (4.2%) | 760 (5.8%) |
| 60 to 64 Years | 1,389 (10.8%) | 1,183 (9.0%) |
| 65 to 69 Years | 1,073 (8.4%) | 1,063 (8.1%) |
| 70 to 74 Years | 870 (6.8%) | 774 (5.9%) |
| 75 to 79 Years | 461 (3.6%) | 427 (3.2%) |
| 80 to 84 Years | 362 (2.8%) | 437 (3.3%) |
| 85 Years and over | 183 (1.4%) | 437 (3.3%) |
| Total | 12,840 (100.0%) | 13,207 (100.0%) |
Families and Households in Lawrence County
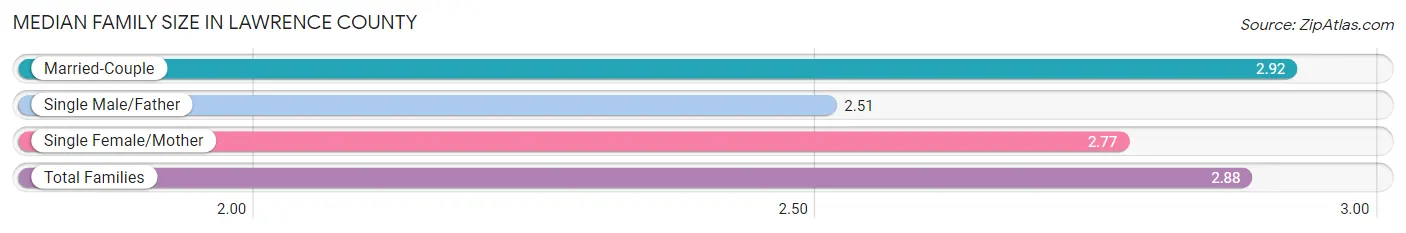
Median Family Size in Lawrence County
The median family size in Lawrence County is 2.88 persons per family, with married-couple families (5,146 | 81.9%) accounting for the largest median family size of 2.92 persons per family. On the other hand, single male/father families (375 | 6.0%) represent the smallest median family size with 2.51 persons per family.
| Family Type | # Families | Family Size |
| Married-Couple | 5,146 (81.9%) | 2.92 |
| Single Male/Father | 375 (6.0%) | 2.51 |
| Single Female/Mother | 759 (12.1%) | 2.77 |
| Total Families | 6,280 (100.0%) | 2.88 |
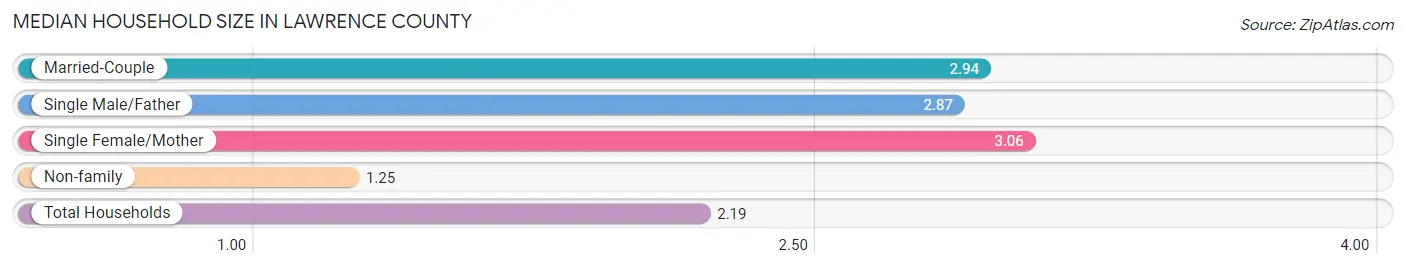
Median Household Size in Lawrence County
The median household size in Lawrence County is 2.19 persons per household, with single female/mother households (759 | 6.7%) accounting for the largest median household size of 3.06 persons per household. non-family households (5,112 | 44.9%) represent the smallest median household size with 1.25 persons per household.
| Household Type | # Households | Household Size |
| Married-Couple | 5,146 (45.2%) | 2.94 |
| Single Male/Father | 375 (3.3%) | 2.87 |
| Single Female/Mother | 759 (6.7%) | 3.06 |
| Non-family | 5,112 (44.9%) | 1.25 |
| Total Households | 11,392 (100.0%) | 2.19 |
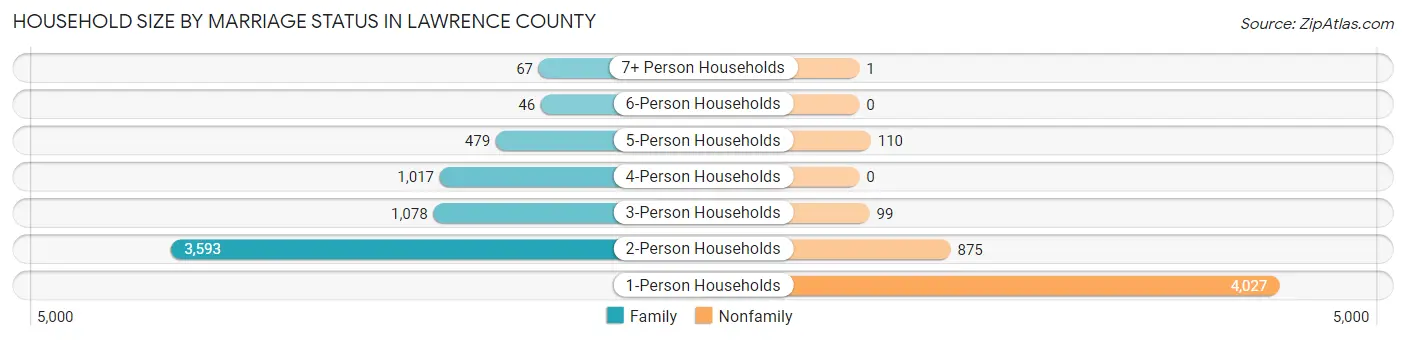
Household Size by Marriage Status in Lawrence County
Out of a total of 11,392 households in Lawrence County, 6,280 (55.1%) are family households, while 5,112 (44.9%) are nonfamily households. The most numerous type of family households are 2-person households, comprising 3,593, and the most common type of nonfamily households are 1-person households, comprising 4,027.
| Household Size | Family Households | Nonfamily Households |
| 1-Person Households | - | 4,027 (35.3%) |
| 2-Person Households | 3,593 (31.5%) | 875 (7.7%) |
| 3-Person Households | 1,078 (9.5%) | 99 (0.9%) |
| 4-Person Households | 1,017 (8.9%) | 0 (0.0%) |
| 5-Person Households | 479 (4.2%) | 110 (1.0%) |
| 6-Person Households | 46 (0.4%) | 0 (0.0%) |
| 7+ Person Households | 67 (0.6%) | 1 (0.0%) |
| Total | 6,280 (55.1%) | 5,112 (44.9%) |
Female Fertility in Lawrence County
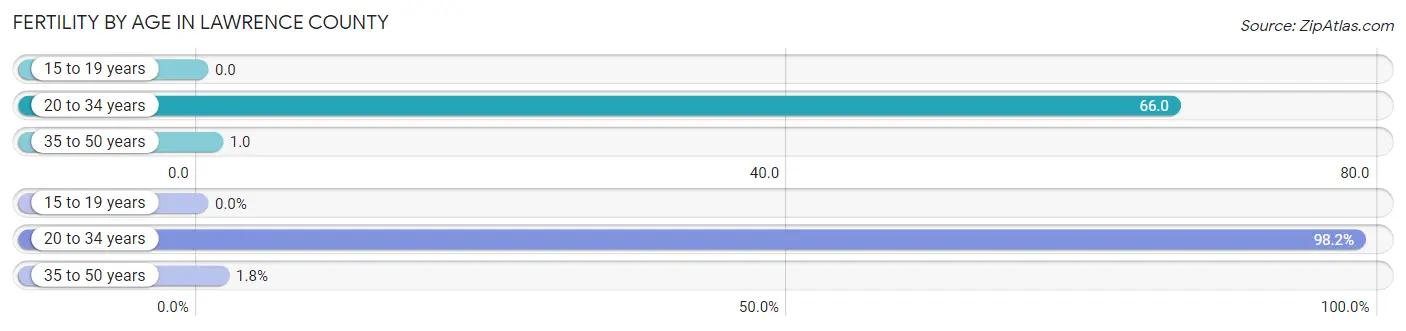
Fertility by Age in Lawrence County
Average fertility rate in Lawrence County is 29.0 births per 1,000 women. Women in the age bracket of 20 to 34 years have the highest fertility rate with 66.0 births per 1,000 women. Women in the age bracket of 20 to 34 years acount for 98.2% of all women with births.
| Age Bracket | Women with Births | Births / 1,000 Women |
| 15 to 19 years | 0 (0.0%) | 0.0 |
| 20 to 34 years | 165 (98.2%) | 66.0 |
| 35 to 50 years | 3 (1.8%) | 1.0 |
| Total | 168 (100.0%) | 29.0 |
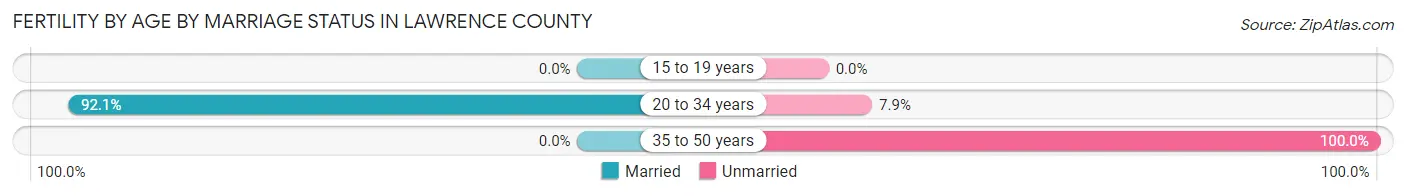
Fertility by Age by Marriage Status in Lawrence County
90.5% of women with births (168) in Lawrence County are married. The highest percentage of unmarried women with births falls into 35 to 50 years age bracket with 100.0% of them unmarried at the time of birth, while the lowest percentage of unmarried women with births belong to 20 to 34 years age bracket with 7.9% of them unmarried.
| Age Bracket | Married | Unmarried |
| 15 to 19 years | 0 (0.0%) | 0 (0.0%) |
| 20 to 34 years | 152 (92.1%) | 13 (7.9%) |
| 35 to 50 years | 0 (0.0%) | 3 (100.0%) |
| Total | 152 (90.5%) | 16 (9.5%) |
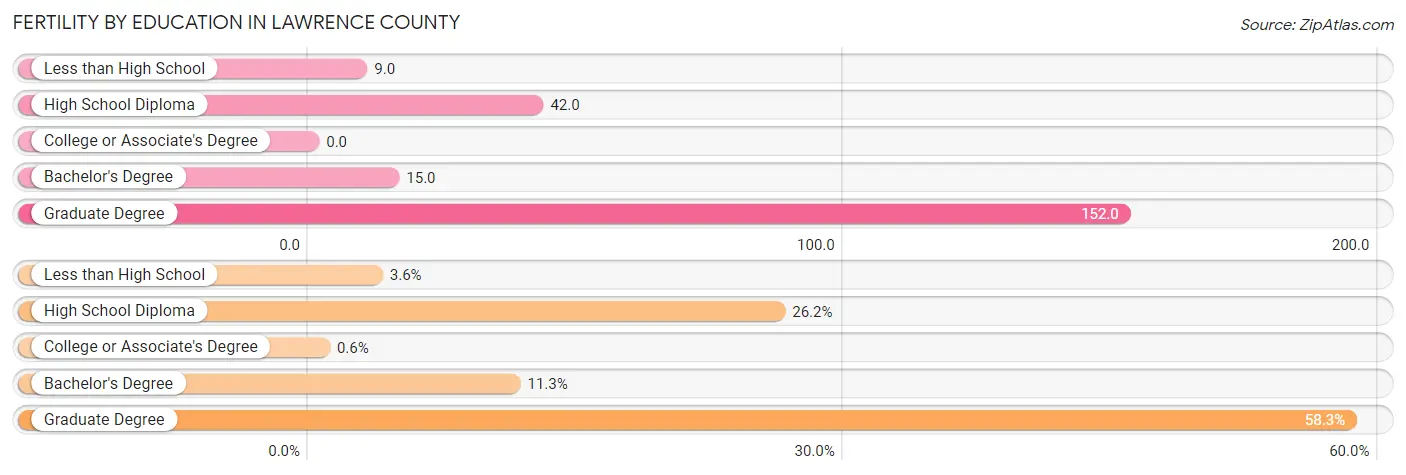
Fertility by Education in Lawrence County
| Educational Attainment | Women with Births | Births / 1,000 Women |
| Less than High School | 6 (3.6%) | 9.0 |
| High School Diploma | 44 (26.2%) | 42.0 |
| College or Associate's Degree | 1 (0.6%) | 0.0 |
| Bachelor's Degree | 19 (11.3%) | 15.0 |
| Graduate Degree | 98 (58.3%) | 152.0 |
| Total | 168 (100.0%) | 29.0 |
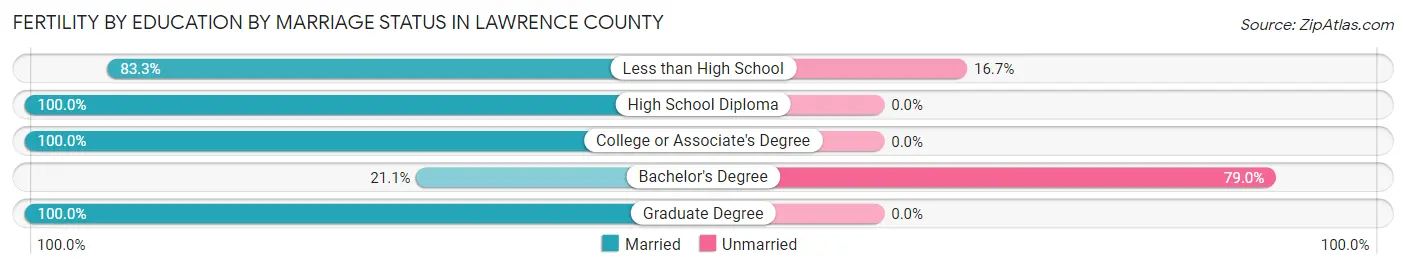
Fertility by Education by Marriage Status in Lawrence County
9.5% of women with births in Lawrence County are unmarried. Women with the educational attainment of high school diploma are most likely to be married with 100.0% of them married at childbirth, while women with the educational attainment of bachelor's degree are least likely to be married with 78.9% of them unmarried at childbirth.
| Educational Attainment | Married | Unmarried |
| Less than High School | 5 (83.3%) | 1 (16.7%) |
| High School Diploma | 44 (100.0%) | 0 (0.0%) |
| College or Associate's Degree | 1 (100.0%) | 0 (0.0%) |
| Bachelor's Degree | 4 (21.0%) | 15 (78.9%) |
| Graduate Degree | 98 (100.0%) | 0 (0.0%) |
| Total | 152 (90.5%) | 16 (9.5%) |
Income in Lawrence County
Income Overview in Lawrence County
Per Capita Income in Lawrence County is $41,086, while median incomes of families and households are $85,844 and $62,977 respectively.
| Characteristic | Number | Measure |
| Per Capita Income | 26,047 | $41,086 |
| Median Family Income | 6,280 | $85,844 |
| Mean Family Income | 6,280 | $114,865 |
| Median Household Income | 11,392 | $62,977 |
| Mean Household Income | 11,392 | $87,697 |
| Income Deficit | 6,280 | $8,420 |
| Wage / Income Gap (%) | 26,047 | 35.06% |
| Wage / Income Gap ($) | 26,047 | 64.94¢ per $1 |
| Gini / Inequality Index | 26,047 | 0.47 |
Earnings by Sex in Lawrence County
Average Earnings in Lawrence County are $32,696, $40,564 for men and $26,343 for women, a difference of 35.1%.
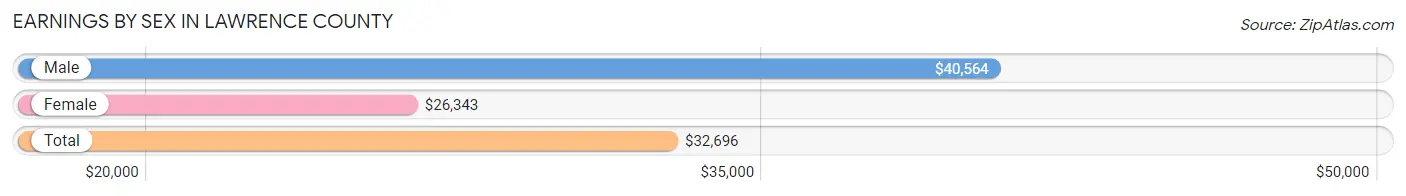
| Sex | Number | Average Earnings |
| Male | 8,079 (50.2%) | $40,564 |
| Female | 8,018 (49.8%) | $26,343 |
| Total | 16,097 (100.0%) | $32,696 |
Earnings by Sex by Income Bracket in Lawrence County
The most common earnings brackets in Lawrence County are $100,000+ for men (907 | 11.2%) and $25,000 to $29,999 for women (728 | 9.1%).
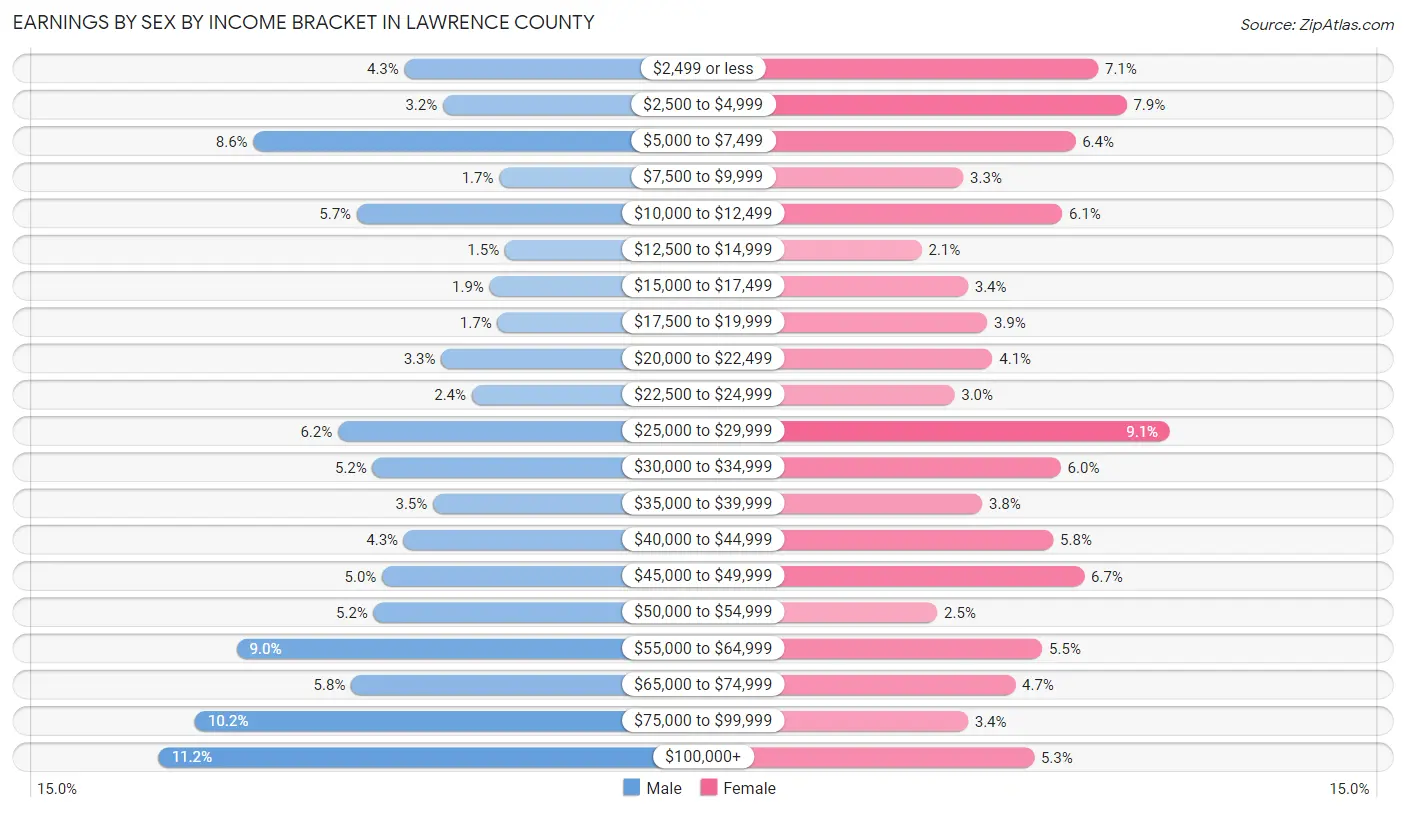
| Income | Male | Female |
| $2,499 or less | 349 (4.3%) | 566 (7.1%) |
| $2,500 to $4,999 | 262 (3.2%) | 630 (7.9%) |
| $5,000 to $7,499 | 692 (8.6%) | 515 (6.4%) |
| $7,500 to $9,999 | 134 (1.7%) | 262 (3.3%) |
| $10,000 to $12,499 | 457 (5.7%) | 485 (6.0%) |
| $12,500 to $14,999 | 121 (1.5%) | 168 (2.1%) |
| $15,000 to $17,499 | 156 (1.9%) | 273 (3.4%) |
| $17,500 to $19,999 | 138 (1.7%) | 316 (3.9%) |
| $20,000 to $22,499 | 266 (3.3%) | 328 (4.1%) |
| $22,500 to $24,999 | 196 (2.4%) | 242 (3.0%) |
| $25,000 to $29,999 | 500 (6.2%) | 728 (9.1%) |
| $30,000 to $34,999 | 422 (5.2%) | 482 (6.0%) |
| $35,000 to $39,999 | 284 (3.5%) | 305 (3.8%) |
| $40,000 to $44,999 | 351 (4.3%) | 465 (5.8%) |
| $45,000 to $49,999 | 400 (5.0%) | 535 (6.7%) |
| $50,000 to $54,999 | 419 (5.2%) | 204 (2.5%) |
| $55,000 to $64,999 | 730 (9.0%) | 440 (5.5%) |
| $65,000 to $74,999 | 470 (5.8%) | 379 (4.7%) |
| $75,000 to $99,999 | 825 (10.2%) | 273 (3.4%) |
| $100,000+ | 907 (11.2%) | 422 (5.3%) |
| Total | 8,079 (100.0%) | 8,018 (100.0%) |
Earnings by Sex by Educational Attainment in Lawrence County
Average earnings in Lawrence County are $50,689 for men and $34,571 for women, a difference of 31.8%. Men with an educational attainment of graduate degree enjoy the highest average annual earnings of $71,835, while those with less than high school education earn the least with $39,500. Women with an educational attainment of graduate degree earn the most with the average annual earnings of $55,052, while those with less than high school education have the smallest earnings of $21,000.
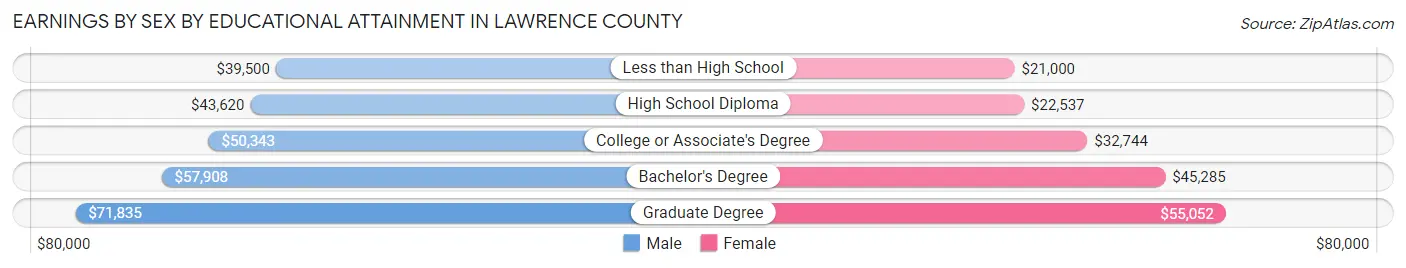
| Educational Attainment | Male Income | Female Income |
| Less than High School | $39,500 | $21,000 |
| High School Diploma | $43,620 | $22,537 |
| College or Associate's Degree | $50,343 | $32,744 |
| Bachelor's Degree | $57,908 | $45,285 |
| Graduate Degree | $71,835 | $55,052 |
| Total | $50,689 | $34,571 |
Family Income in Lawrence County
Family Income Brackets in Lawrence County
According to the Lawrence County family income data, there are 1,325 families falling into the $100,000 to $149,999 income range, which is the most common income bracket and makes up 21.1% of all families. Conversely, the $10,000 to $14,999 income bracket is the least frequent group with only 69 families (1.1%) belonging to this category.
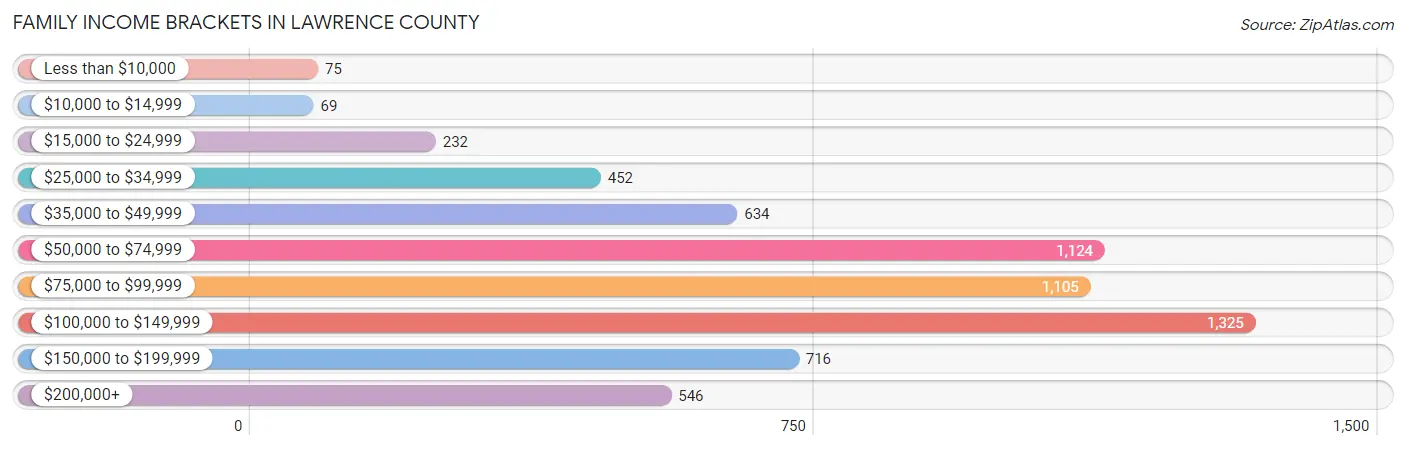
| Income Bracket | # Families | % Families |
| Less than $10,000 | 75 | 1.2% |
| $10,000 to $14,999 | 69 | 1.1% |
| $15,000 to $24,999 | 232 | 3.7% |
| $25,000 to $34,999 | 452 | 7.2% |
| $35,000 to $49,999 | 634 | 10.1% |
| $50,000 to $74,999 | 1,124 | 17.9% |
| $75,000 to $99,999 | 1,105 | 17.6% |
| $100,000 to $149,999 | 1,325 | 21.1% |
| $150,000 to $199,999 | 716 | 11.4% |
| $200,000+ | 546 | 8.7% |
Family Income by Famaliy Size in Lawrence County
5-person families (454 | 7.2%) account for the highest median family income in Lawrence County with $144,559 per family, while 2-person families (3,774 | 60.1%) have the highest median income of $36,416 per family member.
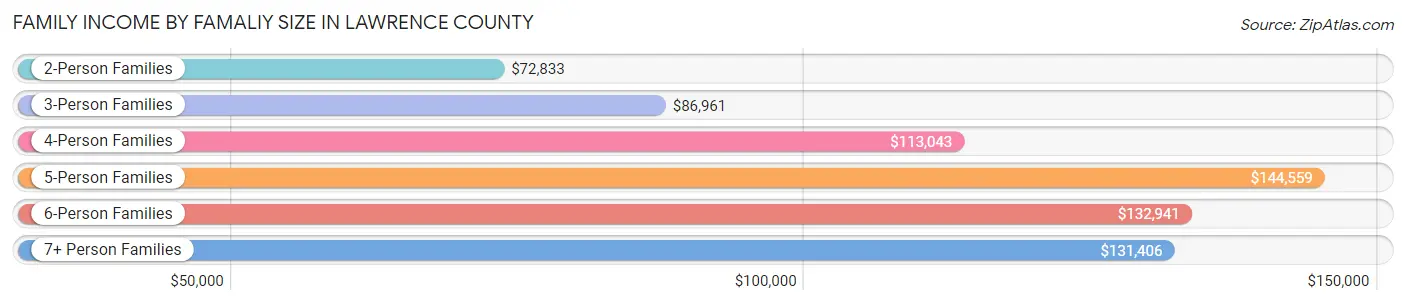
| Income Bracket | # Families | Median Income |
| 2-Person Families | 3,774 (60.1%) | $72,833 |
| 3-Person Families | 1,168 (18.6%) | $86,961 |
| 4-Person Families | 771 (12.3%) | $113,043 |
| 5-Person Families | 454 (7.2%) | $144,559 |
| 6-Person Families | 48 (0.8%) | $132,941 |
| 7+ Person Families | 65 (1.0%) | $131,406 |
| Total | 6,280 (100.0%) | $85,844 |
Family Income by Number of Earners in Lawrence County
The median family income in Lawrence County is $85,844, with families comprising 3+ earners (827) having the highest median family income of $131,406, while families with 1 earner (1,605) have the lowest median family income of $58,547, accounting for 13.2% and 25.6% of families, respectively.
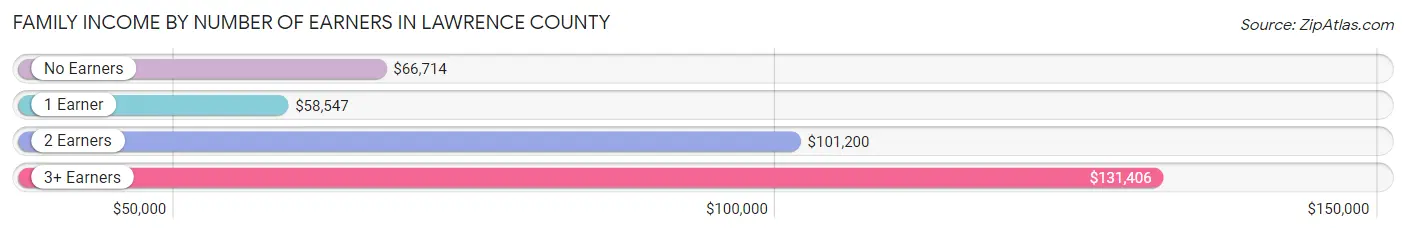
| Number of Earners | # Families | Median Income |
| No Earners | 1,096 (17.4%) | $66,714 |
| 1 Earner | 1,605 (25.6%) | $58,547 |
| 2 Earners | 2,752 (43.8%) | $101,200 |
| 3+ Earners | 827 (13.2%) | $131,406 |
| Total | 6,280 (100.0%) | $85,844 |
Household Income in Lawrence County
Household Income Brackets in Lawrence County
With 2,130 households falling in the category, the $50,000 to $74,999 income range is the most frequent in Lawrence County, accounting for 18.7% of all households. In contrast, only 376 households (3.3%) fall into the $10,000 to $14,999 income bracket, making it the least populous group.
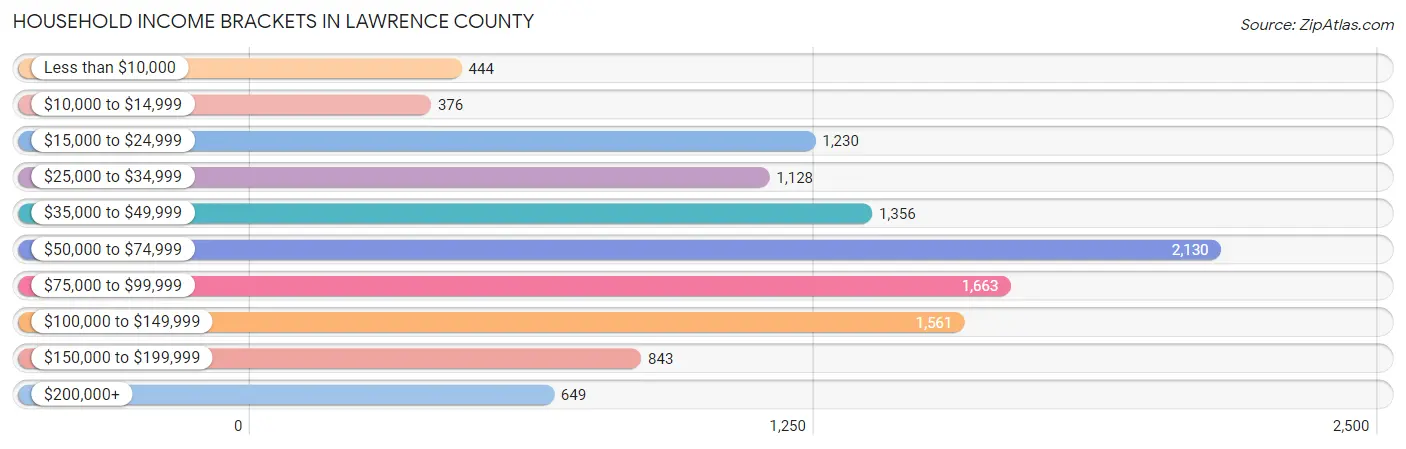
| Income Bracket | # Households | % Households |
| Less than $10,000 | 444 | 3.9% |
| $10,000 to $14,999 | 376 | 3.3% |
| $15,000 to $24,999 | 1,230 | 10.8% |
| $25,000 to $34,999 | 1,128 | 9.9% |
| $35,000 to $49,999 | 1,356 | 11.9% |
| $50,000 to $74,999 | 2,130 | 18.7% |
| $75,000 to $99,999 | 1,663 | 14.6% |
| $100,000 to $149,999 | 1,561 | 13.7% |
| $150,000 to $199,999 | 843 | 7.4% |
| $200,000+ | 649 | 5.7% |
Household Income by Householder Age in Lawrence County
The median household income in Lawrence County is $62,977, with the highest median household income of $76,625 found in the 45 to 64 years age bracket for the primary householder. A total of 3,705 households (32.5%) fall into this category. Meanwhile, the 15 to 24 years age bracket for the primary householder has the lowest median household income of $21,531, with 819 households (7.2%) in this group.
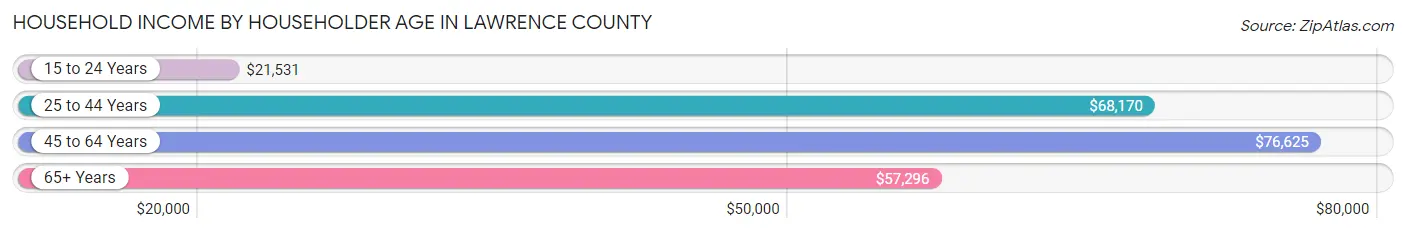
| Income Bracket | # Households | Median Income |
| 15 to 24 Years | 819 (7.2%) | $21,531 |
| 25 to 44 Years | 2,938 (25.8%) | $68,170 |
| 45 to 64 Years | 3,705 (32.5%) | $76,625 |
| 65+ Years | 3,930 (34.5%) | $57,296 |
| Total | 11,392 (100.0%) | $62,977 |
Poverty in Lawrence County
Income Below Poverty by Sex and Age in Lawrence County
With 9.6% poverty level for males and 12.5% for females among the residents of Lawrence County, 18 to 24 year old males and 18 to 24 year old females are the most vulnerable to poverty, with 345 males (27.1%) and 536 females (37.1%) in their respective age groups living below the poverty level.
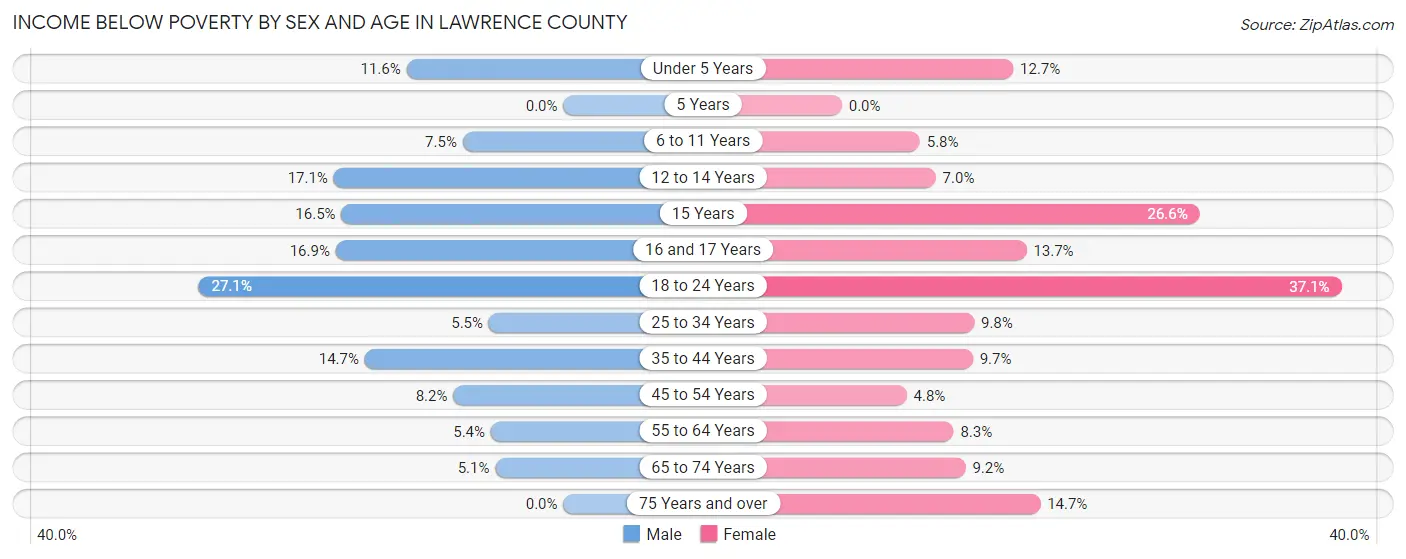
| Age Bracket | Male | Female |
| Under 5 Years | 54 (11.6%) | 64 (12.7%) |
| 5 Years | 0 (0.0%) | 0 (0.0%) |
| 6 to 11 Years | 59 (7.5%) | 34 (5.8%) |
| 12 to 14 Years | 60 (17.1%) | 44 (7.0%) |
| 15 Years | 15 (16.5%) | 34 (26.6%) |
| 16 and 17 Years | 61 (16.9%) | 41 (13.7%) |
| 18 to 24 Years | 345 (27.1%) | 536 (37.1%) |
| 25 to 34 Years | 81 (5.5%) | 130 (9.8%) |
| 35 to 44 Years | 215 (14.7%) | 136 (9.7%) |
| 45 to 54 Years | 111 (8.2%) | 65 (4.8%) |
| 55 to 64 Years | 103 (5.4%) | 161 (8.3%) |
| 65 to 74 Years | 97 (5.1%) | 168 (9.2%) |
| 75 Years and over | 0 (0.0%) | 180 (14.7%) |
| Total | 1,201 (9.6%) | 1,593 (12.5%) |
Income Above Poverty by Sex and Age in Lawrence County
According to the poverty statistics in Lawrence County, males aged 5 years and females aged 5 years are the age groups that are most secure financially, with 100.0% of males and 100.0% of females in these age groups living above the poverty line.
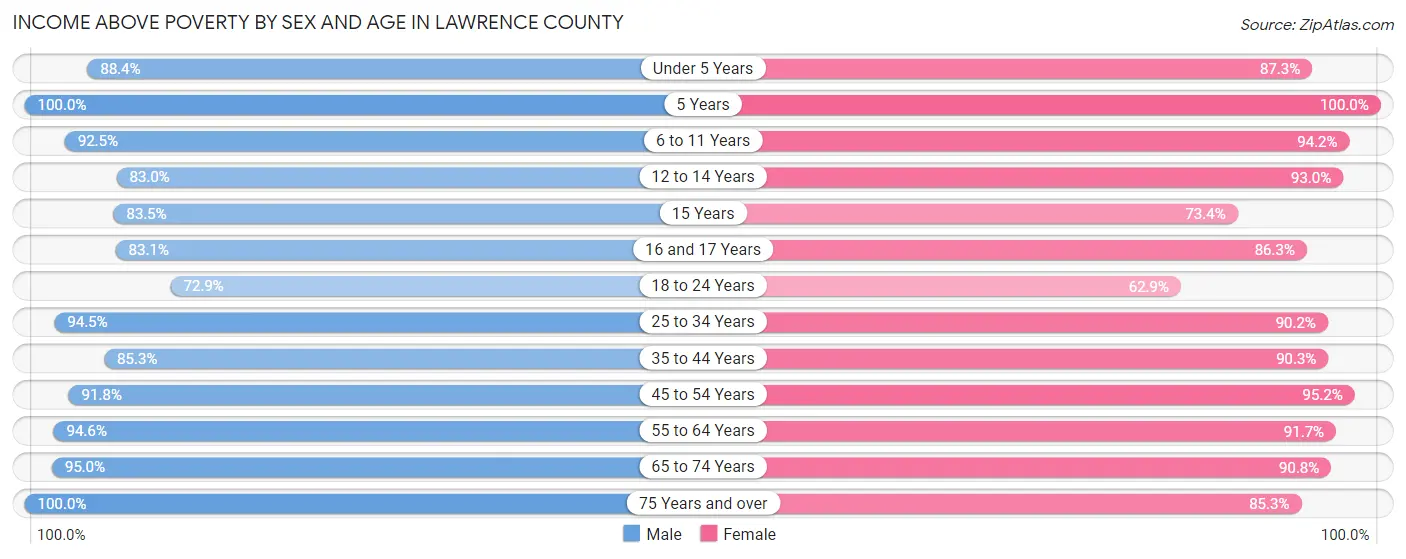
| Age Bracket | Male | Female |
| Under 5 Years | 410 (88.4%) | 439 (87.3%) |
| 5 Years | 74 (100.0%) | 70 (100.0%) |
| 6 to 11 Years | 731 (92.5%) | 553 (94.2%) |
| 12 to 14 Years | 292 (83.0%) | 587 (93.0%) |
| 15 Years | 76 (83.5%) | 94 (73.4%) |
| 16 and 17 Years | 300 (83.1%) | 258 (86.3%) |
| 18 to 24 Years | 929 (72.9%) | 909 (62.9%) |
| 25 to 34 Years | 1,384 (94.5%) | 1,194 (90.2%) |
| 35 to 44 Years | 1,244 (85.3%) | 1,263 (90.3%) |
| 45 to 54 Years | 1,247 (91.8%) | 1,286 (95.2%) |
| 55 to 64 Years | 1,813 (94.6%) | 1,781 (91.7%) |
| 65 to 74 Years | 1,824 (95.0%) | 1,663 (90.8%) |
| 75 Years and over | 985 (100.0%) | 1,042 (85.3%) |
| Total | 11,309 (90.4%) | 11,139 (87.5%) |
Income Below Poverty Among Married-Couple Families in Lawrence County
The poverty statistics for married-couple families in Lawrence County show that 3.3% or 172 of the total 5,146 families live below the poverty line. Families with 1 or 2 children have the highest poverty rate of 7.8%, comprising of 86 families. On the other hand, families with 5 or more children have the lowest poverty rate of 0.0%, which includes 0 families.
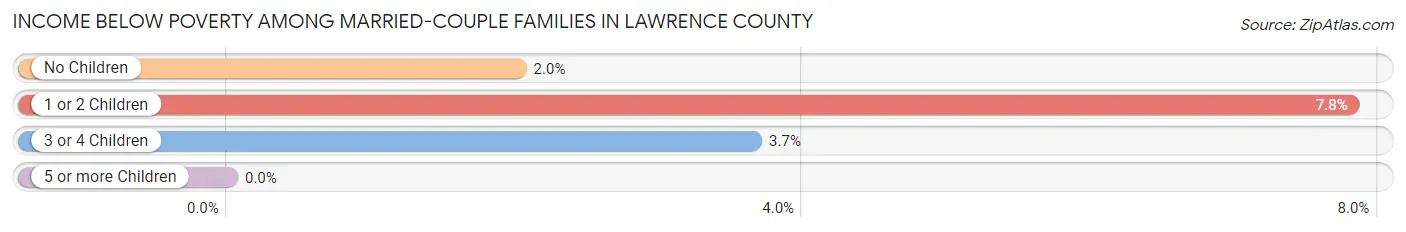
| Children | Above Poverty | Below Poverty |
| No Children | 3,606 (98.0%) | 74 (2.0%) |
| 1 or 2 Children | 1,015 (92.2%) | 86 (7.8%) |
| 3 or 4 Children | 317 (96.4%) | 12 (3.6%) |
| 5 or more Children | 36 (100.0%) | 0 (0.0%) |
| Total | 4,974 (96.7%) | 172 (3.3%) |
Income Below Poverty Among Single-Parent Households in Lawrence County
According to the poverty data in Lawrence County, 10.4% or 39 single-father households and 15.0% or 114 single-mother households are living below the poverty line. Among single-father households, those with 1 or 2 children have the highest poverty rate, with 39 households (17.6%) experiencing poverty. Likewise, among single-mother households, those with 3 or 4 children have the highest poverty rate, with 13 households (52.0%) falling below the poverty line.
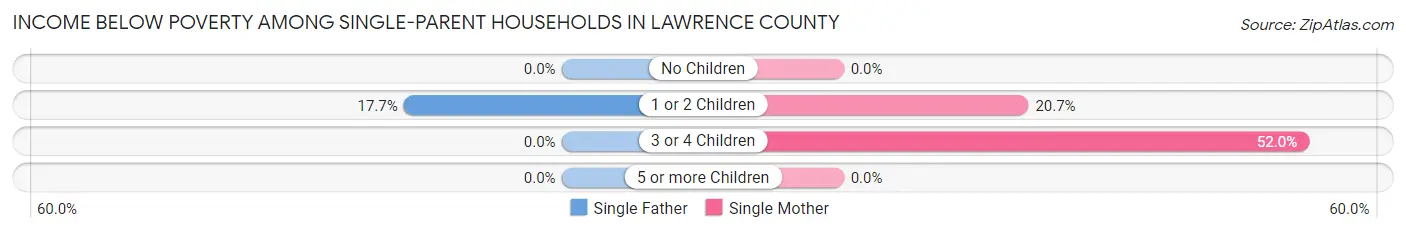
| Children | Single Father | Single Mother |
| No Children | 0 (0.0%) | 0 (0.0%) |
| 1 or 2 Children | 39 (17.6%) | 101 (20.6%) |
| 3 or 4 Children | 0 (0.0%) | 13 (52.0%) |
| 5 or more Children | 0 (0.0%) | 0 (0.0%) |
| Total | 39 (10.4%) | 114 (15.0%) |
Income Below Poverty Among Married-Couple vs Single-Parent Households in Lawrence County
The poverty data for Lawrence County shows that 172 of the married-couple family households (3.3%) and 153 of the single-parent households (13.5%) are living below the poverty level. Within the married-couple family households, those with 1 or 2 children have the highest poverty rate, with 86 households (7.8%) falling below the poverty line. Among the single-parent households, those with 3 or 4 children have the highest poverty rate, with 13 household (52.0%) living below poverty.
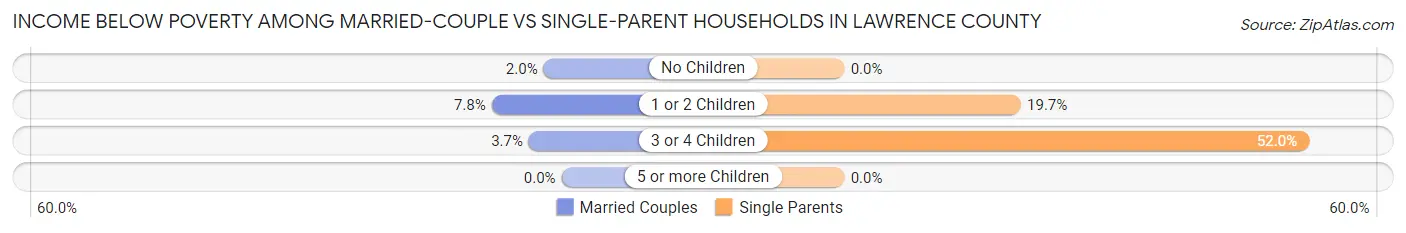
| Children | Married-Couple Families | Single-Parent Households |
| No Children | 74 (2.0%) | 0 (0.0%) |
| 1 or 2 Children | 86 (7.8%) | 140 (19.7%) |
| 3 or 4 Children | 12 (3.6%) | 13 (52.0%) |
| 5 or more Children | 0 (0.0%) | 0 (0.0%) |
| Total | 172 (3.3%) | 153 (13.5%) |
Employment Characteristics in Lawrence County
Employment by Class of Employer in Lawrence County
Among the 14,124 employed individuals in Lawrence County, private company employees (9,084 | 64.3%), not-for-profit organizations (1,175 | 8.3%), and self-employed (incorporated) (904 | 6.4%) make up the most common classes of employment.
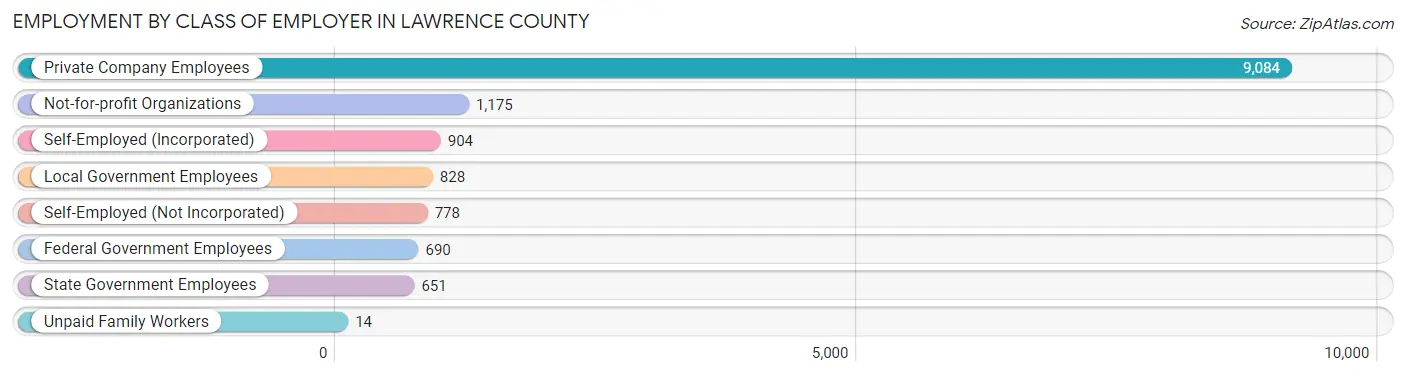
| Employer Class | # Employees | % Employees |
| Private Company Employees | 9,084 | 64.3% |
| Self-Employed (Incorporated) | 904 | 6.4% |
| Self-Employed (Not Incorporated) | 778 | 5.5% |
| Not-for-profit Organizations | 1,175 | 8.3% |
| Local Government Employees | 828 | 5.9% |
| State Government Employees | 651 | 4.6% |
| Federal Government Employees | 690 | 4.9% |
| Unpaid Family Workers | 14 | 0.1% |
| Total | 14,124 | 100.0% |
Employment Status by Age in Lawrence County
According to the labor force statistics for Lawrence County, out of the total population over 16 years of age (22,310), 65.9% or 14,702 individuals are in the labor force, with 2.5% or 368 of them unemployed. The age group with the highest labor force participation rate is 30 to 34 years, with 92.4% or 1,432 individuals in the labor force. Within the labor force, the 20 to 24 years age range has the highest percentage of unemployed individuals, with 9.8% or 168 of them being unemployed.
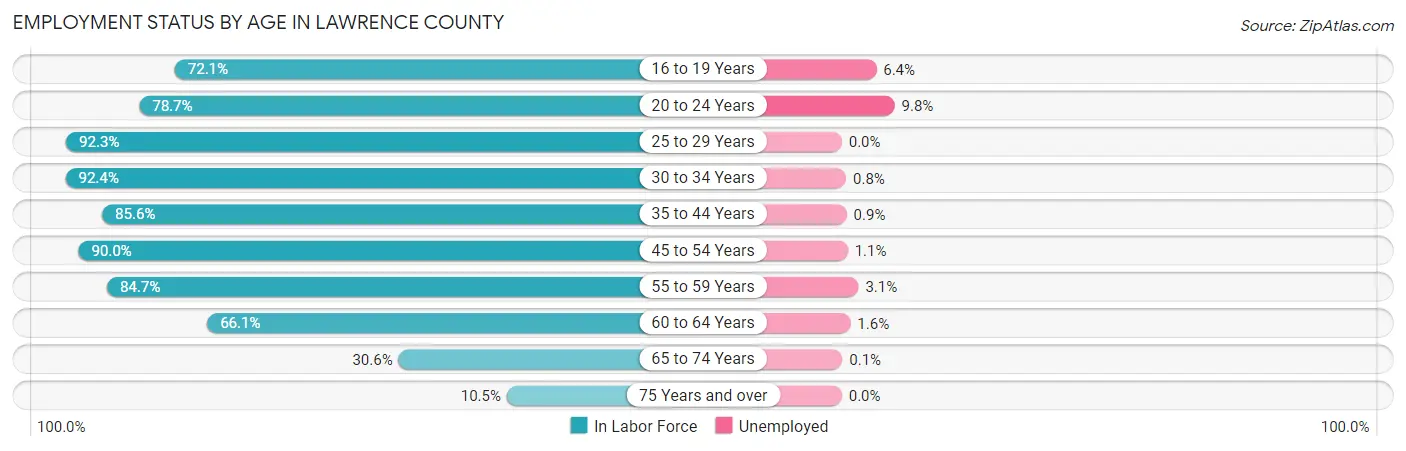
| Age Bracket | In Labor Force | Unemployed |
| 16 to 19 Years | 1,281 (72.1%) | 82 (6.4%) |
| 20 to 24 Years | 1,714 (78.7%) | 168 (9.8%) |
| 25 to 29 Years | 1,157 (92.3%) | 0 (0.0%) |
| 30 to 34 Years | 1,432 (92.4%) | 11 (0.8%) |
| 35 to 44 Years | 2,464 (85.6%) | 22 (0.9%) |
| 45 to 54 Years | 2,445 (90.0%) | 27 (1.1%) |
| 55 to 59 Years | 1,099 (84.7%) | 34 (3.1%) |
| 60 to 64 Years | 1,700 (66.1%) | 27 (1.6%) |
| 65 to 74 Years | 1,157 (30.6%) | 1 (0.1%) |
| 75 Years and over | 242 (10.5%) | 0 (0.0%) |
| Total | 14,702 (65.9%) | 368 (2.5%) |
Employment Status by Educational Attainment in Lawrence County
According to labor force statistics for Lawrence County, 83.9% of individuals (10,293) out of the total population between 25 and 64 years of age (12,268) are in the labor force, with 1.2% or 124 of them being unemployed. The group with the highest labor force participation rate are those with the educational attainment of bachelor's degree or higher, with 92.0% or 4,200 individuals in the labor force. Within the labor force, individuals with less than high school education have the highest percentage of unemployment, with 4.1% or 15 of them being unemployed.
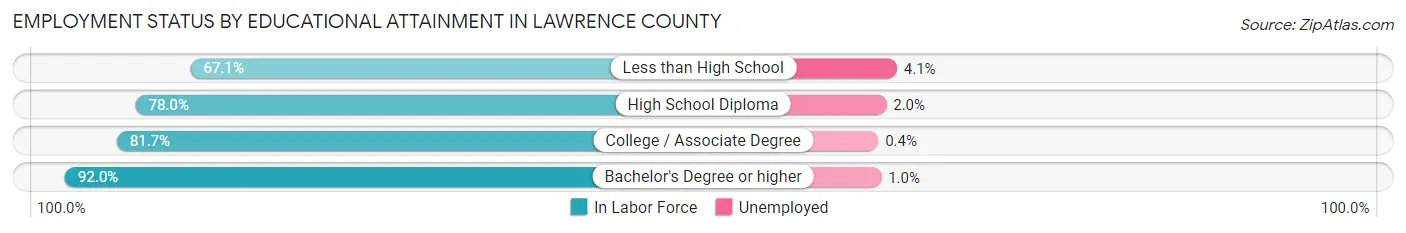
| Educational Attainment | In Labor Force | Unemployed |
| Less than High School | 363 (67.1%) | 22 (4.1%) |
| High School Diploma | 2,493 (78.0%) | 64 (2.0%) |
| College / Associate Degree | 3,240 (81.7%) | 16 (0.4%) |
| Bachelor's Degree or higher | 4,200 (92.0%) | 46 (1.0%) |
| Total | 10,293 (83.9%) | 147 (1.2%) |
Employment Occupations by Sex in Lawrence County
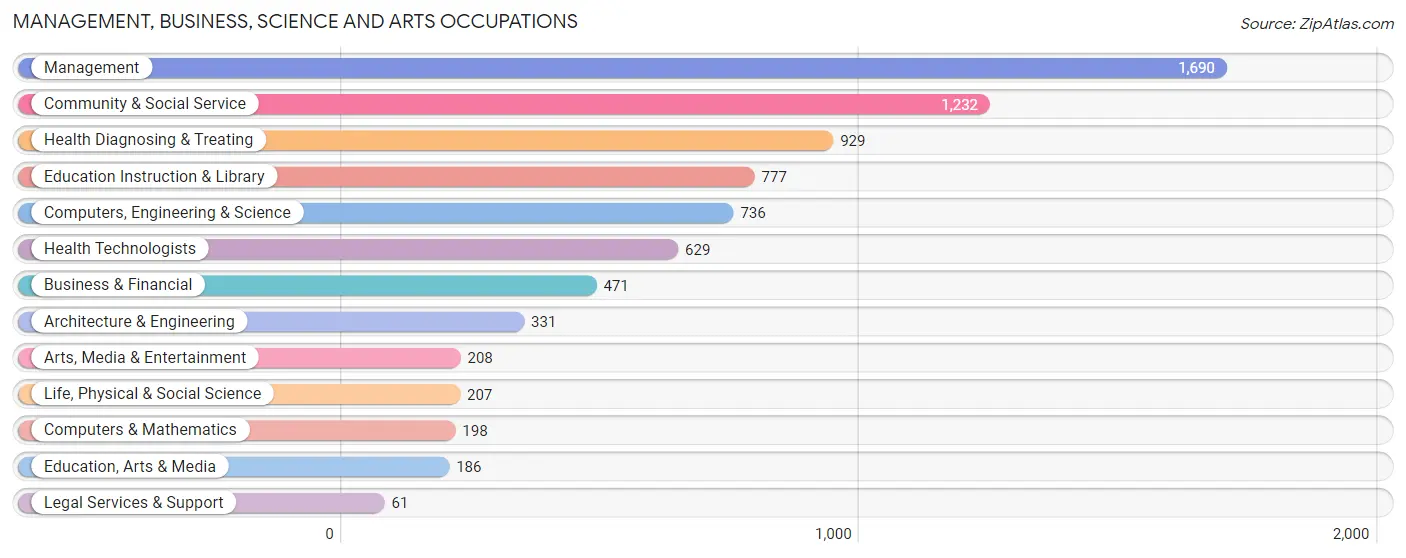
Management, Business, Science and Arts Occupations
The most common Management, Business, Science and Arts occupations in Lawrence County are Management (1,690 | 11.8%), Community & Social Service (1,232 | 8.6%), Health Diagnosing & Treating (929 | 6.5%), Education Instruction & Library (777 | 5.4%), and Computers, Engineering & Science (736 | 5.1%).
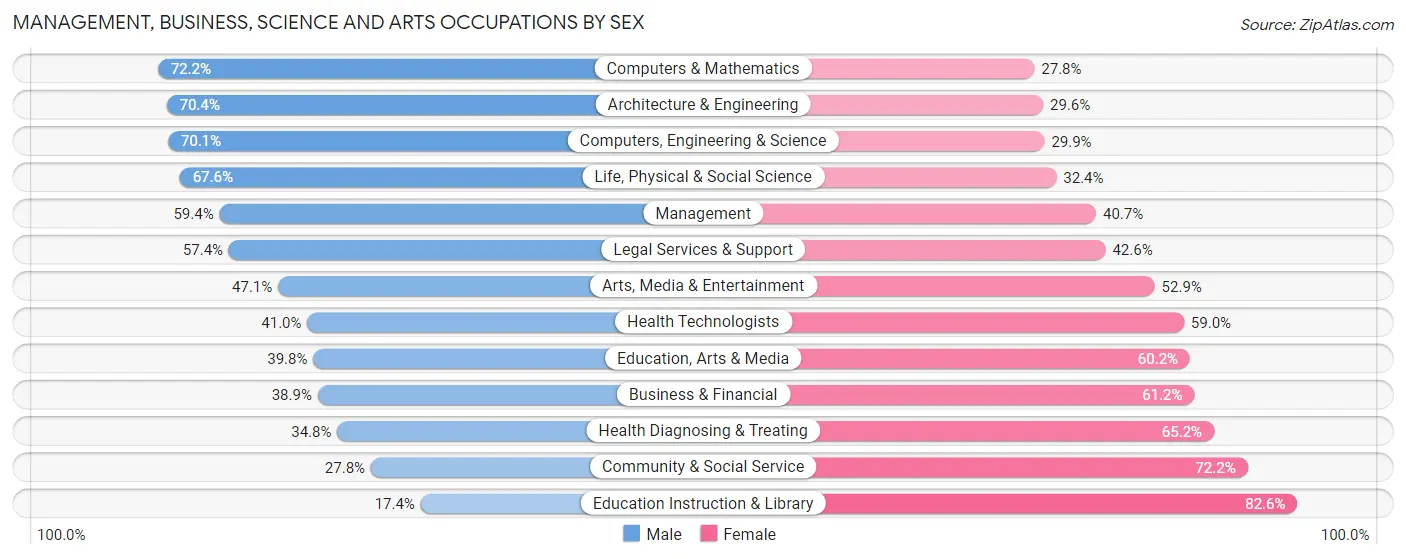
Management, Business, Science and Arts Occupations by Sex
Within the Management, Business, Science and Arts occupations in Lawrence County, the most male-oriented occupations are Computers & Mathematics (72.2%), Architecture & Engineering (70.4%), and Computers, Engineering & Science (70.1%), while the most female-oriented occupations are Education Instruction & Library (82.6%), Community & Social Service (72.2%), and Health Diagnosing & Treating (65.2%).
| Occupation | Male | Female |
| Management | 1,003 (59.4%) | 687 (40.6%) |
| Business & Financial | 183 (38.9%) | 288 (61.2%) |
| Computers, Engineering & Science | 516 (70.1%) | 220 (29.9%) |
| Computers & Mathematics | 143 (72.2%) | 55 (27.8%) |
| Architecture & Engineering | 233 (70.4%) | 98 (29.6%) |
| Life, Physical & Social Science | 140 (67.6%) | 67 (32.4%) |
| Community & Social Service | 342 (27.8%) | 890 (72.2%) |
| Education, Arts & Media | 74 (39.8%) | 112 (60.2%) |
| Legal Services & Support | 35 (57.4%) | 26 (42.6%) |
| Education Instruction & Library | 135 (17.4%) | 642 (82.6%) |
| Arts, Media & Entertainment | 98 (47.1%) | 110 (52.9%) |
| Health Diagnosing & Treating | 323 (34.8%) | 606 (65.2%) |
| Health Technologists | 258 (41.0%) | 371 (59.0%) |
| Total (Category) | 2,367 (46.8%) | 2,691 (53.2%) |
| Total (Overall) | 7,305 (51.1%) | 7,001 (48.9%) |
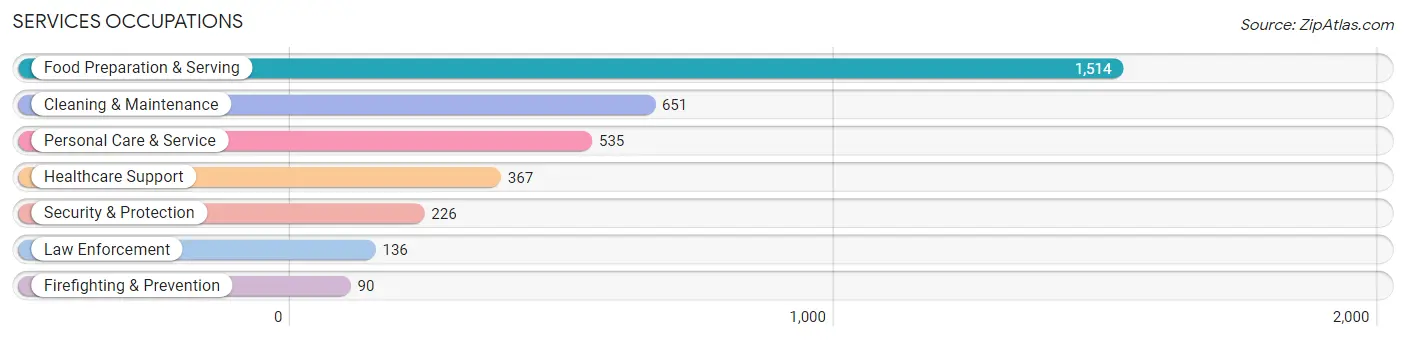
Services Occupations
The most common Services occupations in Lawrence County are Food Preparation & Serving (1,514 | 10.6%), Cleaning & Maintenance (651 | 4.5%), Personal Care & Service (535 | 3.7%), Healthcare Support (367 | 2.6%), and Security & Protection (226 | 1.6%).
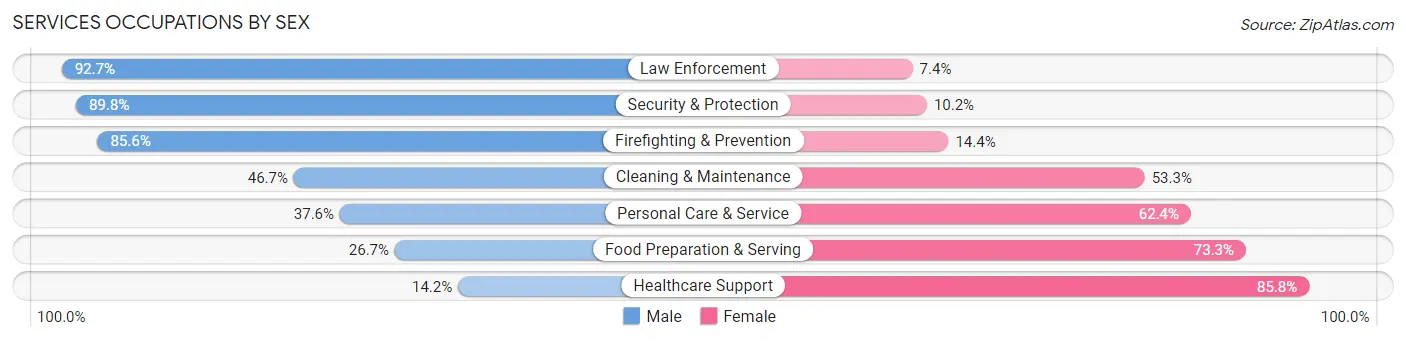
Services Occupations by Sex
Within the Services occupations in Lawrence County, the most male-oriented occupations are Law Enforcement (92.6%), Security & Protection (89.8%), and Firefighting & Prevention (85.6%), while the most female-oriented occupations are Healthcare Support (85.8%), Food Preparation & Serving (73.3%), and Personal Care & Service (62.4%).
| Occupation | Male | Female |
| Healthcare Support | 52 (14.2%) | 315 (85.8%) |
| Security & Protection | 203 (89.8%) | 23 (10.2%) |
| Firefighting & Prevention | 77 (85.6%) | 13 (14.4%) |
| Law Enforcement | 126 (92.6%) | 10 (7.3%) |
| Food Preparation & Serving | 404 (26.7%) | 1,110 (73.3%) |
| Cleaning & Maintenance | 304 (46.7%) | 347 (53.3%) |
| Personal Care & Service | 201 (37.6%) | 334 (62.4%) |
| Total (Category) | 1,164 (35.3%) | 2,129 (64.6%) |
| Total (Overall) | 7,305 (51.1%) | 7,001 (48.9%) |
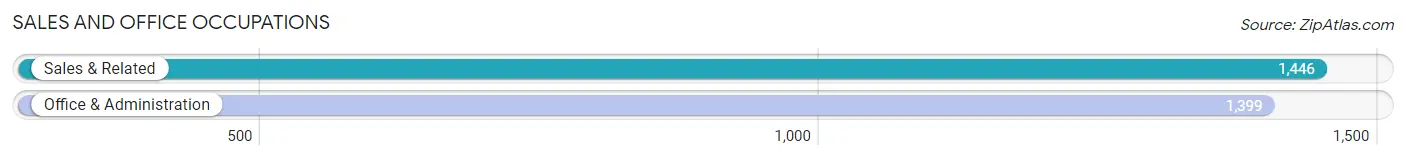
Sales and Office Occupations
The most common Sales and Office occupations in Lawrence County are Sales & Related (1,446 | 10.1%), and Office & Administration (1,399 | 9.8%).
Sales and Office Occupations by Sex
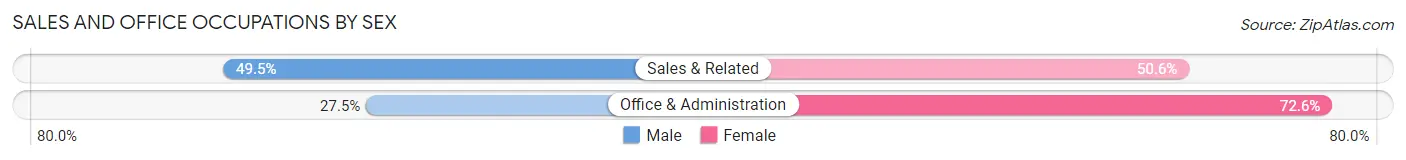
| Occupation | Male | Female |
| Sales & Related | 715 (49.4%) | 731 (50.5%) |
| Office & Administration | 384 (27.5%) | 1,015 (72.6%) |
| Total (Category) | 1,099 (38.6%) | 1,746 (61.4%) |
| Total (Overall) | 7,305 (51.1%) | 7,001 (48.9%) |
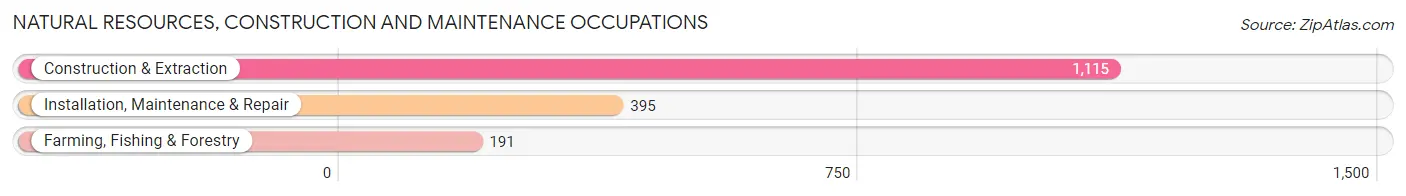
Natural Resources, Construction and Maintenance Occupations
The most common Natural Resources, Construction and Maintenance occupations in Lawrence County are Construction & Extraction (1,115 | 7.8%), Installation, Maintenance & Repair (395 | 2.8%), and Farming, Fishing & Forestry (191 | 1.3%).
Natural Resources, Construction and Maintenance Occupations by Sex
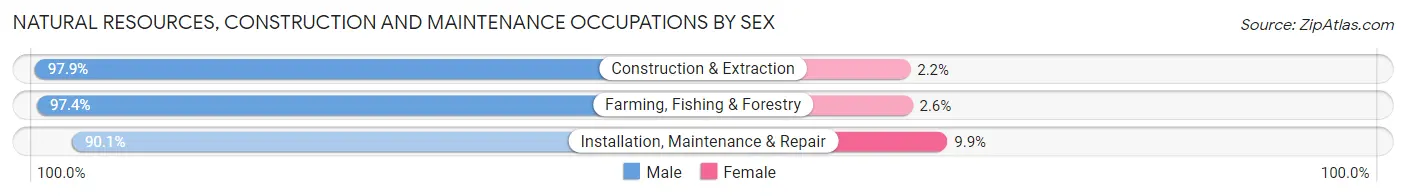
| Occupation | Male | Female |
| Farming, Fishing & Forestry | 186 (97.4%) | 5 (2.6%) |
| Construction & Extraction | 1,091 (97.9%) | 24 (2.1%) |
| Installation, Maintenance & Repair | 356 (90.1%) | 39 (9.9%) |
| Total (Category) | 1,633 (96.0%) | 68 (4.0%) |
| Total (Overall) | 7,305 (51.1%) | 7,001 (48.9%) |
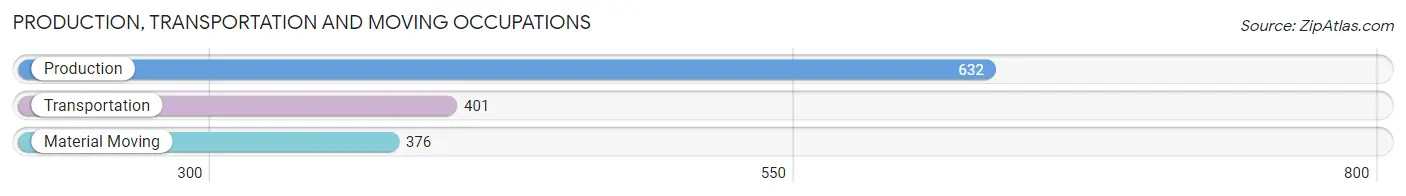
Production, Transportation and Moving Occupations
The most common Production, Transportation and Moving occupations in Lawrence County are Production (632 | 4.4%), Transportation (401 | 2.8%), and Material Moving (376 | 2.6%).
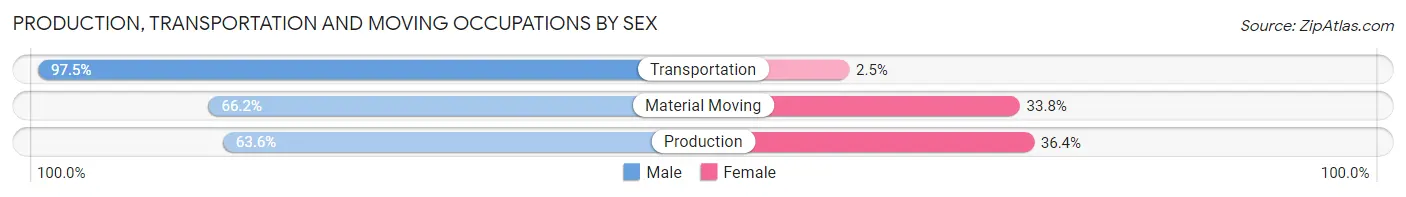
Production, Transportation and Moving Occupations by Sex
| Occupation | Male | Female |
| Production | 402 (63.6%) | 230 (36.4%) |
| Transportation | 391 (97.5%) | 10 (2.5%) |
| Material Moving | 249 (66.2%) | 127 (33.8%) |
| Total (Category) | 1,042 (74.0%) | 367 (26.1%) |
| Total (Overall) | 7,305 (51.1%) | 7,001 (48.9%) |
Employment Industries by Sex in Lawrence County
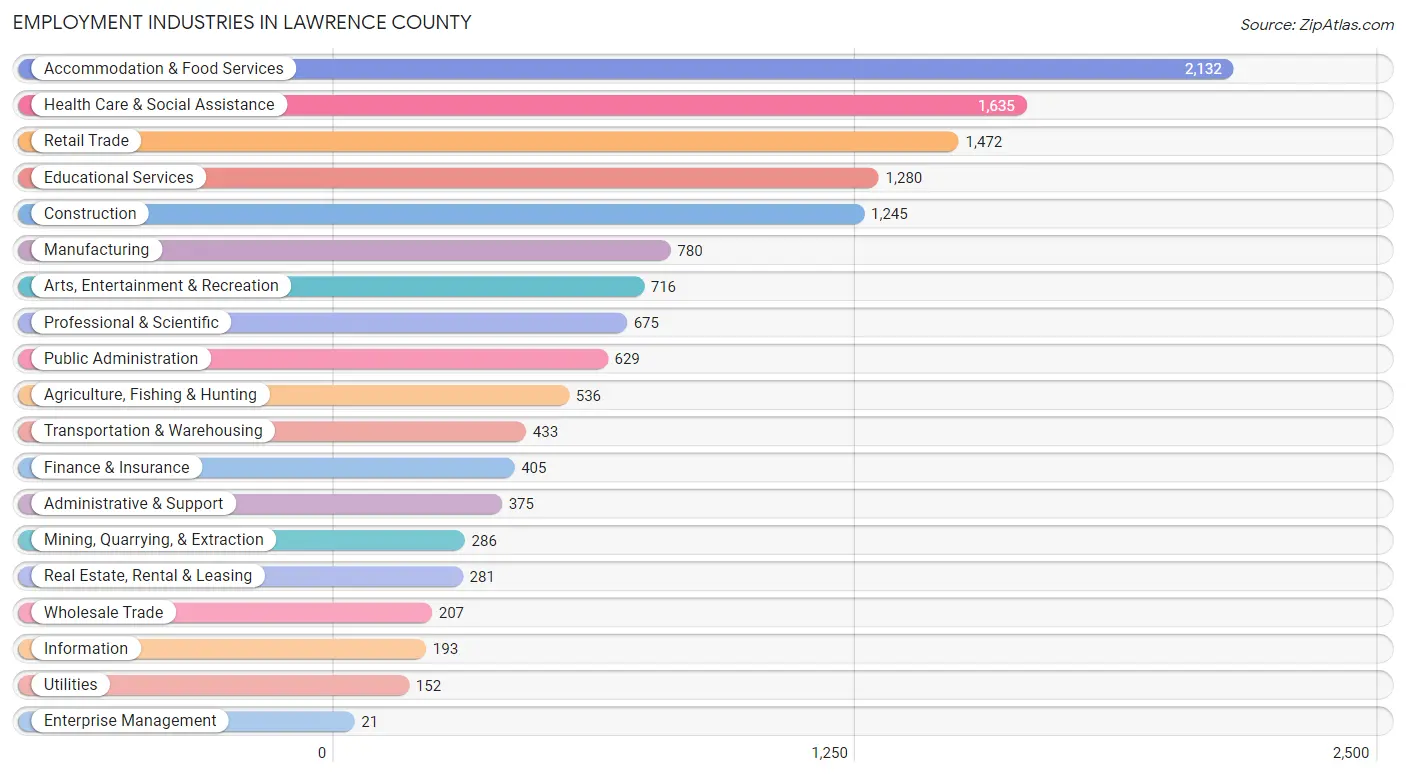
Employment Industries in Lawrence County
The major employment industries in Lawrence County include Accommodation & Food Services (2,132 | 14.9%), Health Care & Social Assistance (1,635 | 11.4%), Retail Trade (1,472 | 10.3%), Educational Services (1,280 | 8.9%), and Construction (1,245 | 8.7%).
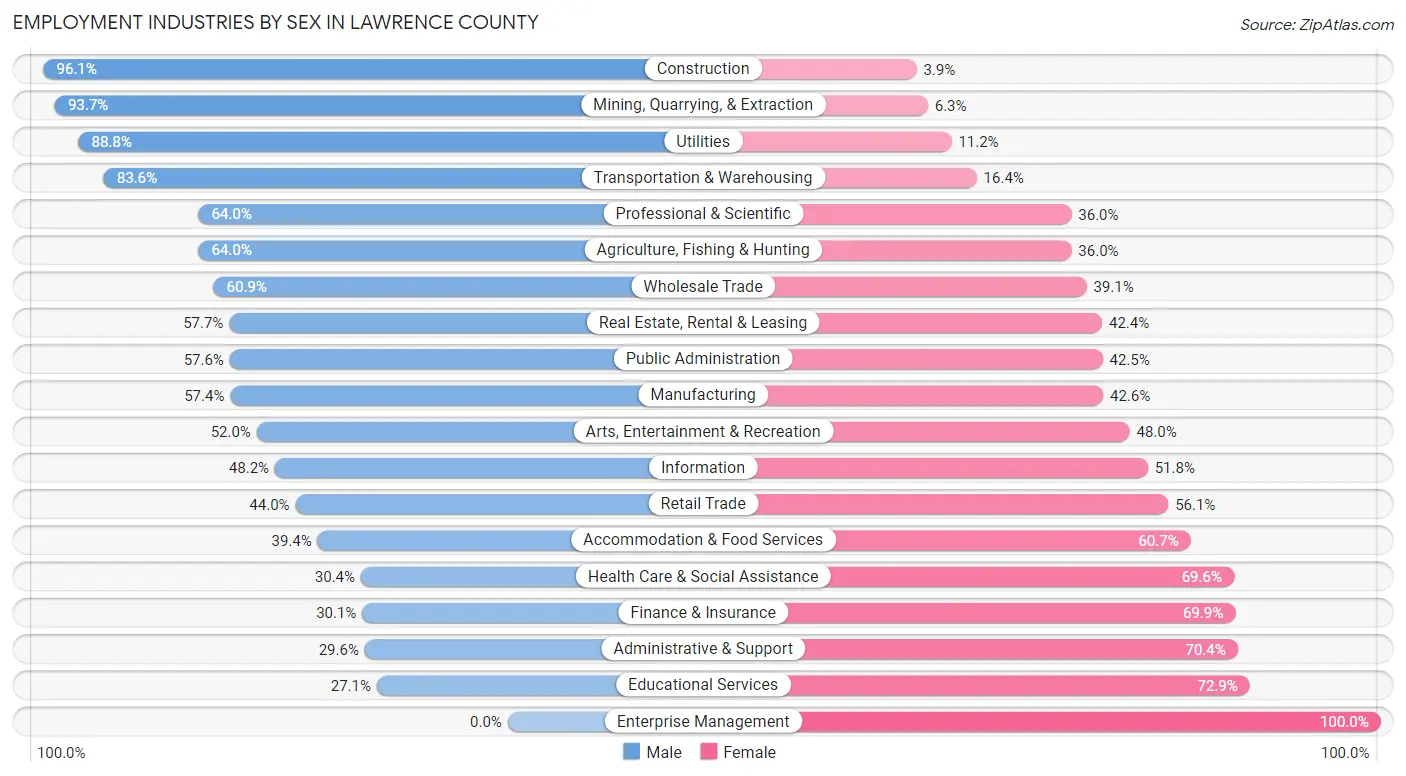
Employment Industries by Sex in Lawrence County
The Lawrence County industries that see more men than women are Construction (96.1%), Mining, Quarrying, & Extraction (93.7%), and Utilities (88.8%), whereas the industries that tend to have a higher number of women are Enterprise Management (100.0%), Educational Services (72.9%), and Administrative & Support (70.4%).
| Industry | Male | Female |
| Agriculture, Fishing & Hunting | 343 (64.0%) | 193 (36.0%) |
| Mining, Quarrying, & Extraction | 268 (93.7%) | 18 (6.3%) |
| Construction | 1,196 (96.1%) | 49 (3.9%) |
| Manufacturing | 448 (57.4%) | 332 (42.6%) |
| Wholesale Trade | 126 (60.9%) | 81 (39.1%) |
| Retail Trade | 647 (44.0%) | 825 (56.0%) |
| Transportation & Warehousing | 362 (83.6%) | 71 (16.4%) |
| Utilities | 135 (88.8%) | 17 (11.2%) |
| Information | 93 (48.2%) | 100 (51.8%) |
| Finance & Insurance | 122 (30.1%) | 283 (69.9%) |
| Real Estate, Rental & Leasing | 162 (57.7%) | 119 (42.3%) |
| Professional & Scientific | 432 (64.0%) | 243 (36.0%) |
| Enterprise Management | 0 (0.0%) | 21 (100.0%) |
| Administrative & Support | 111 (29.6%) | 264 (70.4%) |
| Educational Services | 347 (27.1%) | 933 (72.9%) |
| Health Care & Social Assistance | 497 (30.4%) | 1,138 (69.6%) |
| Arts, Entertainment & Recreation | 372 (52.0%) | 344 (48.0%) |
| Accommodation & Food Services | 839 (39.4%) | 1,293 (60.7%) |
| Public Administration | 362 (57.6%) | 267 (42.4%) |
| Total | 7,305 (51.1%) | 7,001 (48.9%) |
Education in Lawrence County
School Enrollment in Lawrence County
The most common levels of schooling among the 5,520 students in Lawrence County are college / undergraduate (1,876 | 34.0%), middle school (1,215 | 22.0%), and high school (1,205 | 21.8%).
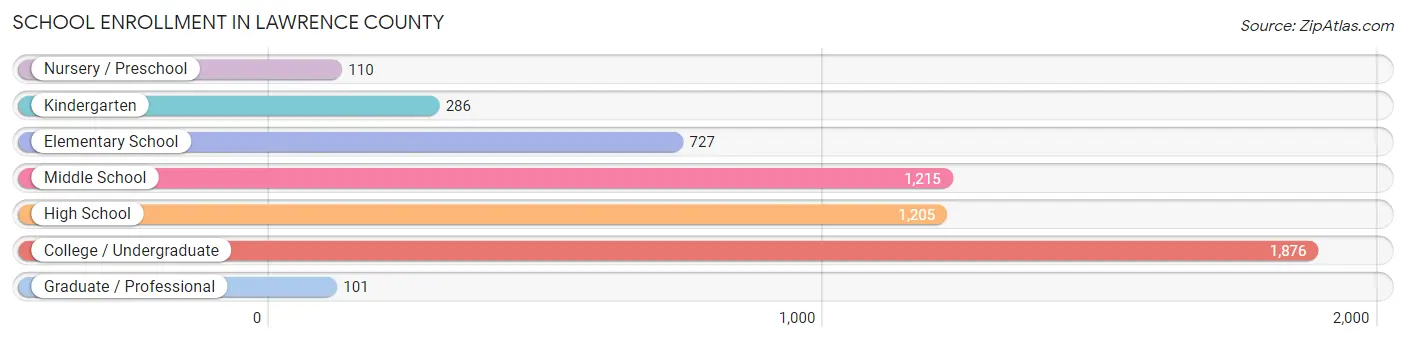
| School Level | # Students | % Students |
| Nursery / Preschool | 110 | 2.0% |
| Kindergarten | 286 | 5.2% |
| Elementary School | 727 | 13.2% |
| Middle School | 1,215 | 22.0% |
| High School | 1,205 | 21.8% |
| College / Undergraduate | 1,876 | 34.0% |
| Graduate / Professional | 101 | 1.8% |
| Total | 5,520 | 100.0% |
School Enrollment by Age by Funding Source in Lawrence County
Out of a total of 5,520 students who are enrolled in schools in Lawrence County, 403 (7.3%) attend a private institution, while the remaining 5,117 (92.7%) are enrolled in public schools. The age group of 25 to 34 year olds has the highest likelihood of being enrolled in private schools, with 64 (22.2% in the age bracket) enrolled. Conversely, the age group of 5 to 9 year old has the lowest likelihood of being enrolled in a private school, with 758 (96.7% in the age bracket) attending a public institution.
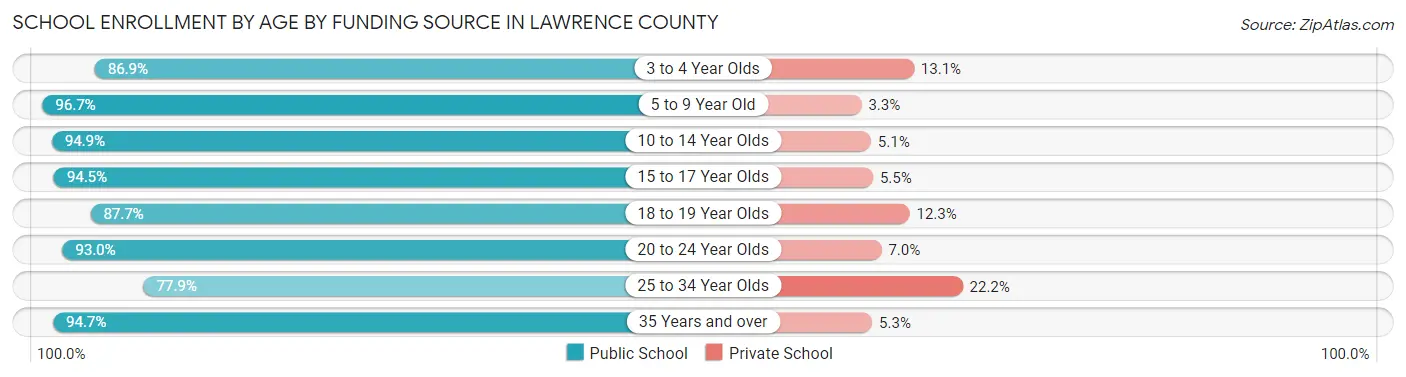
| Age Bracket | Public School | Private School |
| 3 to 4 Year Olds | 113 (86.9%) | 17 (13.1%) |
| 5 to 9 Year Old | 758 (96.7%) | 26 (3.3%) |
| 10 to 14 Year Olds | 1,443 (94.9%) | 77 (5.1%) |
| 15 to 17 Year Olds | 779 (94.5%) | 45 (5.5%) |
| 18 to 19 Year Olds | 622 (87.7%) | 87 (12.3%) |
| 20 to 24 Year Olds | 1,070 (93.0%) | 81 (7.0%) |
| 25 to 34 Year Olds | 225 (77.8%) | 64 (22.2%) |
| 35 Years and over | 107 (94.7%) | 6 (5.3%) |
| Total | 5,117 (92.7%) | 403 (7.3%) |
Educational Attainment by Field of Study in Lawrence County
Education (1,508 | 20.0%), business (1,300 | 17.2%), social sciences (629 | 8.3%), science & technology (629 | 8.3%), and arts & humanities (575 | 7.6%) are the most common fields of study among 7,543 individuals in Lawrence County who have obtained a bachelor's degree or higher.
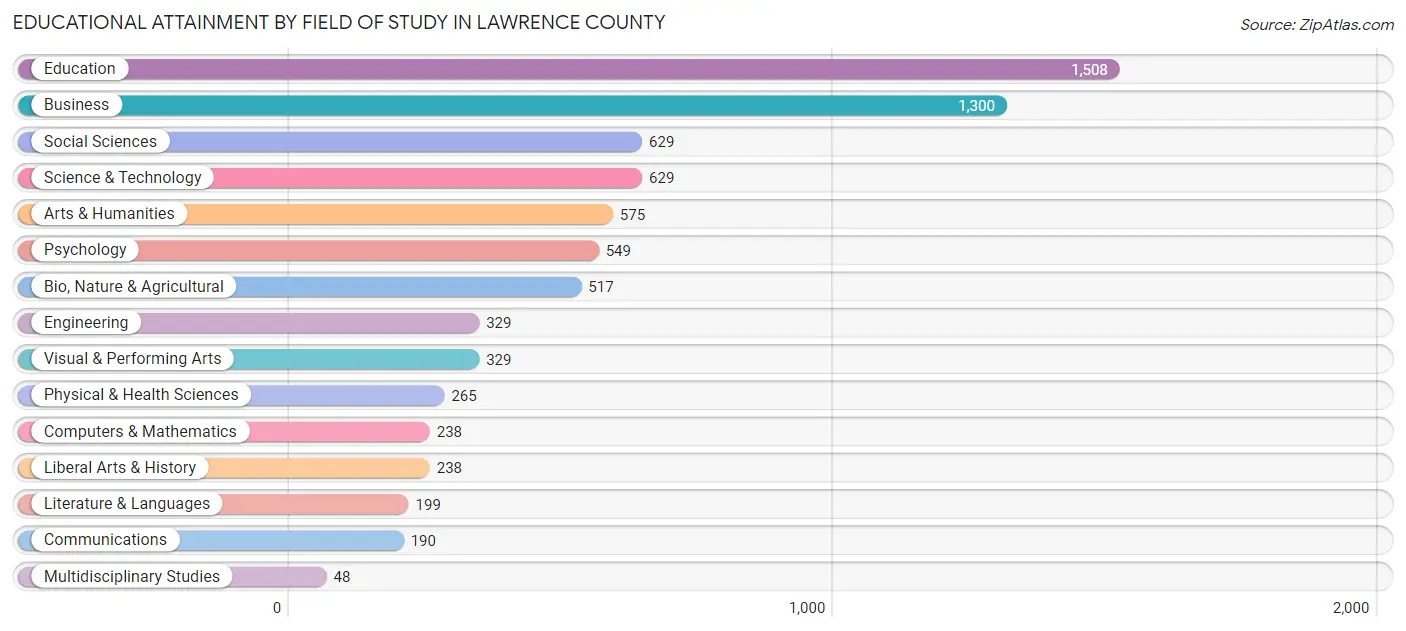
| Field of Study | # Graduates | % Graduates |
| Computers & Mathematics | 238 | 3.2% |
| Bio, Nature & Agricultural | 517 | 6.9% |
| Physical & Health Sciences | 265 | 3.5% |
| Psychology | 549 | 7.3% |
| Social Sciences | 629 | 8.3% |
| Engineering | 329 | 4.4% |
| Multidisciplinary Studies | 48 | 0.6% |
| Science & Technology | 629 | 8.3% |
| Business | 1,300 | 17.2% |
| Education | 1,508 | 20.0% |
| Literature & Languages | 199 | 2.6% |
| Liberal Arts & History | 238 | 3.2% |
| Visual & Performing Arts | 329 | 4.4% |
| Communications | 190 | 2.5% |
| Arts & Humanities | 575 | 7.6% |
| Total | 7,543 | 100.0% |
Transportation & Commute in Lawrence County
Vehicle Availability by Sex in Lawrence County
The most prevalent vehicle ownership categories in Lawrence County are males with 2 vehicles (2,727, accounting for 39.0%) and females with 2 vehicles (2,462, making up 40.6%).
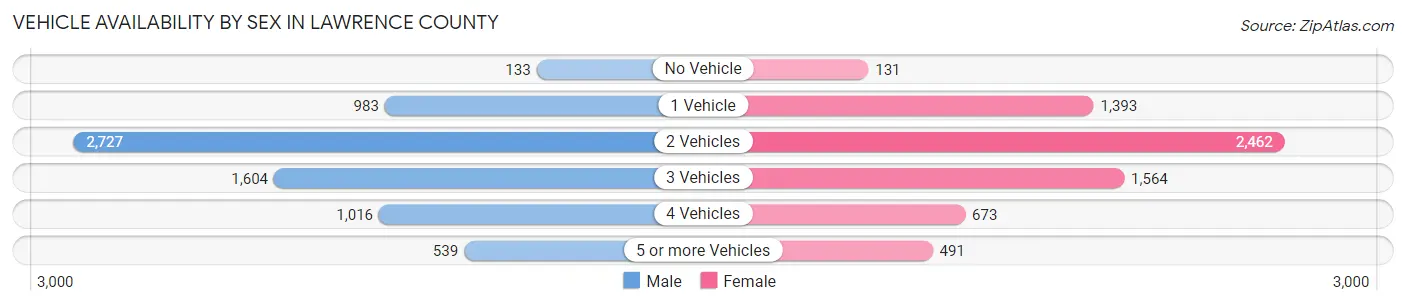
| Vehicles Available | Male | Female |
| No Vehicle | 133 (1.9%) | 131 (1.9%) |
| 1 Vehicle | 983 (14.0%) | 1,393 (20.7%) |
| 2 Vehicles | 2,727 (39.0%) | 2,462 (36.7%) |
| 3 Vehicles | 1,604 (22.9%) | 1,564 (23.3%) |
| 4 Vehicles | 1,016 (14.5%) | 673 (10.0%) |
| 5 or more Vehicles | 539 (7.7%) | 491 (7.3%) |
| Total | 7,002 (100.0%) | 6,714 (100.0%) |
Commute Time in Lawrence County
The most frequently occuring commute durations in Lawrence County are 5 to 9 minutes (3,446 commuters, 26.0%), 10 to 14 minutes (2,521 commuters, 19.0%), and 15 to 19 minutes (1,800 commuters, 13.6%).
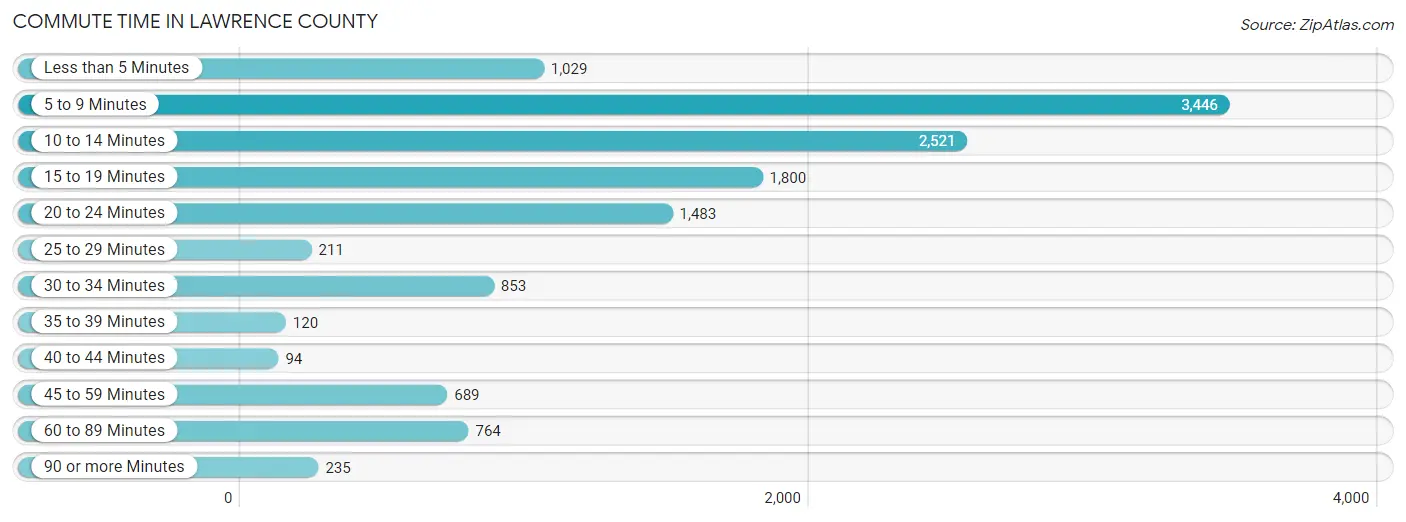
| Commute Time | # Commuters | % Commuters |
| Less than 5 Minutes | 1,029 | 7.8% |
| 5 to 9 Minutes | 3,446 | 26.0% |
| 10 to 14 Minutes | 2,521 | 19.0% |
| 15 to 19 Minutes | 1,800 | 13.6% |
| 20 to 24 Minutes | 1,483 | 11.2% |
| 25 to 29 Minutes | 211 | 1.6% |
| 30 to 34 Minutes | 853 | 6.4% |
| 35 to 39 Minutes | 120 | 0.9% |
| 40 to 44 Minutes | 94 | 0.7% |
| 45 to 59 Minutes | 689 | 5.2% |
| 60 to 89 Minutes | 764 | 5.8% |
| 90 or more Minutes | 235 | 1.8% |
Commute Time by Sex in Lawrence County
The most common commute times in Lawrence County are 5 to 9 minutes (1,551 commuters, 22.9%) for males and 5 to 9 minutes (1,895 commuters, 29.3%) for females.
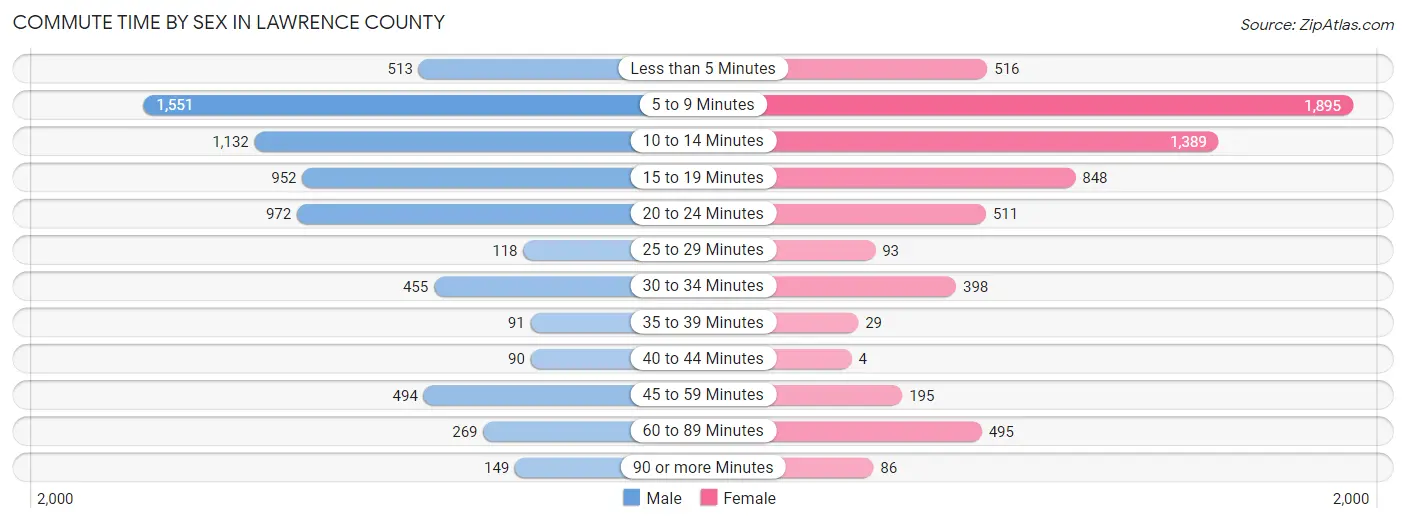
| Commute Time | Male | Female |
| Less than 5 Minutes | 513 (7.6%) | 516 (8.0%) |
| 5 to 9 Minutes | 1,551 (22.9%) | 1,895 (29.3%) |
| 10 to 14 Minutes | 1,132 (16.7%) | 1,389 (21.5%) |
| 15 to 19 Minutes | 952 (14.0%) | 848 (13.1%) |
| 20 to 24 Minutes | 972 (14.3%) | 511 (7.9%) |
| 25 to 29 Minutes | 118 (1.7%) | 93 (1.4%) |
| 30 to 34 Minutes | 455 (6.7%) | 398 (6.2%) |
| 35 to 39 Minutes | 91 (1.3%) | 29 (0.4%) |
| 40 to 44 Minutes | 90 (1.3%) | 4 (0.1%) |
| 45 to 59 Minutes | 494 (7.3%) | 195 (3.0%) |
| 60 to 89 Minutes | 269 (4.0%) | 495 (7.7%) |
| 90 or more Minutes | 149 (2.2%) | 86 (1.3%) |
Time of Departure to Work by Sex in Lawrence County
The most frequent times of departure to work in Lawrence County are 7:30 AM to 7:59 AM (1,051, 15.5%) for males and 7:30 AM to 7:59 AM (1,267, 19.6%) for females.
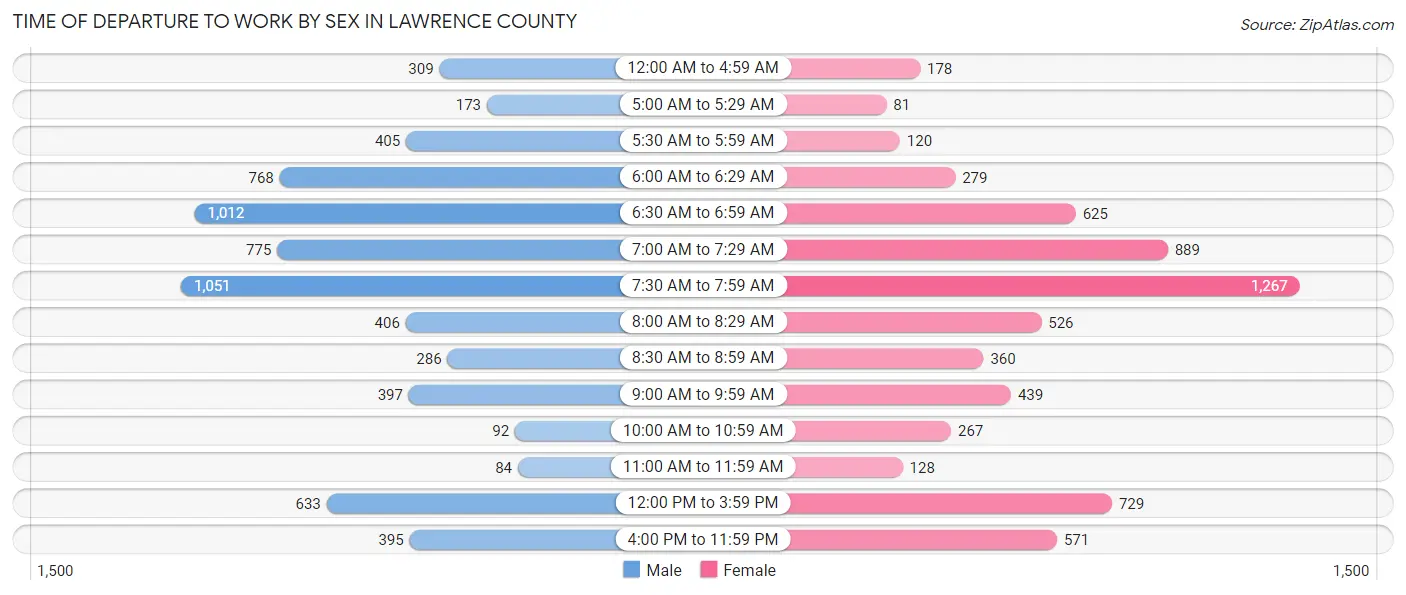
| Time of Departure | Male | Female |
| 12:00 AM to 4:59 AM | 309 (4.5%) | 178 (2.8%) |
| 5:00 AM to 5:29 AM | 173 (2.5%) | 81 (1.3%) |
| 5:30 AM to 5:59 AM | 405 (6.0%) | 120 (1.9%) |
| 6:00 AM to 6:29 AM | 768 (11.3%) | 279 (4.3%) |
| 6:30 AM to 6:59 AM | 1,012 (14.9%) | 625 (9.7%) |
| 7:00 AM to 7:29 AM | 775 (11.4%) | 889 (13.8%) |
| 7:30 AM to 7:59 AM | 1,051 (15.5%) | 1,267 (19.6%) |
| 8:00 AM to 8:29 AM | 406 (6.0%) | 526 (8.1%) |
| 8:30 AM to 8:59 AM | 286 (4.2%) | 360 (5.6%) |
| 9:00 AM to 9:59 AM | 397 (5.9%) | 439 (6.8%) |
| 10:00 AM to 10:59 AM | 92 (1.4%) | 267 (4.1%) |
| 11:00 AM to 11:59 AM | 84 (1.2%) | 128 (2.0%) |
| 12:00 PM to 3:59 PM | 633 (9.3%) | 729 (11.3%) |
| 4:00 PM to 11:59 PM | 395 (5.8%) | 571 (8.8%) |
| Total | 6,786 (100.0%) | 6,459 (100.0%) |
Housing Occupancy in Lawrence County
Occupancy by Ownership in Lawrence County
Of the total 11,392 dwellings in Lawrence County, owner-occupied units account for 7,482 (65.7%), while renter-occupied units make up 3,910 (34.3%).
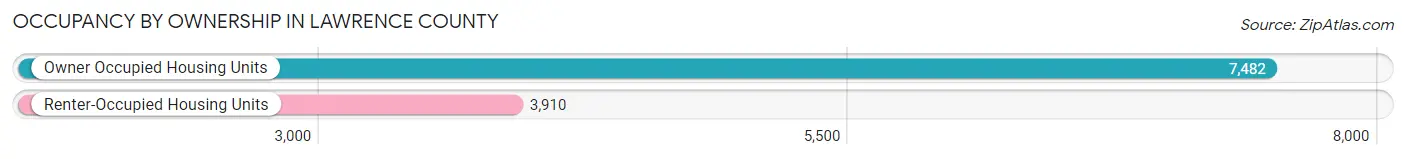
| Occupancy | # Housing Units | % Housing Units |
| Owner Occupied Housing Units | 7,482 | 65.7% |
| Renter-Occupied Housing Units | 3,910 | 34.3% |
| Total Occupied Housing Units | 11,392 | 100.0% |
Occupancy by Household Size in Lawrence County
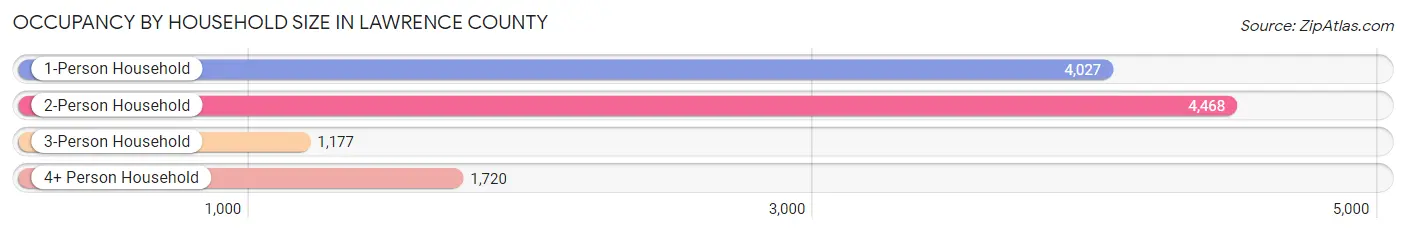
| Household Size | # Housing Units | % Housing Units |
| 1-Person Household | 4,027 | 35.3% |
| 2-Person Household | 4,468 | 39.2% |
| 3-Person Household | 1,177 | 10.3% |
| 4+ Person Household | 1,720 | 15.1% |
| Total Housing Units | 11,392 | 100.0% |
Occupancy by Ownership by Household Size in Lawrence County
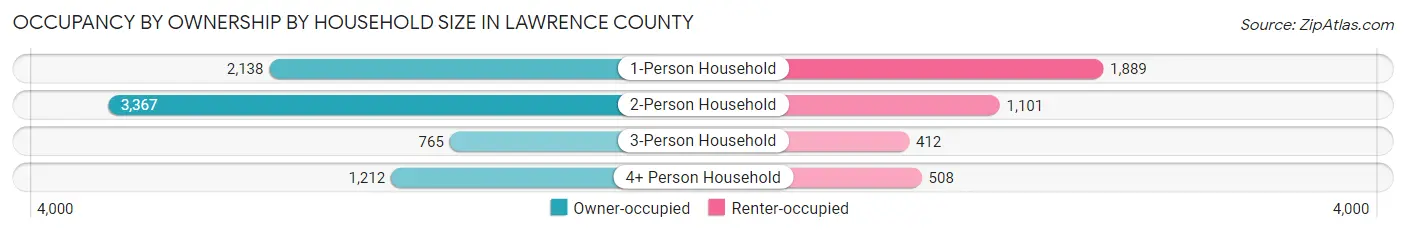
| Household Size | Owner-occupied | Renter-occupied |
| 1-Person Household | 2,138 (53.1%) | 1,889 (46.9%) |
| 2-Person Household | 3,367 (75.4%) | 1,101 (24.6%) |
| 3-Person Household | 765 (65.0%) | 412 (35.0%) |
| 4+ Person Household | 1,212 (70.5%) | 508 (29.5%) |
| Total Housing Units | 7,482 (65.7%) | 3,910 (34.3%) |
Occupancy by Educational Attainment in Lawrence County
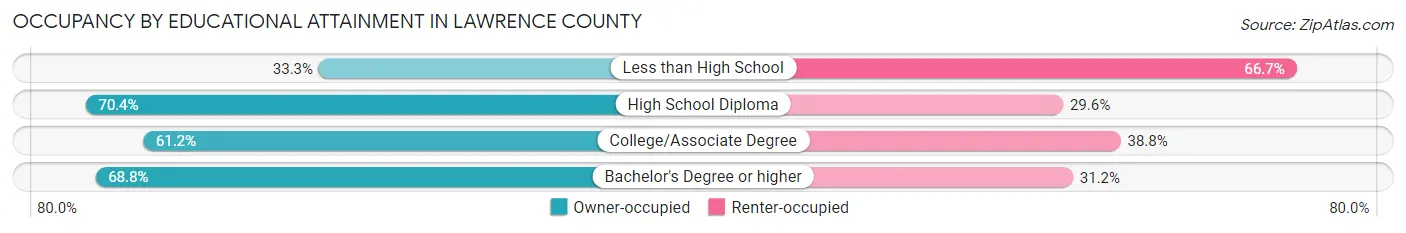
| Household Size | Owner-occupied | Renter-occupied |
| Less than High School | 106 (33.3%) | 212 (66.7%) |
| High School Diploma | 2,033 (70.4%) | 856 (29.6%) |
| College/Associate Degree | 2,337 (61.2%) | 1,479 (38.8%) |
| Bachelor's Degree or higher | 3,006 (68.8%) | 1,363 (31.2%) |
Occupancy by Age of Householder in Lawrence County

| Age Bracket | # Households | % Households |
| Under 35 Years | 2,184 | 19.2% |
| 35 to 44 Years | 1,573 | 13.8% |
| 45 to 54 Years | 1,594 | 14.0% |
| 55 to 64 Years | 2,111 | 18.5% |
| 65 to 74 Years | 2,427 | 21.3% |
| 75 to 84 Years | 1,036 | 9.1% |
| 85 Years and Over | 467 | 4.1% |
| Total | 11,392 | 100.0% |
Housing Finances in Lawrence County
Median Income by Occupancy in Lawrence County
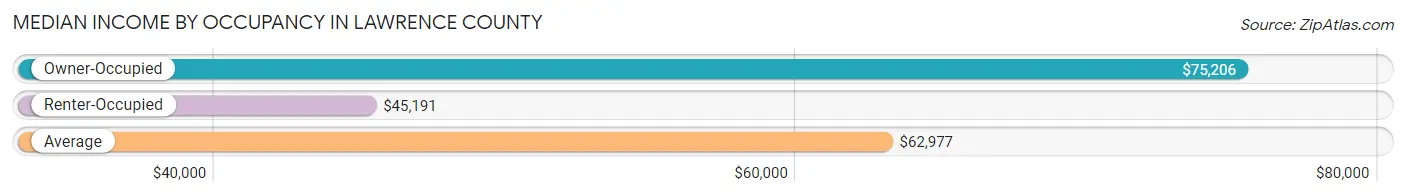
| Occupancy Type | # Households | Median Income |
| Owner-Occupied | 7,482 (65.7%) | $75,206 |
| Renter-Occupied | 3,910 (34.3%) | $45,191 |
| Average | 11,392 (100.0%) | $62,977 |
Occupancy by Householder Income Bracket in Lawrence County
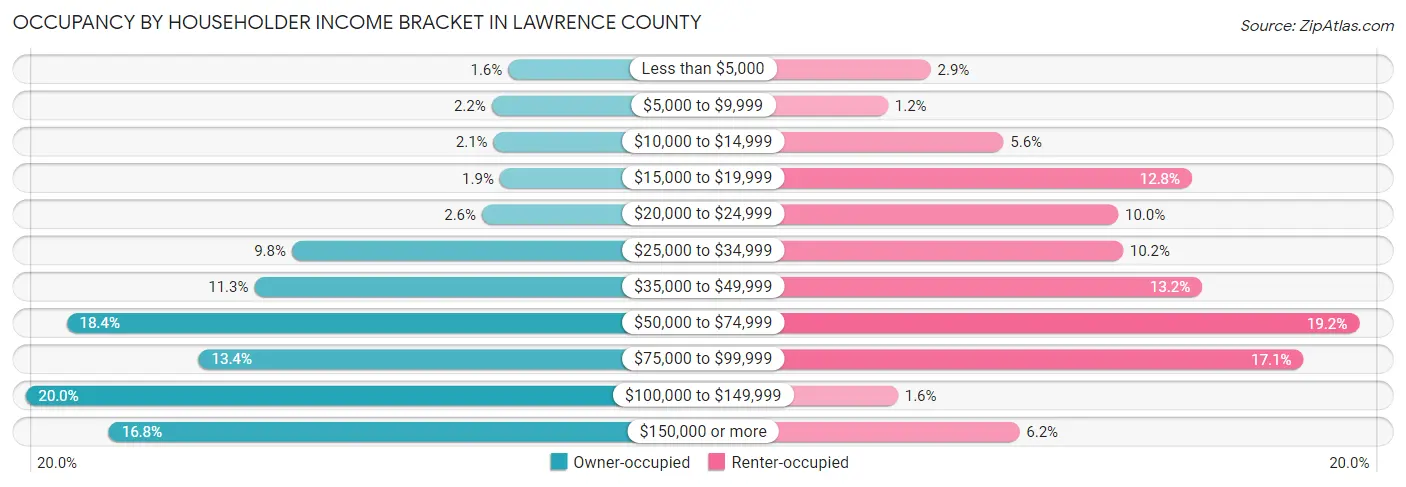
| Income Bracket | Owner-occupied | Renter-occupied |
| Less than $5,000 | 118 (1.6%) | 112 (2.9%) |
| $5,000 to $9,999 | 165 (2.2%) | 48 (1.2%) |
| $10,000 to $14,999 | 160 (2.1%) | 220 (5.6%) |
| $15,000 to $19,999 | 142 (1.9%) | 501 (12.8%) |
| $20,000 to $24,999 | 193 (2.6%) | 391 (10.0%) |
| $25,000 to $34,999 | 735 (9.8%) | 398 (10.2%) |
| $35,000 to $49,999 | 842 (11.3%) | 516 (13.2%) |
| $50,000 to $74,999 | 1,377 (18.4%) | 750 (19.2%) |
| $75,000 to $99,999 | 1,000 (13.4%) | 667 (17.1%) |
| $100,000 to $149,999 | 1,494 (20.0%) | 63 (1.6%) |
| $150,000 or more | 1,256 (16.8%) | 244 (6.2%) |
| Total | 7,482 (100.0%) | 3,910 (100.0%) |
Monthly Housing Cost Tiers in Lawrence County
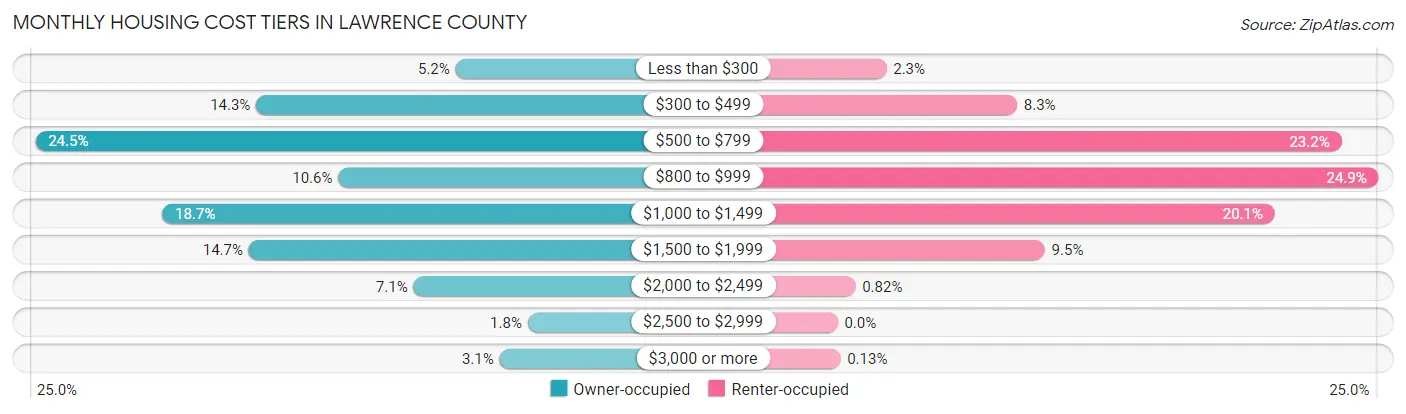
| Monthly Cost | Owner-occupied | Renter-occupied |
| Less than $300 | 386 (5.2%) | 88 (2.2%) |
| $300 to $499 | 1,073 (14.3%) | 323 (8.3%) |
| $500 to $799 | 1,834 (24.5%) | 907 (23.2%) |
| $800 to $999 | 790 (10.6%) | 974 (24.9%) |
| $1,000 to $1,499 | 1,397 (18.7%) | 787 (20.1%) |
| $1,500 to $1,999 | 1,098 (14.7%) | 373 (9.5%) |
| $2,000 to $2,499 | 531 (7.1%) | 32 (0.8%) |
| $2,500 to $2,999 | 138 (1.8%) | 0 (0.0%) |
| $3,000 or more | 235 (3.1%) | 5 (0.1%) |
| Total | 7,482 (100.0%) | 3,910 (100.0%) |
Physical Housing Characteristics in Lawrence County
Housing Structures in Lawrence County
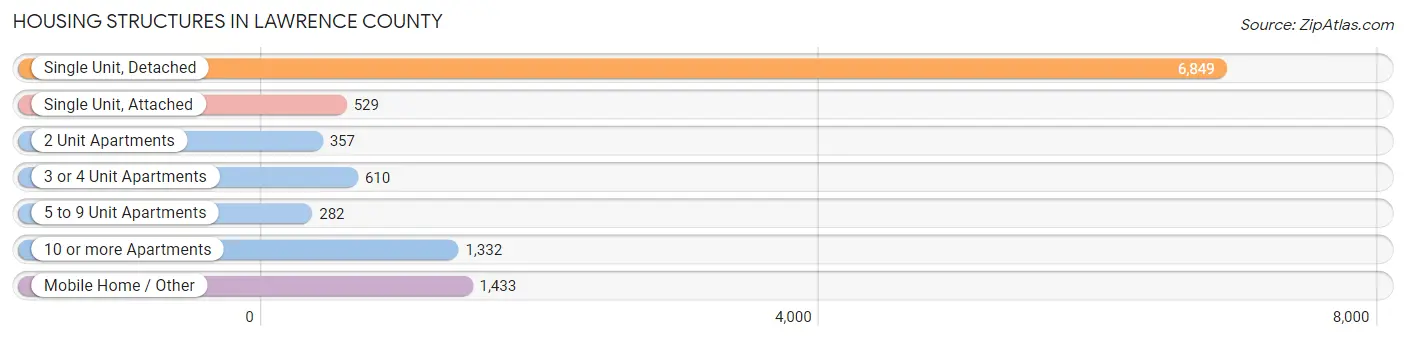
| Structure Type | # Housing Units | % Housing Units |
| Single Unit, Detached | 6,849 | 60.1% |
| Single Unit, Attached | 529 | 4.6% |
| 2 Unit Apartments | 357 | 3.1% |
| 3 or 4 Unit Apartments | 610 | 5.3% |
| 5 to 9 Unit Apartments | 282 | 2.5% |
| 10 or more Apartments | 1,332 | 11.7% |
| Mobile Home / Other | 1,433 | 12.6% |
| Total | 11,392 | 100.0% |
Housing Structures by Occupancy in Lawrence County
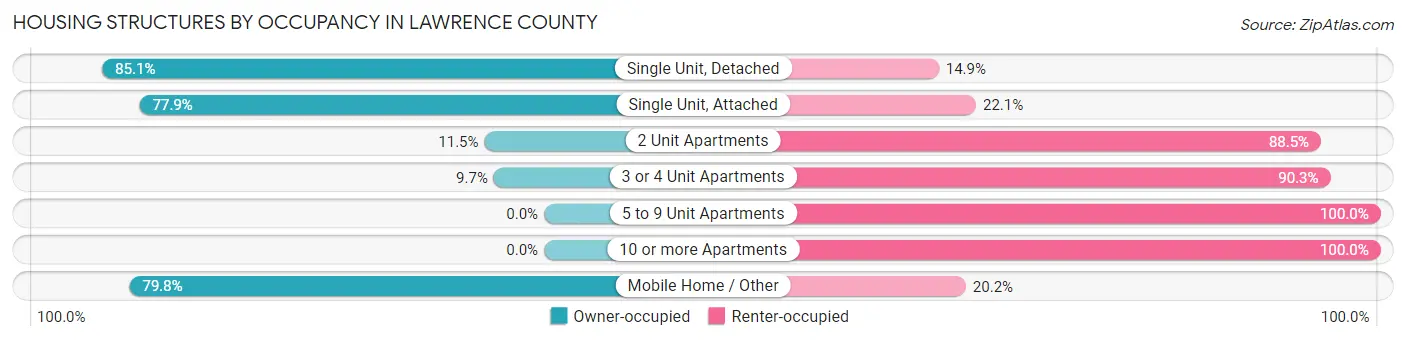
| Structure Type | Owner-occupied | Renter-occupied |
| Single Unit, Detached | 5,826 (85.1%) | 1,023 (14.9%) |
| Single Unit, Attached | 412 (77.9%) | 117 (22.1%) |
| 2 Unit Apartments | 41 (11.5%) | 316 (88.5%) |
| 3 or 4 Unit Apartments | 59 (9.7%) | 551 (90.3%) |
| 5 to 9 Unit Apartments | 0 (0.0%) | 282 (100.0%) |
| 10 or more Apartments | 0 (0.0%) | 1,332 (100.0%) |
| Mobile Home / Other | 1,144 (79.8%) | 289 (20.2%) |
| Total | 7,482 (65.7%) | 3,910 (34.3%) |
Housing Structures by Number of Rooms in Lawrence County
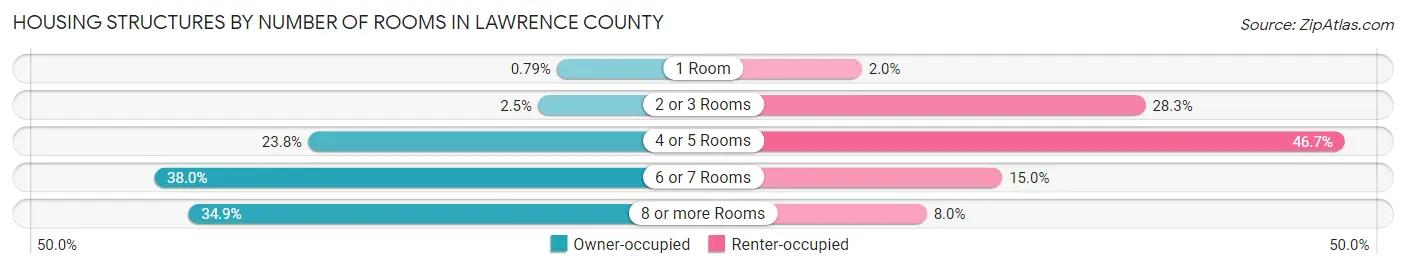
| Number of Rooms | Owner-occupied | Renter-occupied |
| 1 Room | 59 (0.8%) | 79 (2.0%) |
| 2 or 3 Rooms | 189 (2.5%) | 1,105 (28.3%) |
| 4 or 5 Rooms | 1,781 (23.8%) | 1,825 (46.7%) |
| 6 or 7 Rooms | 2,845 (38.0%) | 587 (15.0%) |
| 8 or more Rooms | 2,608 (34.9%) | 314 (8.0%) |
| Total | 7,482 (100.0%) | 3,910 (100.0%) |
Housing Structure by Heating Type in Lawrence County
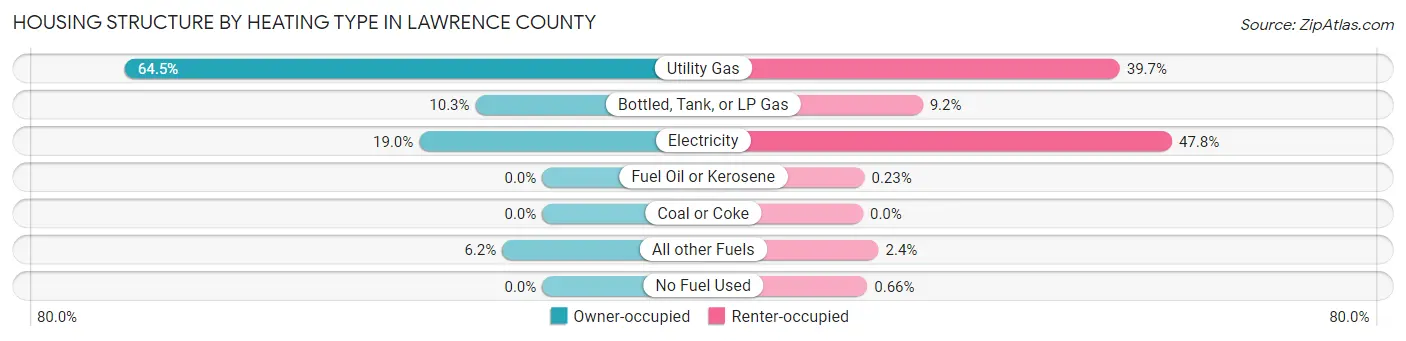
| Heating Type | Owner-occupied | Renter-occupied |
| Utility Gas | 4,825 (64.5%) | 1,552 (39.7%) |
| Bottled, Tank, or LP Gas | 772 (10.3%) | 361 (9.2%) |
| Electricity | 1,422 (19.0%) | 1,868 (47.8%) |
| Fuel Oil or Kerosene | 0 (0.0%) | 9 (0.2%) |
| Coal or Coke | 0 (0.0%) | 0 (0.0%) |
| All other Fuels | 463 (6.2%) | 94 (2.4%) |
| No Fuel Used | 0 (0.0%) | 26 (0.7%) |
| Total | 7,482 (100.0%) | 3,910 (100.0%) |
Household Vehicle Usage in Lawrence County
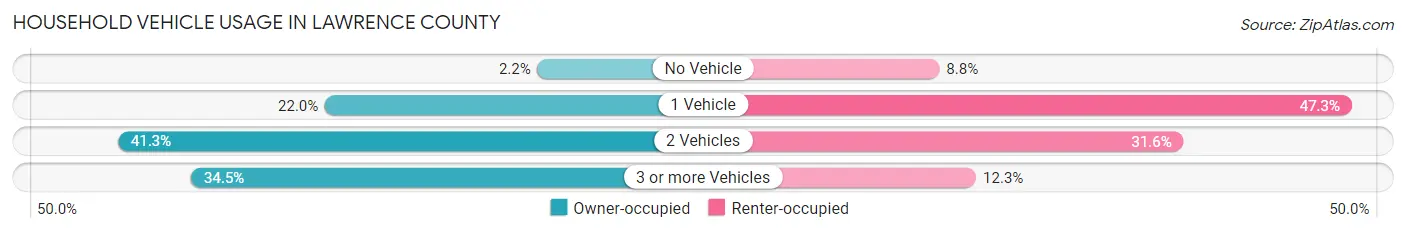
| Vehicles per Household | Owner-occupied | Renter-occupied |
| No Vehicle | 165 (2.2%) | 345 (8.8%) |
| 1 Vehicle | 1,649 (22.0%) | 1,850 (47.3%) |
| 2 Vehicles | 3,089 (41.3%) | 1,236 (31.6%) |
| 3 or more Vehicles | 2,579 (34.5%) | 479 (12.2%) |
| Total | 7,482 (100.0%) | 3,910 (100.0%) |
Real Estate & Mortgages in Lawrence County
Real Estate and Mortgage Overview in Lawrence County
| Characteristic | Without Mortgage | With Mortgage |
| Housing Units | 4,113 | 3,369 |
| Median Property Value | $241,400 | $287,100 |
| Median Household Income | $62,036 | $798 |
| Monthly Housing Costs | $581 | $235 |
| Real Estate Taxes | $2,306 | $98 |
Property Value by Mortgage Status in Lawrence County
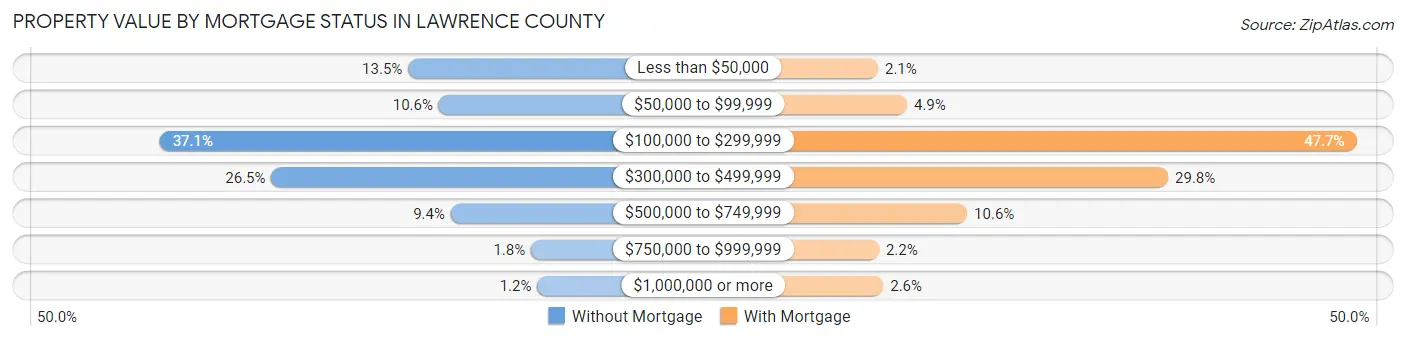
| Property Value | Without Mortgage | With Mortgage |
| Less than $50,000 | 554 (13.5%) | 72 (2.1%) |
| $50,000 to $99,999 | 434 (10.5%) | 165 (4.9%) |
| $100,000 to $299,999 | 1,527 (37.1%) | 1,607 (47.7%) |
| $300,000 to $499,999 | 1,090 (26.5%) | 1,003 (29.8%) |
| $500,000 to $749,999 | 387 (9.4%) | 358 (10.6%) |
| $750,000 to $999,999 | 73 (1.8%) | 75 (2.2%) |
| $1,000,000 or more | 48 (1.2%) | 89 (2.6%) |
| Total | 4,113 (100.0%) | 3,369 (100.0%) |
Household Income by Mortgage Status in Lawrence County
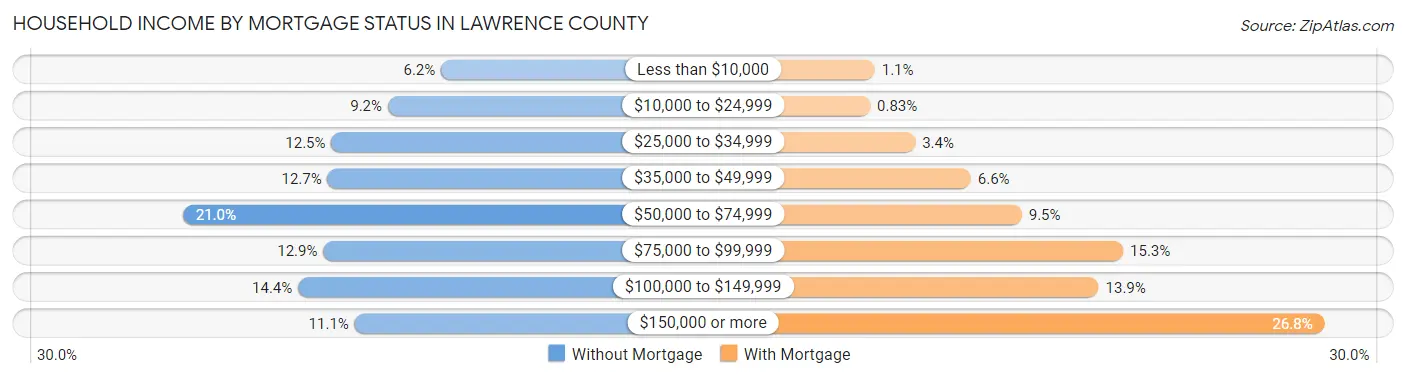
| Household Income | Without Mortgage | With Mortgage |
| Less than $10,000 | 255 (6.2%) | 37 (1.1%) |
| $10,000 to $24,999 | 380 (9.2%) | 28 (0.8%) |
| $25,000 to $34,999 | 513 (12.5%) | 115 (3.4%) |
| $35,000 to $49,999 | 522 (12.7%) | 222 (6.6%) |
| $50,000 to $74,999 | 862 (21.0%) | 320 (9.5%) |
| $75,000 to $99,999 | 532 (12.9%) | 515 (15.3%) |
| $100,000 to $149,999 | 591 (14.4%) | 468 (13.9%) |
| $150,000 or more | 458 (11.1%) | 903 (26.8%) |
| Total | 4,113 (100.0%) | 3,369 (100.0%) |
Property Value to Household Income Ratio in Lawrence County
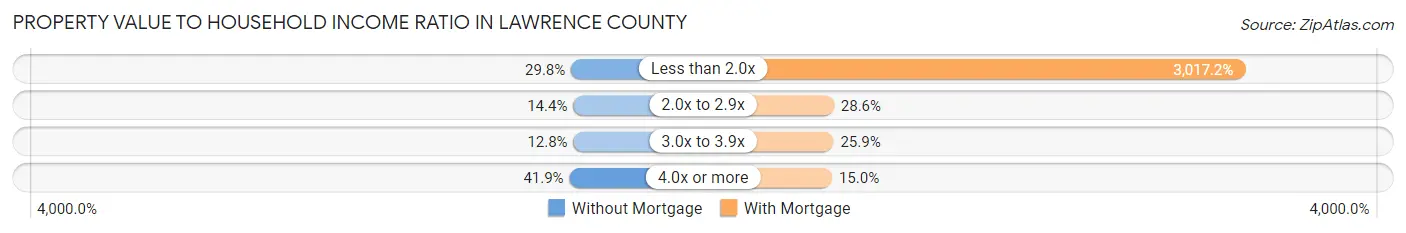
| Value-to-Income Ratio | Without Mortgage | With Mortgage |
| Less than 2.0x | 1,224 (29.8%) | 101,650 (3,017.2%) |
| 2.0x to 2.9x | 594 (14.4%) | 963 (28.6%) |
| 3.0x to 3.9x | 527 (12.8%) | 873 (25.9%) |
| 4.0x or more | 1,725 (41.9%) | 505 (15.0%) |
| Total | 4,113 (100.0%) | 3,369 (100.0%) |
Real Estate Taxes by Mortgage Status in Lawrence County
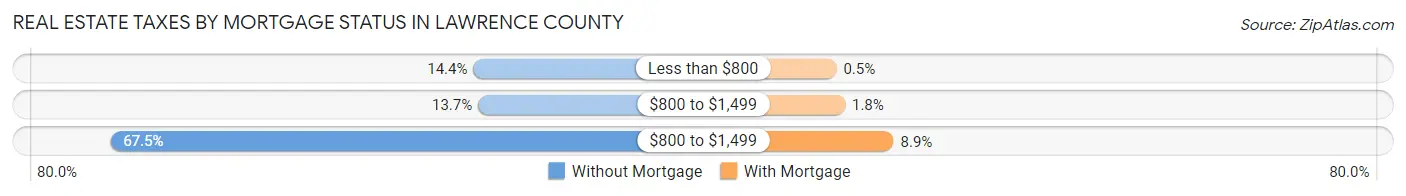
| Property Taxes | Without Mortgage | With Mortgage |
| Less than $800 | 594 (14.4%) | 17 (0.5%) |
| $800 to $1,499 | 565 (13.7%) | 59 (1.8%) |
| $800 to $1,499 | 2,776 (67.5%) | 298 (8.8%) |
| Total | 4,113 (100.0%) | 3,369 (100.0%) |
Health & Disability in Lawrence County
Health Insurance Coverage by Age in Lawrence County
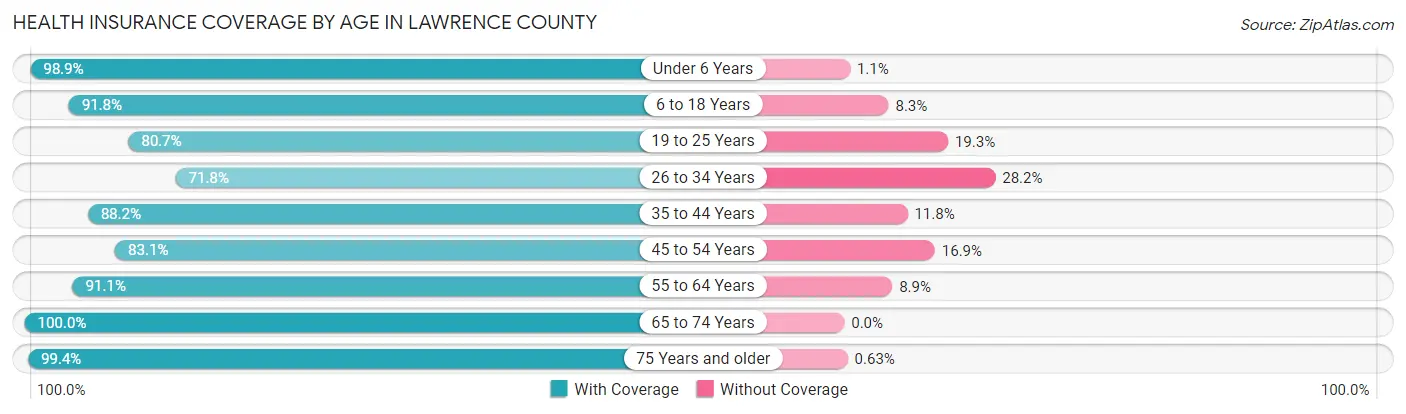
| Age Bracket | With Coverage | Without Coverage |
| Under 6 Years | 1,123 (98.9%) | 12 (1.1%) |
| 6 to 18 Years | 3,402 (91.7%) | 306 (8.3%) |
| 19 to 25 Years | 2,369 (80.7%) | 568 (19.3%) |
| 26 to 34 Years | 1,898 (71.8%) | 744 (28.2%) |
| 35 to 44 Years | 2,531 (88.2%) | 338 (11.8%) |
| 45 to 54 Years | 2,253 (83.1%) | 458 (16.9%) |
| 55 to 64 Years | 3,514 (91.1%) | 345 (8.9%) |
| 65 to 74 Years | 3,752 (100.0%) | 0 (0.0%) |
| 75 Years and older | 2,193 (99.4%) | 14 (0.6%) |
| Total | 23,035 (89.2%) | 2,785 (10.8%) |
Health Insurance Coverage by Citizenship Status in Lawrence County
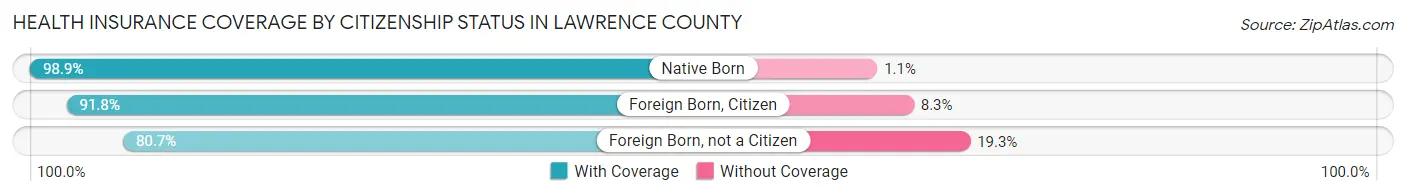
| Citizenship Status | With Coverage | Without Coverage |
| Native Born | 1,123 (98.9%) | 12 (1.1%) |
| Foreign Born, Citizen | 3,402 (91.7%) | 306 (8.3%) |
| Foreign Born, not a Citizen | 2,369 (80.7%) | 568 (19.3%) |
Health Insurance Coverage by Household Income in Lawrence County
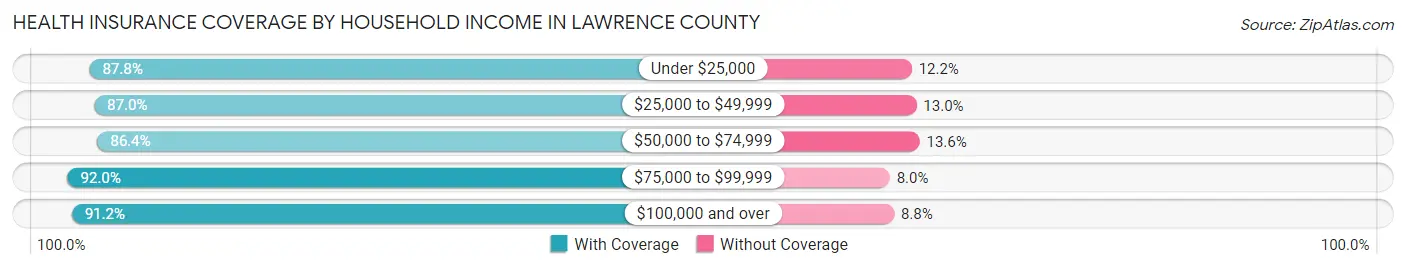
| Household Income | With Coverage | Without Coverage |
| Under $25,000 | 2,507 (87.8%) | 347 (12.2%) |
| $25,000 to $49,999 | 3,968 (87.0%) | 595 (13.0%) |
| $50,000 to $74,999 | 3,493 (86.4%) | 551 (13.6%) |
| $75,000 to $99,999 | 3,683 (92.0%) | 322 (8.0%) |
| $100,000 and over | 8,630 (91.2%) | 836 (8.8%) |
Public vs Private Health Insurance Coverage by Age in Lawrence County
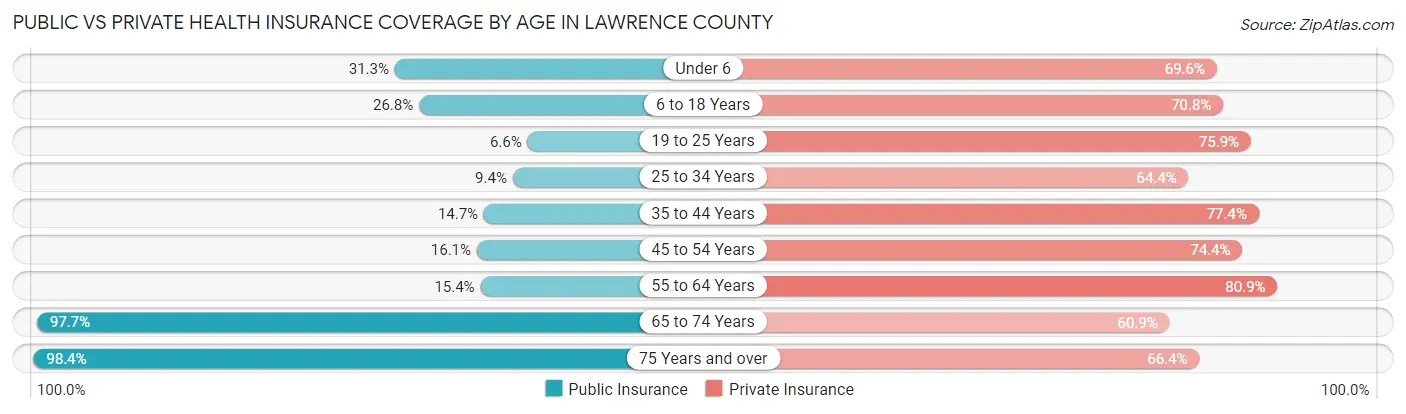
| Age Bracket | Public Insurance | Private Insurance |
| Under 6 | 355 (31.3%) | 790 (69.6%) |
| 6 to 18 Years | 993 (26.8%) | 2,625 (70.8%) |
| 19 to 25 Years | 195 (6.6%) | 2,230 (75.9%) |
| 25 to 34 Years | 248 (9.4%) | 1,701 (64.4%) |
| 35 to 44 Years | 423 (14.7%) | 2,220 (77.4%) |
| 45 to 54 Years | 435 (16.1%) | 2,016 (74.4%) |
| 55 to 64 Years | 594 (15.4%) | 3,120 (80.8%) |
| 65 to 74 Years | 3,667 (97.7%) | 2,283 (60.9%) |
| 75 Years and over | 2,171 (98.4%) | 1,465 (66.4%) |
| Total | 9,081 (35.2%) | 18,450 (71.5%) |
Disability Status by Sex by Age in Lawrence County
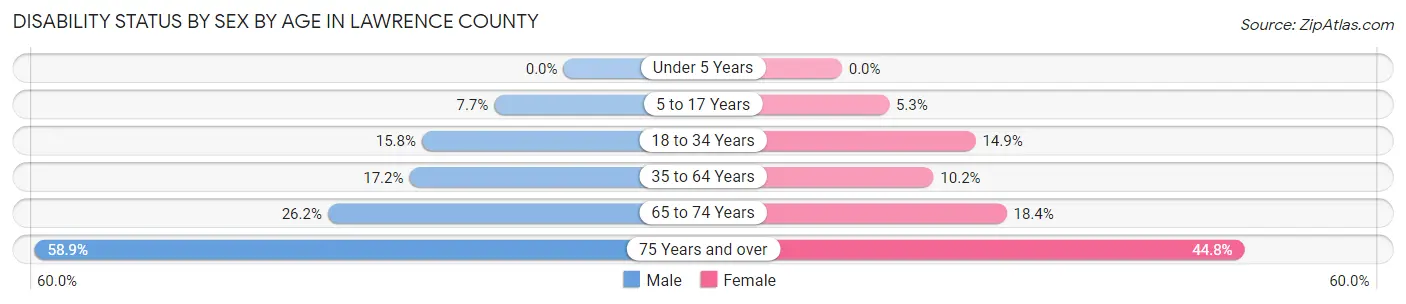
| Age Bracket | Male | Female |
| Under 5 Years | 0 (0.0%) | 0 (0.0%) |
| 5 to 17 Years | 129 (7.7%) | 90 (5.2%) |
| 18 to 34 Years | 459 (15.8%) | 467 (14.9%) |
| 35 to 64 Years | 814 (17.2%) | 479 (10.2%) |
| 65 to 74 Years | 504 (26.2%) | 336 (18.3%) |
| 75 Years and over | 580 (58.9%) | 548 (44.8%) |
Disability Class by Sex by Age in Lawrence County
Disability Class: Hearing Difficulty
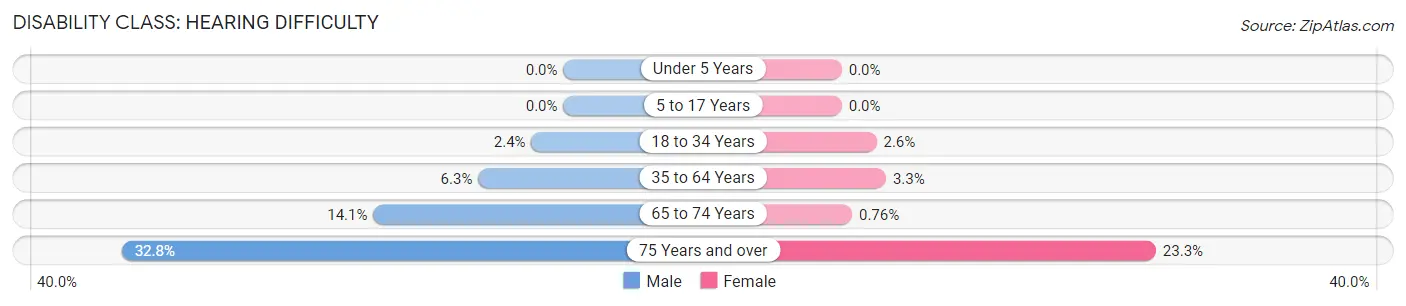
| Age Bracket | Male | Female |
| Under 5 Years | 0 (0.0%) | 0 (0.0%) |
| 5 to 17 Years | 0 (0.0%) | 0 (0.0%) |
| 18 to 34 Years | 69 (2.4%) | 81 (2.6%) |
| 35 to 64 Years | 300 (6.3%) | 154 (3.3%) |
| 65 to 74 Years | 271 (14.1%) | 14 (0.8%) |
| 75 Years and over | 323 (32.8%) | 285 (23.3%) |
Disability Class: Vision Difficulty
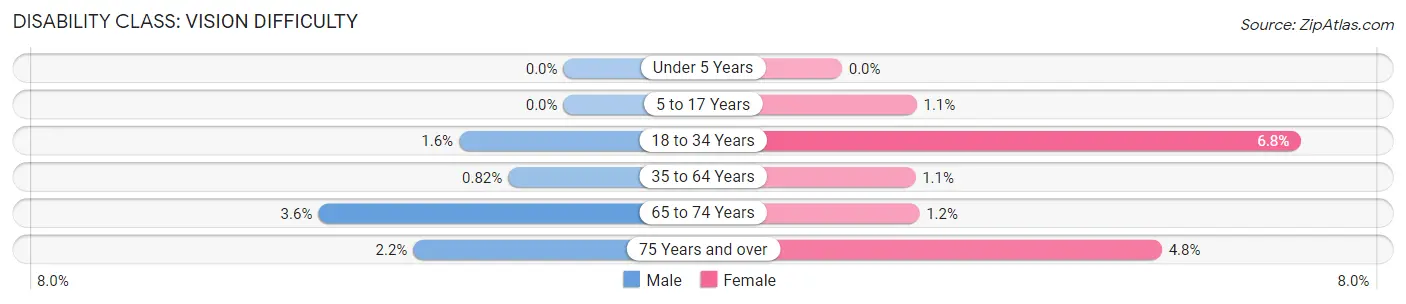
| Age Bracket | Male | Female |
| Under 5 Years | 0 (0.0%) | 0 (0.0%) |
| 5 to 17 Years | 0 (0.0%) | 19 (1.1%) |
| 18 to 34 Years | 45 (1.5%) | 214 (6.8%) |
| 35 to 64 Years | 39 (0.8%) | 51 (1.1%) |
| 65 to 74 Years | 70 (3.6%) | 21 (1.1%) |
| 75 Years and over | 22 (2.2%) | 58 (4.8%) |
Disability Class: Cognitive Difficulty
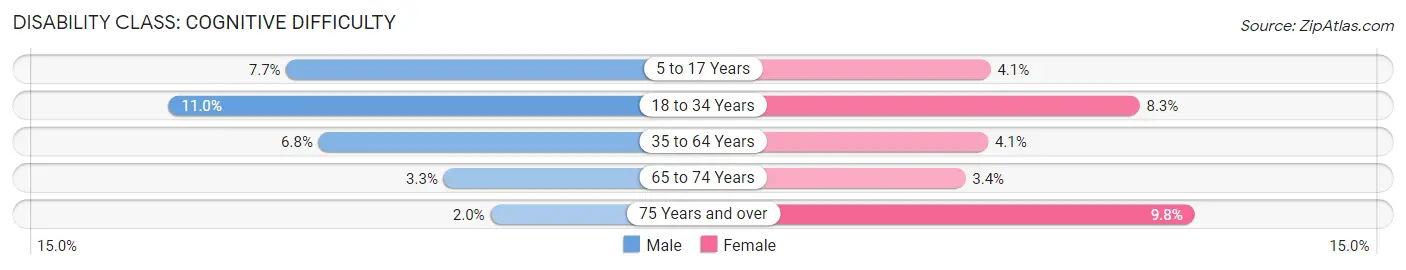
| Age Bracket | Male | Female |
| 5 to 17 Years | 129 (7.7%) | 71 (4.1%) |
| 18 to 34 Years | 320 (11.0%) | 260 (8.3%) |
| 35 to 64 Years | 323 (6.8%) | 191 (4.1%) |
| 65 to 74 Years | 64 (3.3%) | 63 (3.4%) |
| 75 Years and over | 20 (2.0%) | 120 (9.8%) |
Disability Class: Ambulatory Difficulty
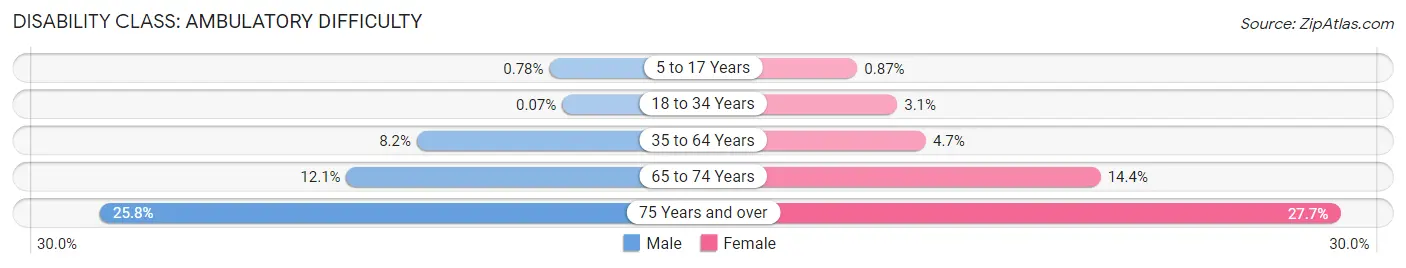
| Age Bracket | Male | Female |
| 5 to 17 Years | 13 (0.8%) | 15 (0.9%) |
| 18 to 34 Years | 2 (0.1%) | 97 (3.1%) |
| 35 to 64 Years | 387 (8.2%) | 220 (4.7%) |
| 65 to 74 Years | 232 (12.1%) | 264 (14.4%) |
| 75 Years and over | 254 (25.8%) | 339 (27.7%) |
Disability Class: Self-Care Difficulty
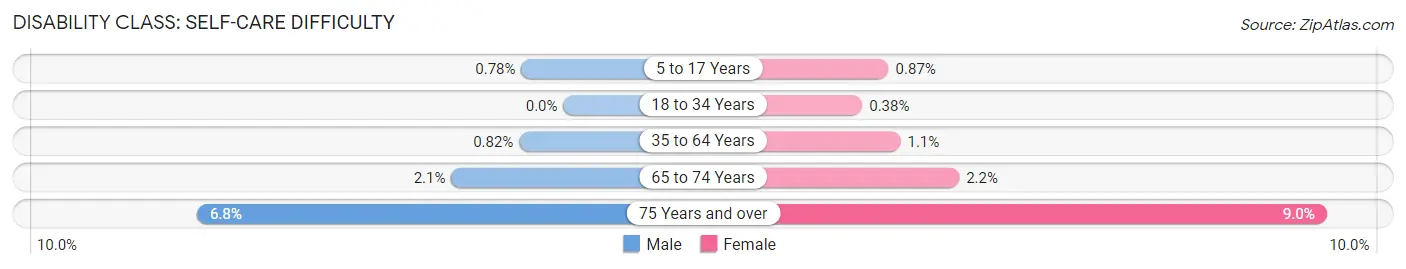
| Age Bracket | Male | Female |
| 5 to 17 Years | 13 (0.8%) | 15 (0.9%) |
| 18 to 34 Years | 0 (0.0%) | 12 (0.4%) |
| 35 to 64 Years | 39 (0.8%) | 51 (1.1%) |
| 65 to 74 Years | 40 (2.1%) | 40 (2.2%) |
| 75 Years and over | 67 (6.8%) | 110 (9.0%) |
Technology Access in Lawrence County
Computing Device Access in Lawrence County
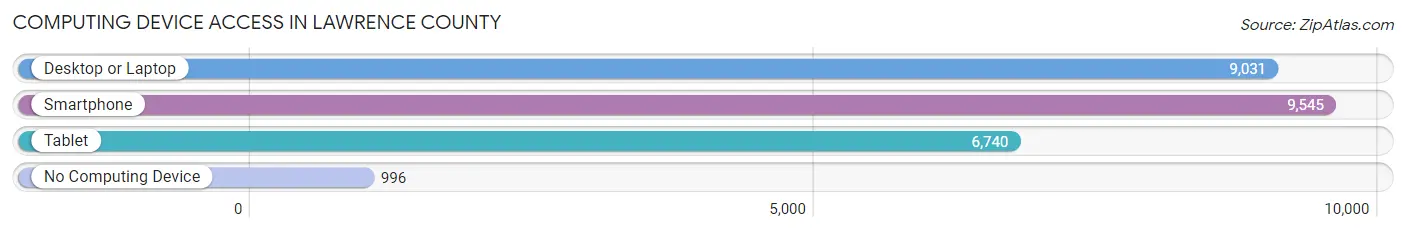
| Device Type | # Households | % Households |
| Desktop or Laptop | 9,031 | 79.3% |
| Smartphone | 9,545 | 83.8% |
| Tablet | 6,740 | 59.2% |
| No Computing Device | 996 | 8.7% |
| Total | 11,392 | 100.0% |
Internet Access in Lawrence County
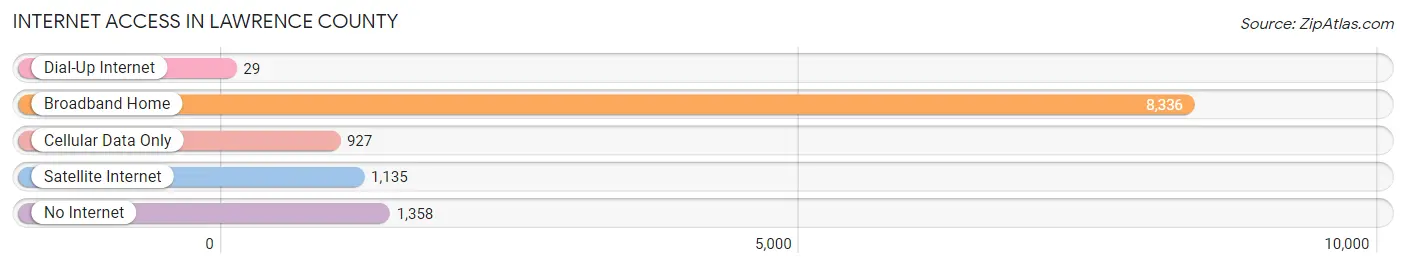
| Internet Type | # Households | % Households |
| Dial-Up Internet | 29 | 0.3% |
| Broadband Home | 8,336 | 73.2% |
| Cellular Data Only | 927 | 8.1% |
| Satellite Internet | 1,135 | 10.0% |
| No Internet | 1,358 | 11.9% |
| Total | 11,392 | 100.0% |
Lawrence County Summary
Lawrence County, South Dakota is located in the southwestern corner of the state and is bordered by Butte County to the north, Meade County to the east, Pennington County to the south, and Wyoming to the west. The county seat is Deadwood, and the largest city is Spearfish. The county was created in 1875 and named after Civil War hero James Lawrence. As of the 2010 census, the population was 24,097.
Geography
Lawrence County is located in the Black Hills region of South Dakota. The county is mostly mountainous, with the highest point being Black Elk Peak at 7,242 feet. The county is home to several lakes, including Pactola Reservoir, Sheridan Lake, and Deerfield Lake. The county is also home to several state parks, including Spearfish Canyon State Park, Custer State Park, and Black Hills National Forest.
The county has a total area of 1,845 square miles, of which 1,843 square miles is land and 2.2 square miles is water.
Economy
The economy of Lawrence County is largely based on tourism, with the county being home to several popular attractions, including Mount Rushmore, Crazy Horse Memorial, and the Black Hills National Forest. The county is also home to several ski resorts, including Terry Peak Ski Area and Deer Mountain Ski Area.
The county is also home to several large employers, including Black Hills Corporation, Spearfish School District, and the City of Deadwood.
Demographics
As of the 2010 census, there were 24,097 people, 9,845 households, and 6,541 families living in the county. The population density was 13 people per square mile. The racial makeup of the county was 94.3% White, 0.7% Native American, 0.4% Asian, 0.2% Black or African American, 0.1% Pacific Islander, 2.7% from other races, and 1.7% from two or more races. Hispanic or Latino of any race were 5.2% of the population.
The median income for a household in the county was $41,945 and the median income for a family was $50,945. The per capita income for the county was $21,945. About 8.7% of families and 12.2% of the population were below the poverty line, including 16.2% of those under age 18 and 8.2% of those age 65 or over.
Conclusion
Lawrence County, South Dakota is a beautiful and diverse county located in the Black Hills region of the state. The county is home to several popular attractions, including Mount Rushmore, Crazy Horse Memorial, and the Black Hills National Forest. The economy of the county is largely based on tourism, with several large employers also located in the county. As of the 2010 census, the population of the county was 24,097, with a median household income of $41,945 and a median family income of $50,945.
Common Questions
What is the Total Population of Lawrence County?
Total Population of Lawrence County is 26,047.
What is the Total Male Population of Lawrence County?
Total Male Population of Lawrence County is 12,840.
What is the Total Female Population of Lawrence County?
Total Female Population of Lawrence County is 13,207.
What is the Ratio of Males per 100 Females in Lawrence County?
There are 97.22 Males per 100 Females in Lawrence County.
What is the Ratio of Females per 100 Males in Lawrence County?
There are 102.86 Females per 100 Males in Lawrence County.
What is the Median Population Age in Lawrence County?
Median Population Age in Lawrence County is 43.0 Years.
What is the Average Family Size in Lawrence County
Average Family Size in Lawrence County is 2.9 People.
What is the Average Household Size in Lawrence County
Average Household Size in Lawrence County is 2.2 People.
What is Per Capita Income in Lawrence County?
Per Capita income in Lawrence County is $41,086.
What is the Median Family Income in Lawrence County?
Median Family Income in Lawrence County is $85,844.
What is the Median Household income in Lawrence County?
Median Household Income in Lawrence County is $62,977.
What is Income or Wage Gap in Lawrence County?
Income or Wage Gap in Lawrence County is 35.1%.
Women in Lawrence County earn 64.9 cents for every dollar earned by a man.
What is Family Income Deficit in Lawrence County?
Family Income Deficit in Lawrence County is $8,420.
Families that are below poverty line in Lawrence County earn $8,420 less on average than the poverty threshold level.
What is Inequality or Gini Index in Lawrence County?
Inequality or Gini Index in Lawrence County is 0.47.
How Large is the Labor Force in Lawrence County?
There are 14,702 People in the Labor Forcein in Lawrence County.
What is the Percentage of People in the Labor Force in Lawrence County?
65.9% of People are in the Labor Force in Lawrence County.
What is the Unemployment Rate in Lawrence County?
Unemployment Rate in Lawrence County is 2.5%.