Lake County, SD
Lake County Map
Lake County Overview
11,207
TOTAL POPULATION
5,839
MALE POPULATION
5,368
FEMALE POPULATION
108.77
MALES / 100 FEMALES
91.93
FEMALES / 100 MALES
44.3
MEDIAN AGE
3.0
AVG FAMILY SIZE
2.4
AVG HOUSEHOLD SIZE
$44,809
PER CAPITA INCOME
$90,750
AVG FAMILY INCOME
$74,884
AVG HOUSEHOLD INCOME
19.9%
WAGE / INCOME GAP [ % ]
80.1¢/ $1
WAGE / INCOME GAP [ $ ]
0.48
INEQUALITY / GINI INDEX
6,162
LABOR FORCE [ PEOPLE ]
66.9%
PERCENT IN LABOR FORCE
1.6%
UNEMPLOYMENT RATE
Lake County Area Codes
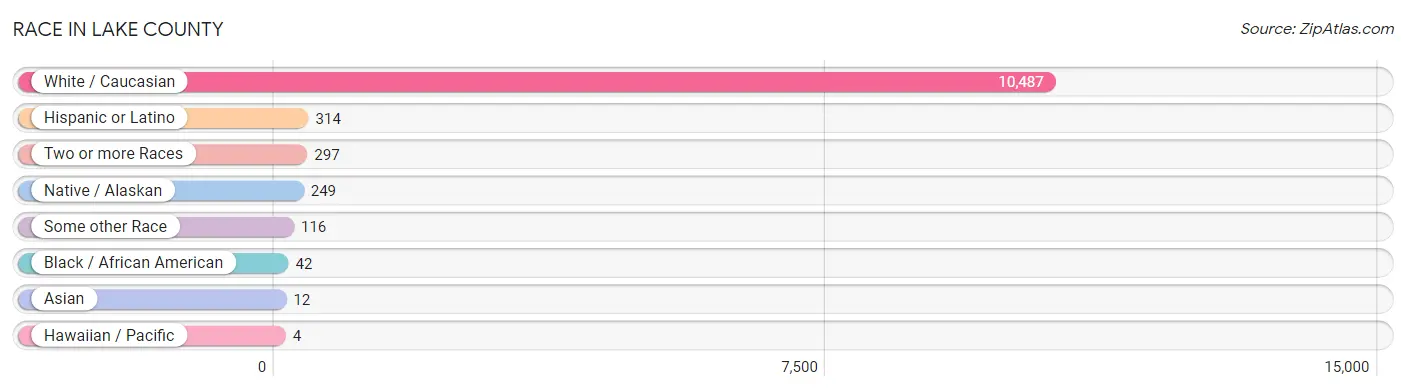
Race in Lake County
The most populous races in Lake County are White / Caucasian (10,487 | 93.6%), Hispanic or Latino (314 | 2.8%), and Two or more Races (297 | 2.6%).
| Race | # Population | % Population |
| Asian | 12 | 0.1% |
| Black / African American | 42 | 0.4% |
| Hawaiian / Pacific | 4 | 0.0% |
| Hispanic or Latino | 314 | 2.8% |
| Native / Alaskan | 249 | 2.2% |
| White / Caucasian | 10,487 | 93.6% |
| Two or more Races | 297 | 2.6% |
| Some other Race | 116 | 1.0% |
| Total | 11,207 | 100.0% |
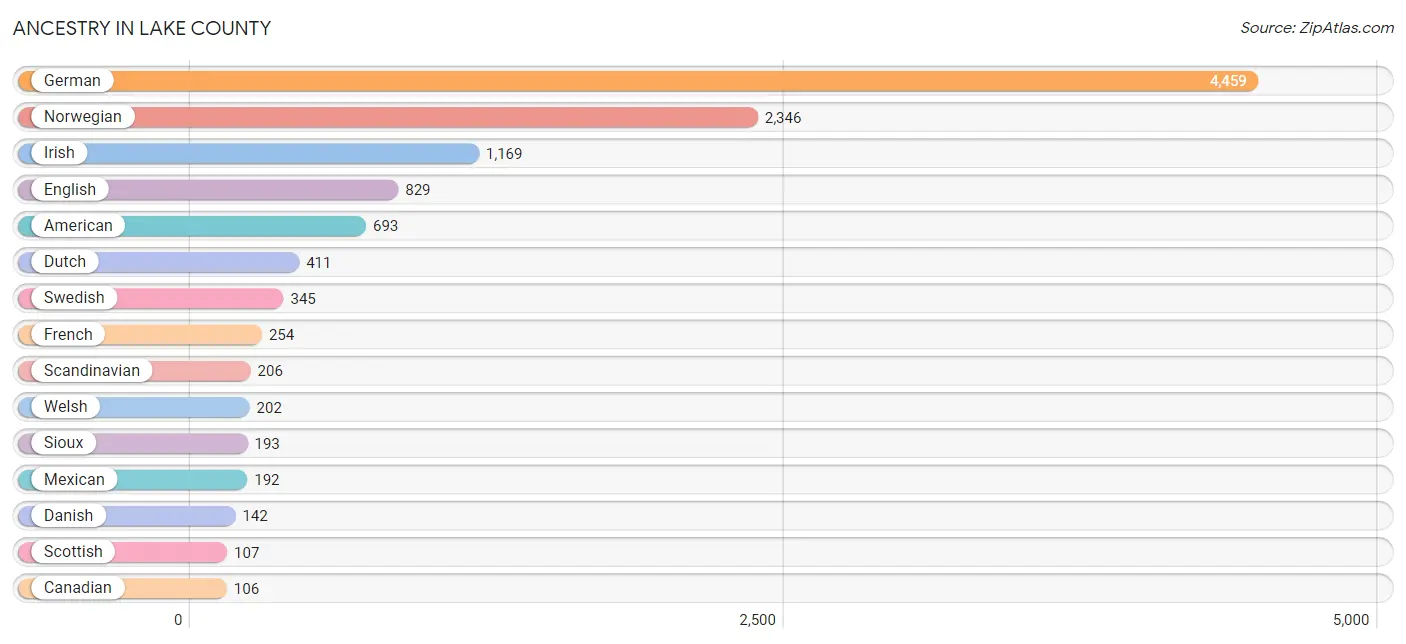
Ancestry in Lake County
The most populous ancestries reported in Lake County are German (4,459 | 39.8%), Norwegian (2,346 | 20.9%), Irish (1,169 | 10.4%), English (829 | 7.4%), and American (693 | 6.2%), together accounting for 84.7% of all Lake County residents.
| Ancestry | # Population | % Population |
| African | 6 | 0.1% |
| American | 693 | 6.2% |
| Arab | 31 | 0.3% |
| Argentinean | 6 | 0.1% |
| Bhutanese | 4 | 0.0% |
| Canadian | 106 | 0.9% |
| Central American | 29 | 0.3% |
| Cherokee | 80 | 0.7% |
| Chippewa | 2 | 0.0% |
| Colombian | 2 | 0.0% |
| Cuban | 15 | 0.1% |
| Czech | 42 | 0.4% |
| Czechoslovakian | 8 | 0.1% |
| Danish | 142 | 1.3% |
| Dutch | 411 | 3.7% |
| Eastern European | 21 | 0.2% |
| English | 829 | 7.4% |
| Ethiopian | 5 | 0.0% |
| European | 61 | 0.5% |
| Finnish | 74 | 0.7% |
| French | 254 | 2.3% |
| French Canadian | 25 | 0.2% |
| German | 4,459 | 39.8% |
| German Russian | 1 | 0.0% |
| Guatemalan | 7 | 0.1% |
| Hungarian | 14 | 0.1% |
| Icelander | 5 | 0.0% |
| Irish | 1,169 | 10.4% |
| Italian | 99 | 0.9% |
| Lebanese | 31 | 0.3% |
| Luxembourger | 2 | 0.0% |
| Mexican | 192 | 1.7% |
| Nicaraguan | 22 | 0.2% |
| Northern European | 2 | 0.0% |
| Norwegian | 2,346 | 20.9% |
| Pakistani | 8 | 0.1% |
| Polish | 63 | 0.6% |
| Puerto Rican | 34 | 0.3% |
| Russian | 83 | 0.7% |
| Scandinavian | 206 | 1.8% |
| Scotch-Irish | 69 | 0.6% |
| Scottish | 107 | 0.9% |
| Sioux | 193 | 1.7% |
| South American | 8 | 0.1% |
| Subsaharan African | 11 | 0.1% |
| Swedish | 345 | 3.1% |
| Swiss | 106 | 0.9% |
| Thai | 8 | 0.1% |
| Tongan | 4 | 0.0% |
| Ukrainian | 5 | 0.0% |
| Welsh | 202 | 1.8% | View All 51 Rows |
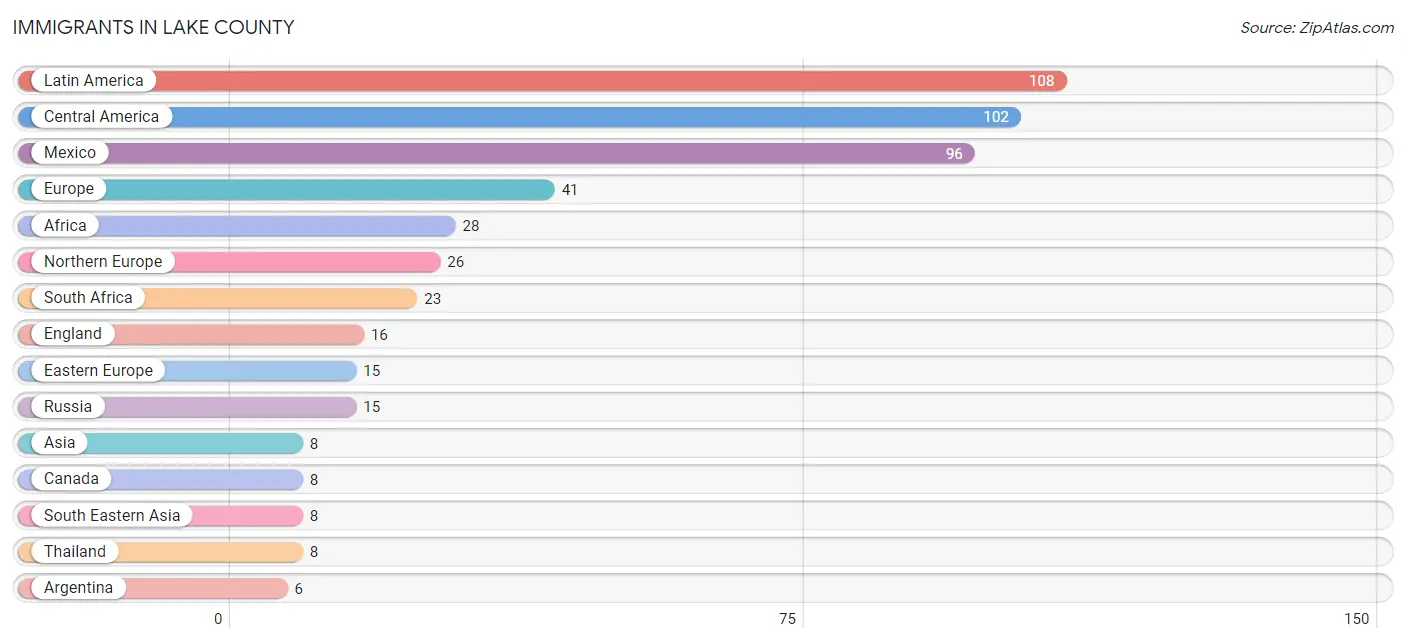
Immigrants in Lake County
The most numerous immigrant groups reported in Lake County came from Latin America (108 | 1.0%), Central America (102 | 0.9%), Mexico (96 | 0.9%), Europe (41 | 0.4%), and Africa (28 | 0.3%), together accounting for 3.4% of all Lake County residents.
| Immigration Origin | # Population | % Population |
| Africa | 28 | 0.3% |
| Argentina | 6 | 0.1% |
| Asia | 8 | 0.1% |
| Canada | 8 | 0.1% |
| Central America | 102 | 0.9% |
| Eastern Africa | 5 | 0.0% |
| Eastern Europe | 15 | 0.1% |
| England | 16 | 0.1% |
| Ethiopia | 5 | 0.0% |
| Europe | 41 | 0.4% |
| Latin America | 108 | 1.0% |
| Mexico | 96 | 0.9% |
| Nicaragua | 6 | 0.1% |
| Northern Europe | 26 | 0.2% |
| Russia | 15 | 0.1% |
| South Africa | 23 | 0.2% |
| South America | 6 | 0.1% |
| South Eastern Asia | 8 | 0.1% |
| Thailand | 8 | 0.1% | View All 19 Rows |
Sex and Age in Lake County
Sex and Age in Lake County
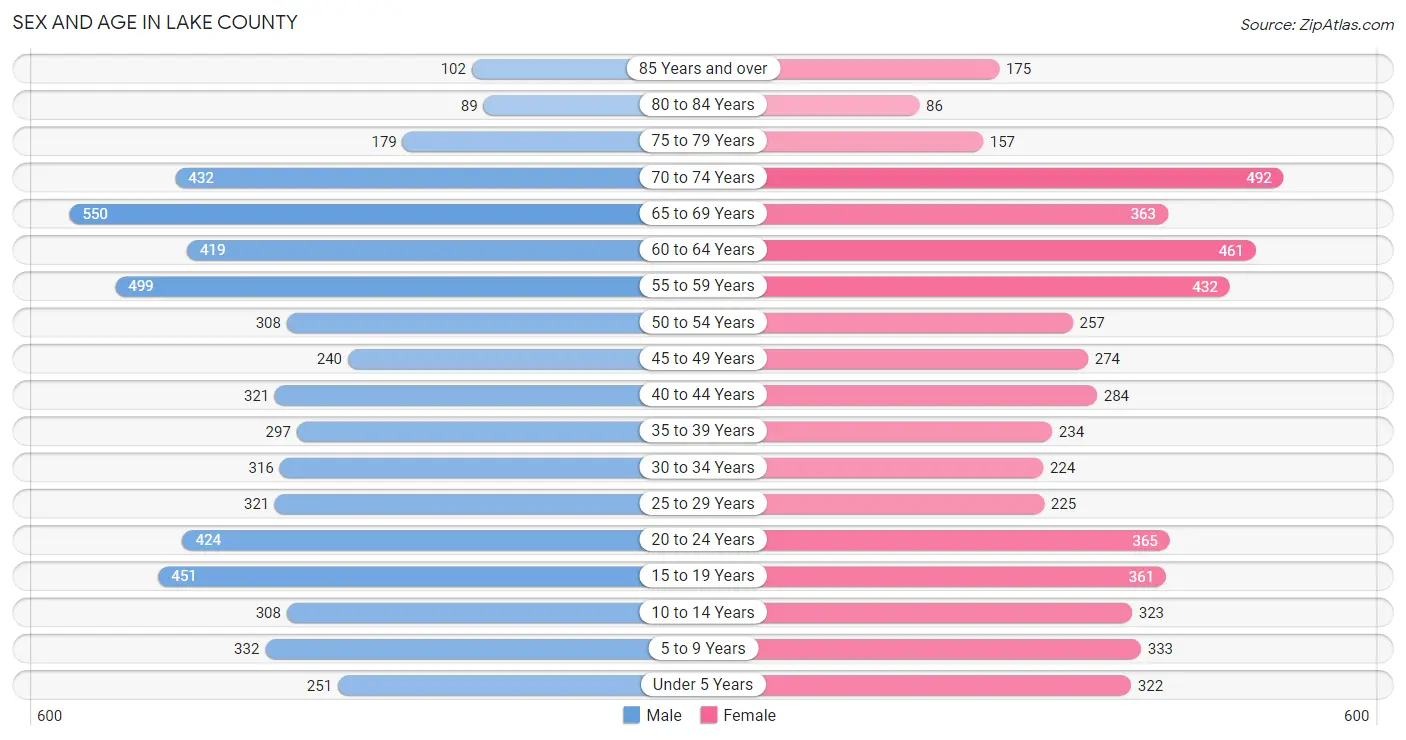
The most populous age groups in Lake County are 65 to 69 Years (550 | 9.4%) for men and 70 to 74 Years (492 | 9.2%) for women.
| Age Bracket | Male | Female |
| Under 5 Years | 251 (4.3%) | 322 (6.0%) |
| 5 to 9 Years | 332 (5.7%) | 333 (6.2%) |
| 10 to 14 Years | 308 (5.3%) | 323 (6.0%) |
| 15 to 19 Years | 451 (7.7%) | 361 (6.7%) |
| 20 to 24 Years | 424 (7.3%) | 365 (6.8%) |
| 25 to 29 Years | 321 (5.5%) | 225 (4.2%) |
| 30 to 34 Years | 316 (5.4%) | 224 (4.2%) |
| 35 to 39 Years | 297 (5.1%) | 234 (4.4%) |
| 40 to 44 Years | 321 (5.5%) | 284 (5.3%) |
| 45 to 49 Years | 240 (4.1%) | 274 (5.1%) |
| 50 to 54 Years | 308 (5.3%) | 257 (4.8%) |
| 55 to 59 Years | 499 (8.6%) | 432 (8.1%) |
| 60 to 64 Years | 419 (7.2%) | 461 (8.6%) |
| 65 to 69 Years | 550 (9.4%) | 363 (6.8%) |
| 70 to 74 Years | 432 (7.4%) | 492 (9.2%) |
| 75 to 79 Years | 179 (3.1%) | 157 (2.9%) |
| 80 to 84 Years | 89 (1.5%) | 86 (1.6%) |
| 85 Years and over | 102 (1.8%) | 175 (3.3%) |
| Total | 5,839 (100.0%) | 5,368 (100.0%) |
Families and Households in Lake County
Median Family Size in Lake County
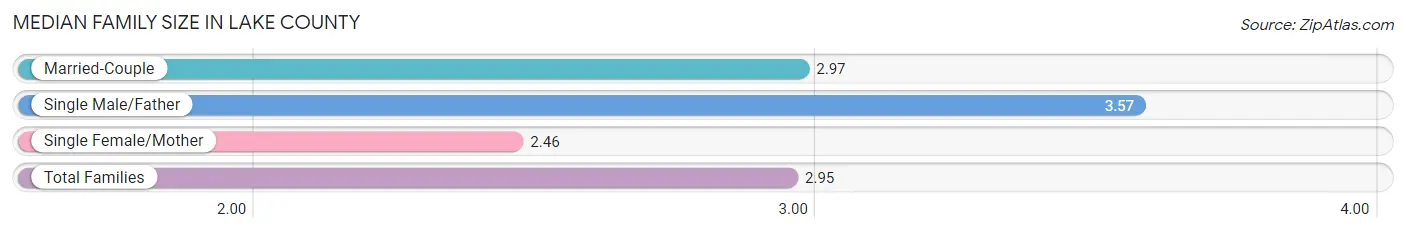
The median family size in Lake County is 2.95 persons per family, with single male/father families (195 | 6.7%) accounting for the largest median family size of 3.57 persons per family. On the other hand, single female/mother families (380 | 13.1%) represent the smallest median family size with 2.46 persons per family.
| Family Type | # Families | Family Size |
| Married-Couple | 2,318 (80.1%) | 2.97 |
| Single Male/Father | 195 (6.7%) | 3.57 |
| Single Female/Mother | 380 (13.1%) | 2.46 |
| Total Families | 2,893 (100.0%) | 2.95 |
Median Household Size in Lake County
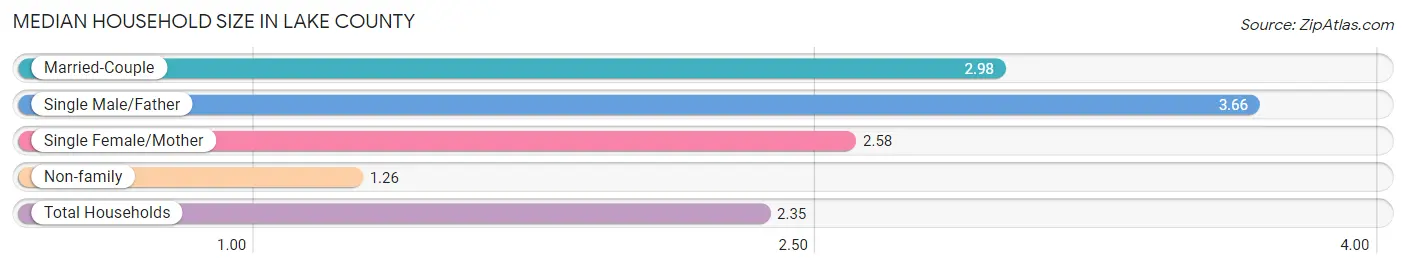
The median household size in Lake County is 2.35 persons per household, with single male/father households (195 | 4.3%) accounting for the largest median household size of 3.66 persons per household. non-family households (1,659 | 36.4%) represent the smallest median household size with 1.26 persons per household.
| Household Type | # Households | Household Size |
| Married-Couple | 2,318 (50.9%) | 2.98 |
| Single Male/Father | 195 (4.3%) | 3.66 |
| Single Female/Mother | 380 (8.4%) | 2.58 |
| Non-family | 1,659 (36.4%) | 1.26 |
| Total Households | 4,552 (100.0%) | 2.35 |
Household Size by Marriage Status in Lake County
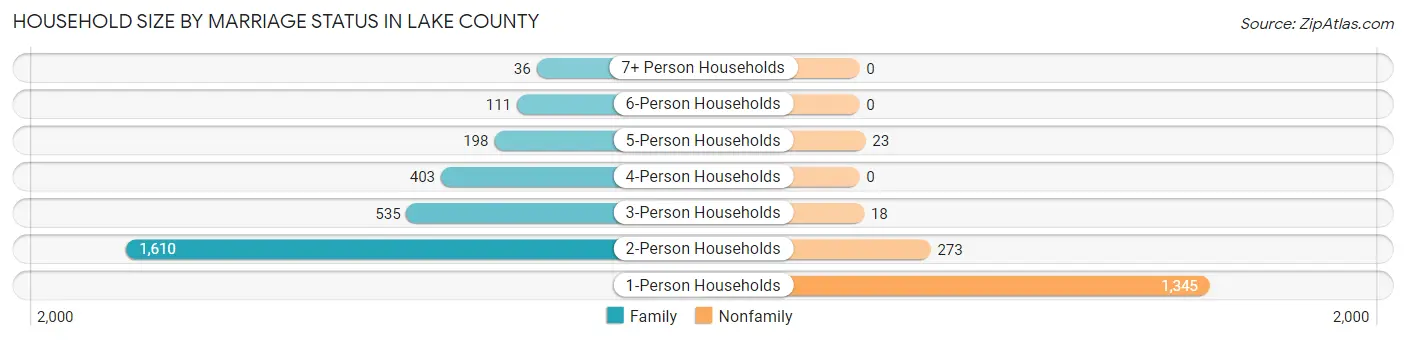
Out of a total of 4,552 households in Lake County, 2,893 (63.5%) are family households, while 1,659 (36.4%) are nonfamily households. The most numerous type of family households are 2-person households, comprising 1,610, and the most common type of nonfamily households are 1-person households, comprising 1,345.
| Household Size | Family Households | Nonfamily Households |
| 1-Person Households | - | 1,345 (29.5%) |
| 2-Person Households | 1,610 (35.4%) | 273 (6.0%) |
| 3-Person Households | 535 (11.7%) | 18 (0.4%) |
| 4-Person Households | 403 (8.8%) | 0 (0.0%) |
| 5-Person Households | 198 (4.3%) | 23 (0.5%) |
| 6-Person Households | 111 (2.4%) | 0 (0.0%) |
| 7+ Person Households | 36 (0.8%) | 0 (0.0%) |
| Total | 2,893 (63.5%) | 1,659 (36.4%) |
Female Fertility in Lake County
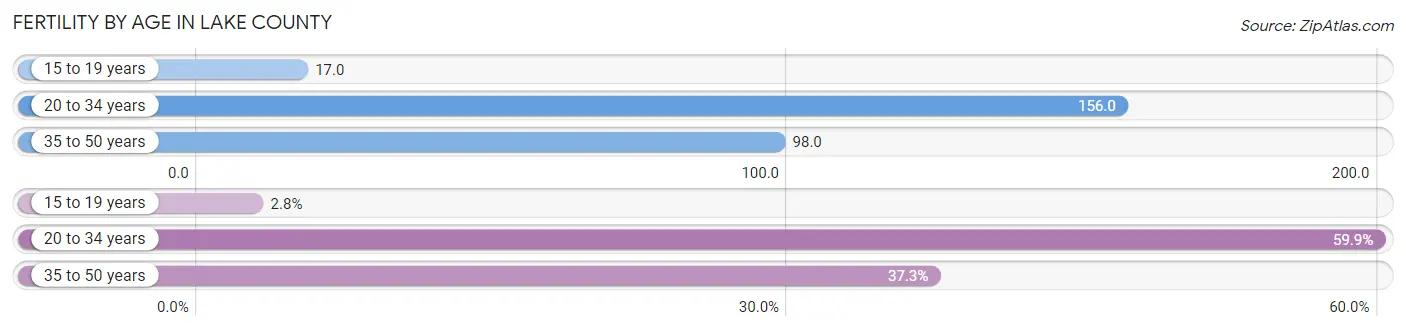
Fertility by Age in Lake County
Average fertility rate in Lake County is 107.0 births per 1,000 women. Women in the age bracket of 20 to 34 years have the highest fertility rate with 156.0 births per 1,000 women. Women in the age bracket of 20 to 34 years acount for 59.9% of all women with births.
| Age Bracket | Women with Births | Births / 1,000 Women |
| 15 to 19 years | 6 (2.8%) | 17.0 |
| 20 to 34 years | 127 (59.9%) | 156.0 |
| 35 to 50 years | 79 (37.3%) | 98.0 |
| Total | 212 (100.0%) | 107.0 |
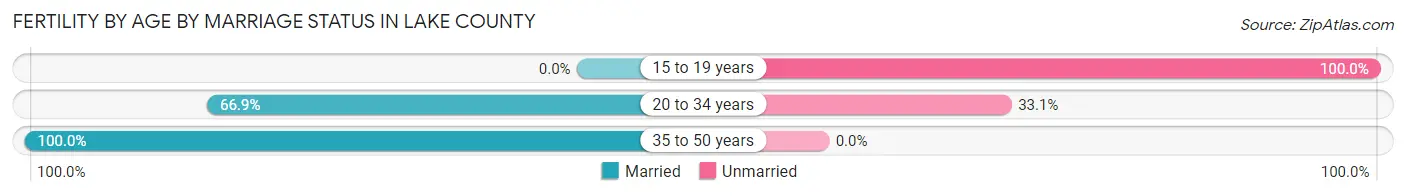
Fertility by Age by Marriage Status in Lake County
77.4% of women with births (212) in Lake County are married. The highest percentage of unmarried women with births falls into 15 to 19 years age bracket with 100.0% of them unmarried at the time of birth, while the lowest percentage of unmarried women with births belong to 35 to 50 years age bracket with 0.0% of them unmarried.
| Age Bracket | Married | Unmarried |
| 15 to 19 years | 0 (0.0%) | 6 (100.0%) |
| 20 to 34 years | 85 (66.9%) | 42 (33.1%) |
| 35 to 50 years | 79 (100.0%) | 0 (0.0%) |
| Total | 164 (77.4%) | 48 (22.6%) |
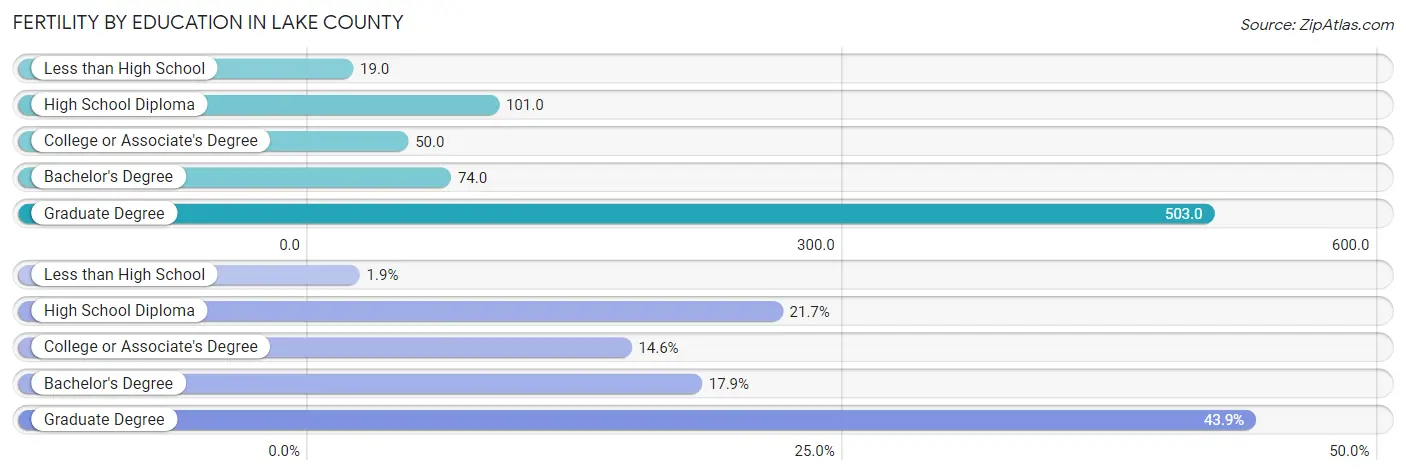
Fertility by Education in Lake County
Average fertility rate in Lake County is 107.0 births per 1,000 women. Women with the education attainment of graduate degree have the highest fertility rate of 503.0 births per 1,000 women, while women with the education attainment of less than high school have the lowest fertility at 19.0 births per 1,000 women. Women with the education attainment of graduate degree represent 43.9% of all women with births.
| Educational Attainment | Women with Births | Births / 1,000 Women |
| Less than High School | 4 (1.9%) | 19.0 |
| High School Diploma | 46 (21.7%) | 101.0 |
| College or Associate's Degree | 31 (14.6%) | 50.0 |
| Bachelor's Degree | 38 (17.9%) | 74.0 |
| Graduate Degree | 93 (43.9%) | 503.0 |
| Total | 212 (100.0%) | 107.0 |
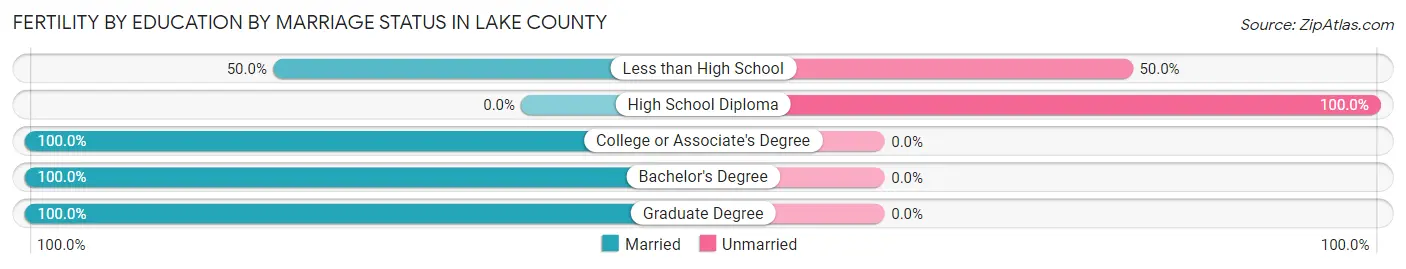
Fertility by Education by Marriage Status in Lake County
22.6% of women with births in Lake County are unmarried. Women with the educational attainment of college or associate's degree are most likely to be married with 100.0% of them married at childbirth, while women with the educational attainment of high school diploma are least likely to be married with 100.0% of them unmarried at childbirth.
| Educational Attainment | Married | Unmarried |
| Less than High School | 2 (50.0%) | 2 (50.0%) |
| High School Diploma | 0 (0.0%) | 46 (100.0%) |
| College or Associate's Degree | 31 (100.0%) | 0 (0.0%) |
| Bachelor's Degree | 38 (100.0%) | 0 (0.0%) |
| Graduate Degree | 93 (100.0%) | 0 (0.0%) |
| Total | 164 (77.4%) | 48 (22.6%) |
Income in Lake County
Income Overview in Lake County
Per Capita Income in Lake County is $44,809, while median incomes of families and households are $90,750 and $74,884 respectively.
| Characteristic | Number | Measure |
| Per Capita Income | 11,207 | $44,809 |
| Median Family Income | 2,893 | $90,750 |
| Mean Family Income | 2,893 | $127,922 |
| Median Household Income | 4,552 | $74,884 |
| Mean Household Income | 4,552 | $105,315 |
| Income Deficit | 2,893 | $0 |
| Wage / Income Gap (%) | 11,207 | 19.93% |
| Wage / Income Gap ($) | 11,207 | 80.07¢ per $1 |
| Gini / Inequality Index | 11,207 | 0.48 |
Earnings by Sex in Lake County
Average Earnings in Lake County are $37,096, $42,063 for men and $33,681 for women, a difference of 19.9%.
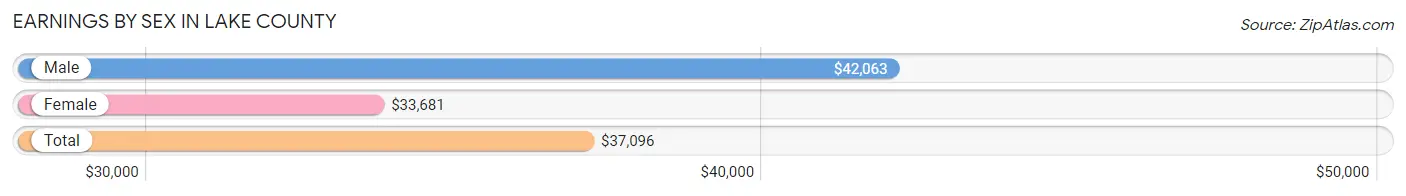
| Sex | Number | Average Earnings |
| Male | 3,803 (56.3%) | $42,063 |
| Female | 2,952 (43.7%) | $33,681 |
| Total | 6,755 (100.0%) | $37,096 |
Earnings by Sex by Income Bracket in Lake County
The most common earnings brackets in Lake County are $100,000+ for men (574 | 15.1%) and $30,000 to $34,999 for women (312 | 10.6%).
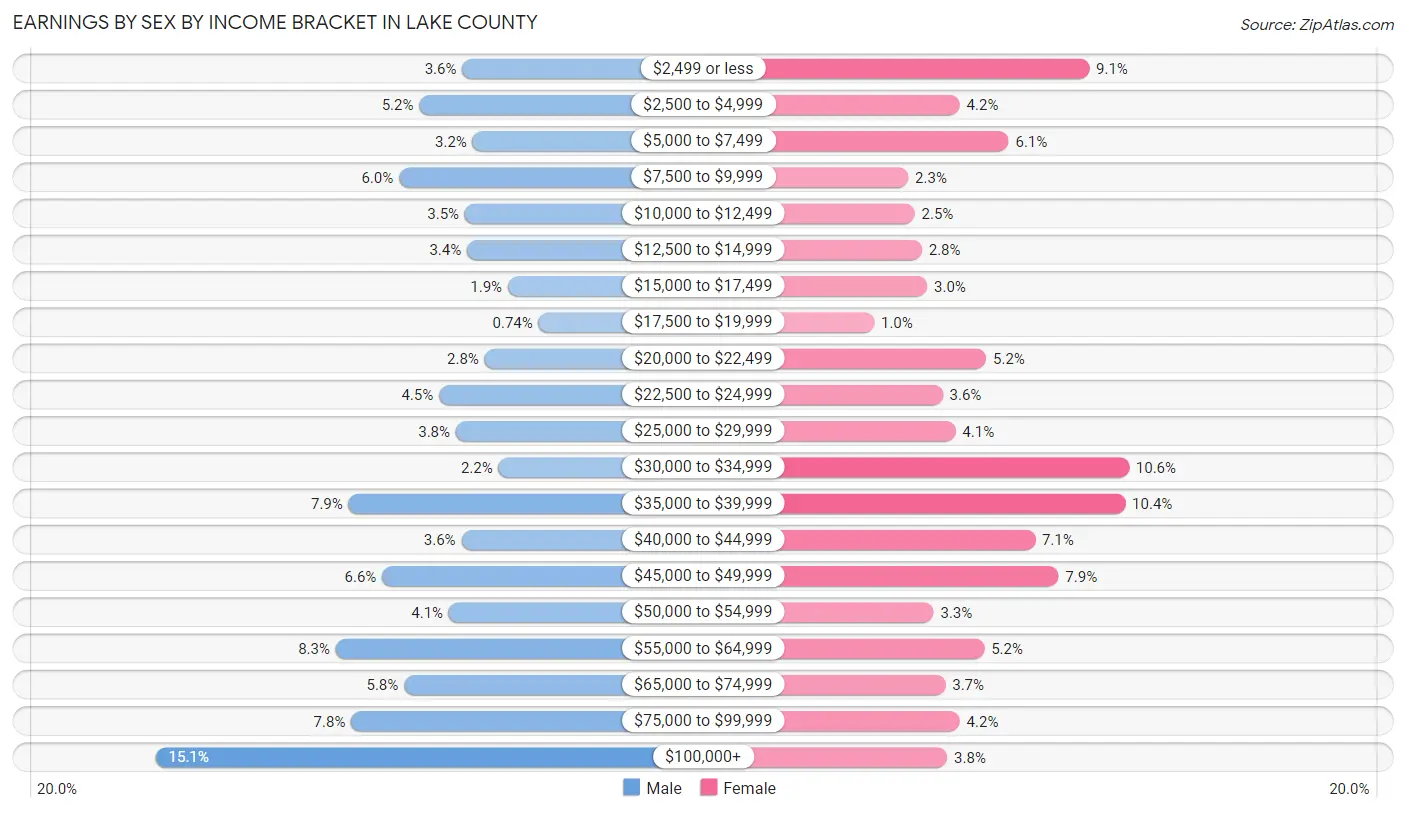
| Income | Male | Female |
| $2,499 or less | 137 (3.6%) | 268 (9.1%) |
| $2,500 to $4,999 | 198 (5.2%) | 125 (4.2%) |
| $5,000 to $7,499 | 122 (3.2%) | 179 (6.1%) |
| $7,500 to $9,999 | 227 (6.0%) | 68 (2.3%) |
| $10,000 to $12,499 | 133 (3.5%) | 75 (2.5%) |
| $12,500 to $14,999 | 130 (3.4%) | 83 (2.8%) |
| $15,000 to $17,499 | 72 (1.9%) | 89 (3.0%) |
| $17,500 to $19,999 | 28 (0.7%) | 30 (1.0%) |
| $20,000 to $22,499 | 105 (2.8%) | 154 (5.2%) |
| $22,500 to $24,999 | 170 (4.5%) | 106 (3.6%) |
| $25,000 to $29,999 | 146 (3.8%) | 120 (4.1%) |
| $30,000 to $34,999 | 85 (2.2%) | 312 (10.6%) |
| $35,000 to $39,999 | 299 (7.9%) | 308 (10.4%) |
| $40,000 to $44,999 | 138 (3.6%) | 208 (7.0%) |
| $45,000 to $49,999 | 251 (6.6%) | 234 (7.9%) |
| $50,000 to $54,999 | 156 (4.1%) | 96 (3.3%) |
| $55,000 to $64,999 | 317 (8.3%) | 152 (5.1%) |
| $65,000 to $74,999 | 220 (5.8%) | 109 (3.7%) |
| $75,000 to $99,999 | 295 (7.8%) | 125 (4.2%) |
| $100,000+ | 574 (15.1%) | 111 (3.8%) |
| Total | 3,803 (100.0%) | 2,952 (100.0%) |
Earnings by Sex by Educational Attainment in Lake County
Average earnings in Lake County are $50,011 for men and $36,382 for women, a difference of 27.3%. Men with an educational attainment of bachelor's degree enjoy the highest average annual earnings of $63,500, while those with less than high school education earn the least with $37,889. Women with an educational attainment of graduate degree earn the most with the average annual earnings of $60,208, while those with high school diploma education have the smallest earnings of $26,226.
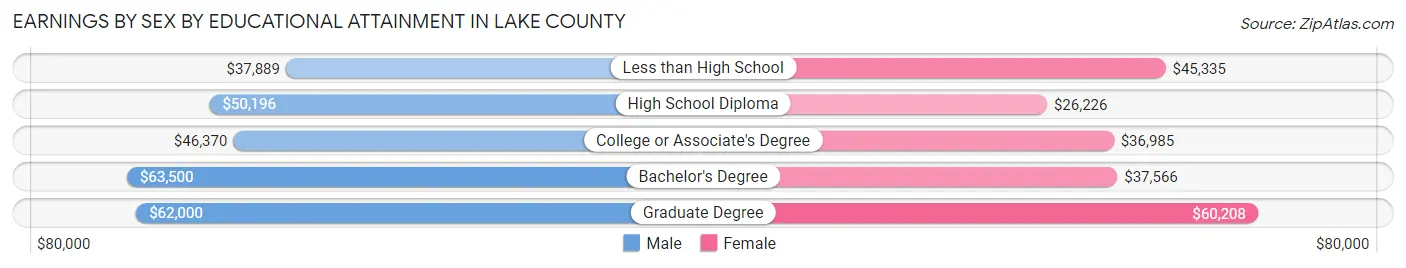
| Educational Attainment | Male Income | Female Income |
| Less than High School | $37,889 | $45,335 |
| High School Diploma | $50,196 | $26,226 |
| College or Associate's Degree | $46,370 | $36,985 |
| Bachelor's Degree | $63,500 | $37,566 |
| Graduate Degree | $62,000 | $60,208 |
| Total | $50,011 | $36,382 |
Family Income in Lake County
Family Income Brackets in Lake County
According to the Lake County family income data, there are 796 families falling into the $100,000 to $149,999 income range, which is the most common income bracket and makes up 27.5% of all families. Conversely, the $10,000 to $14,999 income bracket is the least frequent group with only 20 families (0.7%) belonging to this category.
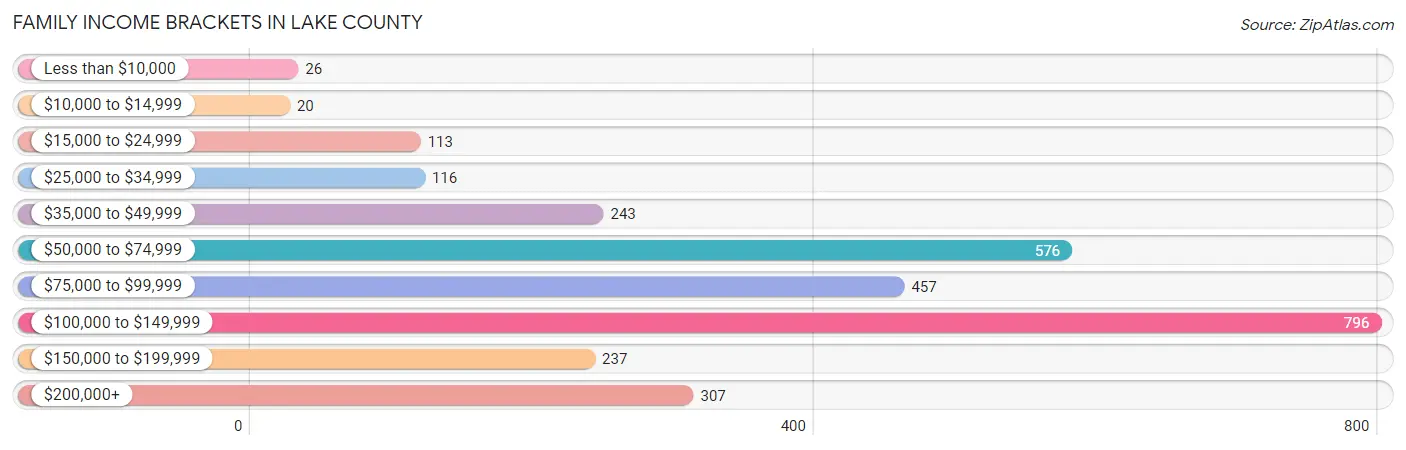
| Income Bracket | # Families | % Families |
| Less than $10,000 | 26 | 0.9% |
| $10,000 to $14,999 | 20 | 0.7% |
| $15,000 to $24,999 | 113 | 3.9% |
| $25,000 to $34,999 | 116 | 4.0% |
| $35,000 to $49,999 | 243 | 8.4% |
| $50,000 to $74,999 | 576 | 19.9% |
| $75,000 to $99,999 | 457 | 15.8% |
| $100,000 to $149,999 | 796 | 27.5% |
| $150,000 to $199,999 | 237 | 8.2% |
| $200,000+ | 307 | 10.6% |
Family Income by Famaliy Size in Lake County
3-person families (512 | 17.7%) account for the highest median family income in Lake County with $108,810 per family, while 2-person families (1,647 | 56.9%) have the highest median income of $43,590 per family member.
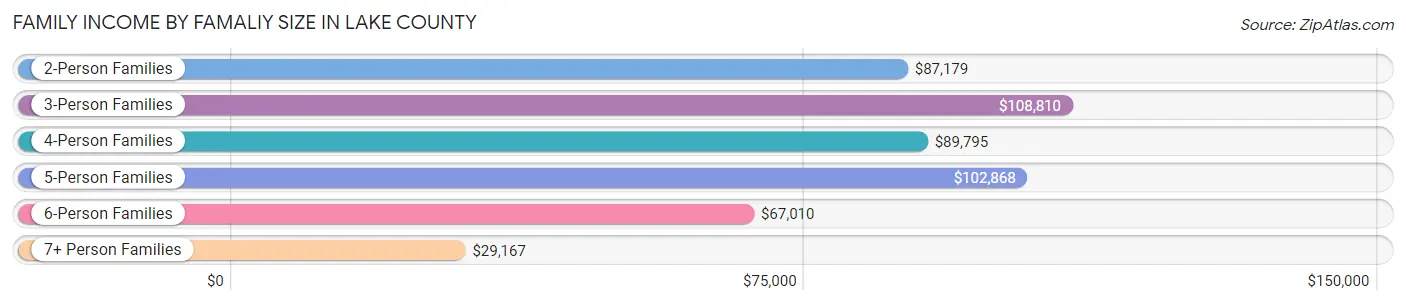
| Income Bracket | # Families | Median Income |
| 2-Person Families | 1,647 (56.9%) | $87,179 |
| 3-Person Families | 512 (17.7%) | $108,810 |
| 4-Person Families | 391 (13.5%) | $89,795 |
| 5-Person Families | 207 (7.2%) | $102,868 |
| 6-Person Families | 108 (3.7%) | $67,010 |
| 7+ Person Families | 28 (1.0%) | $29,167 |
| Total | 2,893 (100.0%) | $90,750 |
Family Income by Number of Earners in Lake County
The median family income in Lake County is $90,750, with families comprising 3+ earners (418) having the highest median family income of $107,619, while families with no earners (448) have the lowest median family income of $54,500, accounting for 14.4% and 15.5% of families, respectively.
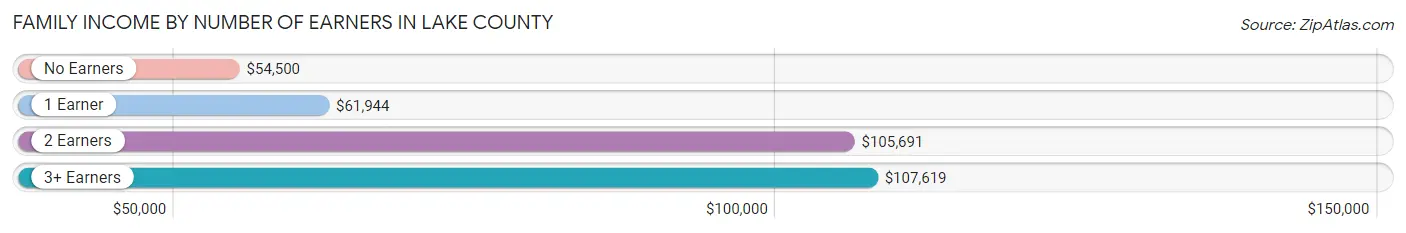
| Number of Earners | # Families | Median Income |
| No Earners | 448 (15.5%) | $54,500 |
| 1 Earner | 656 (22.7%) | $61,944 |
| 2 Earners | 1,371 (47.4%) | $105,691 |
| 3+ Earners | 418 (14.4%) | $107,619 |
| Total | 2,893 (100.0%) | $90,750 |
Household Income in Lake County
Household Income Brackets in Lake County
With 1,056 households falling in the category, the $100,000 to $149,999 income range is the most frequent in Lake County, accounting for 23.2% of all households. In contrast, only 77 households (1.7%) fall into the $10,000 to $14,999 income bracket, making it the least populous group.
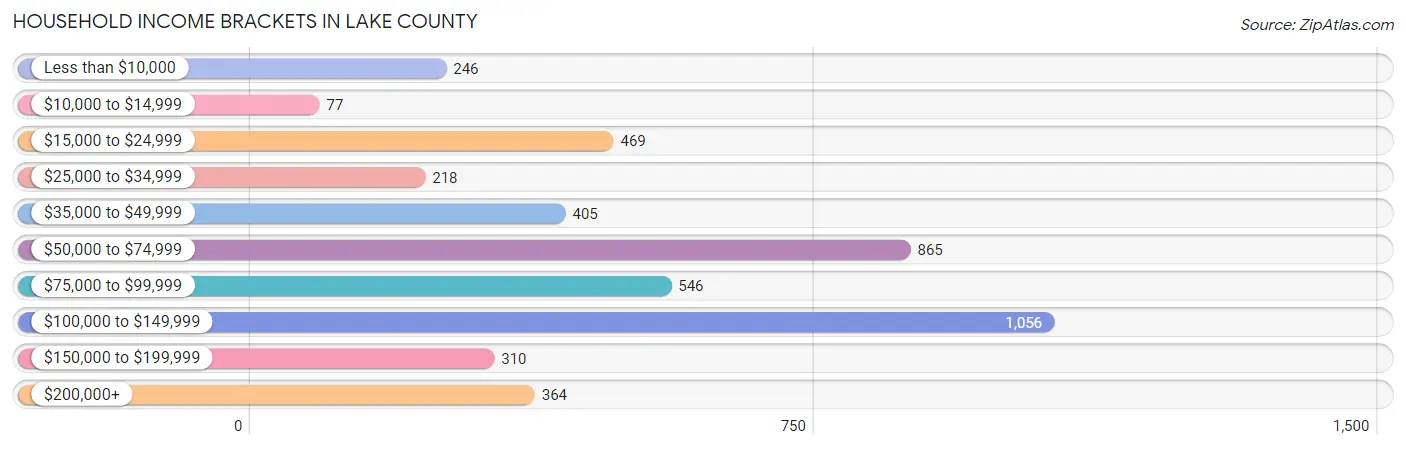
| Income Bracket | # Households | % Households |
| Less than $10,000 | 246 | 5.4% |
| $10,000 to $14,999 | 77 | 1.7% |
| $15,000 to $24,999 | 469 | 10.3% |
| $25,000 to $34,999 | 218 | 4.8% |
| $35,000 to $49,999 | 405 | 8.9% |
| $50,000 to $74,999 | 865 | 19.0% |
| $75,000 to $99,999 | 546 | 12.0% |
| $100,000 to $149,999 | 1,056 | 23.2% |
| $150,000 to $199,999 | 310 | 6.8% |
| $200,000+ | 364 | 8.0% |
Household Income by Householder Age in Lake County
The median household income in Lake County is $74,884, with the highest median household income of $100,481 found in the 45 to 64 years age bracket for the primary householder. A total of 1,724 households (37.9%) fall into this category. Meanwhile, the 15 to 24 years age bracket for the primary householder has the lowest median household income of $15,000, with 256 households (5.6%) in this group.
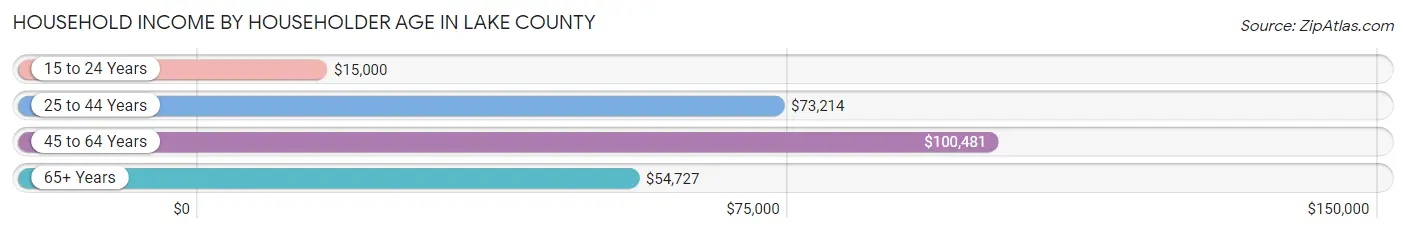
| Income Bracket | # Households | Median Income |
| 15 to 24 Years | 256 (5.6%) | $15,000 |
| 25 to 44 Years | 1,086 (23.9%) | $73,214 |
| 45 to 64 Years | 1,724 (37.9%) | $100,481 |
| 65+ Years | 1,486 (32.6%) | $54,727 |
| Total | 4,552 (100.0%) | $74,884 |
Poverty in Lake County
Income Below Poverty by Sex and Age in Lake County
With 10.3% poverty level for males and 8.9% for females among the residents of Lake County, 5 year old males and 15 year old females are the most vulnerable to poverty, with 68 males (72.3%) and 33 females (55.0%) in their respective age groups living below the poverty level.
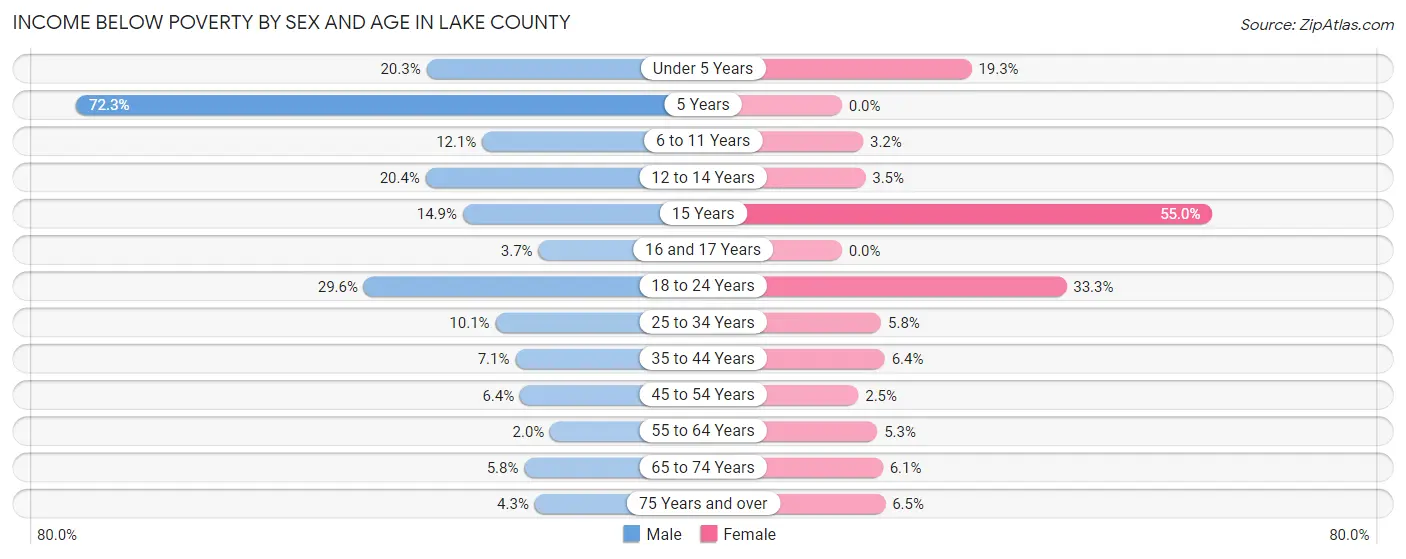
| Age Bracket | Male | Female |
| Under 5 Years | 51 (20.3%) | 62 (19.3%) |
| 5 Years | 68 (72.3%) | 0 (0.0%) |
| 6 to 11 Years | 44 (12.0%) | 15 (3.2%) |
| 12 to 14 Years | 37 (20.4%) | 6 (3.5%) |
| 15 Years | 10 (14.9%) | 33 (55.0%) |
| 16 and 17 Years | 5 (3.7%) | 0 (0.0%) |
| 18 to 24 Years | 128 (29.6%) | 153 (33.3%) |
| 25 to 34 Years | 64 (10.1%) | 26 (5.8%) |
| 35 to 44 Years | 44 (7.1%) | 33 (6.4%) |
| 45 to 54 Years | 35 (6.4%) | 13 (2.5%) |
| 55 to 64 Years | 18 (2.0%) | 47 (5.3%) |
| 65 to 74 Years | 56 (5.8%) | 52 (6.1%) |
| 75 Years and over | 15 (4.3%) | 20 (6.5%) |
| Total | 575 (10.3%) | 460 (8.9%) |
Income Above Poverty by Sex and Age in Lake County
According to the poverty statistics in Lake County, males aged 55 to 64 years and females aged 5 years are the age groups that are most secure financially, with 98.0% of males and 100.0% of females in these age groups living above the poverty line.
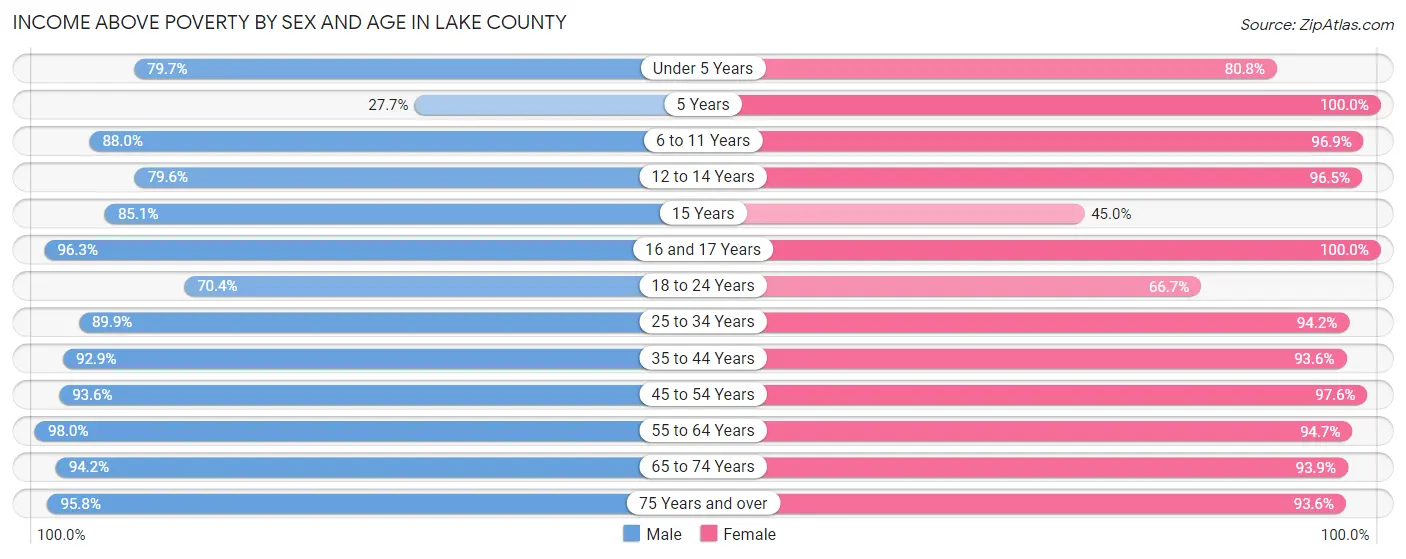
| Age Bracket | Male | Female |
| Under 5 Years | 200 (79.7%) | 260 (80.7%) |
| 5 Years | 26 (27.7%) | 8 (100.0%) |
| 6 to 11 Years | 321 (87.9%) | 461 (96.9%) |
| 12 to 14 Years | 144 (79.6%) | 166 (96.5%) |
| 15 Years | 57 (85.1%) | 27 (45.0%) |
| 16 and 17 Years | 130 (96.3%) | 109 (100.0%) |
| 18 to 24 Years | 304 (70.4%) | 306 (66.7%) |
| 25 to 34 Years | 570 (89.9%) | 420 (94.2%) |
| 35 to 44 Years | 572 (92.9%) | 485 (93.6%) |
| 45 to 54 Years | 509 (93.6%) | 518 (97.6%) |
| 55 to 64 Years | 899 (98.0%) | 846 (94.7%) |
| 65 to 74 Years | 910 (94.2%) | 803 (93.9%) |
| 75 Years and over | 338 (95.8%) | 290 (93.5%) |
| Total | 4,980 (89.6%) | 4,699 (91.1%) |
Income Below Poverty Among Married-Couple Families in Lake County
The poverty statistics for married-couple families in Lake County show that 2.4% or 56 of the total 2,318 families live below the poverty line. Families with 5 or more children have the highest poverty rate of 42.9%, comprising of 3 families. On the other hand, families with 1 or 2 children have the lowest poverty rate of 0.0%, which includes 0 families.
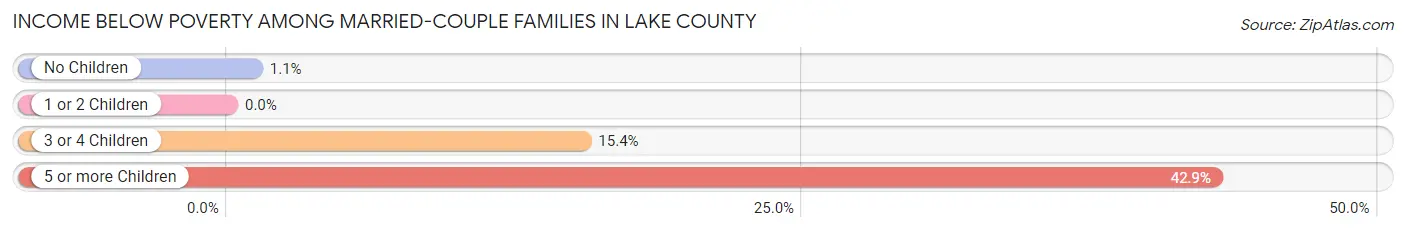
| Children | Above Poverty | Below Poverty |
| No Children | 1,559 (98.9%) | 17 (1.1%) |
| 1 or 2 Children | 501 (100.0%) | 0 (0.0%) |
| 3 or 4 Children | 198 (84.6%) | 36 (15.4%) |
| 5 or more Children | 4 (57.1%) | 3 (42.9%) |
| Total | 2,262 (97.6%) | 56 (2.4%) |
Income Below Poverty Among Single-Parent Households in Lake County
According to the poverty data in Lake County, 13.9% or 27 single-father households and 8.2% or 31 single-mother households are living below the poverty line. Among single-father households, those with 3 or 4 children have the highest poverty rate, with 27 households (100.0%) experiencing poverty. Likewise, among single-mother households, those with 3 or 4 children have the highest poverty rate, with 8 households (72.7%) falling below the poverty line.
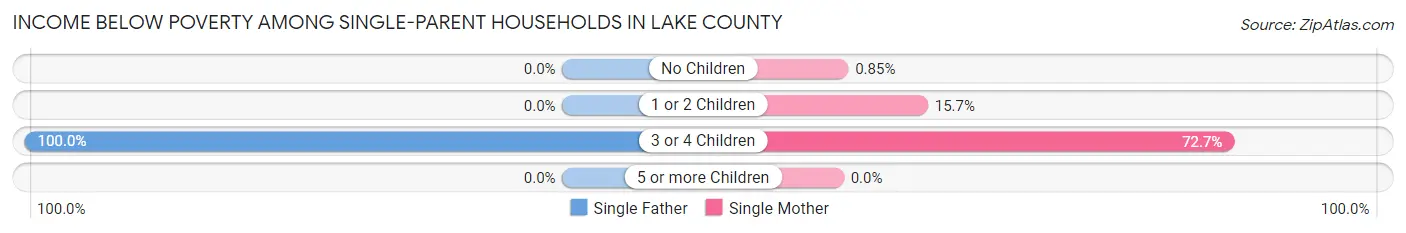
| Children | Single Father | Single Mother |
| No Children | 0 (0.0%) | 2 (0.9%) |
| 1 or 2 Children | 0 (0.0%) | 21 (15.7%) |
| 3 or 4 Children | 27 (100.0%) | 8 (72.7%) |
| 5 or more Children | 0 (0.0%) | 0 (0.0%) |
| Total | 27 (13.9%) | 31 (8.2%) |
Income Below Poverty Among Married-Couple vs Single-Parent Households in Lake County
The poverty data for Lake County shows that 56 of the married-couple family households (2.4%) and 58 of the single-parent households (10.1%) are living below the poverty level. Within the married-couple family households, those with 5 or more children have the highest poverty rate, with 3 households (42.9%) falling below the poverty line. Among the single-parent households, those with 3 or 4 children have the highest poverty rate, with 35 household (92.1%) living below poverty.
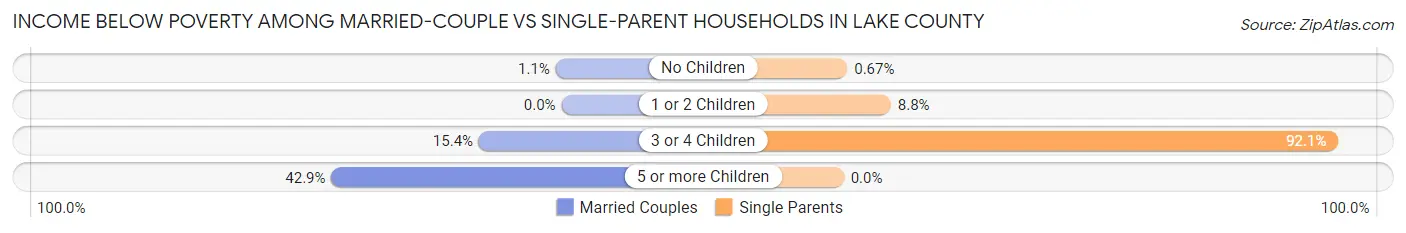
| Children | Married-Couple Families | Single-Parent Households |
| No Children | 17 (1.1%) | 2 (0.7%) |
| 1 or 2 Children | 0 (0.0%) | 21 (8.8%) |
| 3 or 4 Children | 36 (15.4%) | 35 (92.1%) |
| 5 or more Children | 3 (42.9%) | 0 (0.0%) |
| Total | 56 (2.4%) | 58 (10.1%) |
Employment Characteristics in Lake County
Employment by Class of Employer in Lake County
Among the 6,017 employed individuals in Lake County, private company employees (3,151 | 52.4%), self-employed (not incorporated) (680 | 11.3%), and local government employees (674 | 11.2%) make up the most common classes of employment.
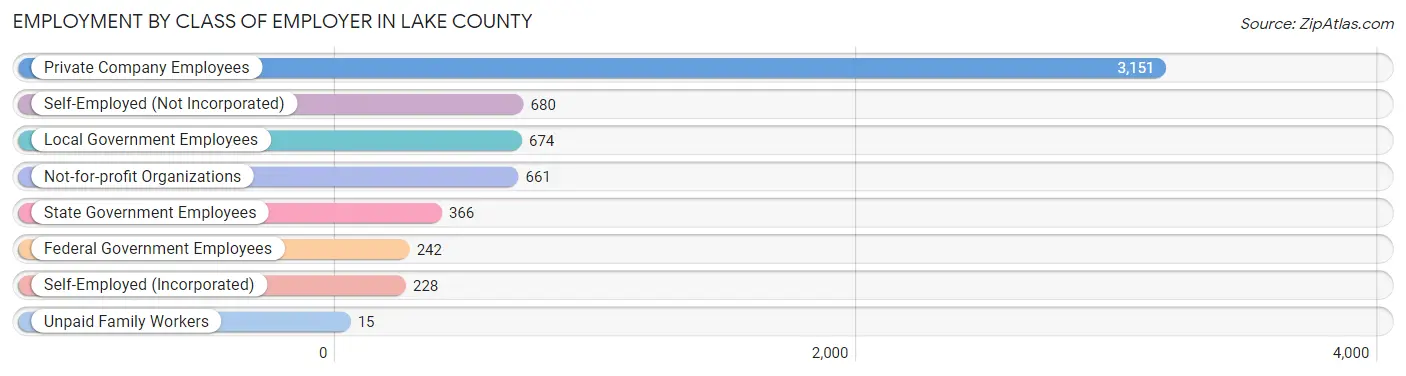
| Employer Class | # Employees | % Employees |
| Private Company Employees | 3,151 | 52.4% |
| Self-Employed (Incorporated) | 228 | 3.8% |
| Self-Employed (Not Incorporated) | 680 | 11.3% |
| Not-for-profit Organizations | 661 | 11.0% |
| Local Government Employees | 674 | 11.2% |
| State Government Employees | 366 | 6.1% |
| Federal Government Employees | 242 | 4.0% |
| Unpaid Family Workers | 15 | 0.3% |
| Total | 6,017 | 100.0% |
Employment Status by Age in Lake County
According to the labor force statistics for Lake County, out of the total population over 16 years of age (9,211), 66.9% or 6,162 individuals are in the labor force, with 1.6% or 99 of them unemployed. The age group with the highest labor force participation rate is 45 to 54 years, with 98.1% or 1,058 individuals in the labor force. Within the labor force, the 16 to 19 years age range has the highest percentage of unemployed individuals, with 16.4% or 47 of them being unemployed.
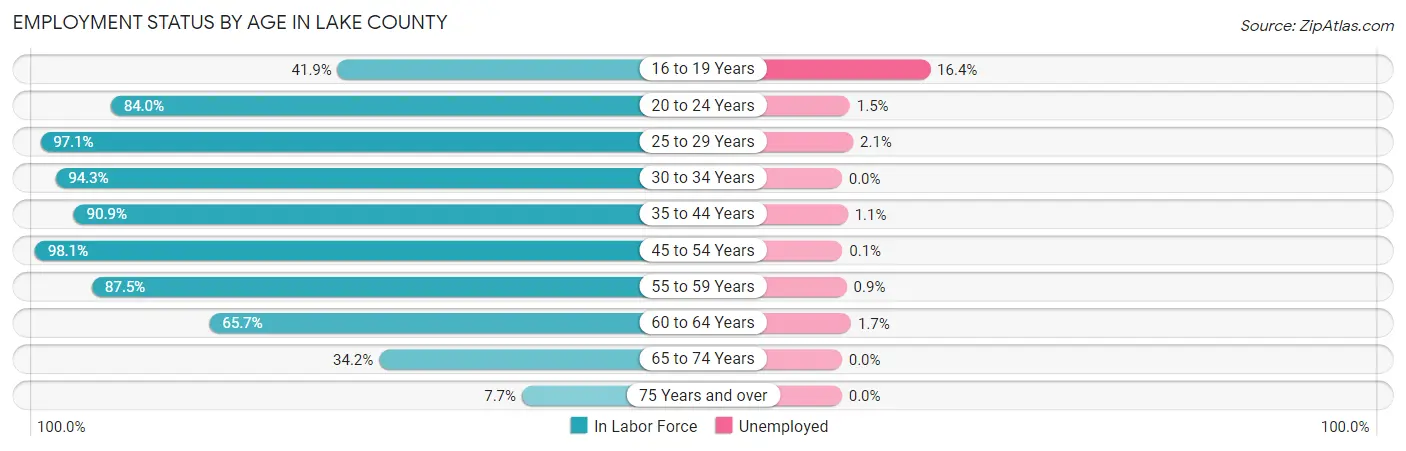
| Age Bracket | In Labor Force | Unemployed |
| 16 to 19 Years | 287 (41.9%) | 47 (16.4%) |
| 20 to 24 Years | 663 (84.0%) | 10 (1.5%) |
| 25 to 29 Years | 530 (97.1%) | 11 (2.1%) |
| 30 to 34 Years | 509 (94.3%) | 0 (0.0%) |
| 35 to 44 Years | 1,033 (90.9%) | 11 (1.1%) |
| 45 to 54 Years | 1,058 (98.1%) | 1 (0.1%) |
| 55 to 59 Years | 815 (87.5%) | 7 (0.9%) |
| 60 to 64 Years | 578 (65.7%) | 10 (1.7%) |
| 65 to 74 Years | 628 (34.2%) | 0 (0.0%) |
| 75 Years and over | 61 (7.7%) | 0 (0.0%) |
| Total | 6,162 (66.9%) | 99 (1.6%) |
Employment Status by Educational Attainment in Lake County
According to labor force statistics for Lake County, 88.5% of individuals (4,524) out of the total population between 25 and 64 years of age (5,112) are in the labor force, with 0.9% or 41 of them being unemployed. The group with the highest labor force participation rate are those with the educational attainment of college / associate degree, with 90.6% or 1,393 individuals in the labor force. Within the labor force, individuals with bachelor's degree or higher education have the highest percentage of unemployment, with 1.4% or 24 of them being unemployed.
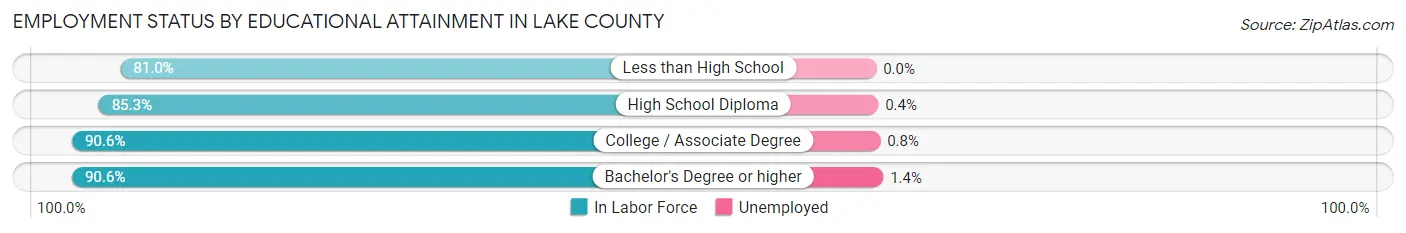
| Educational Attainment | In Labor Force | Unemployed |
| Less than High School | 290 (81.0%) | 0 (0.0%) |
| High School Diploma | 1,159 (85.3%) | 5 (0.4%) |
| College / Associate Degree | 1,393 (90.6%) | 12 (0.8%) |
| Bachelor's Degree or higher | 1,682 (90.6%) | 26 (1.4%) |
| Total | 4,524 (88.5%) | 46 (0.9%) |
Employment Occupations by Sex in Lake County
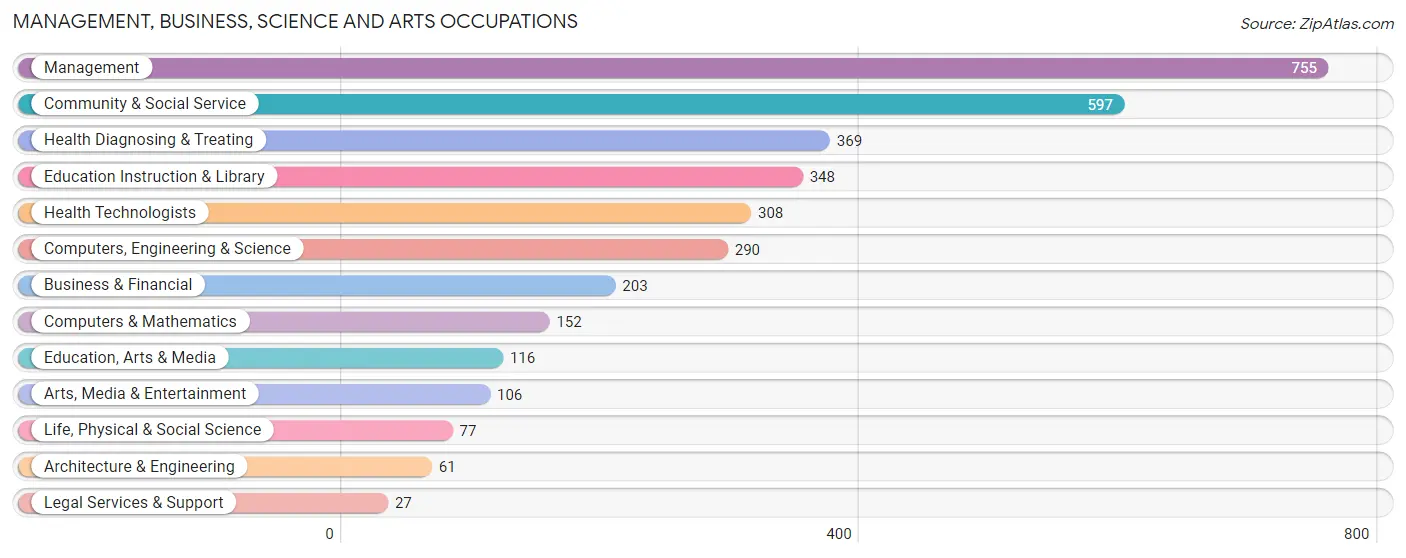
Management, Business, Science and Arts Occupations
The most common Management, Business, Science and Arts occupations in Lake County are Management (755 | 12.6%), Community & Social Service (597 | 9.9%), Health Diagnosing & Treating (369 | 6.1%), Education Instruction & Library (348 | 5.8%), and Health Technologists (308 | 5.1%).
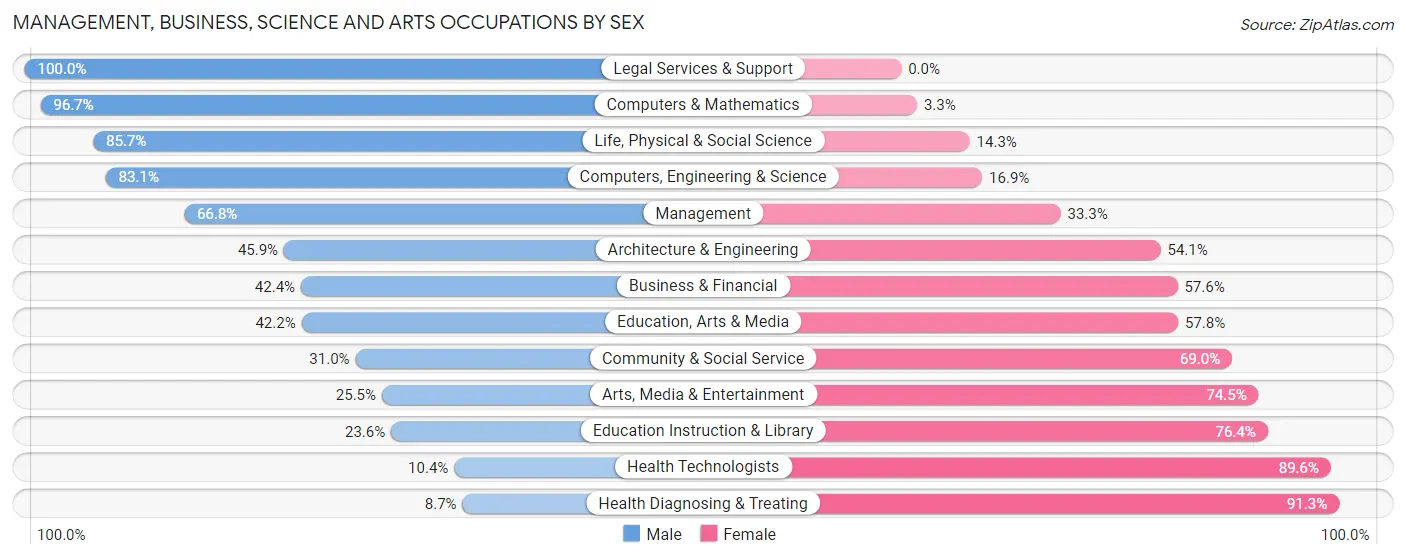
Management, Business, Science and Arts Occupations by Sex
Within the Management, Business, Science and Arts occupations in Lake County, the most male-oriented occupations are Legal Services & Support (100.0%), Computers & Mathematics (96.7%), and Life, Physical & Social Science (85.7%), while the most female-oriented occupations are Health Diagnosing & Treating (91.3%), Health Technologists (89.6%), and Education Instruction & Library (76.4%).
| Occupation | Male | Female |
| Management | 504 (66.7%) | 251 (33.3%) |
| Business & Financial | 86 (42.4%) | 117 (57.6%) |
| Computers, Engineering & Science | 241 (83.1%) | 49 (16.9%) |
| Computers & Mathematics | 147 (96.7%) | 5 (3.3%) |
| Architecture & Engineering | 28 (45.9%) | 33 (54.1%) |
| Life, Physical & Social Science | 66 (85.7%) | 11 (14.3%) |
| Community & Social Service | 185 (31.0%) | 412 (69.0%) |
| Education, Arts & Media | 49 (42.2%) | 67 (57.8%) |
| Legal Services & Support | 27 (100.0%) | 0 (0.0%) |
| Education Instruction & Library | 82 (23.6%) | 266 (76.4%) |
| Arts, Media & Entertainment | 27 (25.5%) | 79 (74.5%) |
| Health Diagnosing & Treating | 32 (8.7%) | 337 (91.3%) |
| Health Technologists | 32 (10.4%) | 276 (89.6%) |
| Total (Category) | 1,048 (47.3%) | 1,166 (52.7%) |
| Total (Overall) | 3,331 (55.4%) | 2,679 (44.6%) |
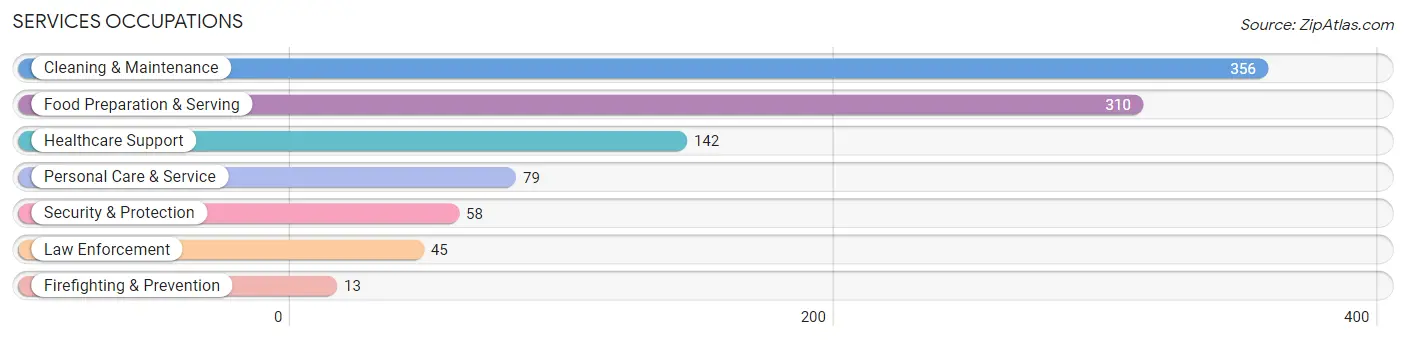
Services Occupations
The most common Services occupations in Lake County are Cleaning & Maintenance (356 | 5.9%), Food Preparation & Serving (310 | 5.2%), Healthcare Support (142 | 2.4%), Personal Care & Service (79 | 1.3%), and Security & Protection (58 | 1.0%).
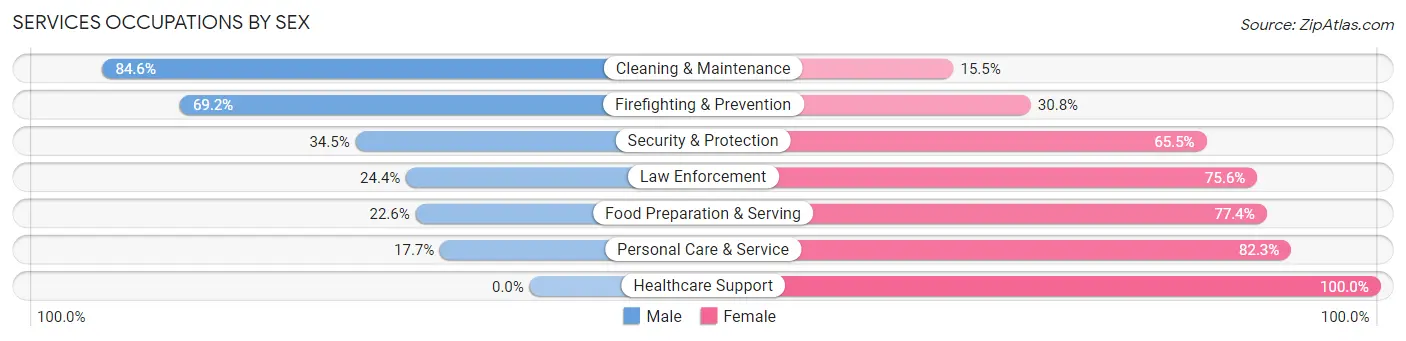
Services Occupations by Sex
Within the Services occupations in Lake County, the most male-oriented occupations are Cleaning & Maintenance (84.6%), Firefighting & Prevention (69.2%), and Security & Protection (34.5%), while the most female-oriented occupations are Healthcare Support (100.0%), Personal Care & Service (82.3%), and Food Preparation & Serving (77.4%).
| Occupation | Male | Female |
| Healthcare Support | 0 (0.0%) | 142 (100.0%) |
| Security & Protection | 20 (34.5%) | 38 (65.5%) |
| Firefighting & Prevention | 9 (69.2%) | 4 (30.8%) |
| Law Enforcement | 11 (24.4%) | 34 (75.6%) |
| Food Preparation & Serving | 70 (22.6%) | 240 (77.4%) |
| Cleaning & Maintenance | 301 (84.6%) | 55 (15.4%) |
| Personal Care & Service | 14 (17.7%) | 65 (82.3%) |
| Total (Category) | 405 (42.9%) | 540 (57.1%) |
| Total (Overall) | 3,331 (55.4%) | 2,679 (44.6%) |
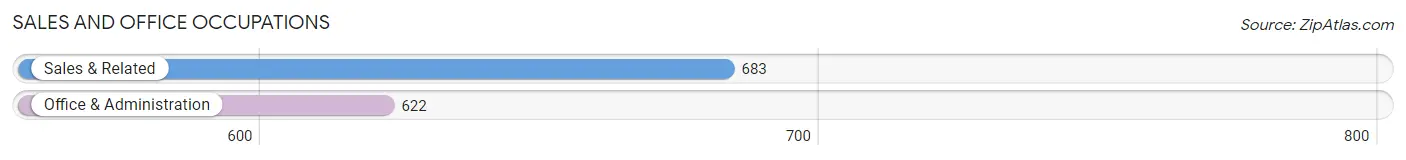
Sales and Office Occupations
The most common Sales and Office occupations in Lake County are Sales & Related (683 | 11.4%), and Office & Administration (622 | 10.3%).
Sales and Office Occupations by Sex
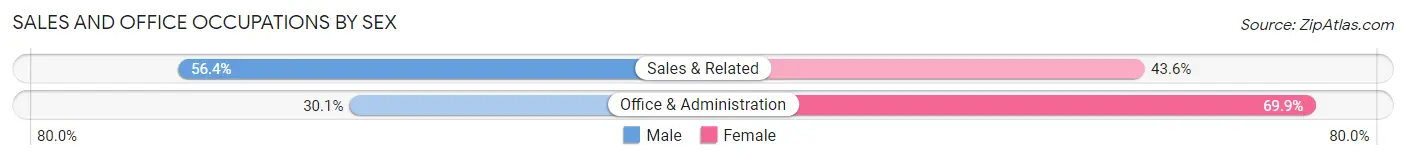
| Occupation | Male | Female |
| Sales & Related | 385 (56.4%) | 298 (43.6%) |
| Office & Administration | 187 (30.1%) | 435 (69.9%) |
| Total (Category) | 572 (43.8%) | 733 (56.2%) |
| Total (Overall) | 3,331 (55.4%) | 2,679 (44.6%) |
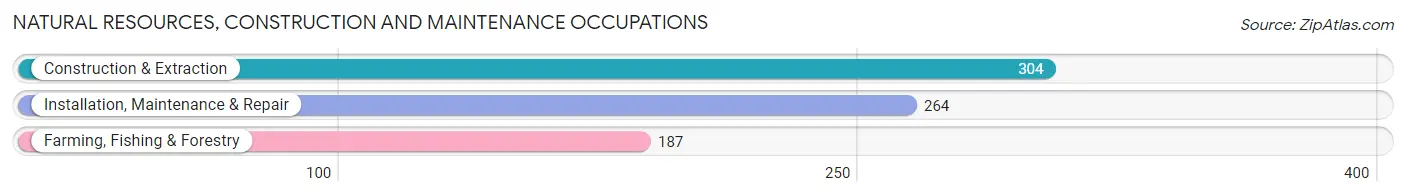
Natural Resources, Construction and Maintenance Occupations
The most common Natural Resources, Construction and Maintenance occupations in Lake County are Construction & Extraction (304 | 5.1%), Installation, Maintenance & Repair (264 | 4.4%), and Farming, Fishing & Forestry (187 | 3.1%).
Natural Resources, Construction and Maintenance Occupations by Sex
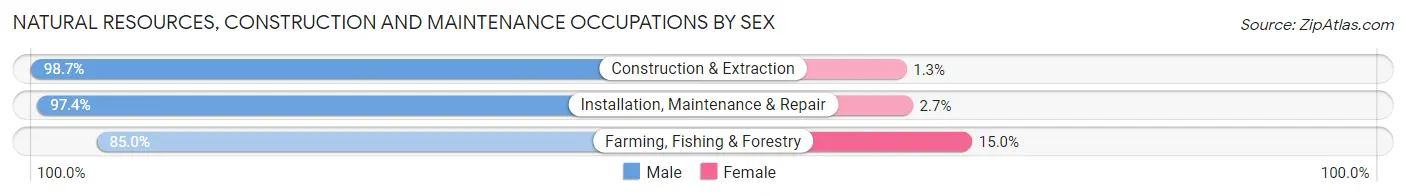
| Occupation | Male | Female |
| Farming, Fishing & Forestry | 159 (85.0%) | 28 (15.0%) |
| Construction & Extraction | 300 (98.7%) | 4 (1.3%) |
| Installation, Maintenance & Repair | 257 (97.4%) | 7 (2.6%) |
| Total (Category) | 716 (94.8%) | 39 (5.2%) |
| Total (Overall) | 3,331 (55.4%) | 2,679 (44.6%) |
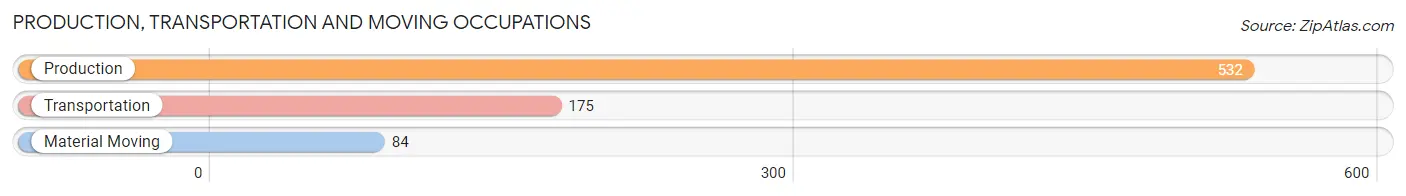
Production, Transportation and Moving Occupations
The most common Production, Transportation and Moving occupations in Lake County are Production (532 | 8.8%), Transportation (175 | 2.9%), and Material Moving (84 | 1.4%).
Production, Transportation and Moving Occupations by Sex
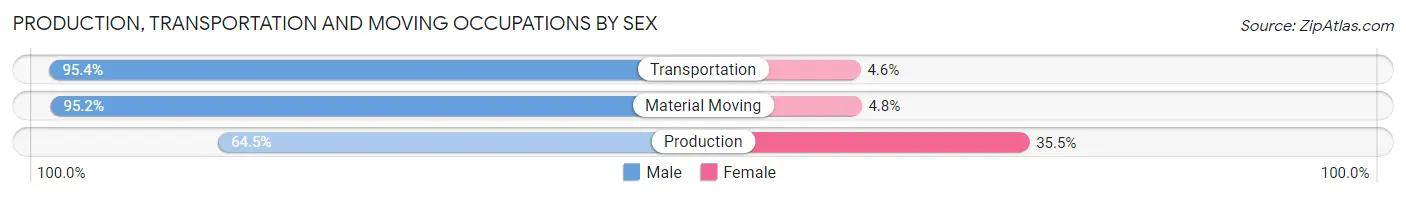
| Occupation | Male | Female |
| Production | 343 (64.5%) | 189 (35.5%) |
| Transportation | 167 (95.4%) | 8 (4.6%) |
| Material Moving | 80 (95.2%) | 4 (4.8%) |
| Total (Category) | 590 (74.6%) | 201 (25.4%) |
| Total (Overall) | 3,331 (55.4%) | 2,679 (44.6%) |
Employment Industries by Sex in Lake County
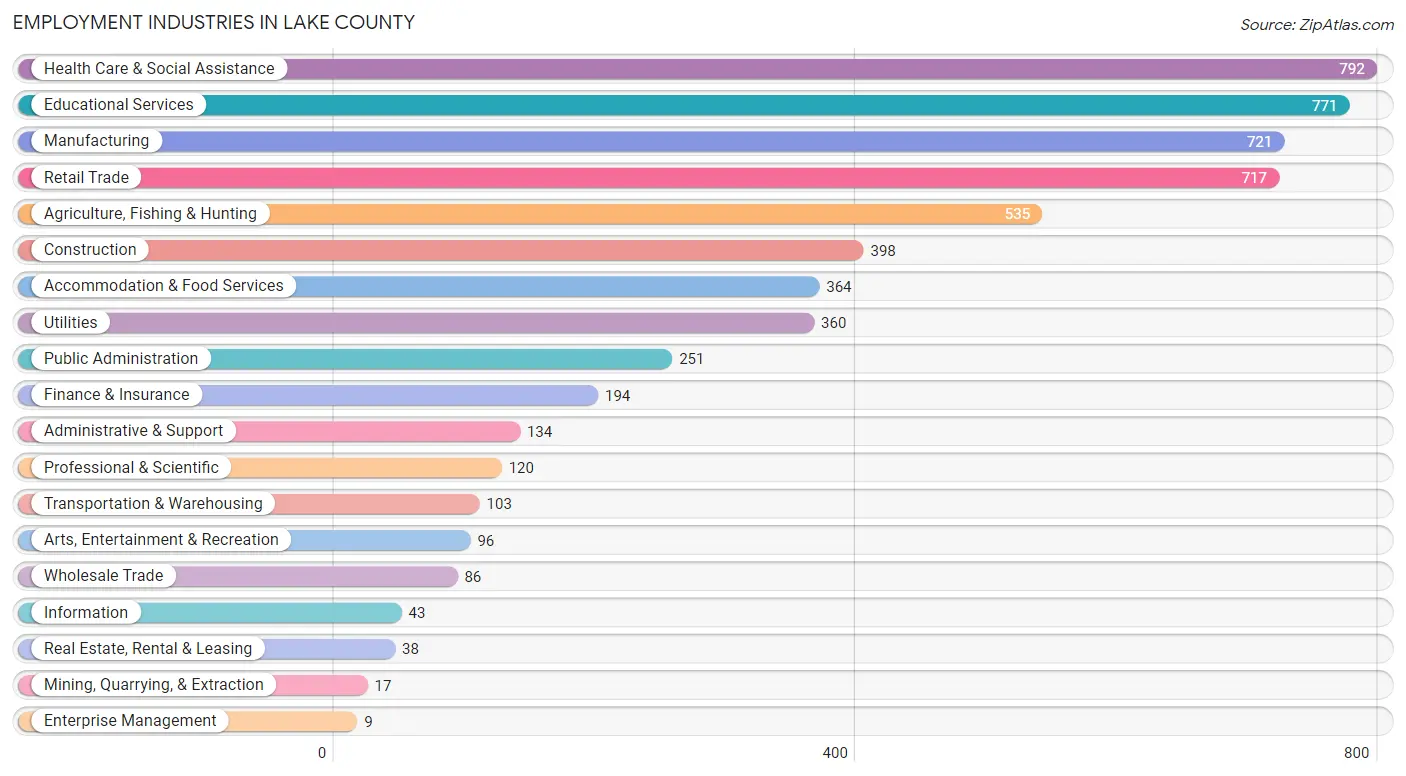
Employment Industries in Lake County
The major employment industries in Lake County include Health Care & Social Assistance (792 | 13.2%), Educational Services (771 | 12.8%), Manufacturing (721 | 12.0%), Retail Trade (717 | 11.9%), and Agriculture, Fishing & Hunting (535 | 8.9%).
Employment Industries by Sex in Lake County
The Lake County industries that see more men than women are Mining, Quarrying, & Extraction (100.0%), Real Estate, Rental & Leasing (100.0%), and Wholesale Trade (94.2%), whereas the industries that tend to have a higher number of women are Enterprise Management (100.0%), Health Care & Social Assistance (92.2%), and Public Administration (74.1%).
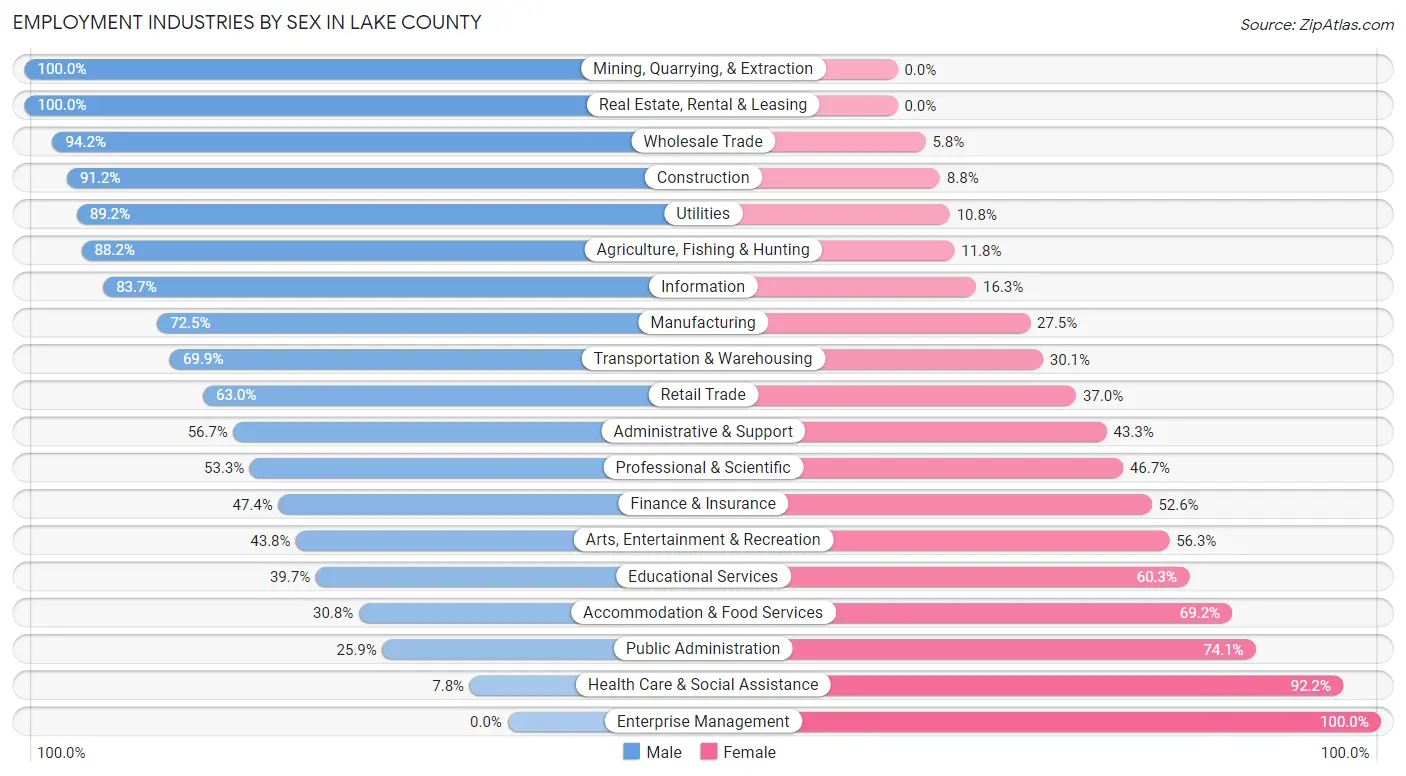
| Industry | Male | Female |
| Agriculture, Fishing & Hunting | 472 (88.2%) | 63 (11.8%) |
| Mining, Quarrying, & Extraction | 17 (100.0%) | 0 (0.0%) |
| Construction | 363 (91.2%) | 35 (8.8%) |
| Manufacturing | 523 (72.5%) | 198 (27.5%) |
| Wholesale Trade | 81 (94.2%) | 5 (5.8%) |
| Retail Trade | 452 (63.0%) | 265 (37.0%) |
| Transportation & Warehousing | 72 (69.9%) | 31 (30.1%) |
| Utilities | 321 (89.2%) | 39 (10.8%) |
| Information | 36 (83.7%) | 7 (16.3%) |
| Finance & Insurance | 92 (47.4%) | 102 (52.6%) |
| Real Estate, Rental & Leasing | 38 (100.0%) | 0 (0.0%) |
| Professional & Scientific | 64 (53.3%) | 56 (46.7%) |
| Enterprise Management | 0 (0.0%) | 9 (100.0%) |
| Administrative & Support | 76 (56.7%) | 58 (43.3%) |
| Educational Services | 306 (39.7%) | 465 (60.3%) |
| Health Care & Social Assistance | 62 (7.8%) | 730 (92.2%) |
| Arts, Entertainment & Recreation | 42 (43.8%) | 54 (56.2%) |
| Accommodation & Food Services | 112 (30.8%) | 252 (69.2%) |
| Public Administration | 65 (25.9%) | 186 (74.1%) |
| Total | 3,331 (55.4%) | 2,679 (44.6%) |
Education in Lake County
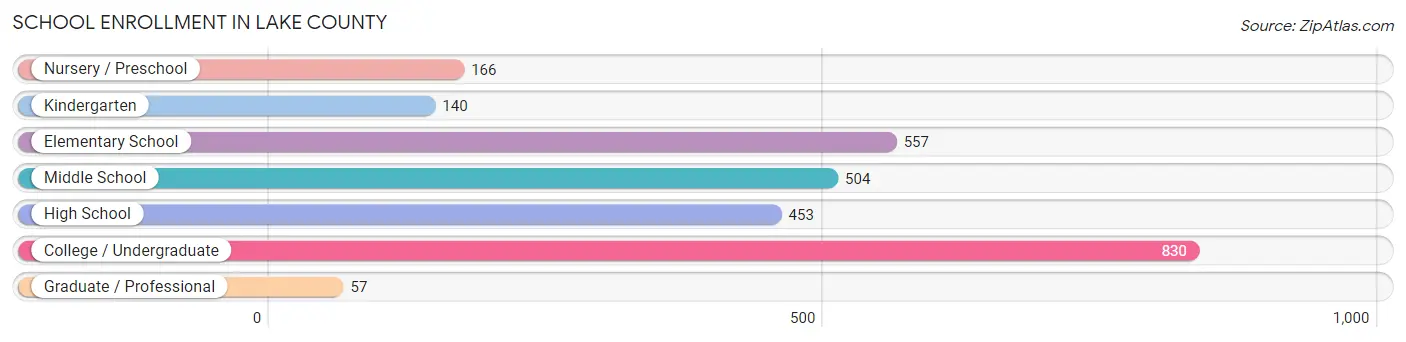
School Enrollment in Lake County
The most common levels of schooling among the 2,707 students in Lake County are college / undergraduate (830 | 30.7%), elementary school (557 | 20.6%), and middle school (504 | 18.6%).
| School Level | # Students | % Students |
| Nursery / Preschool | 166 | 6.1% |
| Kindergarten | 140 | 5.2% |
| Elementary School | 557 | 20.6% |
| Middle School | 504 | 18.6% |
| High School | 453 | 16.7% |
| College / Undergraduate | 830 | 30.7% |
| Graduate / Professional | 57 | 2.1% |
| Total | 2,707 | 100.0% |
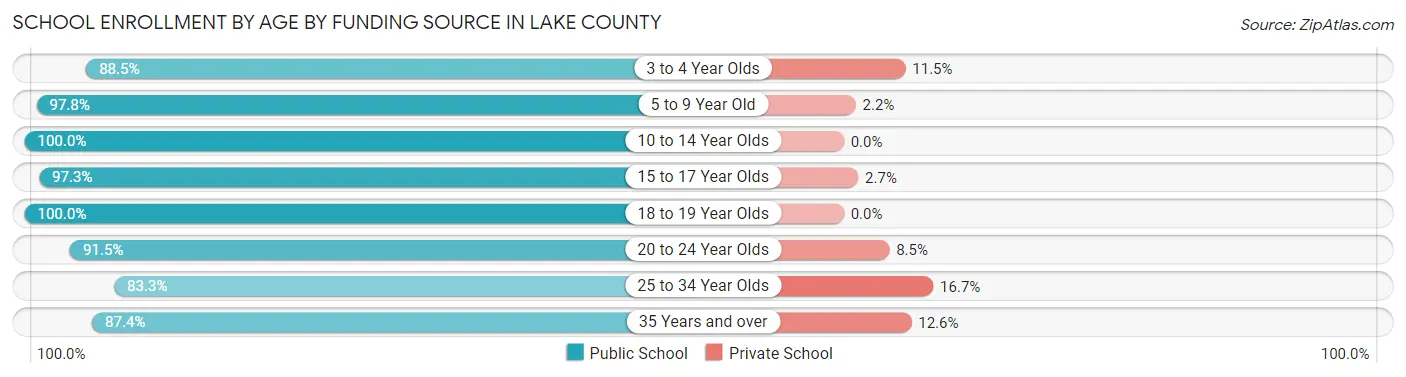
School Enrollment by Age by Funding Source in Lake County
Out of a total of 2,707 students who are enrolled in schools in Lake County, 100 (3.7%) attend a private institution, while the remaining 2,607 (96.3%) are enrolled in public schools. The age group of 25 to 34 year olds has the highest likelihood of being enrolled in private schools, with 9 (16.7% in the age bracket) enrolled. Conversely, the age group of 10 to 14 year olds has the lowest likelihood of being enrolled in a private school, with 615 (100.0% in the age bracket) attending a public institution.
| Age Bracket | Public School | Private School |
| 3 to 4 Year Olds | 131 (88.5%) | 17 (11.5%) |
| 5 to 9 Year Old | 615 (97.8%) | 14 (2.2%) |
| 10 to 14 Year Olds | 615 (100.0%) | 0 (0.0%) |
| 15 to 17 Year Olds | 360 (97.3%) | 10 (2.7%) |
| 18 to 19 Year Olds | 371 (100.0%) | 0 (0.0%) |
| 20 to 24 Year Olds | 345 (91.5%) | 32 (8.5%) |
| 25 to 34 Year Olds | 45 (83.3%) | 9 (16.7%) |
| 35 Years and over | 125 (87.4%) | 18 (12.6%) |
| Total | 2,607 (96.3%) | 100 (3.7%) |
Educational Attainment by Field of Study in Lake County
Education (732 | 25.7%), business (478 | 16.8%), science & technology (322 | 11.3%), bio, nature & agricultural (259 | 9.1%), and engineering (193 | 6.8%) are the most common fields of study among 2,846 individuals in Lake County who have obtained a bachelor's degree or higher.
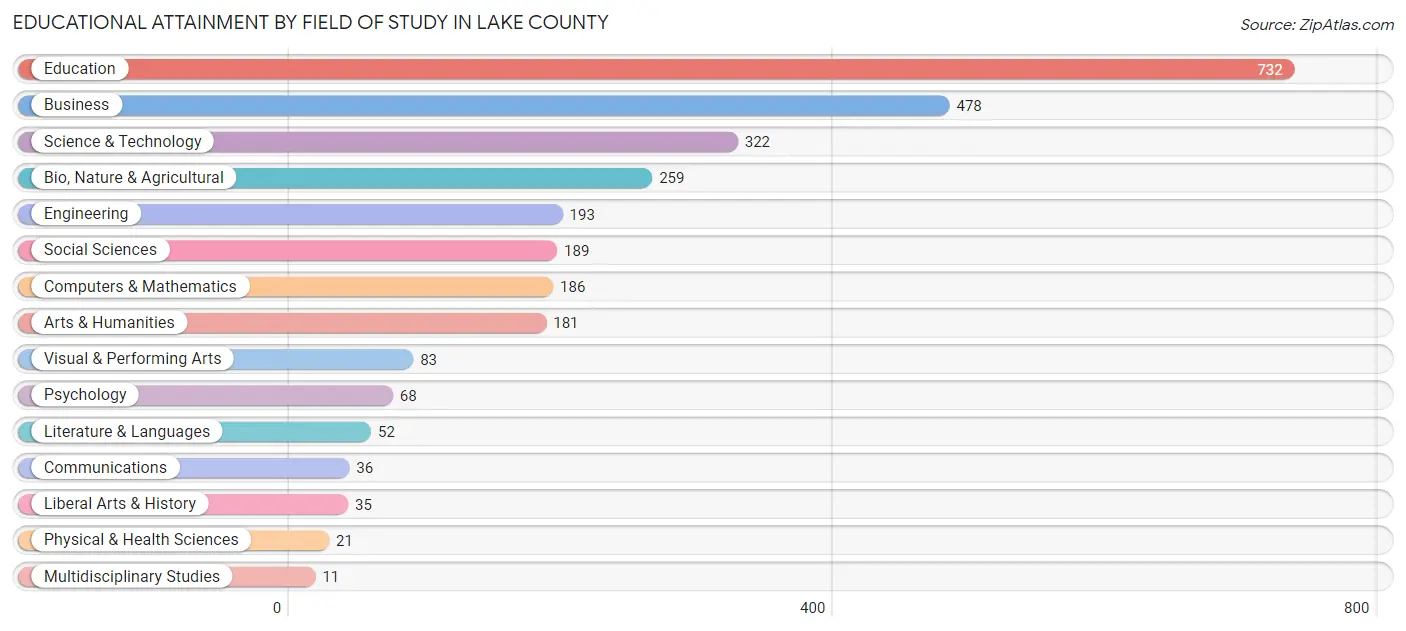
| Field of Study | # Graduates | % Graduates |
| Computers & Mathematics | 186 | 6.5% |
| Bio, Nature & Agricultural | 259 | 9.1% |
| Physical & Health Sciences | 21 | 0.7% |
| Psychology | 68 | 2.4% |
| Social Sciences | 189 | 6.6% |
| Engineering | 193 | 6.8% |
| Multidisciplinary Studies | 11 | 0.4% |
| Science & Technology | 322 | 11.3% |
| Business | 478 | 16.8% |
| Education | 732 | 25.7% |
| Literature & Languages | 52 | 1.8% |
| Liberal Arts & History | 35 | 1.2% |
| Visual & Performing Arts | 83 | 2.9% |
| Communications | 36 | 1.3% |
| Arts & Humanities | 181 | 6.4% |
| Total | 2,846 | 100.0% |
Transportation & Commute in Lake County
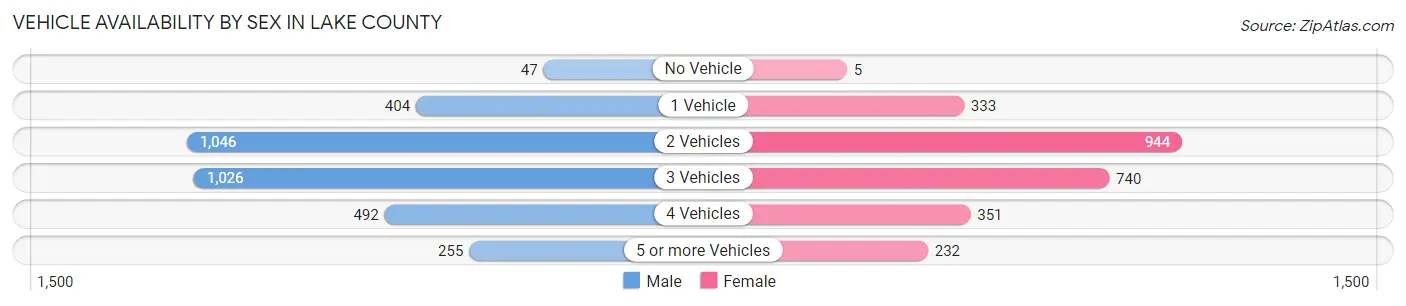
Vehicle Availability by Sex in Lake County
The most prevalent vehicle ownership categories in Lake County are males with 2 vehicles (1,046, accounting for 32.0%) and females with 2 vehicles (944, making up 40.2%).
| Vehicles Available | Male | Female |
| No Vehicle | 47 (1.4%) | 5 (0.2%) |
| 1 Vehicle | 404 (12.3%) | 333 (12.8%) |
| 2 Vehicles | 1,046 (32.0%) | 944 (36.2%) |
| 3 Vehicles | 1,026 (31.4%) | 740 (28.4%) |
| 4 Vehicles | 492 (15.0%) | 351 (13.5%) |
| 5 or more Vehicles | 255 (7.8%) | 232 (8.9%) |
| Total | 3,270 (100.0%) | 2,605 (100.0%) |
Commute Time in Lake County
The most frequently occuring commute durations in Lake County are 5 to 9 minutes (1,875 commuters, 34.3%), 10 to 14 minutes (975 commuters, 17.8%), and less than 5 minutes (602 commuters, 11.0%).
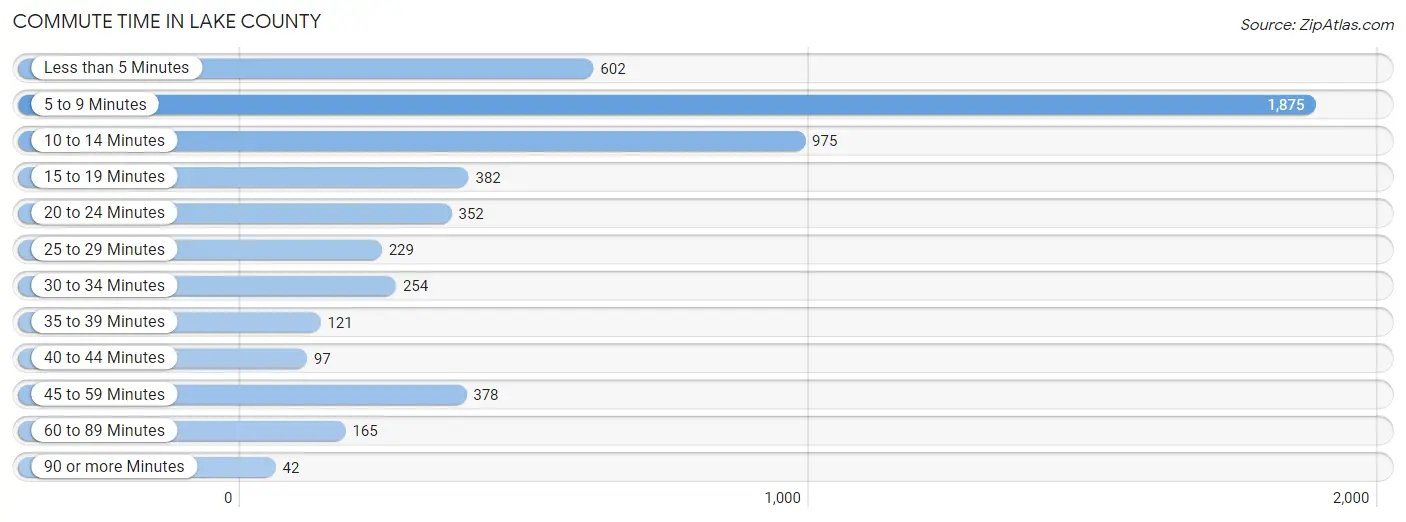
| Commute Time | # Commuters | % Commuters |
| Less than 5 Minutes | 602 | 11.0% |
| 5 to 9 Minutes | 1,875 | 34.3% |
| 10 to 14 Minutes | 975 | 17.8% |
| 15 to 19 Minutes | 382 | 7.0% |
| 20 to 24 Minutes | 352 | 6.4% |
| 25 to 29 Minutes | 229 | 4.2% |
| 30 to 34 Minutes | 254 | 4.6% |
| 35 to 39 Minutes | 121 | 2.2% |
| 40 to 44 Minutes | 97 | 1.8% |
| 45 to 59 Minutes | 378 | 6.9% |
| 60 to 89 Minutes | 165 | 3.0% |
| 90 or more Minutes | 42 | 0.8% |
Commute Time by Sex in Lake County
The most common commute times in Lake County are 5 to 9 minutes (1,096 commuters, 35.4%) for males and 5 to 9 minutes (779 commuters, 32.8%) for females.
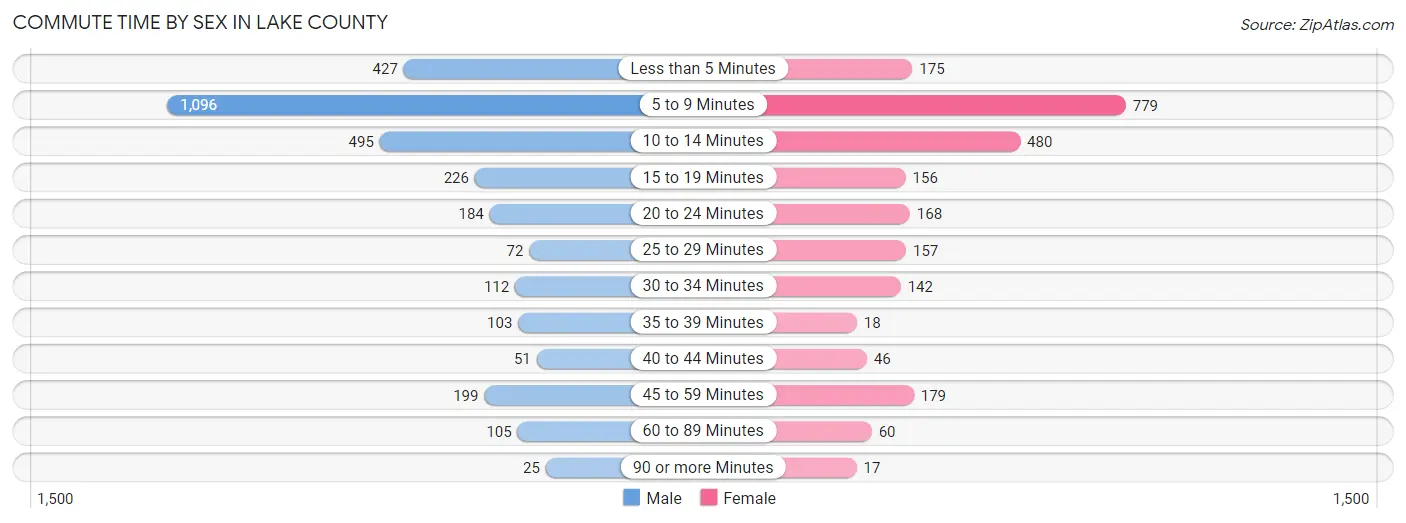
| Commute Time | Male | Female |
| Less than 5 Minutes | 427 (13.8%) | 175 (7.4%) |
| 5 to 9 Minutes | 1,096 (35.4%) | 779 (32.8%) |
| 10 to 14 Minutes | 495 (16.0%) | 480 (20.2%) |
| 15 to 19 Minutes | 226 (7.3%) | 156 (6.6%) |
| 20 to 24 Minutes | 184 (5.9%) | 168 (7.1%) |
| 25 to 29 Minutes | 72 (2.3%) | 157 (6.6%) |
| 30 to 34 Minutes | 112 (3.6%) | 142 (6.0%) |
| 35 to 39 Minutes | 103 (3.3%) | 18 (0.8%) |
| 40 to 44 Minutes | 51 (1.7%) | 46 (1.9%) |
| 45 to 59 Minutes | 199 (6.4%) | 179 (7.5%) |
| 60 to 89 Minutes | 105 (3.4%) | 60 (2.5%) |
| 90 or more Minutes | 25 (0.8%) | 17 (0.7%) |
Time of Departure to Work by Sex in Lake County
The most frequent times of departure to work in Lake County are 7:30 AM to 7:59 AM (625, 20.2%) for males and 7:30 AM to 7:59 AM (644, 27.1%) for females.
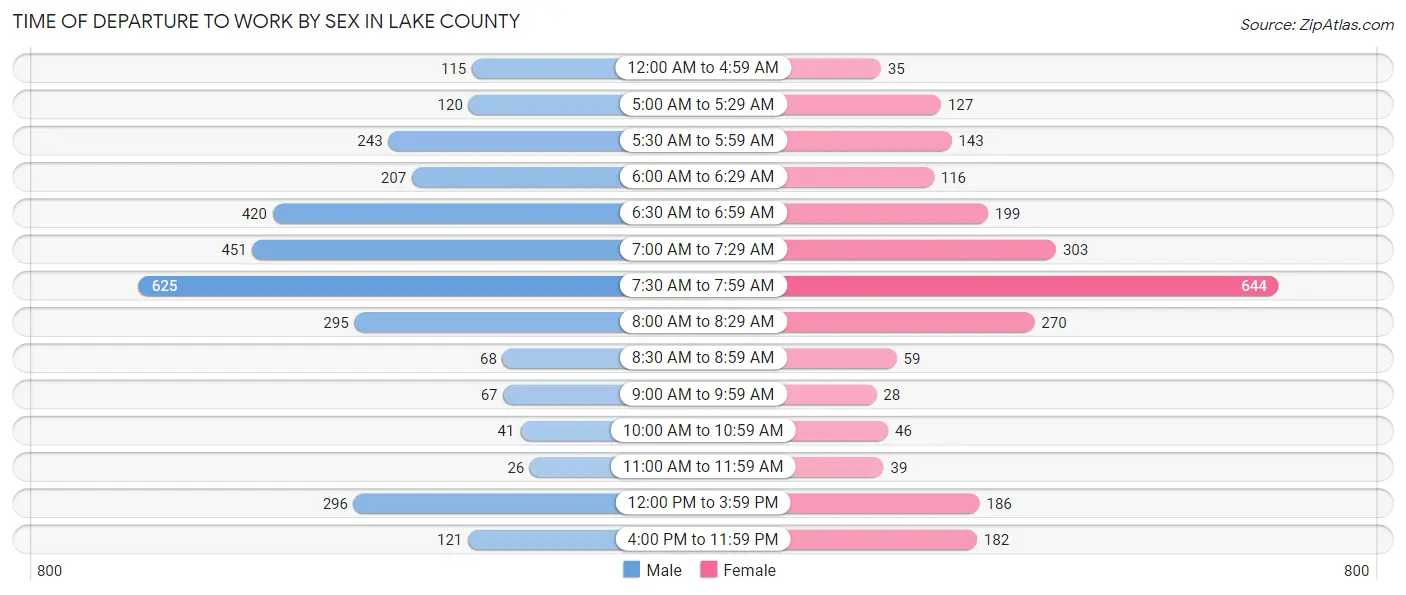
| Time of Departure | Male | Female |
| 12:00 AM to 4:59 AM | 115 (3.7%) | 35 (1.5%) |
| 5:00 AM to 5:29 AM | 120 (3.9%) | 127 (5.3%) |
| 5:30 AM to 5:59 AM | 243 (7.9%) | 143 (6.0%) |
| 6:00 AM to 6:29 AM | 207 (6.7%) | 116 (4.9%) |
| 6:30 AM to 6:59 AM | 420 (13.6%) | 199 (8.4%) |
| 7:00 AM to 7:29 AM | 451 (14.6%) | 303 (12.8%) |
| 7:30 AM to 7:59 AM | 625 (20.2%) | 644 (27.1%) |
| 8:00 AM to 8:29 AM | 295 (9.5%) | 270 (11.4%) |
| 8:30 AM to 8:59 AM | 68 (2.2%) | 59 (2.5%) |
| 9:00 AM to 9:59 AM | 67 (2.2%) | 28 (1.2%) |
| 10:00 AM to 10:59 AM | 41 (1.3%) | 46 (1.9%) |
| 11:00 AM to 11:59 AM | 26 (0.8%) | 39 (1.6%) |
| 12:00 PM to 3:59 PM | 296 (9.6%) | 186 (7.8%) |
| 4:00 PM to 11:59 PM | 121 (3.9%) | 182 (7.7%) |
| Total | 3,095 (100.0%) | 2,377 (100.0%) |
Housing Occupancy in Lake County
Occupancy by Ownership in Lake County
Of the total 4,552 dwellings in Lake County, owner-occupied units account for 3,340 (73.4%), while renter-occupied units make up 1,212 (26.6%).
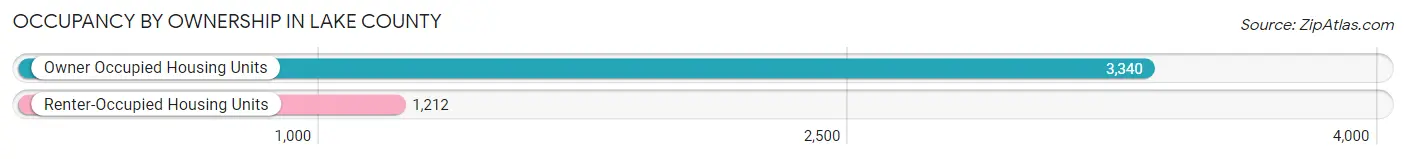
| Occupancy | # Housing Units | % Housing Units |
| Owner Occupied Housing Units | 3,340 | 73.4% |
| Renter-Occupied Housing Units | 1,212 | 26.6% |
| Total Occupied Housing Units | 4,552 | 100.0% |
Occupancy by Household Size in Lake County
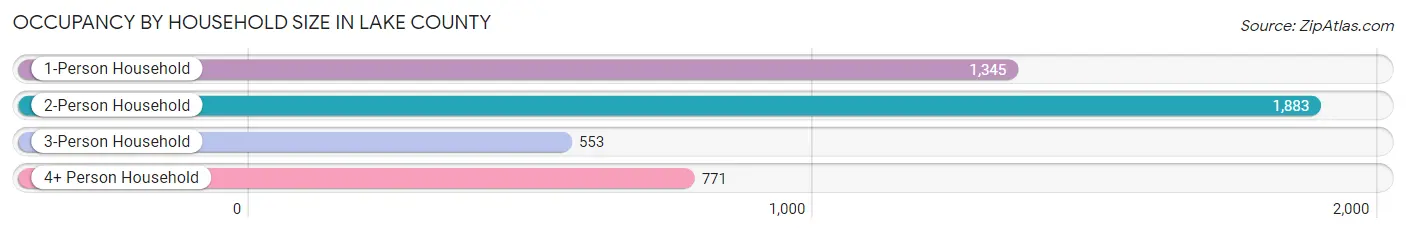
| Household Size | # Housing Units | % Housing Units |
| 1-Person Household | 1,345 | 29.5% |
| 2-Person Household | 1,883 | 41.4% |
| 3-Person Household | 553 | 12.1% |
| 4+ Person Household | 771 | 16.9% |
| Total Housing Units | 4,552 | 100.0% |
Occupancy by Ownership by Household Size in Lake County
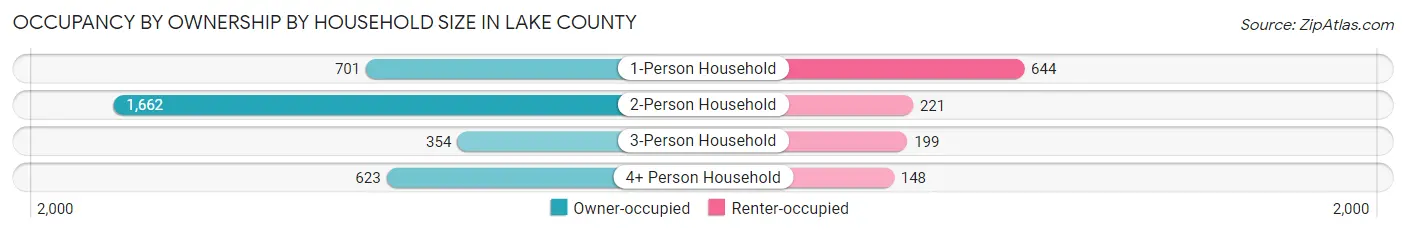
| Household Size | Owner-occupied | Renter-occupied |
| 1-Person Household | 701 (52.1%) | 644 (47.9%) |
| 2-Person Household | 1,662 (88.3%) | 221 (11.7%) |
| 3-Person Household | 354 (64.0%) | 199 (36.0%) |
| 4+ Person Household | 623 (80.8%) | 148 (19.2%) |
| Total Housing Units | 3,340 (73.4%) | 1,212 (26.6%) |
Occupancy by Educational Attainment in Lake County
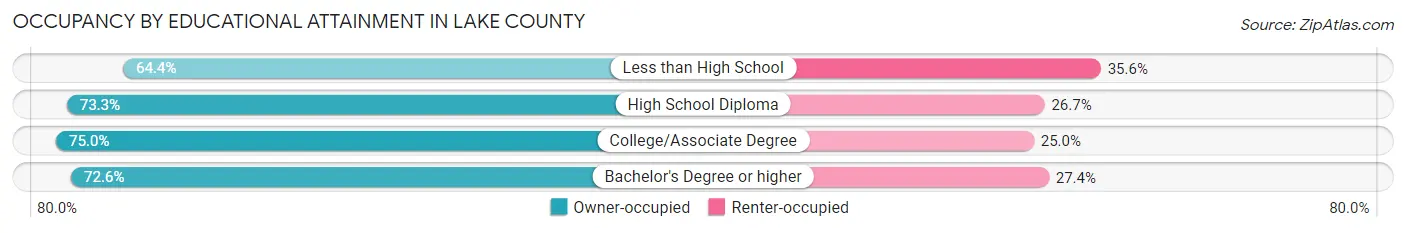
| Household Size | Owner-occupied | Renter-occupied |
| Less than High School | 94 (64.4%) | 52 (35.6%) |
| High School Diploma | 796 (73.3%) | 290 (26.7%) |
| College/Associate Degree | 1,227 (75.0%) | 409 (25.0%) |
| Bachelor's Degree or higher | 1,223 (72.6%) | 461 (27.4%) |
Occupancy by Age of Householder in Lake County
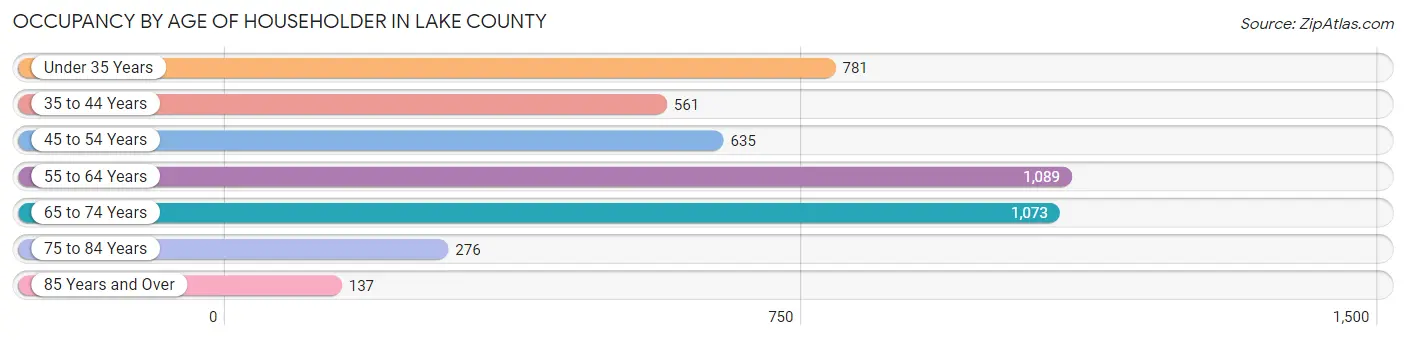
| Age Bracket | # Households | % Households |
| Under 35 Years | 781 | 17.2% |
| 35 to 44 Years | 561 | 12.3% |
| 45 to 54 Years | 635 | 14.0% |
| 55 to 64 Years | 1,089 | 23.9% |
| 65 to 74 Years | 1,073 | 23.6% |
| 75 to 84 Years | 276 | 6.1% |
| 85 Years and Over | 137 | 3.0% |
| Total | 4,552 | 100.0% |
Housing Finances in Lake County
Median Income by Occupancy in Lake County
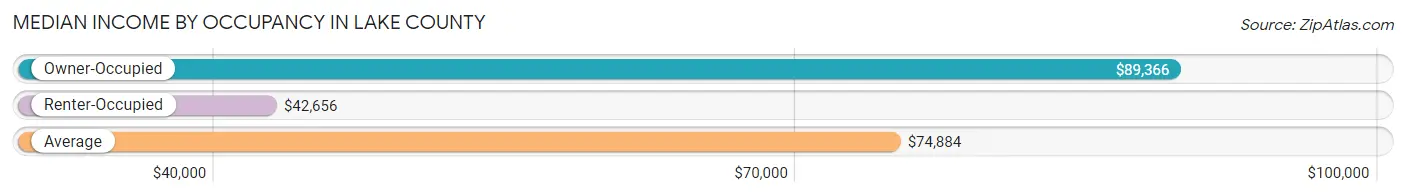
| Occupancy Type | # Households | Median Income |
| Owner-Occupied | 3,340 (73.4%) | $89,366 |
| Renter-Occupied | 1,212 (26.6%) | $42,656 |
| Average | 4,552 (100.0%) | $74,884 |
Occupancy by Householder Income Bracket in Lake County
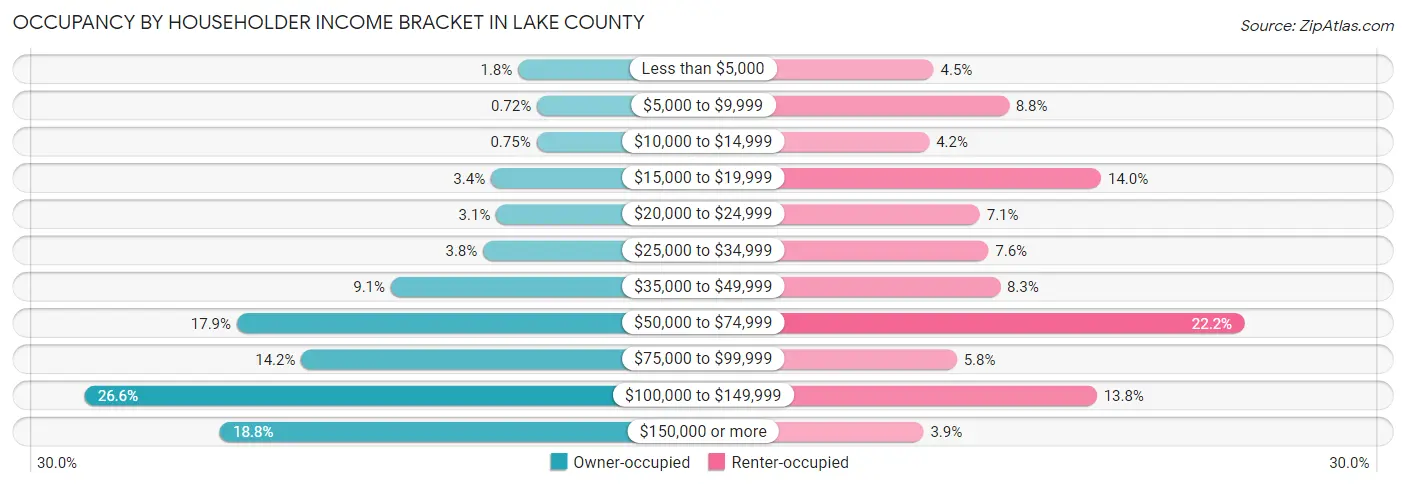
| Income Bracket | Owner-occupied | Renter-occupied |
| Less than $5,000 | 60 (1.8%) | 54 (4.5%) |
| $5,000 to $9,999 | 24 (0.7%) | 106 (8.7%) |
| $10,000 to $14,999 | 25 (0.7%) | 51 (4.2%) |
| $15,000 to $19,999 | 112 (3.4%) | 170 (14.0%) |
| $20,000 to $24,999 | 102 (3.0%) | 86 (7.1%) |
| $25,000 to $34,999 | 127 (3.8%) | 92 (7.6%) |
| $35,000 to $49,999 | 303 (9.1%) | 100 (8.3%) |
| $50,000 to $74,999 | 597 (17.9%) | 269 (22.2%) |
| $75,000 to $99,999 | 474 (14.2%) | 70 (5.8%) |
| $100,000 to $149,999 | 887 (26.6%) | 167 (13.8%) |
| $150,000 or more | 629 (18.8%) | 47 (3.9%) |
| Total | 3,340 (100.0%) | 1,212 (100.0%) |
Monthly Housing Cost Tiers in Lake County
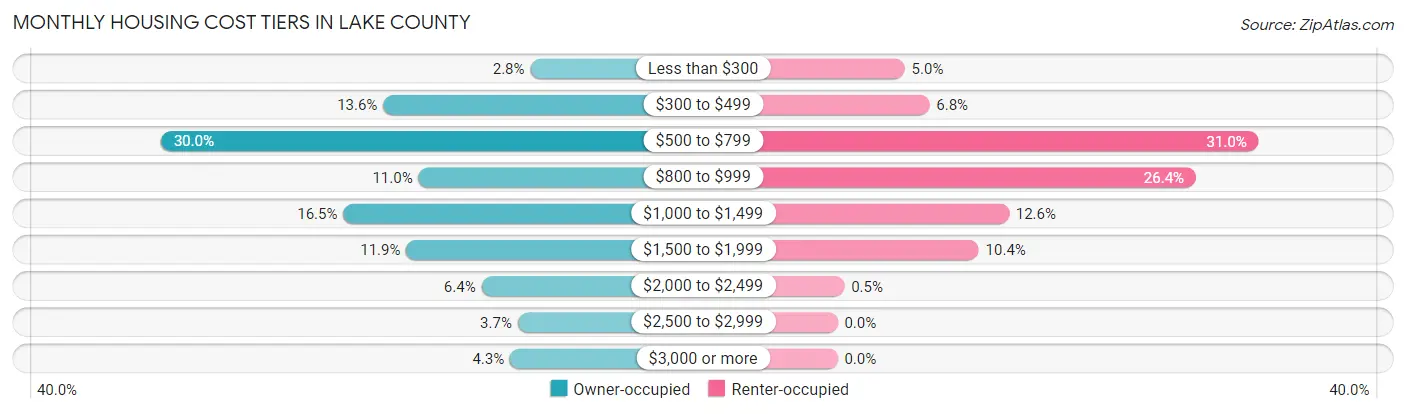
| Monthly Cost | Owner-occupied | Renter-occupied |
| Less than $300 | 92 (2.8%) | 60 (5.0%) |
| $300 to $499 | 454 (13.6%) | 82 (6.8%) |
| $500 to $799 | 1,001 (30.0%) | 376 (31.0%) |
| $800 to $999 | 367 (11.0%) | 320 (26.4%) |
| $1,000 to $1,499 | 552 (16.5%) | 153 (12.6%) |
| $1,500 to $1,999 | 397 (11.9%) | 126 (10.4%) |
| $2,000 to $2,499 | 212 (6.4%) | 6 (0.5%) |
| $2,500 to $2,999 | 123 (3.7%) | 0 (0.0%) |
| $3,000 or more | 142 (4.3%) | 0 (0.0%) |
| Total | 3,340 (100.0%) | 1,212 (100.0%) |
Physical Housing Characteristics in Lake County
Housing Structures in Lake County
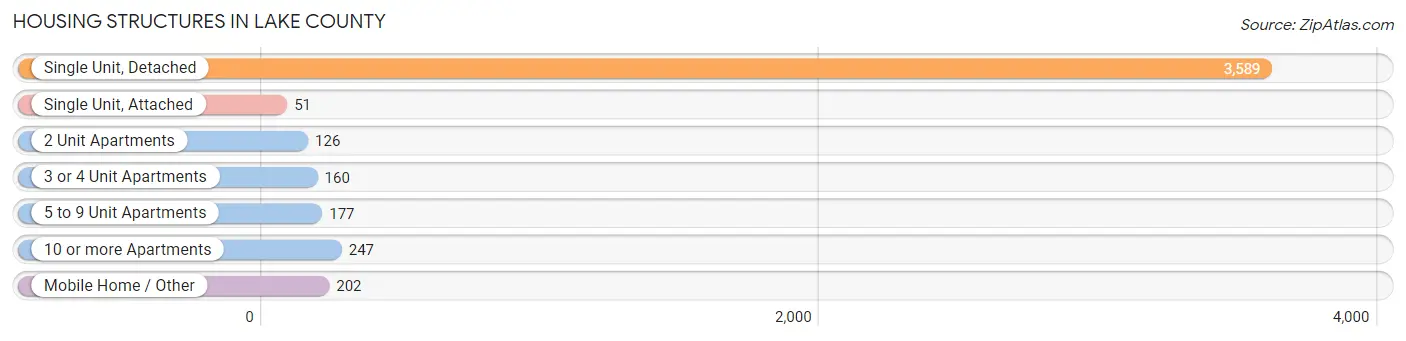
| Structure Type | # Housing Units | % Housing Units |
| Single Unit, Detached | 3,589 | 78.8% |
| Single Unit, Attached | 51 | 1.1% |
| 2 Unit Apartments | 126 | 2.8% |
| 3 or 4 Unit Apartments | 160 | 3.5% |
| 5 to 9 Unit Apartments | 177 | 3.9% |
| 10 or more Apartments | 247 | 5.4% |
| Mobile Home / Other | 202 | 4.4% |
| Total | 4,552 | 100.0% |
Housing Structures by Occupancy in Lake County
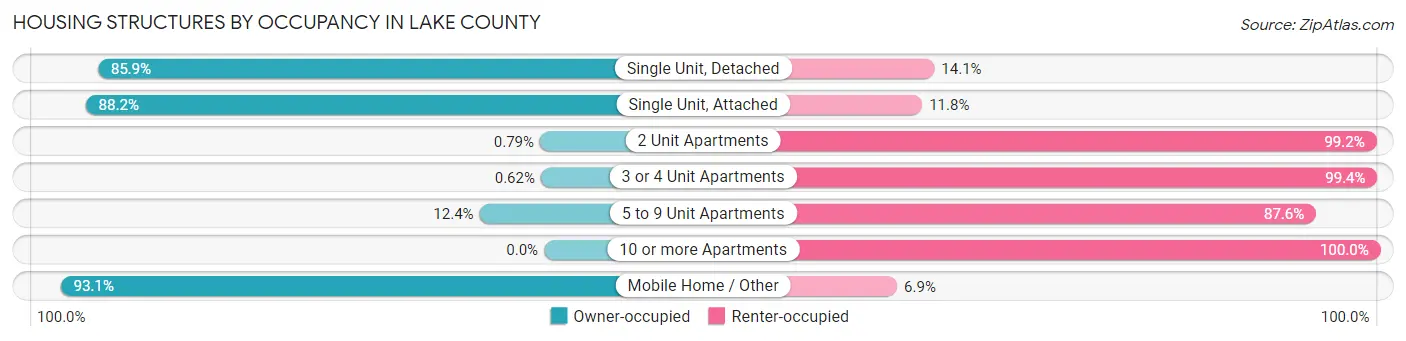
| Structure Type | Owner-occupied | Renter-occupied |
| Single Unit, Detached | 3,083 (85.9%) | 506 (14.1%) |
| Single Unit, Attached | 45 (88.2%) | 6 (11.8%) |
| 2 Unit Apartments | 1 (0.8%) | 125 (99.2%) |
| 3 or 4 Unit Apartments | 1 (0.6%) | 159 (99.4%) |
| 5 to 9 Unit Apartments | 22 (12.4%) | 155 (87.6%) |
| 10 or more Apartments | 0 (0.0%) | 247 (100.0%) |
| Mobile Home / Other | 188 (93.1%) | 14 (6.9%) |
| Total | 3,340 (73.4%) | 1,212 (26.6%) |
Housing Structures by Number of Rooms in Lake County
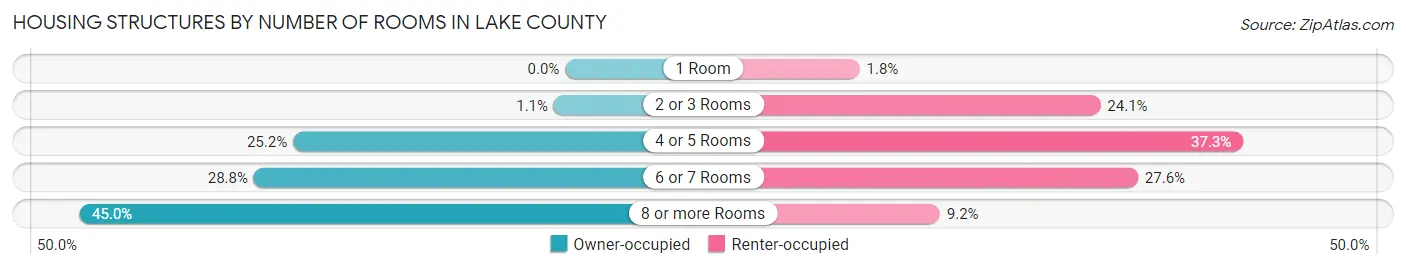
| Number of Rooms | Owner-occupied | Renter-occupied |
| 1 Room | 0 (0.0%) | 22 (1.8%) |
| 2 or 3 Rooms | 35 (1.1%) | 292 (24.1%) |
| 4 or 5 Rooms | 841 (25.2%) | 452 (37.3%) |
| 6 or 7 Rooms | 962 (28.8%) | 334 (27.6%) |
| 8 or more Rooms | 1,502 (45.0%) | 112 (9.2%) |
| Total | 3,340 (100.0%) | 1,212 (100.0%) |
Housing Structure by Heating Type in Lake County
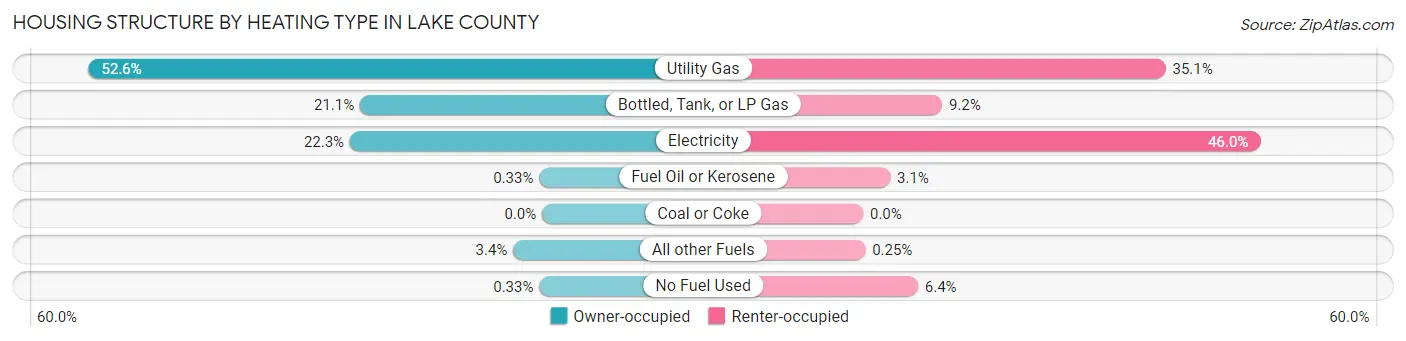
| Heating Type | Owner-occupied | Renter-occupied |
| Utility Gas | 1,757 (52.6%) | 425 (35.1%) |
| Bottled, Tank, or LP Gas | 705 (21.1%) | 111 (9.2%) |
| Electricity | 744 (22.3%) | 558 (46.0%) |
| Fuel Oil or Kerosene | 11 (0.3%) | 38 (3.1%) |
| Coal or Coke | 0 (0.0%) | 0 (0.0%) |
| All other Fuels | 112 (3.4%) | 3 (0.3%) |
| No Fuel Used | 11 (0.3%) | 77 (6.4%) |
| Total | 3,340 (100.0%) | 1,212 (100.0%) |
Household Vehicle Usage in Lake County
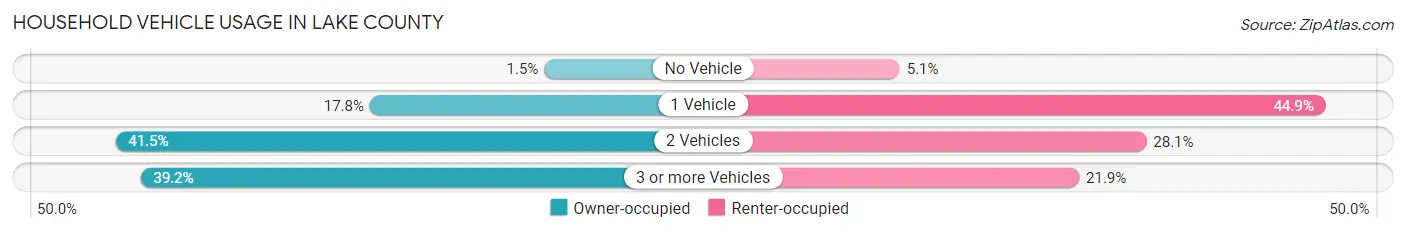
| Vehicles per Household | Owner-occupied | Renter-occupied |
| No Vehicle | 50 (1.5%) | 62 (5.1%) |
| 1 Vehicle | 594 (17.8%) | 544 (44.9%) |
| 2 Vehicles | 1,387 (41.5%) | 341 (28.1%) |
| 3 or more Vehicles | 1,309 (39.2%) | 265 (21.9%) |
| Total | 3,340 (100.0%) | 1,212 (100.0%) |
Real Estate & Mortgages in Lake County
Real Estate and Mortgage Overview in Lake County
| Characteristic | Without Mortgage | With Mortgage |
| Housing Units | 1,675 | 1,665 |
| Median Property Value | $170,200 | $228,900 |
| Median Household Income | $75,813 | $401 |
| Monthly Housing Costs | $565 | $142 |
| Real Estate Taxes | $2,149 | $12 |
Property Value by Mortgage Status in Lake County
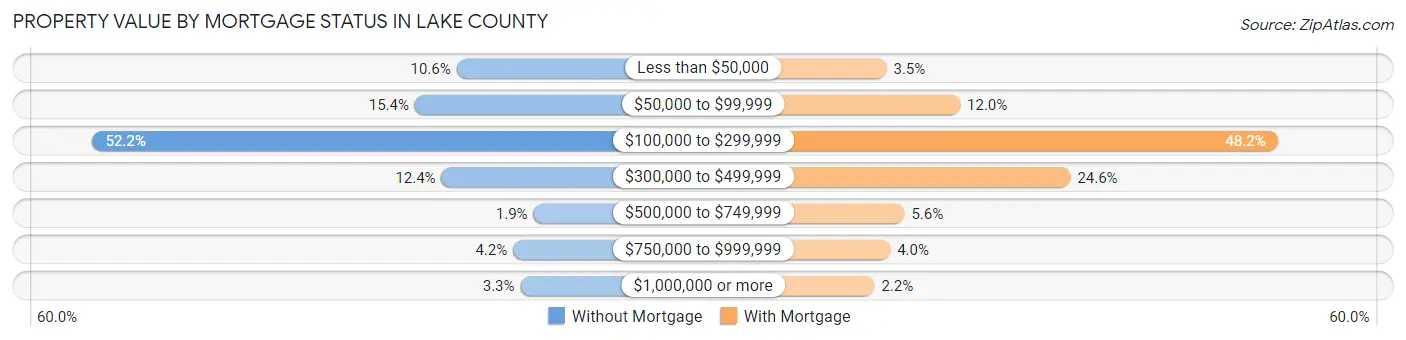
| Property Value | Without Mortgage | With Mortgage |
| Less than $50,000 | 178 (10.6%) | 59 (3.5%) |
| $50,000 to $99,999 | 258 (15.4%) | 199 (11.9%) |
| $100,000 to $299,999 | 875 (52.2%) | 803 (48.2%) |
| $300,000 to $499,999 | 207 (12.4%) | 409 (24.6%) |
| $500,000 to $749,999 | 31 (1.8%) | 93 (5.6%) |
| $750,000 to $999,999 | 70 (4.2%) | 66 (4.0%) |
| $1,000,000 or more | 56 (3.3%) | 36 (2.2%) |
| Total | 1,675 (100.0%) | 1,665 (100.0%) |
Household Income by Mortgage Status in Lake County
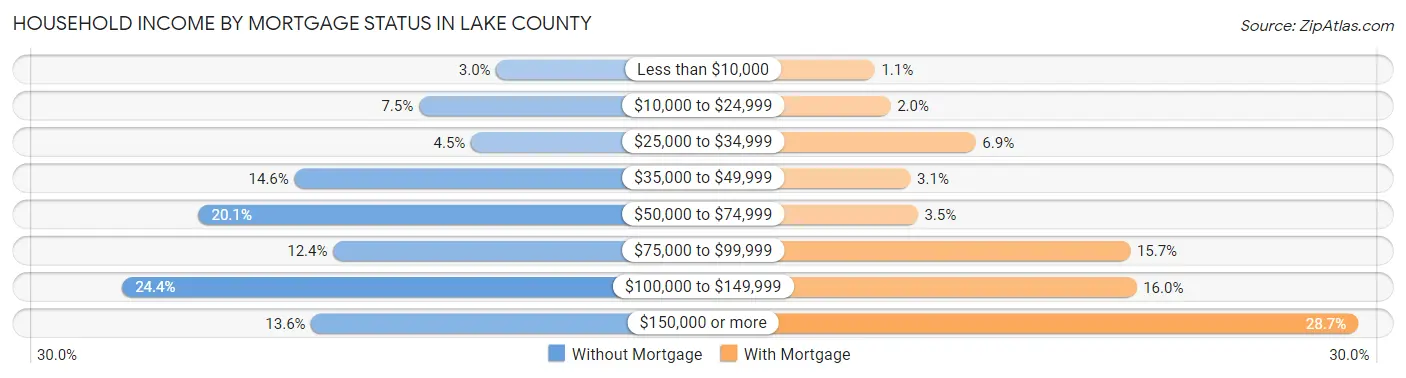
| Household Income | Without Mortgage | With Mortgage |
| Less than $10,000 | 51 (3.0%) | 18 (1.1%) |
| $10,000 to $24,999 | 125 (7.5%) | 33 (2.0%) |
| $25,000 to $34,999 | 75 (4.5%) | 114 (6.9%) |
| $35,000 to $49,999 | 244 (14.6%) | 52 (3.1%) |
| $50,000 to $74,999 | 336 (20.1%) | 59 (3.5%) |
| $75,000 to $99,999 | 207 (12.4%) | 261 (15.7%) |
| $100,000 to $149,999 | 409 (24.4%) | 267 (16.0%) |
| $150,000 or more | 228 (13.6%) | 478 (28.7%) |
| Total | 1,675 (100.0%) | 1,665 (100.0%) |
Property Value to Household Income Ratio in Lake County
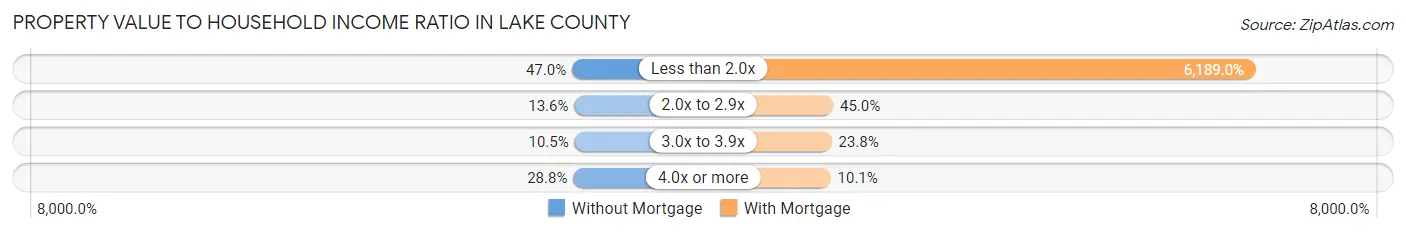
| Value-to-Income Ratio | Without Mortgage | With Mortgage |
| Less than 2.0x | 788 (47.0%) | 103,047 (6,189.0%) |
| 2.0x to 2.9x | 228 (13.6%) | 749 (45.0%) |
| 3.0x to 3.9x | 175 (10.4%) | 397 (23.8%) |
| 4.0x or more | 482 (28.8%) | 168 (10.1%) |
| Total | 1,675 (100.0%) | 1,665 (100.0%) |
Real Estate Taxes by Mortgage Status in Lake County
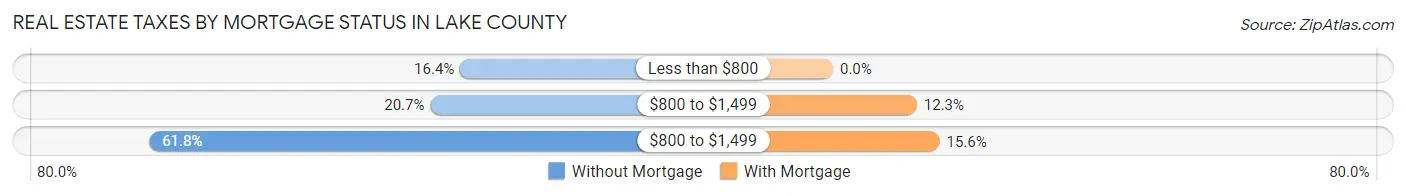
| Property Taxes | Without Mortgage | With Mortgage |
| Less than $800 | 274 (16.4%) | 0 (0.0%) |
| $800 to $1,499 | 347 (20.7%) | 204 (12.2%) |
| $800 to $1,499 | 1,035 (61.8%) | 259 (15.6%) |
| Total | 1,675 (100.0%) | 1,665 (100.0%) |
Health & Disability in Lake County
Health Insurance Coverage by Age in Lake County
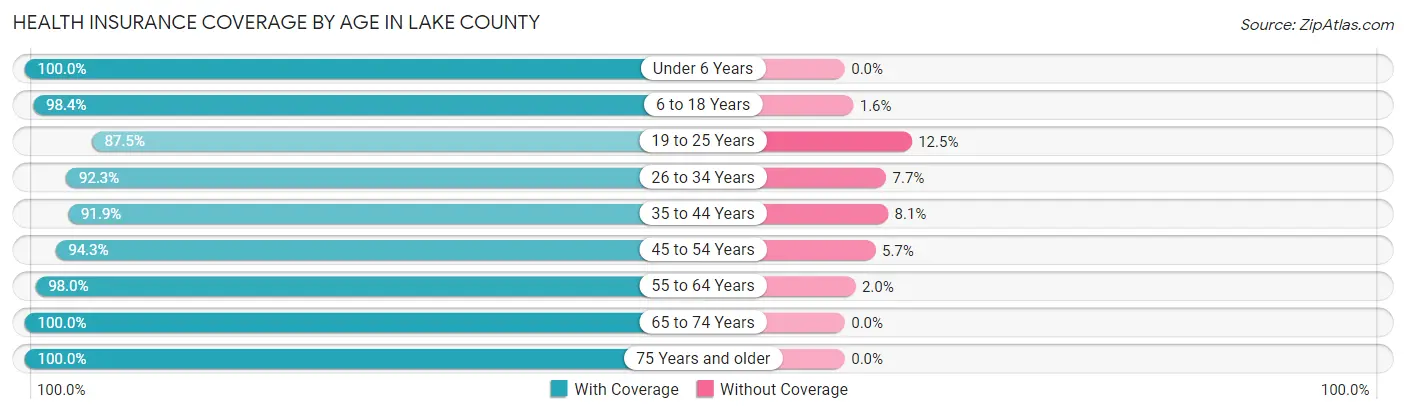
| Age Bracket | With Coverage | Without Coverage |
| Under 6 Years | 675 (100.0%) | 0 (0.0%) |
| 6 to 18 Years | 1,678 (98.4%) | 27 (1.6%) |
| 19 to 25 Years | 1,059 (87.5%) | 151 (12.5%) |
| 26 to 34 Years | 875 (92.3%) | 73 (7.7%) |
| 35 to 44 Years | 1,024 (91.9%) | 90 (8.1%) |
| 45 to 54 Years | 988 (94.3%) | 60 (5.7%) |
| 55 to 64 Years | 1,774 (98.0%) | 36 (2.0%) |
| 65 to 74 Years | 1,821 (100.0%) | 0 (0.0%) |
| 75 Years and older | 663 (100.0%) | 0 (0.0%) |
| Total | 10,557 (96.0%) | 437 (4.0%) |
Health Insurance Coverage by Citizenship Status in Lake County
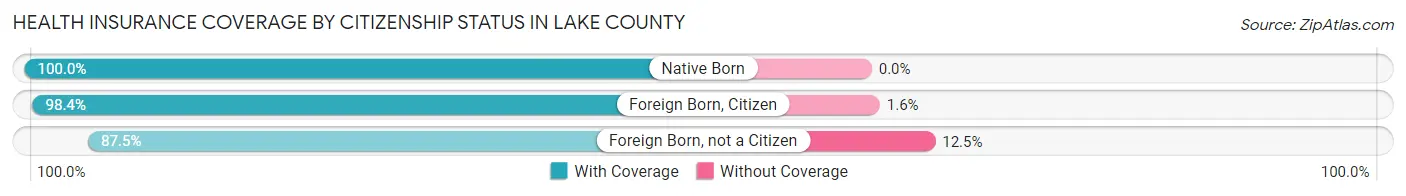
| Citizenship Status | With Coverage | Without Coverage |
| Native Born | 675 (100.0%) | 0 (0.0%) |
| Foreign Born, Citizen | 1,678 (98.4%) | 27 (1.6%) |
| Foreign Born, not a Citizen | 1,059 (87.5%) | 151 (12.5%) |
Health Insurance Coverage by Household Income in Lake County
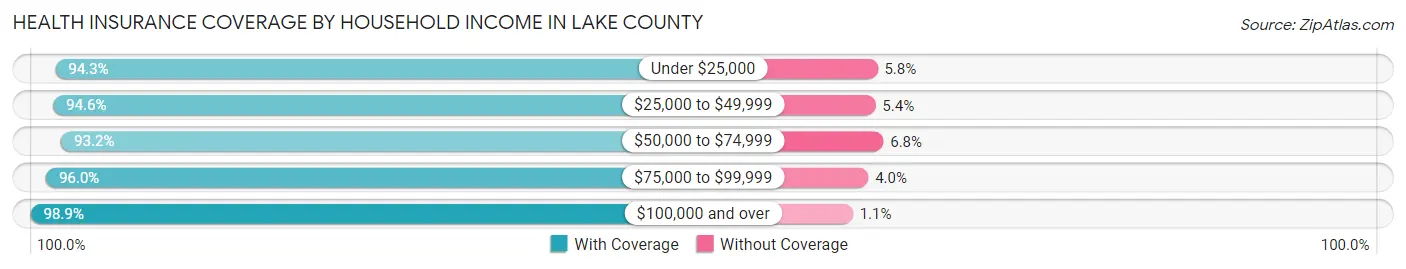
| Household Income | With Coverage | Without Coverage |
| Under $25,000 | 935 (94.3%) | 57 (5.8%) |
| $25,000 to $49,999 | 1,237 (94.6%) | 70 (5.4%) |
| $50,000 to $74,999 | 2,275 (93.2%) | 167 (6.8%) |
| $75,000 to $99,999 | 1,411 (96.0%) | 59 (4.0%) |
| $100,000 and over | 4,366 (98.9%) | 49 (1.1%) |
Public vs Private Health Insurance Coverage by Age in Lake County
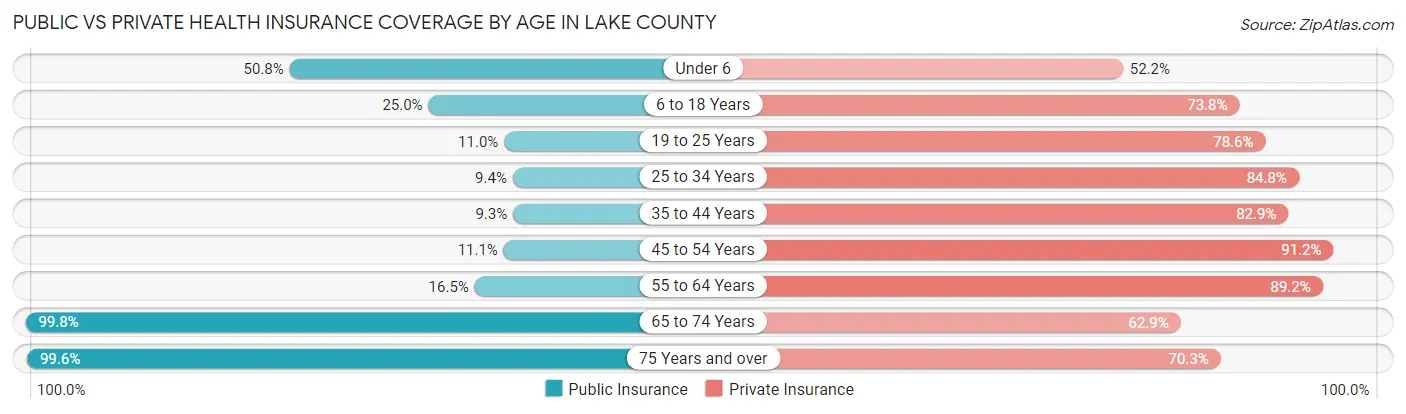
| Age Bracket | Public Insurance | Private Insurance |
| Under 6 | 343 (50.8%) | 352 (52.1%) |
| 6 to 18 Years | 427 (25.0%) | 1,258 (73.8%) |
| 19 to 25 Years | 133 (11.0%) | 951 (78.6%) |
| 25 to 34 Years | 89 (9.4%) | 804 (84.8%) |
| 35 to 44 Years | 104 (9.3%) | 923 (82.9%) |
| 45 to 54 Years | 116 (11.1%) | 956 (91.2%) |
| 55 to 64 Years | 298 (16.5%) | 1,615 (89.2%) |
| 65 to 74 Years | 1,818 (99.8%) | 1,145 (62.9%) |
| 75 Years and over | 660 (99.6%) | 466 (70.3%) |
| Total | 3,988 (36.3%) | 8,470 (77.0%) |
Disability Status by Sex by Age in Lake County
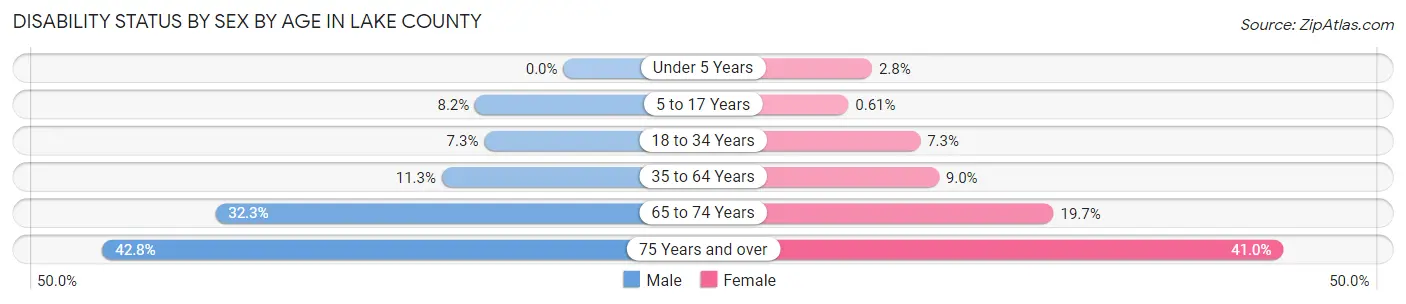
| Age Bracket | Male | Female |
| Under 5 Years | 0 (0.0%) | 9 (2.8%) |
| 5 to 17 Years | 69 (8.2%) | 5 (0.6%) |
| 18 to 34 Years | 95 (7.3%) | 73 (7.3%) |
| 35 to 64 Years | 229 (11.3%) | 175 (9.0%) |
| 65 to 74 Years | 312 (32.3%) | 168 (19.7%) |
| 75 Years and over | 151 (42.8%) | 127 (41.0%) |
Disability Class by Sex by Age in Lake County
Disability Class: Hearing Difficulty
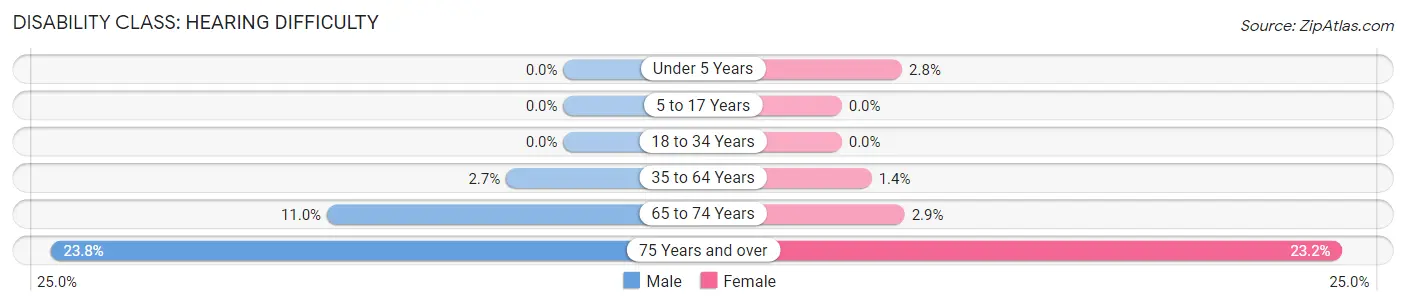
| Age Bracket | Male | Female |
| Under 5 Years | 0 (0.0%) | 9 (2.8%) |
| 5 to 17 Years | 0 (0.0%) | 0 (0.0%) |
| 18 to 34 Years | 0 (0.0%) | 0 (0.0%) |
| 35 to 64 Years | 54 (2.7%) | 27 (1.4%) |
| 65 to 74 Years | 106 (11.0%) | 25 (2.9%) |
| 75 Years and over | 84 (23.8%) | 72 (23.2%) |
Disability Class: Vision Difficulty
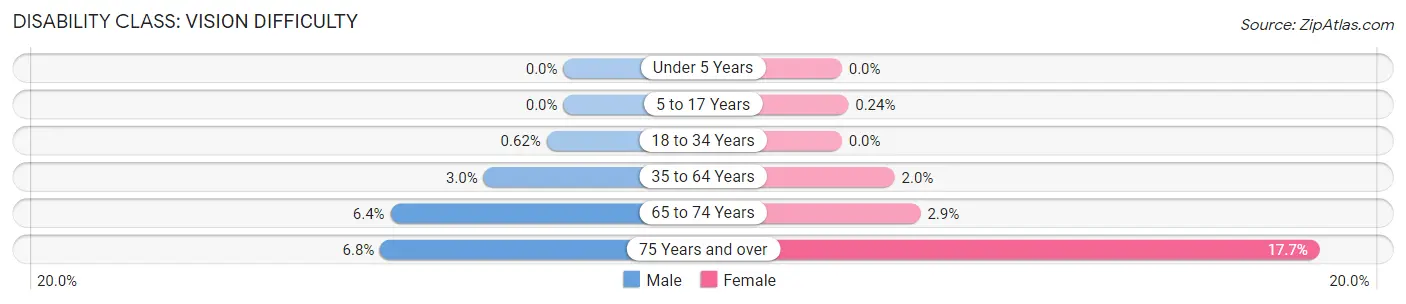
| Age Bracket | Male | Female |
| Under 5 Years | 0 (0.0%) | 0 (0.0%) |
| 5 to 17 Years | 0 (0.0%) | 2 (0.2%) |
| 18 to 34 Years | 8 (0.6%) | 0 (0.0%) |
| 35 to 64 Years | 60 (3.0%) | 38 (2.0%) |
| 65 to 74 Years | 62 (6.4%) | 25 (2.9%) |
| 75 Years and over | 24 (6.8%) | 55 (17.7%) |
Disability Class: Cognitive Difficulty
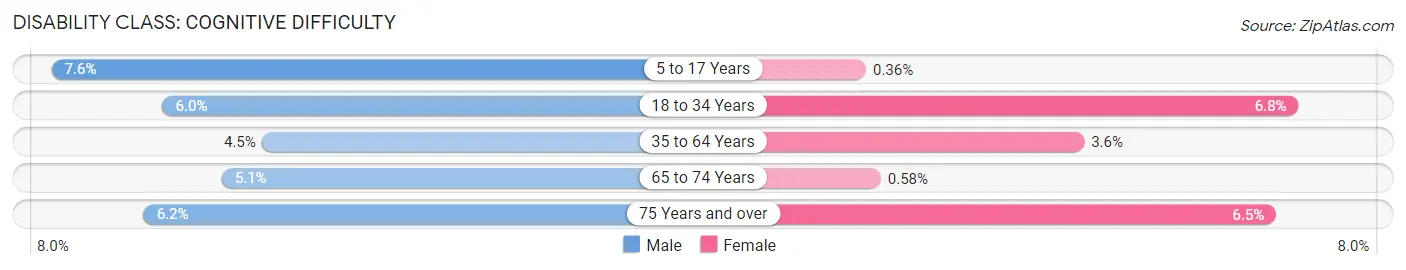
| Age Bracket | Male | Female |
| 5 to 17 Years | 64 (7.6%) | 3 (0.4%) |
| 18 to 34 Years | 77 (5.9%) | 68 (6.8%) |
| 35 to 64 Years | 91 (4.5%) | 70 (3.6%) |
| 65 to 74 Years | 49 (5.1%) | 5 (0.6%) |
| 75 Years and over | 22 (6.2%) | 20 (6.5%) |
Disability Class: Ambulatory Difficulty
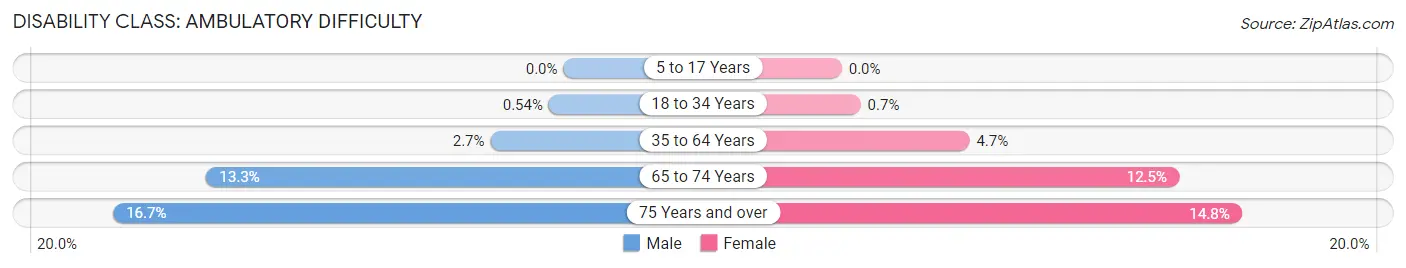
| Age Bracket | Male | Female |
| 5 to 17 Years | 0 (0.0%) | 0 (0.0%) |
| 18 to 34 Years | 7 (0.5%) | 7 (0.7%) |
| 35 to 64 Years | 55 (2.7%) | 92 (4.7%) |
| 65 to 74 Years | 128 (13.3%) | 107 (12.5%) |
| 75 Years and over | 59 (16.7%) | 46 (14.8%) |
Disability Class: Self-Care Difficulty
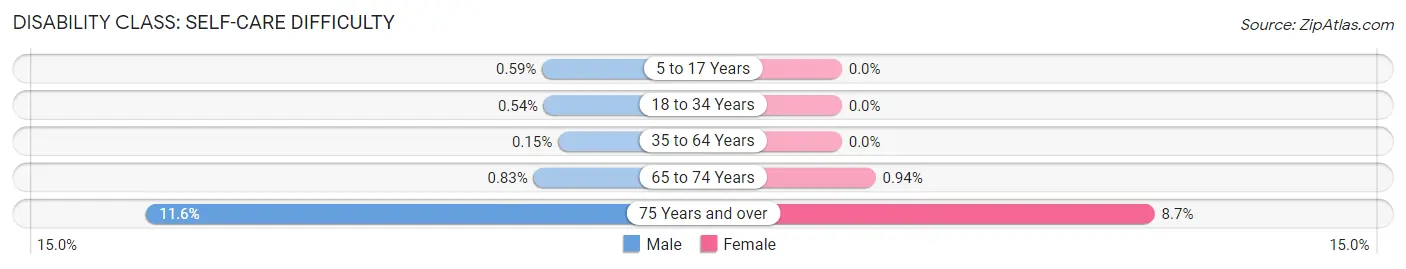
| Age Bracket | Male | Female |
| 5 to 17 Years | 5 (0.6%) | 0 (0.0%) |
| 18 to 34 Years | 7 (0.5%) | 0 (0.0%) |
| 35 to 64 Years | 3 (0.2%) | 0 (0.0%) |
| 65 to 74 Years | 8 (0.8%) | 8 (0.9%) |
| 75 Years and over | 41 (11.6%) | 27 (8.7%) |
Technology Access in Lake County
Computing Device Access in Lake County
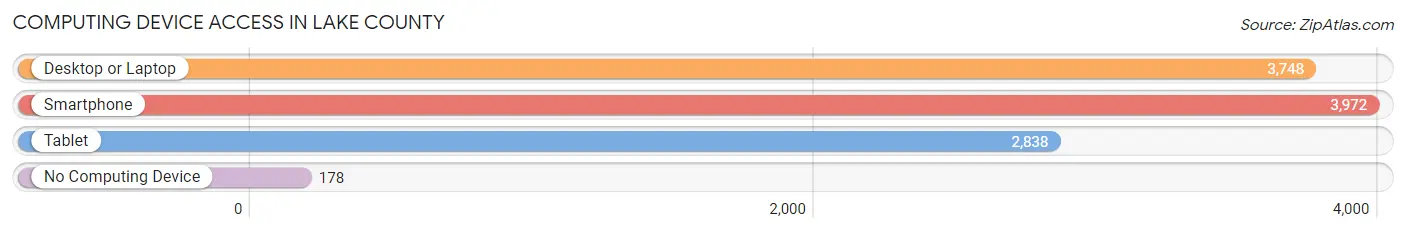
| Device Type | # Households | % Households |
| Desktop or Laptop | 3,748 | 82.3% |
| Smartphone | 3,972 | 87.3% |
| Tablet | 2,838 | 62.4% |
| No Computing Device | 178 | 3.9% |
| Total | 4,552 | 100.0% |
Internet Access in Lake County
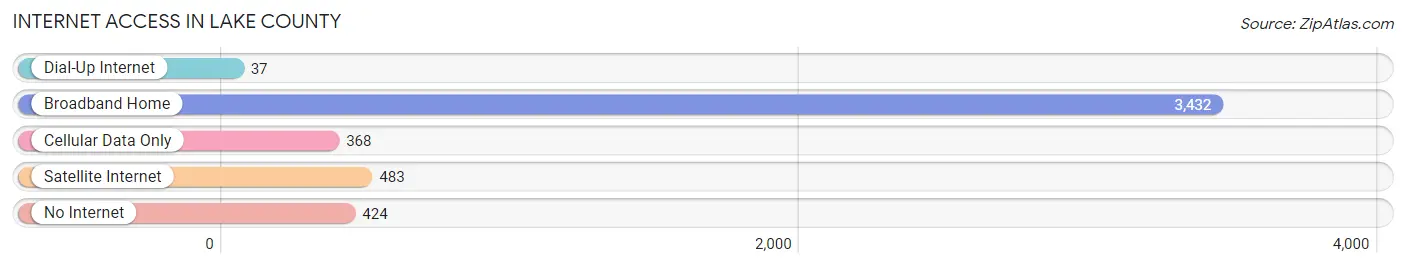
| Internet Type | # Households | % Households |
| Dial-Up Internet | 37 | 0.8% |
| Broadband Home | 3,432 | 75.4% |
| Cellular Data Only | 368 | 8.1% |
| Satellite Internet | 483 | 10.6% |
| No Internet | 424 | 9.3% |
| Total | 4,552 | 100.0% |
Lake County Summary
Lake County, South Dakota is located in the northeastern corner of the state and is bordered by the states of North Dakota and Minnesota. It is the second-smallest county in South Dakota, with an area of only 576 square miles. The county seat is Madison, and the largest city is Madison.
History
Lake County was established in 1873 and was named after the many lakes in the area. The county was originally part of the Dakota Territory, and was part of the original 1868 treaty with the Sioux Nation. The county was organized in 1873, and the first county seat was located in Madison.
The county was largely rural until the early 1900s, when the railroad came through the area. This brought an influx of settlers and businesses, and the county began to grow. The county was also home to several Native American tribes, including the Dakota, Lakota, and Nakota.
Geography
Lake County is located in the northeastern corner of South Dakota, and is bordered by the states of North Dakota and Minnesota. It is the second-smallest county in South Dakota, with an area of only 576 square miles. The county is mostly flat, with rolling hills in the western part of the county. The county is home to several lakes, including Lake Madison, Lake Herman, and Lake Poinsett.
The county is located in the Central Plains region of the United States, and is part of the Great Plains region. The climate is continental, with cold winters and hot summers. The average annual temperature is 48°F, and the average annual precipitation is 22 inches.
Economy
The economy of Lake County is largely based on agriculture. The county is home to several large farms, and the main crops grown in the county are corn, soybeans, wheat, and hay. The county is also home to several small businesses, including restaurants, retail stores, and service providers.
The county is also home to several manufacturing companies, including a furniture manufacturer, a plastics manufacturer, and a food processing plant. The county is also home to several tourist attractions, including the Lake Herman State Park, the Madison Aquatic Center, and the Madison County Museum.
Demographics
As of the 2010 census, the population of Lake County was 6,822. The population is largely white (94.3%), with small percentages of Native American (2.2%), African American (1.2%), and Asian (0.7%) populations. The median household income is $45,813, and the median home value is $127,400.
The county is home to several small towns, including Madison, Lake Madison, and Lake Herman. The county is also home to several unincorporated communities, including Lake Poinsett, Lake Thompson, and Lake Traverse.
Conclusion
Lake County, South Dakota is a small county located in the northeastern corner of the state. The county is largely rural, and the economy is based on agriculture. The population is largely white, and the median household income is $45,813. The county is home to several small towns and unincorporated communities, and is also home to several tourist attractions.
Common Questions
What is the Total Population of Lake County?
Total Population of Lake County is 11,207.
What is the Total Male Population of Lake County?
Total Male Population of Lake County is 5,839.
What is the Total Female Population of Lake County?
Total Female Population of Lake County is 5,368.
What is the Ratio of Males per 100 Females in Lake County?
There are 108.77 Males per 100 Females in Lake County.
What is the Ratio of Females per 100 Males in Lake County?
There are 91.93 Females per 100 Males in Lake County.
What is the Median Population Age in Lake County?
Median Population Age in Lake County is 44.3 Years.
What is the Average Family Size in Lake County
Average Family Size in Lake County is 3.0 People.
What is the Average Household Size in Lake County
Average Household Size in Lake County is 2.4 People.
What is Per Capita Income in Lake County?
Per Capita income in Lake County is $44,809.
What is the Median Family Income in Lake County?
Median Family Income in Lake County is $90,750.
What is the Median Household income in Lake County?
Median Household Income in Lake County is $74,884.
What is Income or Wage Gap in Lake County?
Income or Wage Gap in Lake County is 19.9%.
Women in Lake County earn 80.1 cents for every dollar earned by a man.
What is Inequality or Gini Index in Lake County?
Inequality or Gini Index in Lake County is 0.48.
How Large is the Labor Force in Lake County?
There are 6,162 People in the Labor Forcein in Lake County.
What is the Percentage of People in the Labor Force in Lake County?
66.9% of People are in the Labor Force in Lake County.
What is the Unemployment Rate in Lake County?
Unemployment Rate in Lake County is 1.6%.