Jerauld County, SD
Jerauld County Map
Jerauld County Overview
1,836
TOTAL POPULATION
916
MALE POPULATION
920
FEMALE POPULATION
99.57
MALES / 100 FEMALES
100.44
FEMALES / 100 MALES
50.5
MEDIAN AGE
2.7
AVG FAMILY SIZE
2.1
AVG HOUSEHOLD SIZE
$47,964
PER CAPITA INCOME
$88,563
AVG FAMILY INCOME
$66,607
AVG HOUSEHOLD INCOME
59.5%
WAGE / INCOME GAP [ % ]
40.5¢/ $1
WAGE / INCOME GAP [ $ ]
$10,150
FAMILY INCOME DEFICIT
0.53
INEQUALITY / GINI INDEX
975
LABOR FORCE [ PEOPLE ]
65.1%
PERCENT IN LABOR FORCE
0.7%
UNEMPLOYMENT RATE
Jerauld County Area Codes
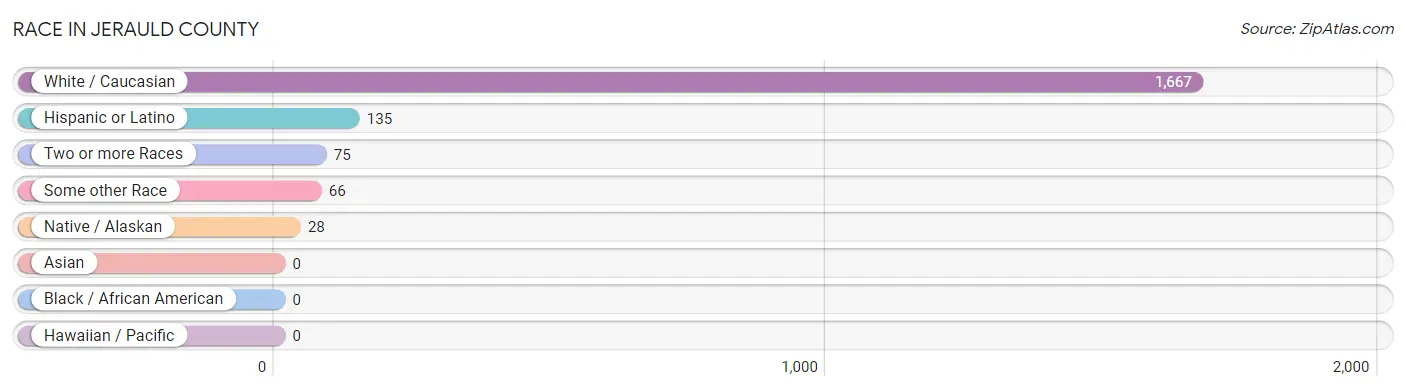
Race in Jerauld County
The most populous races in Jerauld County are White / Caucasian (1,667 | 90.8%), Hispanic or Latino (135 | 7.3%), and Two or more Races (75 | 4.1%).
| Race | # Population | % Population |
| Asian | 0 | 0.0% |
| Black / African American | 0 | 0.0% |
| Hawaiian / Pacific | 0 | 0.0% |
| Hispanic or Latino | 135 | 7.3% |
| Native / Alaskan | 28 | 1.5% |
| White / Caucasian | 1,667 | 90.8% |
| Two or more Races | 75 | 4.1% |
| Some other Race | 66 | 3.6% |
| Total | 1,836 | 100.0% |
Ancestry in Jerauld County
The most populous ancestries reported in Jerauld County are German (736 | 40.1%), Norwegian (315 | 17.2%), American (231 | 12.6%), Irish (185 | 10.1%), and English (130 | 7.1%), together accounting for 87.0% of all Jerauld County residents.

| Ancestry | # Population | % Population |
| American | 231 | 12.6% |
| Armenian | 2 | 0.1% |
| Austrian | 6 | 0.3% |
| Bhutanese | 3 | 0.2% |
| British | 12 | 0.6% |
| Central American | 104 | 5.7% |
| Cheyenne | 4 | 0.2% |
| Chippewa | 17 | 0.9% |
| Czech | 45 | 2.5% |
| Danish | 44 | 2.4% |
| Dutch | 30 | 1.6% |
| English | 130 | 7.1% |
| European | 20 | 1.1% |
| Finnish | 2 | 0.1% |
| French | 28 | 1.5% |
| German | 736 | 40.1% |
| Guatemalan | 104 | 5.7% |
| Hungarian | 1 | 0.1% |
| Irish | 185 | 10.1% |
| Italian | 12 | 0.6% |
| Mexican | 11 | 0.6% |
| Norwegian | 315 | 17.2% |
| Polish | 34 | 1.8% |
| Puerto Rican | 3 | 0.2% |
| Russian | 24 | 1.3% |
| Scandinavian | 5 | 0.3% |
| Scotch-Irish | 5 | 0.3% |
| Scottish | 46 | 2.5% |
| Sioux | 15 | 0.8% |
| Spanish | 13 | 0.7% |
| Swedish | 23 | 1.3% |
| Swiss | 13 | 0.7% |
| Welsh | 16 | 0.9% | View All 33 Rows |
Immigrants in Jerauld County
The most numerous immigrant groups reported in Jerauld County came from Central America (50 | 2.7%), Latin America (50 | 2.7%), Guatemala (44 | 2.4%), Africa (7 | 0.4%), and Eastern Africa (7 | 0.4%), together accounting for 8.6% of all Jerauld County residents.

| Immigration Origin | # Population | % Population |
| Africa | 7 | 0.4% |
| Armenia | 2 | 0.1% |
| Asia | 2 | 0.1% |
| Central America | 50 | 2.7% |
| Eastern Africa | 7 | 0.4% |
| Europe | 1 | 0.1% |
| Guatemala | 44 | 2.4% |
| Kenya | 7 | 0.4% |
| Latin America | 50 | 2.7% |
| Mexico | 6 | 0.3% |
| Northern Europe | 1 | 0.1% |
| Sweden | 1 | 0.1% |
| Western Asia | 2 | 0.1% | View All 13 Rows |
Sex and Age in Jerauld County
Sex and Age in Jerauld County
The most populous age groups in Jerauld County are 65 to 69 Years (112 | 12.2%) for men and 65 to 69 Years (82 | 8.9%) for women.

| Age Bracket | Male | Female |
| Under 5 Years | 46 (5.0%) | 39 (4.2%) |
| 5 to 9 Years | 31 (3.4%) | 54 (5.9%) |
| 10 to 14 Years | 102 (11.1%) | 49 (5.3%) |
| 15 to 19 Years | 53 (5.8%) | 44 (4.8%) |
| 20 to 24 Years | 6 (0.7%) | 16 (1.7%) |
| 25 to 29 Years | 41 (4.5%) | 42 (4.6%) |
| 30 to 34 Years | 27 (2.9%) | 53 (5.8%) |
| 35 to 39 Years | 47 (5.1%) | 49 (5.3%) |
| 40 to 44 Years | 61 (6.7%) | 75 (8.2%) |
| 45 to 49 Years | 59 (6.4%) | 20 (2.2%) |
| 50 to 54 Years | 65 (7.1%) | 44 (4.8%) |
| 55 to 59 Years | 61 (6.7%) | 78 (8.5%) |
| 60 to 64 Years | 59 (6.4%) | 47 (5.1%) |
| 65 to 69 Years | 112 (12.2%) | 82 (8.9%) |
| 70 to 74 Years | 51 (5.6%) | 64 (7.0%) |
| 75 to 79 Years | 38 (4.2%) | 51 (5.5%) |
| 80 to 84 Years | 37 (4.0%) | 56 (6.1%) |
| 85 Years and over | 20 (2.2%) | 57 (6.2%) |
| Total | 916 (100.0%) | 920 (100.0%) |
Families and Households in Jerauld County
Median Family Size in Jerauld County
The median family size in Jerauld County is 2.67 persons per family, with single female/mother families (27 | 5.0%) accounting for the largest median family size of 3 persons per family. On the other hand, single male/father families (16 | 3.0%) represent the smallest median family size with 2.44 persons per family.

| Family Type | # Families | Family Size |
| Married-Couple | 496 (92.0%) | 2.66 |
| Single Male/Father | 16 (3.0%) | 2.44 |
| Single Female/Mother | 27 (5.0%) | 3.00 |
| Total Families | 539 (100.0%) | 2.67 |
Median Household Size in Jerauld County
The median household size in Jerauld County is 2.08 persons per household, with single female/mother households (27 | 3.1%) accounting for the largest median household size of 3.19 persons per household. non-family households (320 | 37.2%) represent the smallest median household size with 1.08 persons per household.

| Household Type | # Households | Household Size |
| Married-Couple | 496 (57.7%) | 2.66 |
| Single Male/Father | 16 (1.9%) | 2.44 |
| Single Female/Mother | 27 (3.1%) | 3.19 |
| Non-family | 320 (37.2%) | 1.08 |
| Total Households | 859 (100.0%) | 2.08 |
Household Size by Marriage Status in Jerauld County
Out of a total of 859 households in Jerauld County, 539 (62.7%) are family households, while 320 (37.2%) are nonfamily households. The most numerous type of family households are 2-person households, comprising 314, and the most common type of nonfamily households are 1-person households, comprising 289.

| Household Size | Family Households | Nonfamily Households |
| 1-Person Households | - | 289 (33.6%) |
| 2-Person Households | 314 (36.5%) | 31 (3.6%) |
| 3-Person Households | 59 (6.9%) | 0 (0.0%) |
| 4-Person Households | 71 (8.3%) | 0 (0.0%) |
| 5-Person Households | 82 (9.6%) | 0 (0.0%) |
| 6-Person Households | 11 (1.3%) | 0 (0.0%) |
| 7+ Person Households | 2 (0.2%) | 0 (0.0%) |
| Total | 539 (62.7%) | 320 (37.2%) |
Female Fertility in Jerauld County
Fertility by Age in Jerauld County
Average fertility rate in Jerauld County is 115.0 births per 1,000 women. Women in the age bracket of 35 to 50 years have the highest fertility rate with 215.0 births per 1,000 women. Women in the age bracket of 35 to 50 years acount for 91.4% of all women with births.

| Age Bracket | Women with Births | Births / 1,000 Women |
| 15 to 19 years | 0 (0.0%) | 0.0 |
| 20 to 34 years | 3 (8.6%) | 27.0 |
| 35 to 50 years | 32 (91.4%) | 215.0 |
| Total | 35 (100.0%) | 115.0 |
Fertility by Age by Marriage Status in Jerauld County

| Age Bracket | Married | Unmarried |
| 15 to 19 years | 0 (0.0%) | 0 (0.0%) |
| 20 to 34 years | 3 (100.0%) | 0 (0.0%) |
| 35 to 50 years | 32 (100.0%) | 0 (0.0%) |
| Total | 35 (100.0%) | 0 (0.0%) |
Fertility by Education in Jerauld County

| Educational Attainment | Women with Births | Births / 1,000 Women |
| Less than High School | 0 (0.0%) | 0.0 |
| High School Diploma | 28 (80.0%) | 412.0 |
| College or Associate's Degree | 3 (8.6%) | 27.0 |
| Bachelor's Degree | 3 (8.6%) | 52.0 |
| Graduate Degree | 1 (2.9%) | 45.0 |
| Total | 35 (100.0%) | 115.0 |
Fertility by Education by Marriage Status in Jerauld County
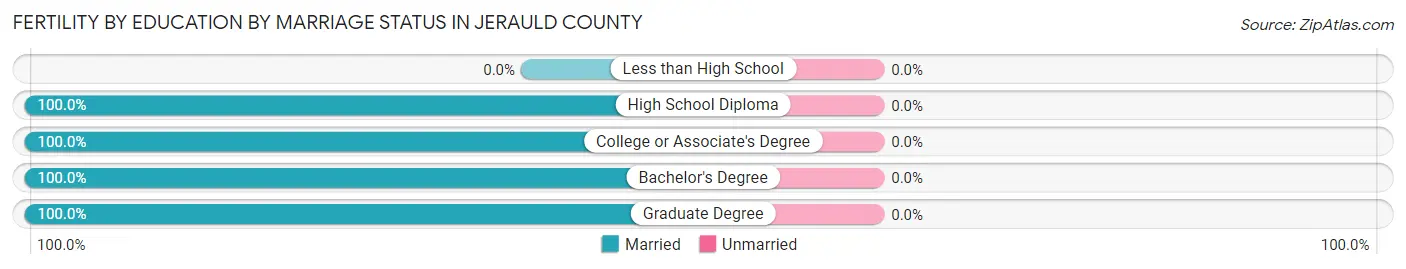
| Educational Attainment | Married | Unmarried |
| Less than High School | 0 (0.0%) | 0 (0.0%) |
| High School Diploma | 28 (100.0%) | 0 (0.0%) |
| College or Associate's Degree | 3 (100.0%) | 0 (0.0%) |
| Bachelor's Degree | 3 (100.0%) | 0 (0.0%) |
| Graduate Degree | 1 (100.0%) | 0 (0.0%) |
| Total | 35 (100.0%) | 0 (0.0%) |
Income in Jerauld County
Income Overview in Jerauld County
Per Capita Income in Jerauld County is $47,964, while median incomes of families and households are $88,563 and $66,607 respectively.
| Characteristic | Number | Measure |
| Per Capita Income | 1,836 | $47,964 |
| Median Family Income | 539 | $88,563 |
| Mean Family Income | 539 | $118,687 |
| Median Household Income | 859 | $66,607 |
| Mean Household Income | 859 | $103,242 |
| Income Deficit | 539 | $10,150 |
| Wage / Income Gap (%) | 1,836 | 59.46% |
| Wage / Income Gap ($) | 1,836 | 40.54¢ per $1 |
| Gini / Inequality Index | 1,836 | 0.53 |
Earnings by Sex in Jerauld County
Average Earnings in Jerauld County are $39,821, $55,368 for men and $22,447 for women, a difference of 59.5%.

| Sex | Number | Average Earnings |
| Male | 544 (51.4%) | $55,368 |
| Female | 515 (48.6%) | $22,447 |
| Total | 1,059 (100.0%) | $39,821 |
Earnings by Sex by Income Bracket in Jerauld County
The most common earnings brackets in Jerauld County are $75,000 to $99,999 for men (113 | 20.8%) and $20,000 to $22,499 for women (71 | 13.8%).

| Income | Male | Female |
| $2,499 or less | 32 (5.9%) | 42 (8.2%) |
| $2,500 to $4,999 | 6 (1.1%) | 27 (5.2%) |
| $5,000 to $7,499 | 6 (1.1%) | 43 (8.4%) |
| $7,500 to $9,999 | 0 (0.0%) | 12 (2.3%) |
| $10,000 to $12,499 | 1 (0.2%) | 7 (1.4%) |
| $12,500 to $14,999 | 11 (2.0%) | 26 (5.1%) |
| $15,000 to $17,499 | 29 (5.3%) | 13 (2.5%) |
| $17,500 to $19,999 | 2 (0.4%) | 18 (3.5%) |
| $20,000 to $22,499 | 16 (2.9%) | 71 (13.8%) |
| $22,500 to $24,999 | 9 (1.7%) | 7 (1.4%) |
| $25,000 to $29,999 | 20 (3.7%) | 37 (7.2%) |
| $30,000 to $34,999 | 35 (6.4%) | 26 (5.1%) |
| $35,000 to $39,999 | 10 (1.8%) | 24 (4.7%) |
| $40,000 to $44,999 | 28 (5.1%) | 25 (4.9%) |
| $45,000 to $49,999 | 40 (7.3%) | 14 (2.7%) |
| $50,000 to $54,999 | 22 (4.0%) | 24 (4.7%) |
| $55,000 to $64,999 | 86 (15.8%) | 31 (6.0%) |
| $65,000 to $74,999 | 36 (6.6%) | 3 (0.6%) |
| $75,000 to $99,999 | 113 (20.8%) | 33 (6.4%) |
| $100,000+ | 42 (7.7%) | 32 (6.2%) |
| Total | 544 (100.0%) | 515 (100.0%) |
Earnings by Sex by Educational Attainment in Jerauld County
Average earnings in Jerauld County are $56,875 for men and $25,962 for women, a difference of 54.3%. Men with an educational attainment of less than high school enjoy the highest average annual earnings of $63,333, while those with graduate degree education earn the least with $41,172. Women with an educational attainment of graduate degree earn the most with the average annual earnings of $75,938, while those with high school diploma education have the smallest earnings of $20,964.

| Educational Attainment | Male Income | Female Income |
| Less than High School | $63,333 | $0 |
| High School Diploma | $56,786 | $20,964 |
| College or Associate's Degree | $59,688 | $21,389 |
| Bachelor's Degree | $59,583 | $53,194 |
| Graduate Degree | $41,172 | $75,938 |
| Total | $56,875 | $25,962 |
Family Income in Jerauld County
Family Income Brackets in Jerauld County
According to the Jerauld County family income data, there are 145 families falling into the $100,000 to $149,999 income range, which is the most common income bracket and makes up 26.9% of all families. Conversely, the $10,000 to $14,999 income bracket is the least frequent group with only 3 families (0.6%) belonging to this category.

| Income Bracket | # Families | % Families |
| Less than $10,000 | 10 | 1.9% |
| $10,000 to $14,999 | 3 | 0.6% |
| $15,000 to $24,999 | 13 | 2.4% |
| $25,000 to $34,999 | 18 | 3.3% |
| $35,000 to $49,999 | 72 | 13.4% |
| $50,000 to $74,999 | 95 | 17.6% |
| $75,000 to $99,999 | 100 | 18.6% |
| $100,000 to $149,999 | 145 | 26.9% |
| $150,000 to $199,999 | 26 | 4.8% |
| $200,000+ | 57 | 10.6% |
Family Income by Famaliy Size in Jerauld County
5-person families (77 | 14.3%) account for the highest median family income in Jerauld County with $118,715 per family, while 2-person families (314 | 58.3%) have the highest median income of $40,625 per family member.

| Income Bracket | # Families | Median Income |
| 2-Person Families | 314 (58.3%) | $81,250 |
| 3-Person Families | 59 (11.0%) | $91,193 |
| 4-Person Families | 76 (14.1%) | $85,556 |
| 5-Person Families | 77 (14.3%) | $118,715 |
| 6-Person Families | 11 (2.0%) | $0 |
| 7+ Person Families | 2 (0.4%) | $0 |
| Total | 539 (100.0%) | $88,563 |
Family Income by Number of Earners in Jerauld County

| Number of Earners | # Families | Median Income |
| No Earners | 55 (10.2%) | $0 |
| 1 Earner | 160 (29.7%) | $67,500 |
| 2 Earners | 287 (53.2%) | $108,523 |
| 3+ Earners | 37 (6.9%) | $163,750 |
| Total | 539 (100.0%) | $88,563 |
Household Income in Jerauld County
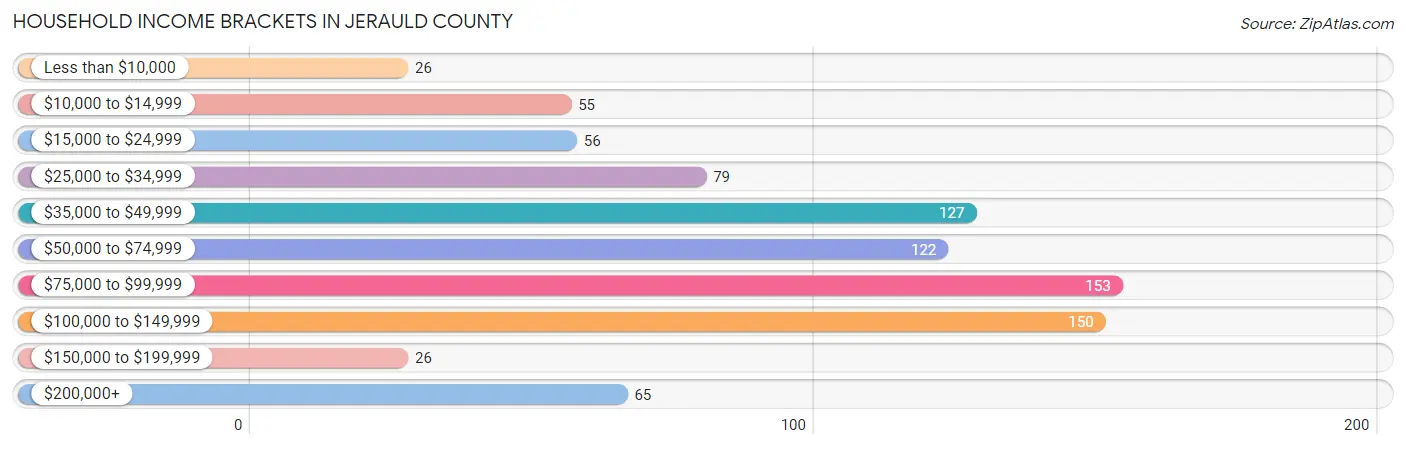
Household Income Brackets in Jerauld County
With 153 households falling in the category, the $75,000 to $99,999 income range is the most frequent in Jerauld County, accounting for 17.8% of all households. In contrast, only 26 households (3.0%) fall into the less than $10,000 income bracket, making it the least populous group.
| Income Bracket | # Households | % Households |
| Less than $10,000 | 26 | 3.0% |
| $10,000 to $14,999 | 55 | 6.4% |
| $15,000 to $24,999 | 56 | 6.5% |
| $25,000 to $34,999 | 79 | 9.2% |
| $35,000 to $49,999 | 127 | 14.8% |
| $50,000 to $74,999 | 122 | 14.2% |
| $75,000 to $99,999 | 153 | 17.8% |
| $100,000 to $149,999 | 150 | 17.5% |
| $150,000 to $199,999 | 26 | 3.0% |
| $200,000+ | 65 | 7.6% |
Household Income by Householder Age in Jerauld County
The median household income in Jerauld County is $66,607, with the highest median household income of $86,313 found in the 25 to 44 years age bracket for the primary householder. A total of 226 households (26.3%) fall into this category. Meanwhile, the 15 to 24 years age bracket for the primary householder has the lowest median household income of $33,611, with 24 households (2.8%) in this group.
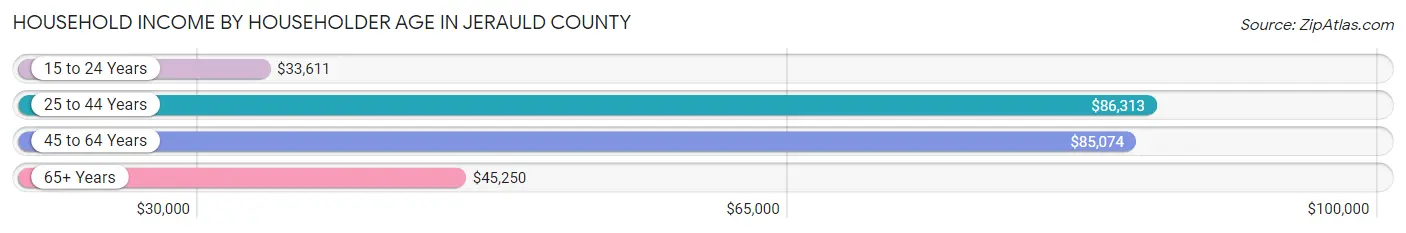
| Income Bracket | # Households | Median Income |
| 15 to 24 Years | 24 (2.8%) | $33,611 |
| 25 to 44 Years | 226 (26.3%) | $86,313 |
| 45 to 64 Years | 267 (31.1%) | $85,074 |
| 65+ Years | 342 (39.8%) | $45,250 |
| Total | 859 (100.0%) | $66,607 |
Poverty in Jerauld County
Income Below Poverty by Sex and Age in Jerauld County
With 5.7% poverty level for males and 12.6% for females among the residents of Jerauld County, 35 to 44 year old males and 75 year old and over females are the most vulnerable to poverty, with 19 males (17.6%) and 45 females (32.6%) in their respective age groups living below the poverty level.

| Age Bracket | Male | Female |
| Under 5 Years | 0 (0.0%) | 12 (30.8%) |
| 5 Years | 0 (0.0%) | 0 (0.0%) |
| 6 to 11 Years | 12 (14.1%) | 5 (6.9%) |
| 12 to 14 Years | 3 (6.4%) | 2 (7.1%) |
| 15 Years | 0 (0.0%) | 3 (30.0%) |
| 16 and 17 Years | 3 (15.8%) | 1 (3.8%) |
| 18 to 24 Years | 4 (12.1%) | 3 (12.5%) |
| 25 to 34 Years | 1 (1.5%) | 13 (13.7%) |
| 35 to 44 Years | 19 (17.6%) | 6 (4.8%) |
| 45 to 54 Years | 0 (0.0%) | 4 (6.2%) |
| 55 to 64 Years | 6 (5.0%) | 11 (8.9%) |
| 65 to 74 Years | 0 (0.0%) | 7 (4.9%) |
| 75 Years and over | 3 (3.8%) | 45 (32.6%) |
| Total | 51 (5.7%) | 112 (12.6%) |
Income Above Poverty by Sex and Age in Jerauld County
According to the poverty statistics in Jerauld County, males aged under 5 years and females aged 5 years are the age groups that are most secure financially, with 100.0% of males and 100.0% of females in these age groups living above the poverty line.
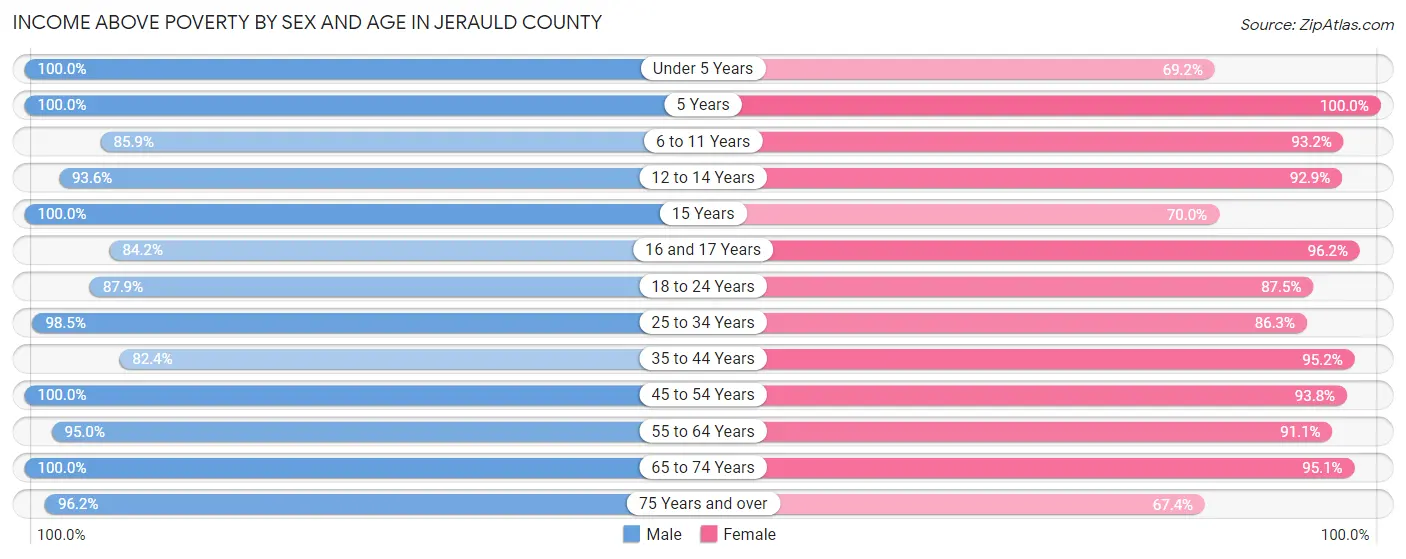
| Age Bracket | Male | Female |
| Under 5 Years | 46 (100.0%) | 27 (69.2%) |
| 5 Years | 1 (100.0%) | 2 (100.0%) |
| 6 to 11 Years | 73 (85.9%) | 68 (93.1%) |
| 12 to 14 Years | 44 (93.6%) | 26 (92.9%) |
| 15 Years | 7 (100.0%) | 7 (70.0%) |
| 16 and 17 Years | 16 (84.2%) | 25 (96.2%) |
| 18 to 24 Years | 29 (87.9%) | 21 (87.5%) |
| 25 to 34 Years | 67 (98.5%) | 82 (86.3%) |
| 35 to 44 Years | 89 (82.4%) | 118 (95.2%) |
| 45 to 54 Years | 124 (100.0%) | 60 (93.8%) |
| 55 to 64 Years | 114 (95.0%) | 112 (91.1%) |
| 65 to 74 Years | 163 (100.0%) | 137 (95.1%) |
| 75 Years and over | 76 (96.2%) | 93 (67.4%) |
| Total | 849 (94.3%) | 778 (87.4%) |
Income Below Poverty Among Married-Couple Families in Jerauld County
The poverty statistics for married-couple families in Jerauld County show that 2.2% or 11 of the total 496 families live below the poverty line. Families with 5 or more children have the highest poverty rate of 50.0%, comprising of 1 families. On the other hand, families with no children have the lowest poverty rate of 1.0%, which includes 3 families.

| Children | Above Poverty | Below Poverty |
| No Children | 302 (99.0%) | 3 (1.0%) |
| 1 or 2 Children | 101 (97.1%) | 3 (2.9%) |
| 3 or 4 Children | 81 (95.3%) | 4 (4.7%) |
| 5 or more Children | 1 (50.0%) | 1 (50.0%) |
| Total | 485 (97.8%) | 11 (2.2%) |
Income Below Poverty Among Single-Parent Households in Jerauld County
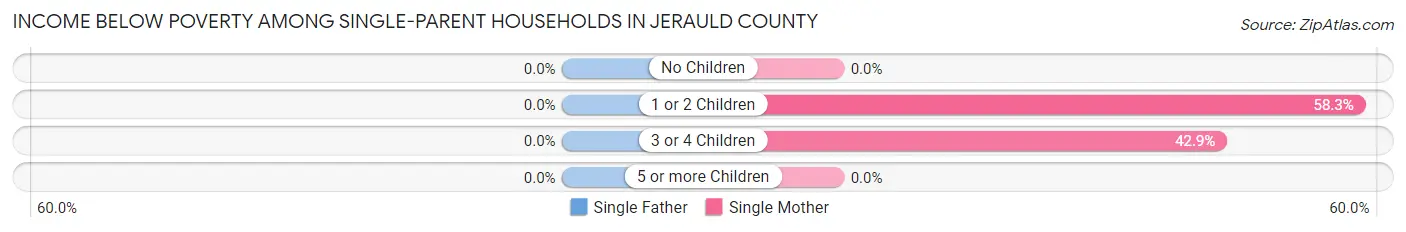
| Children | Single Father | Single Mother |
| No Children | 0 (0.0%) | 0 (0.0%) |
| 1 or 2 Children | 0 (0.0%) | 7 (58.3%) |
| 3 or 4 Children | 0 (0.0%) | 6 (42.9%) |
| 5 or more Children | 0 (0.0%) | 0 (0.0%) |
| Total | 0 (0.0%) | 13 (48.1%) |
Income Below Poverty Among Married-Couple vs Single-Parent Households in Jerauld County
The poverty data for Jerauld County shows that 11 of the married-couple family households (2.2%) and 13 of the single-parent households (30.2%) are living below the poverty level. Within the married-couple family households, those with 5 or more children have the highest poverty rate, with 1 households (50.0%) falling below the poverty line. Among the single-parent households, those with 3 or 4 children have the highest poverty rate, with 6 household (35.3%) living below poverty.

| Children | Married-Couple Families | Single-Parent Households |
| No Children | 3 (1.0%) | 0 (0.0%) |
| 1 or 2 Children | 3 (2.9%) | 7 (33.3%) |
| 3 or 4 Children | 4 (4.7%) | 6 (35.3%) |
| 5 or more Children | 1 (50.0%) | 0 (0.0%) |
| Total | 11 (2.2%) | 13 (30.2%) |
Employment Characteristics in Jerauld County
Employment by Class of Employer in Jerauld County
Among the 961 employed individuals in Jerauld County, private company employees (597 | 62.1%), self-employed (not incorporated) (124 | 12.9%), and local government employees (115 | 12.0%) make up the most common classes of employment.

| Employer Class | # Employees | % Employees |
| Private Company Employees | 597 | 62.1% |
| Self-Employed (Incorporated) | 12 | 1.3% |
| Self-Employed (Not Incorporated) | 124 | 12.9% |
| Not-for-profit Organizations | 87 | 9.0% |
| Local Government Employees | 115 | 12.0% |
| State Government Employees | 11 | 1.1% |
| Federal Government Employees | 15 | 1.6% |
| Unpaid Family Workers | 0 | 0.0% |
| Total | 961 | 100.0% |
Employment Status by Age in Jerauld County
According to the labor force statistics for Jerauld County, out of the total population over 16 years of age (1,498), 65.1% or 975 individuals are in the labor force, with 0.7% or 7 of them unemployed. The age group with the highest labor force participation rate is 20 to 24 years, with 100.0% or 22 individuals in the labor force. Within the labor force, the 25 to 29 years age range has the highest percentage of unemployed individuals, with 9.6% or 7 of them being unemployed.

| Age Bracket | In Labor Force | Unemployed |
| 16 to 19 Years | 48 (60.0%) | 0 (0.0%) |
| 20 to 24 Years | 22 (100.0%) | 0 (0.0%) |
| 25 to 29 Years | 73 (88.0%) | 7 (9.6%) |
| 30 to 34 Years | 79 (98.8%) | 0 (0.0%) |
| 35 to 44 Years | 183 (78.9%) | 0 (0.0%) |
| 45 to 54 Years | 158 (84.0%) | 0 (0.0%) |
| 55 to 59 Years | 123 (88.5%) | 0 (0.0%) |
| 60 to 64 Years | 83 (78.3%) | 0 (0.0%) |
| 65 to 74 Years | 154 (49.8%) | 0 (0.0%) |
| 75 Years and over | 52 (20.1%) | 0 (0.0%) |
| Total | 975 (65.1%) | 7 (0.7%) |
Employment Status by Educational Attainment in Jerauld County
According to labor force statistics for Jerauld County, 84.4% of individuals (699) out of the total population between 25 and 64 years of age (828) are in the labor force, with 1.0% or 7 of them being unemployed. The group with the highest labor force participation rate are those with the educational attainment of bachelor's degree or higher, with 98.8% or 165 individuals in the labor force. Within the labor force, individuals with college / associate degree education have the highest percentage of unemployment, with 3.0% or 7 of them being unemployed.

| Educational Attainment | In Labor Force | Unemployed |
| Less than High School | 29 (76.3%) | 0 (0.0%) |
| High School Diploma | 273 (79.6%) | 0 (0.0%) |
| College / Associate Degree | 232 (82.9%) | 8 (3.0%) |
| Bachelor's Degree or higher | 165 (98.8%) | 0 (0.0%) |
| Total | 699 (84.4%) | 8 (1.0%) |
Employment Occupations by Sex in Jerauld County
Management, Business, Science and Arts Occupations
The most common Management, Business, Science and Arts occupations in Jerauld County are Management (186 | 19.2%), Health Diagnosing & Treating (69 | 7.1%), Business & Financial (66 | 6.8%), Community & Social Service (59 | 6.1%), and Education Instruction & Library (59 | 6.1%).

Management, Business, Science and Arts Occupations by Sex
Within the Management, Business, Science and Arts occupations in Jerauld County, the most male-oriented occupations are Computers & Mathematics (100.0%), Management (91.9%), and Computers, Engineering & Science (61.5%), while the most female-oriented occupations are Life, Physical & Social Science (100.0%), Health Diagnosing & Treating (100.0%), and Health Technologists (100.0%).

| Occupation | Male | Female |
| Management | 171 (91.9%) | 15 (8.1%) |
| Business & Financial | 17 (25.8%) | 49 (74.2%) |
| Computers, Engineering & Science | 16 (61.5%) | 10 (38.5%) |
| Computers & Mathematics | 16 (100.0%) | 0 (0.0%) |
| Architecture & Engineering | 0 (0.0%) | 0 (0.0%) |
| Life, Physical & Social Science | 0 (0.0%) | 10 (100.0%) |
| Community & Social Service | 14 (23.7%) | 45 (76.3%) |
| Education, Arts & Media | 0 (0.0%) | 0 (0.0%) |
| Legal Services & Support | 0 (0.0%) | 0 (0.0%) |
| Education Instruction & Library | 14 (23.7%) | 45 (76.3%) |
| Arts, Media & Entertainment | 0 (0.0%) | 0 (0.0%) |
| Health Diagnosing & Treating | 0 (0.0%) | 69 (100.0%) |
| Health Technologists | 0 (0.0%) | 43 (100.0%) |
| Total (Category) | 218 (53.7%) | 188 (46.3%) |
| Total (Overall) | 489 (50.5%) | 479 (49.5%) |
Services Occupations
The most common Services occupations in Jerauld County are Food Preparation & Serving (30 | 3.1%), Healthcare Support (28 | 2.9%), Security & Protection (23 | 2.4%), Law Enforcement (23 | 2.4%), and Personal Care & Service (22 | 2.3%).

Services Occupations by Sex
Within the Services occupations in Jerauld County, the most male-oriented occupations are Security & Protection (100.0%), Law Enforcement (100.0%), and Cleaning & Maintenance (41.7%), while the most female-oriented occupations are Healthcare Support (100.0%), Food Preparation & Serving (100.0%), and Personal Care & Service (59.1%).

| Occupation | Male | Female |
| Healthcare Support | 0 (0.0%) | 28 (100.0%) |
| Security & Protection | 23 (100.0%) | 0 (0.0%) |
| Firefighting & Prevention | 0 (0.0%) | 0 (0.0%) |
| Law Enforcement | 23 (100.0%) | 0 (0.0%) |
| Food Preparation & Serving | 0 (0.0%) | 30 (100.0%) |
| Cleaning & Maintenance | 5 (41.7%) | 7 (58.3%) |
| Personal Care & Service | 9 (40.9%) | 13 (59.1%) |
| Total (Category) | 37 (32.2%) | 78 (67.8%) |
| Total (Overall) | 489 (50.5%) | 479 (49.5%) |
Sales and Office Occupations
The most common Sales and Office occupations in Jerauld County are Office & Administration (103 | 10.6%), and Sales & Related (76 | 7.9%).
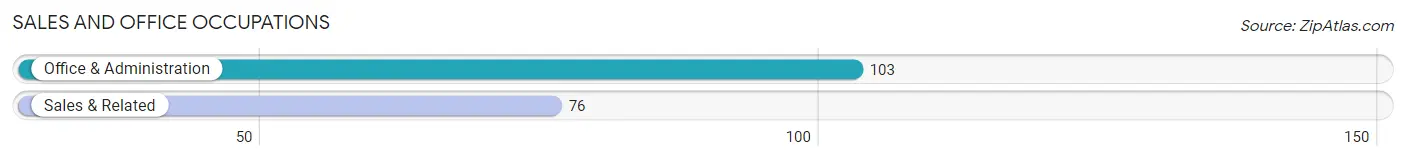
Sales and Office Occupations by Sex

| Occupation | Male | Female |
| Sales & Related | 9 (11.8%) | 67 (88.2%) |
| Office & Administration | 23 (22.3%) | 80 (77.7%) |
| Total (Category) | 32 (17.9%) | 147 (82.1%) |
| Total (Overall) | 489 (50.5%) | 479 (49.5%) |
Natural Resources, Construction and Maintenance Occupations
The most common Natural Resources, Construction and Maintenance occupations in Jerauld County are Installation, Maintenance & Repair (40 | 4.1%), Farming, Fishing & Forestry (26 | 2.7%), and Construction & Extraction (18 | 1.9%).

Natural Resources, Construction and Maintenance Occupations by Sex
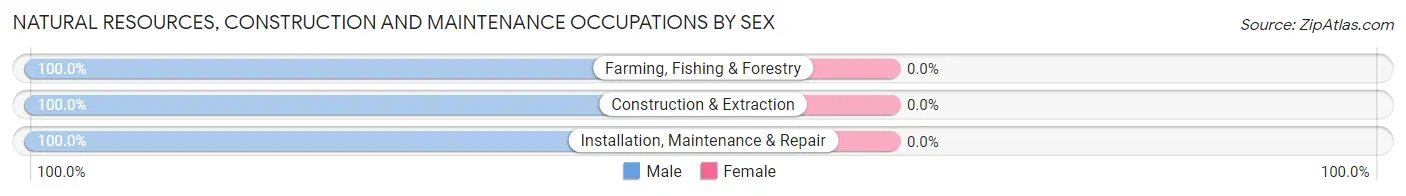
| Occupation | Male | Female |
| Farming, Fishing & Forestry | 26 (100.0%) | 0 (0.0%) |
| Construction & Extraction | 18 (100.0%) | 0 (0.0%) |
| Installation, Maintenance & Repair | 40 (100.0%) | 0 (0.0%) |
| Total (Category) | 84 (100.0%) | 0 (0.0%) |
| Total (Overall) | 489 (50.5%) | 479 (49.5%) |
Production, Transportation and Moving Occupations
The most common Production, Transportation and Moving occupations in Jerauld County are Transportation (96 | 9.9%), Production (76 | 7.9%), and Material Moving (12 | 1.2%).

Production, Transportation and Moving Occupations by Sex
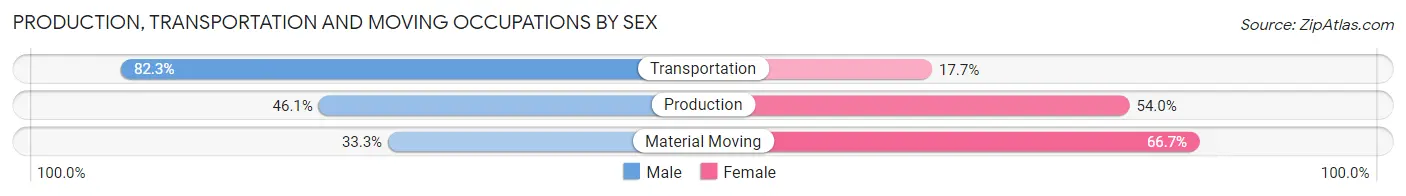
| Occupation | Male | Female |
| Production | 35 (46.1%) | 41 (53.9%) |
| Transportation | 79 (82.3%) | 17 (17.7%) |
| Material Moving | 4 (33.3%) | 8 (66.7%) |
| Total (Category) | 118 (64.1%) | 66 (35.9%) |
| Total (Overall) | 489 (50.5%) | 479 (49.5%) |
Employment Industries by Sex in Jerauld County
Employment Industries in Jerauld County
The major employment industries in Jerauld County include Agriculture, Fishing & Hunting (174 | 18.0%), Health Care & Social Assistance (142 | 14.7%), Retail Trade (124 | 12.8%), Manufacturing (85 | 8.8%), and Educational Services (78 | 8.1%).

Employment Industries by Sex in Jerauld County
The Jerauld County industries that see more men than women are Utilities (100.0%), Arts, Entertainment & Recreation (100.0%), and Agriculture, Fishing & Hunting (96.0%), whereas the industries that tend to have a higher number of women are Health Care & Social Assistance (100.0%), Accommodation & Food Services (100.0%), and Finance & Insurance (88.9%).

| Industry | Male | Female |
| Agriculture, Fishing & Hunting | 167 (96.0%) | 7 (4.0%) |
| Mining, Quarrying, & Extraction | 0 (0.0%) | 0 (0.0%) |
| Construction | 18 (85.7%) | 3 (14.3%) |
| Manufacturing | 58 (68.2%) | 27 (31.8%) |
| Wholesale Trade | 36 (81.8%) | 8 (18.2%) |
| Retail Trade | 46 (37.1%) | 78 (62.9%) |
| Transportation & Warehousing | 24 (63.2%) | 14 (36.8%) |
| Utilities | 29 (100.0%) | 0 (0.0%) |
| Information | 14 (58.3%) | 10 (41.7%) |
| Finance & Insurance | 3 (11.1%) | 24 (88.9%) |
| Real Estate, Rental & Leasing | 0 (0.0%) | 0 (0.0%) |
| Professional & Scientific | 9 (26.5%) | 25 (73.5%) |
| Enterprise Management | 0 (0.0%) | 0 (0.0%) |
| Administrative & Support | 19 (90.5%) | 2 (9.5%) |
| Educational Services | 23 (29.5%) | 55 (70.5%) |
| Health Care & Social Assistance | 0 (0.0%) | 142 (100.0%) |
| Arts, Entertainment & Recreation | 8 (100.0%) | 0 (0.0%) |
| Accommodation & Food Services | 0 (0.0%) | 27 (100.0%) |
| Public Administration | 29 (70.7%) | 12 (29.3%) |
| Total | 489 (50.5%) | 479 (49.5%) |
Education in Jerauld County
School Enrollment in Jerauld County
The most common levels of schooling among the 366 students in Jerauld County are middle school (110 | 30.0%), high school (89 | 24.3%), and elementary school (87 | 23.8%).
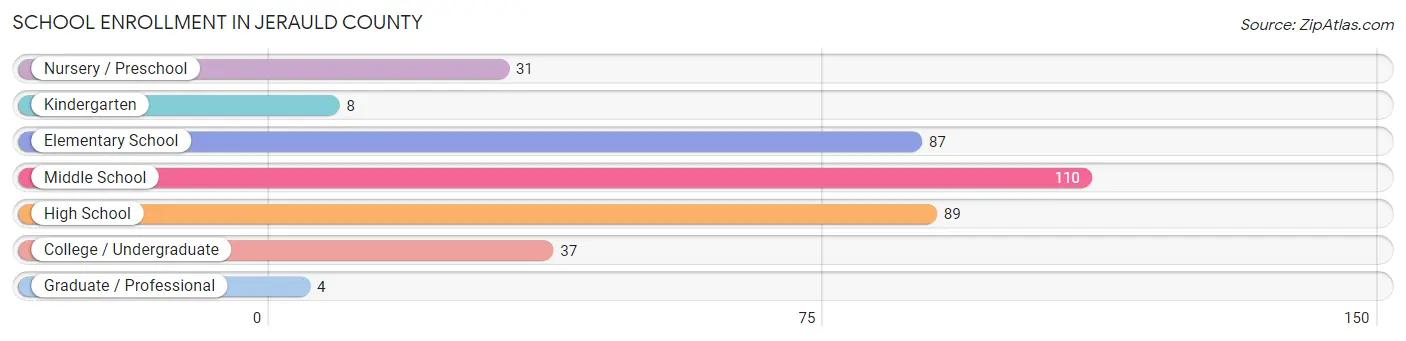
| School Level | # Students | % Students |
| Nursery / Preschool | 31 | 8.5% |
| Kindergarten | 8 | 2.2% |
| Elementary School | 87 | 23.8% |
| Middle School | 110 | 30.0% |
| High School | 89 | 24.3% |
| College / Undergraduate | 37 | 10.1% |
| Graduate / Professional | 4 | 1.1% |
| Total | 366 | 100.0% |
School Enrollment by Age by Funding Source in Jerauld County
Out of a total of 366 students who are enrolled in schools in Jerauld County, 11 (3.0%) attend a private institution, while the remaining 355 (97.0%) are enrolled in public schools. The age group of 35 years and over has the highest likelihood of being enrolled in private schools, with 7 (87.5% in the age bracket) enrolled. Conversely, the age group of 3 to 4 year olds has the lowest likelihood of being enrolled in a private school, with 23 (100.0% in the age bracket) attending a public institution.

| Age Bracket | Public School | Private School |
| 3 to 4 Year Olds | 23 (100.0%) | 0 (0.0%) |
| 5 to 9 Year Old | 83 (100.0%) | 0 (0.0%) |
| 10 to 14 Year Olds | 149 (98.7%) | 2 (1.3%) |
| 15 to 17 Year Olds | 58 (100.0%) | 0 (0.0%) |
| 18 to 19 Year Olds | 28 (93.3%) | 2 (6.7%) |
| 20 to 24 Year Olds | 6 (100.0%) | 0 (0.0%) |
| 25 to 34 Year Olds | 7 (100.0%) | 0 (0.0%) |
| 35 Years and over | 1 (12.5%) | 7 (87.5%) |
| Total | 355 (97.0%) | 11 (3.0%) |
Educational Attainment by Field of Study in Jerauld County
Education (83 | 33.5%), science & technology (54 | 21.8%), bio, nature & agricultural (26 | 10.5%), computers & mathematics (19 | 7.7%), and engineering (14 | 5.7%) are the most common fields of study among 248 individuals in Jerauld County who have obtained a bachelor's degree or higher.

| Field of Study | # Graduates | % Graduates |
| Computers & Mathematics | 19 | 7.7% |
| Bio, Nature & Agricultural | 26 | 10.5% |
| Physical & Health Sciences | 0 | 0.0% |
| Psychology | 0 | 0.0% |
| Social Sciences | 10 | 4.0% |
| Engineering | 14 | 5.7% |
| Multidisciplinary Studies | 0 | 0.0% |
| Science & Technology | 54 | 21.8% |
| Business | 12 | 4.8% |
| Education | 83 | 33.5% |
| Literature & Languages | 9 | 3.6% |
| Liberal Arts & History | 5 | 2.0% |
| Visual & Performing Arts | 0 | 0.0% |
| Communications | 3 | 1.2% |
| Arts & Humanities | 13 | 5.2% |
| Total | 248 | 100.0% |
Transportation & Commute in Jerauld County
Vehicle Availability by Sex in Jerauld County
The most prevalent vehicle ownership categories in Jerauld County are males with 2 vehicles (186, accounting for 38.0%) and females with 2 vehicles (164, making up 39.4%).

| Vehicles Available | Male | Female |
| No Vehicle | 10 (2.0%) | 18 (3.8%) |
| 1 Vehicle | 35 (7.2%) | 54 (11.4%) |
| 2 Vehicles | 186 (38.0%) | 164 (34.7%) |
| 3 Vehicles | 163 (33.3%) | 138 (29.2%) |
| 4 Vehicles | 76 (15.5%) | 63 (13.4%) |
| 5 or more Vehicles | 19 (3.9%) | 35 (7.4%) |
| Total | 489 (100.0%) | 472 (100.0%) |
Commute Time in Jerauld County
The most frequently occuring commute durations in Jerauld County are 5 to 9 minutes (221 commuters, 28.4%), 15 to 19 minutes (153 commuters, 19.6%), and less than 5 minutes (128 commuters, 16.4%).

| Commute Time | # Commuters | % Commuters |
| Less than 5 Minutes | 128 | 16.4% |
| 5 to 9 Minutes | 221 | 28.4% |
| 10 to 14 Minutes | 57 | 7.3% |
| 15 to 19 Minutes | 153 | 19.6% |
| 20 to 24 Minutes | 92 | 11.8% |
| 25 to 29 Minutes | 14 | 1.8% |
| 30 to 34 Minutes | 24 | 3.1% |
| 35 to 39 Minutes | 4 | 0.5% |
| 40 to 44 Minutes | 10 | 1.3% |
| 45 to 59 Minutes | 43 | 5.5% |
| 60 to 89 Minutes | 18 | 2.3% |
| 90 or more Minutes | 15 | 1.9% |
Commute Time by Sex in Jerauld County
The most common commute times in Jerauld County are 5 to 9 minutes (129 commuters, 33.5%) for males and 15 to 19 minutes (95 commuters, 24.1%) for females.
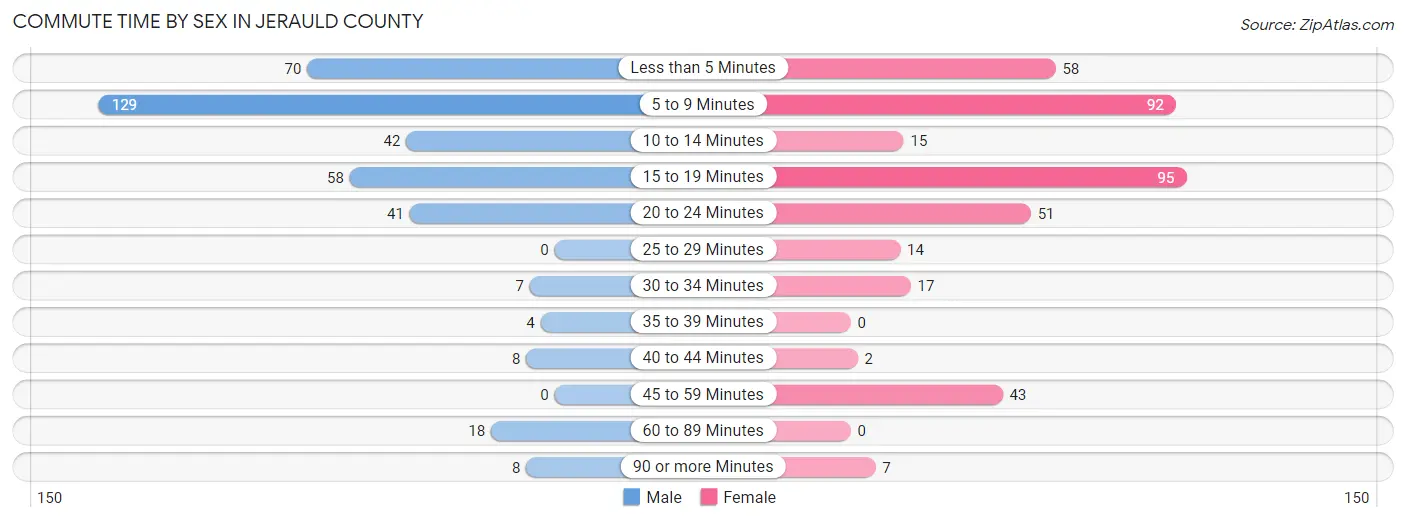
| Commute Time | Male | Female |
| Less than 5 Minutes | 70 (18.2%) | 58 (14.7%) |
| 5 to 9 Minutes | 129 (33.5%) | 92 (23.4%) |
| 10 to 14 Minutes | 42 (10.9%) | 15 (3.8%) |
| 15 to 19 Minutes | 58 (15.1%) | 95 (24.1%) |
| 20 to 24 Minutes | 41 (10.6%) | 51 (12.9%) |
| 25 to 29 Minutes | 0 (0.0%) | 14 (3.5%) |
| 30 to 34 Minutes | 7 (1.8%) | 17 (4.3%) |
| 35 to 39 Minutes | 4 (1.0%) | 0 (0.0%) |
| 40 to 44 Minutes | 8 (2.1%) | 2 (0.5%) |
| 45 to 59 Minutes | 0 (0.0%) | 43 (10.9%) |
| 60 to 89 Minutes | 18 (4.7%) | 0 (0.0%) |
| 90 or more Minutes | 8 (2.1%) | 7 (1.8%) |
Time of Departure to Work by Sex in Jerauld County
The most frequent times of departure to work in Jerauld County are 7:30 AM to 7:59 AM (120, 31.2%) for males and 7:30 AM to 7:59 AM (89, 22.6%) for females.

| Time of Departure | Male | Female |
| 12:00 AM to 4:59 AM | 12 (3.1%) | 4 (1.0%) |
| 5:00 AM to 5:29 AM | 7 (1.8%) | 4 (1.0%) |
| 5:30 AM to 5:59 AM | 1 (0.3%) | 9 (2.3%) |
| 6:00 AM to 6:29 AM | 23 (6.0%) | 34 (8.6%) |
| 6:30 AM to 6:59 AM | 35 (9.1%) | 36 (9.1%) |
| 7:00 AM to 7:29 AM | 61 (15.8%) | 83 (21.1%) |
| 7:30 AM to 7:59 AM | 120 (31.2%) | 89 (22.6%) |
| 8:00 AM to 8:29 AM | 58 (15.1%) | 66 (16.8%) |
| 8:30 AM to 8:59 AM | 1 (0.3%) | 18 (4.6%) |
| 9:00 AM to 9:59 AM | 0 (0.0%) | 12 (3.0%) |
| 10:00 AM to 10:59 AM | 17 (4.4%) | 6 (1.5%) |
| 11:00 AM to 11:59 AM | 1 (0.3%) | 0 (0.0%) |
| 12:00 PM to 3:59 PM | 0 (0.0%) | 21 (5.3%) |
| 4:00 PM to 11:59 PM | 49 (12.7%) | 12 (3.0%) |
| Total | 385 (100.0%) | 394 (100.0%) |
Housing Occupancy in Jerauld County
Occupancy by Ownership in Jerauld County
Of the total 859 dwellings in Jerauld County, owner-occupied units account for 734 (85.5%), while renter-occupied units make up 125 (14.5%).

| Occupancy | # Housing Units | % Housing Units |
| Owner Occupied Housing Units | 734 | 85.5% |
| Renter-Occupied Housing Units | 125 | 14.5% |
| Total Occupied Housing Units | 859 | 100.0% |
Occupancy by Household Size in Jerauld County

| Household Size | # Housing Units | % Housing Units |
| 1-Person Household | 289 | 33.6% |
| 2-Person Household | 345 | 40.2% |
| 3-Person Household | 59 | 6.9% |
| 4+ Person Household | 166 | 19.3% |
| Total Housing Units | 859 | 100.0% |
Occupancy by Ownership by Household Size in Jerauld County

| Household Size | Owner-occupied | Renter-occupied |
| 1-Person Household | 203 (70.2%) | 86 (29.8%) |
| 2-Person Household | 325 (94.2%) | 20 (5.8%) |
| 3-Person Household | 55 (93.2%) | 4 (6.8%) |
| 4+ Person Household | 151 (91.0%) | 15 (9.0%) |
| Total Housing Units | 734 (85.5%) | 125 (14.5%) |
Occupancy by Educational Attainment in Jerauld County

| Household Size | Owner-occupied | Renter-occupied |
| Less than High School | 61 (87.1%) | 9 (12.9%) |
| High School Diploma | 321 (87.9%) | 44 (12.0%) |
| College/Associate Degree | 229 (86.7%) | 35 (13.3%) |
| Bachelor's Degree or higher | 123 (76.9%) | 37 (23.1%) |
Occupancy by Age of Householder in Jerauld County

| Age Bracket | # Households | % Households |
| Under 35 Years | 132 | 15.4% |
| 35 to 44 Years | 118 | 13.7% |
| 45 to 54 Years | 104 | 12.1% |
| 55 to 64 Years | 163 | 19.0% |
| 65 to 74 Years | 183 | 21.3% |
| 75 to 84 Years | 119 | 13.9% |
| 85 Years and Over | 40 | 4.7% |
| Total | 859 | 100.0% |
Housing Finances in Jerauld County
Median Income by Occupancy in Jerauld County

| Occupancy Type | # Households | Median Income |
| Owner-Occupied | 734 (85.5%) | $82,917 |
| Renter-Occupied | 125 (14.5%) | $34,583 |
| Average | 859 (100.0%) | $66,607 |
Occupancy by Householder Income Bracket in Jerauld County

| Income Bracket | Owner-occupied | Renter-occupied |
| Less than $5,000 | 12 (1.6%) | 0 (0.0%) |
| $5,000 to $9,999 | 3 (0.4%) | 11 (8.8%) |
| $10,000 to $14,999 | 34 (4.6%) | 21 (16.8%) |
| $15,000 to $19,999 | 21 (2.9%) | 9 (7.2%) |
| $20,000 to $24,999 | 23 (3.1%) | 3 (2.4%) |
| $25,000 to $34,999 | 57 (7.8%) | 22 (17.6%) |
| $35,000 to $49,999 | 100 (13.6%) | 27 (21.6%) |
| $50,000 to $74,999 | 98 (13.4%) | 24 (19.2%) |
| $75,000 to $99,999 | 153 (20.8%) | 0 (0.0%) |
| $100,000 to $149,999 | 142 (19.4%) | 8 (6.4%) |
| $150,000 or more | 91 (12.4%) | 0 (0.0%) |
| Total | 734 (100.0%) | 125 (100.0%) |
Monthly Housing Cost Tiers in Jerauld County

| Monthly Cost | Owner-occupied | Renter-occupied |
| Less than $300 | 48 (6.5%) | 18 (14.4%) |
| $300 to $499 | 172 (23.4%) | 13 (10.4%) |
| $500 to $799 | 203 (27.7%) | 27 (21.6%) |
| $800 to $999 | 77 (10.5%) | 0 (0.0%) |
| $1,000 to $1,499 | 111 (15.1%) | 7 (5.6%) |
| $1,500 to $1,999 | 59 (8.0%) | 0 (0.0%) |
| $2,000 to $2,499 | 28 (3.8%) | 0 (0.0%) |
| $2,500 to $2,999 | 18 (2.5%) | 0 (0.0%) |
| $3,000 or more | 18 (2.5%) | 0 (0.0%) |
| Total | 734 (100.0%) | 125 (100.0%) |
Physical Housing Characteristics in Jerauld County
Housing Structures in Jerauld County

| Structure Type | # Housing Units | % Housing Units |
| Single Unit, Detached | 739 | 86.0% |
| Single Unit, Attached | 0 | 0.0% |
| 2 Unit Apartments | 0 | 0.0% |
| 3 or 4 Unit Apartments | 3 | 0.4% |
| 5 to 9 Unit Apartments | 16 | 1.9% |
| 10 or more Apartments | 29 | 3.4% |
| Mobile Home / Other | 72 | 8.4% |
| Total | 859 | 100.0% |
Housing Structures by Occupancy in Jerauld County

| Structure Type | Owner-occupied | Renter-occupied |
| Single Unit, Detached | 663 (89.7%) | 76 (10.3%) |
| Single Unit, Attached | 0 (0.0%) | 0 (0.0%) |
| 2 Unit Apartments | 0 (0.0%) | 0 (0.0%) |
| 3 or 4 Unit Apartments | 0 (0.0%) | 3 (100.0%) |
| 5 to 9 Unit Apartments | 0 (0.0%) | 16 (100.0%) |
| 10 or more Apartments | 0 (0.0%) | 29 (100.0%) |
| Mobile Home / Other | 71 (98.6%) | 1 (1.4%) |
| Total | 734 (85.5%) | 125 (14.5%) |
Housing Structures by Number of Rooms in Jerauld County

| Number of Rooms | Owner-occupied | Renter-occupied |
| 1 Room | 0 (0.0%) | 0 (0.0%) |
| 2 or 3 Rooms | 18 (2.5%) | 42 (33.6%) |
| 4 or 5 Rooms | 296 (40.3%) | 31 (24.8%) |
| 6 or 7 Rooms | 181 (24.7%) | 22 (17.6%) |
| 8 or more Rooms | 239 (32.6%) | 30 (24.0%) |
| Total | 734 (100.0%) | 125 (100.0%) |
Housing Structure by Heating Type in Jerauld County

| Heating Type | Owner-occupied | Renter-occupied |
| Utility Gas | 17 (2.3%) | 0 (0.0%) |
| Bottled, Tank, or LP Gas | 492 (67.0%) | 60 (48.0%) |
| Electricity | 191 (26.0%) | 57 (45.6%) |
| Fuel Oil or Kerosene | 8 (1.1%) | 6 (4.8%) |
| Coal or Coke | 0 (0.0%) | 0 (0.0%) |
| All other Fuels | 26 (3.5%) | 2 (1.6%) |
| No Fuel Used | 0 (0.0%) | 0 (0.0%) |
| Total | 734 (100.0%) | 125 (100.0%) |
Household Vehicle Usage in Jerauld County
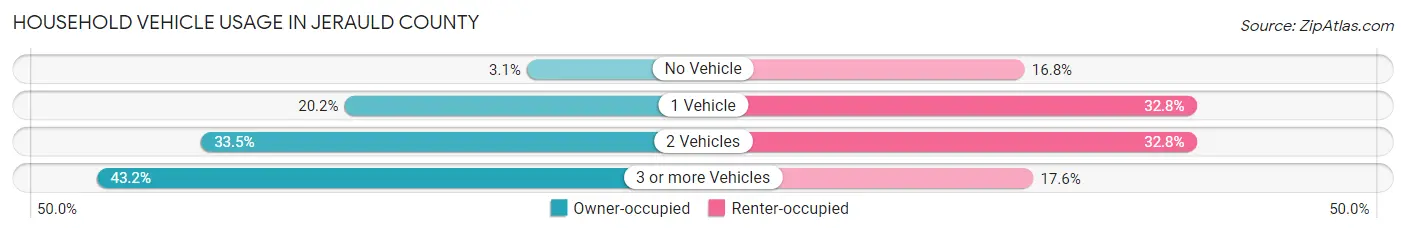
| Vehicles per Household | Owner-occupied | Renter-occupied |
| No Vehicle | 23 (3.1%) | 21 (16.8%) |
| 1 Vehicle | 148 (20.2%) | 41 (32.8%) |
| 2 Vehicles | 246 (33.5%) | 41 (32.8%) |
| 3 or more Vehicles | 317 (43.2%) | 22 (17.6%) |
| Total | 734 (100.0%) | 125 (100.0%) |
Real Estate & Mortgages in Jerauld County
Real Estate and Mortgage Overview in Jerauld County
| Characteristic | Without Mortgage | With Mortgage |
| Housing Units | 419 | 315 |
| Median Property Value | $82,800 | $167,400 |
| Median Household Income | $64,792 | $60 |
| Monthly Housing Costs | $496 | $18 |
| Real Estate Taxes | $861 | $0 |
Property Value by Mortgage Status in Jerauld County
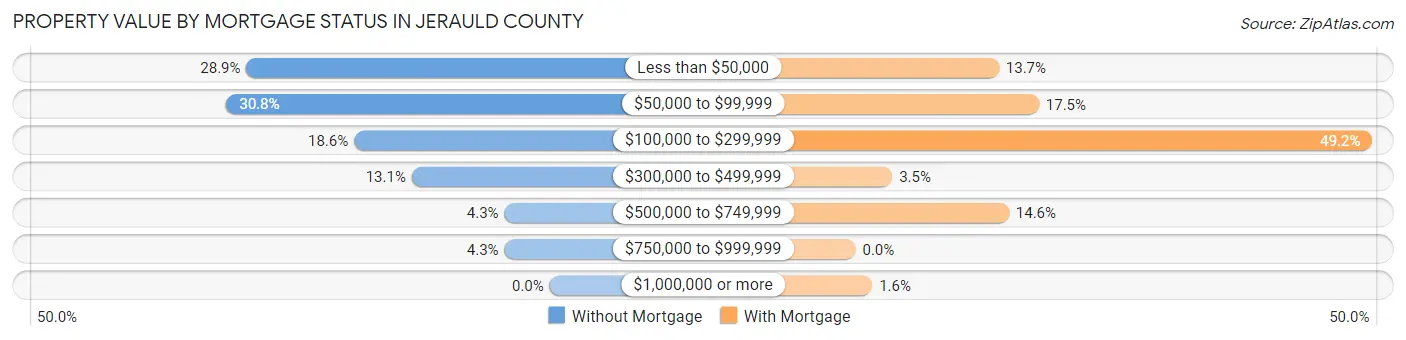
| Property Value | Without Mortgage | With Mortgage |
| Less than $50,000 | 121 (28.9%) | 43 (13.7%) |
| $50,000 to $99,999 | 129 (30.8%) | 55 (17.5%) |
| $100,000 to $299,999 | 78 (18.6%) | 155 (49.2%) |
| $300,000 to $499,999 | 55 (13.1%) | 11 (3.5%) |
| $500,000 to $749,999 | 18 (4.3%) | 46 (14.6%) |
| $750,000 to $999,999 | 18 (4.3%) | 0 (0.0%) |
| $1,000,000 or more | 0 (0.0%) | 5 (1.6%) |
| Total | 419 (100.0%) | 315 (100.0%) |
Household Income by Mortgage Status in Jerauld County

| Household Income | Without Mortgage | With Mortgage |
| Less than $10,000 | 12 (2.9%) | 0 (0.0%) |
| $10,000 to $24,999 | 57 (13.6%) | 3 (0.9%) |
| $25,000 to $34,999 | 49 (11.7%) | 21 (6.7%) |
| $35,000 to $49,999 | 53 (12.7%) | 8 (2.5%) |
| $50,000 to $74,999 | 69 (16.5%) | 47 (14.9%) |
| $75,000 to $99,999 | 81 (19.3%) | 29 (9.2%) |
| $100,000 to $149,999 | 67 (16.0%) | 72 (22.9%) |
| $150,000 or more | 31 (7.4%) | 75 (23.8%) |
| Total | 419 (100.0%) | 315 (100.0%) |
Property Value to Household Income Ratio in Jerauld County

| Value-to-Income Ratio | Without Mortgage | With Mortgage |
| Less than 2.0x | 221 (52.7%) | 89,563 (28,432.7%) |
| 2.0x to 2.9x | 59 (14.1%) | 216 (68.6%) |
| 3.0x to 3.9x | 51 (12.2%) | 32 (10.2%) |
| 4.0x or more | 86 (20.5%) | 30 (9.5%) |
| Total | 419 (100.0%) | 315 (100.0%) |
Real Estate Taxes by Mortgage Status in Jerauld County

| Property Taxes | Without Mortgage | With Mortgage |
| Less than $800 | 197 (47.0%) | 0 (0.0%) |
| $800 to $1,499 | 77 (18.4%) | 91 (28.9%) |
| $800 to $1,499 | 137 (32.7%) | 95 (30.2%) |
| Total | 419 (100.0%) | 315 (100.0%) |
Health & Disability in Jerauld County
Health Insurance Coverage by Age in Jerauld County
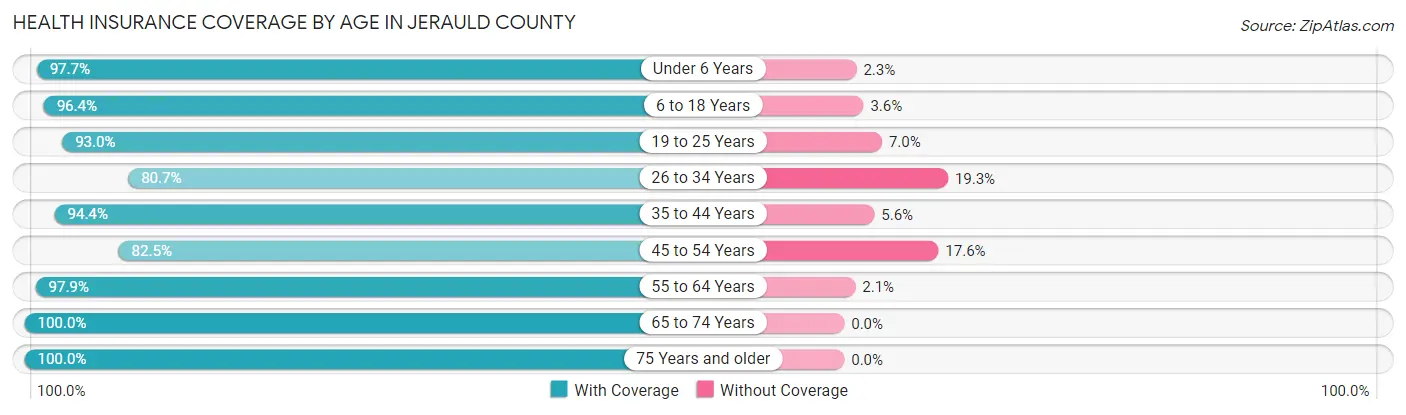
| Age Bracket | With Coverage | Without Coverage |
| Under 6 Years | 86 (97.7%) | 2 (2.3%) |
| 6 to 18 Years | 297 (96.4%) | 11 (3.6%) |
| 19 to 25 Years | 53 (93.0%) | 4 (7.0%) |
| 26 to 34 Years | 121 (80.7%) | 29 (19.3%) |
| 35 to 44 Years | 219 (94.4%) | 13 (5.6%) |
| 45 to 54 Years | 155 (82.5%) | 33 (17.5%) |
| 55 to 64 Years | 238 (97.9%) | 5 (2.1%) |
| 65 to 74 Years | 307 (100.0%) | 0 (0.0%) |
| 75 Years and older | 217 (100.0%) | 0 (0.0%) |
| Total | 1,693 (94.6%) | 97 (5.4%) |
Health Insurance Coverage by Citizenship Status in Jerauld County

| Citizenship Status | With Coverage | Without Coverage |
| Native Born | 86 (97.7%) | 2 (2.3%) |
| Foreign Born, Citizen | 297 (96.4%) | 11 (3.6%) |
| Foreign Born, not a Citizen | 53 (93.0%) | 4 (7.0%) |
Health Insurance Coverage by Household Income in Jerauld County
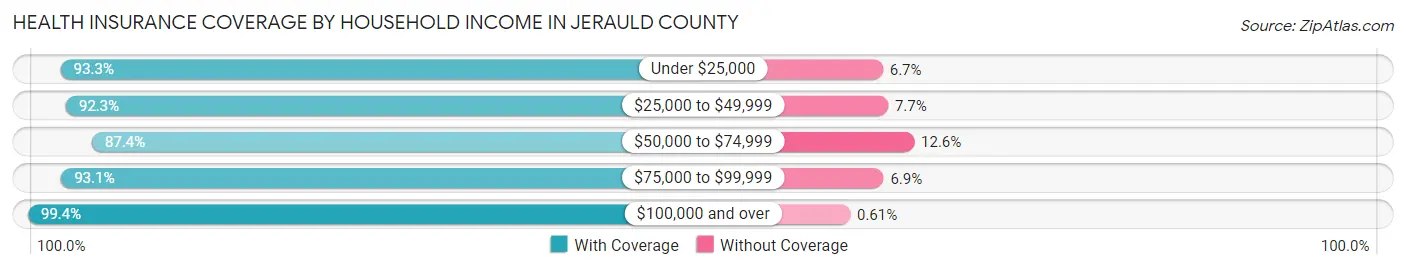
| Household Income | With Coverage | Without Coverage |
| Under $25,000 | 166 (93.3%) | 12 (6.7%) |
| $25,000 to $49,999 | 311 (92.3%) | 26 (7.7%) |
| $50,000 to $74,999 | 194 (87.4%) | 28 (12.6%) |
| $75,000 to $99,999 | 366 (93.1%) | 27 (6.9%) |
| $100,000 and over | 656 (99.4%) | 4 (0.6%) |
Public vs Private Health Insurance Coverage by Age in Jerauld County

| Age Bracket | Public Insurance | Private Insurance |
| Under 6 | 14 (15.9%) | 72 (81.8%) |
| 6 to 18 Years | 110 (35.7%) | 199 (64.6%) |
| 19 to 25 Years | 0 (0.0%) | 53 (93.0%) |
| 25 to 34 Years | 14 (9.3%) | 107 (71.3%) |
| 35 to 44 Years | 27 (11.6%) | 194 (83.6%) |
| 45 to 54 Years | 17 (9.0%) | 138 (73.4%) |
| 55 to 64 Years | 45 (18.5%) | 215 (88.5%) |
| 65 to 74 Years | 299 (97.4%) | 106 (34.5%) |
| 75 Years and over | 217 (100.0%) | 83 (38.3%) |
| Total | 743 (41.5%) | 1,167 (65.2%) |
Disability Status by Sex by Age in Jerauld County

| Age Bracket | Male | Female |
| Under 5 Years | 0 (0.0%) | 0 (0.0%) |
| 5 to 17 Years | 13 (8.2%) | 1 (0.7%) |
| 18 to 34 Years | 10 (9.9%) | 1 (0.8%) |
| 35 to 64 Years | 50 (14.2%) | 24 (7.7%) |
| 65 to 74 Years | 54 (33.1%) | 29 (20.1%) |
| 75 Years and over | 29 (36.7%) | 76 (55.1%) |
Disability Class by Sex by Age in Jerauld County
Disability Class: Hearing Difficulty

| Age Bracket | Male | Female |
| Under 5 Years | 0 (0.0%) | 0 (0.0%) |
| 5 to 17 Years | 4 (2.5%) | 0 (0.0%) |
| 18 to 34 Years | 0 (0.0%) | 0 (0.0%) |
| 35 to 64 Years | 20 (5.7%) | 5 (1.6%) |
| 65 to 74 Years | 38 (23.3%) | 14 (9.7%) |
| 75 Years and over | 29 (36.7%) | 12 (8.7%) |
Disability Class: Vision Difficulty

| Age Bracket | Male | Female |
| Under 5 Years | 0 (0.0%) | 0 (0.0%) |
| 5 to 17 Years | 4 (2.5%) | 0 (0.0%) |
| 18 to 34 Years | 0 (0.0%) | 0 (0.0%) |
| 35 to 64 Years | 15 (4.3%) | 4 (1.3%) |
| 65 to 74 Years | 2 (1.2%) | 11 (7.6%) |
| 75 Years and over | 2 (2.5%) | 22 (15.9%) |
Disability Class: Cognitive Difficulty

| Age Bracket | Male | Female |
| 5 to 17 Years | 2 (1.3%) | 1 (0.7%) |
| 18 to 34 Years | 1 (1.0%) | 1 (0.8%) |
| 35 to 64 Years | 8 (2.3%) | 4 (1.3%) |
| 65 to 74 Years | 4 (2.5%) | 1 (0.7%) |
| 75 Years and over | 0 (0.0%) | 7 (5.1%) |
Disability Class: Ambulatory Difficulty

| Age Bracket | Male | Female |
| 5 to 17 Years | 3 (1.9%) | 0 (0.0%) |
| 18 to 34 Years | 9 (8.9%) | 0 (0.0%) |
| 35 to 64 Years | 28 (8.0%) | 12 (3.9%) |
| 65 to 74 Years | 15 (9.2%) | 5 (3.5%) |
| 75 Years and over | 7 (8.9%) | 65 (47.1%) |
Disability Class: Self-Care Difficulty

| Age Bracket | Male | Female |
| 5 to 17 Years | 3 (1.9%) | 0 (0.0%) |
| 18 to 34 Years | 0 (0.0%) | 0 (0.0%) |
| 35 to 64 Years | 0 (0.0%) | 4 (1.3%) |
| 65 to 74 Years | 2 (1.2%) | 0 (0.0%) |
| 75 Years and over | 7 (8.9%) | 27 (19.6%) |
Technology Access in Jerauld County
Computing Device Access in Jerauld County

| Device Type | # Households | % Households |
| Desktop or Laptop | 650 | 75.7% |
| Smartphone | 693 | 80.7% |
| Tablet | 502 | 58.4% |
| No Computing Device | 67 | 7.8% |
| Total | 859 | 100.0% |
Internet Access in Jerauld County
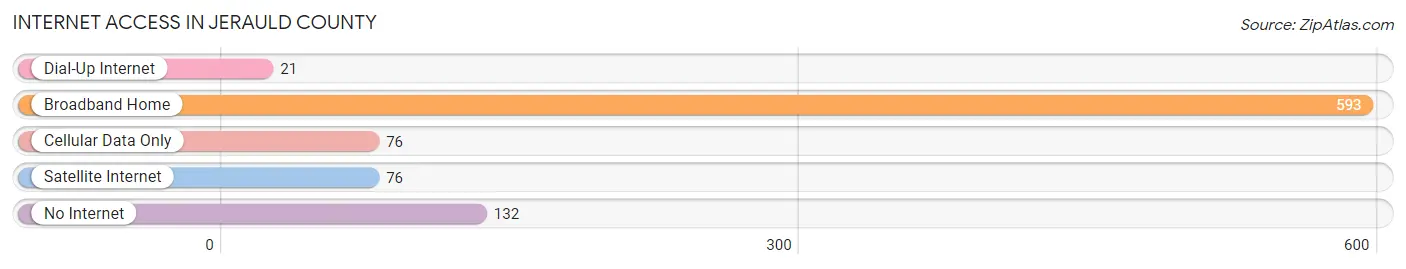
| Internet Type | # Households | % Households |
| Dial-Up Internet | 21 | 2.4% |
| Broadband Home | 593 | 69.0% |
| Cellular Data Only | 76 | 8.8% |
| Satellite Internet | 76 | 8.8% |
| No Internet | 132 | 15.4% |
| Total | 859 | 100.0% |
Jerauld County Summary
Jerauld County is located in the southeastern corner of South Dakota, and is bordered by the states of Nebraska and Minnesota. It is part of the Mitchell, South Dakota, Micropolitan Statistical Area. As of the 2010 census, the population was 2,071, making it the second-least populous county in South Dakota. The county seat is Wessington Springs.
History
Jerauld County was created in 1873 from part of Brule County. It was named for John P. Jerauld, a prominent early settler and politician in the area. The first settlers arrived in the area in the 1870s, and the county was officially organized in 1883.
The county was largely agricultural in its early years, with wheat, corn, and oats being the main crops. In the early 1900s, the county experienced a population boom, as many people moved to the area to take advantage of the fertile soil and abundant water.
Geography
Jerauld County is located in the southeastern corner of South Dakota, and is bordered by the states of Nebraska and Minnesota. It is part of the Mitchell, South Dakota, Micropolitan Statistical Area. The county has a total area of 576 square miles, of which 575 square miles is land and 1.2 square miles is water.
The county is mostly flat, with rolling hills in the east and south. The terrain is mostly prairie, with some wooded areas in the east. The county is drained by the James River, which flows through the county from north to south.
Economy
Agriculture is the main economic activity in Jerauld County. The county is home to a variety of crops, including wheat, corn, soybeans, and alfalfa. Livestock production is also important, with cattle, hogs, and sheep being raised in the area.
The county also has a number of small businesses, including retail stores, restaurants, and service providers. The county is home to a number of manufacturing companies, including a concrete plant, a grain elevator, and a feed mill.
Demographics
As of the 2010 census, there were 2,071 people, 845 households, and 576 families living in the county. The population density was 3.6 people per square mile. There were 945 housing units at an average density of 1.6 per square mile. The racial makeup of the county was 97.2% White, 0.2% African American, 0.3% Native American, 0.2% Asian, 0.1% Pacific Islander, 0.7% from other races, and 1.3% from two or more races. Hispanic or Latino of any race were 1.7% of the population.
There were 845 households, out of which 28.2% had children under the age of 18 living with them, 56.2% were married couples living together, 6.7% had a female householder with no husband present, and 33.2% were non-families. 29.2% of all households were made up of individuals, and 14.7% had someone living alone who was 65 years of age or older. The average household size was 2.44 and the average family size was 3.02.
In the county, the population was spread out, with 25.2% under the age of 18, 6.2% from 18 to 24, 24.2% from 25 to 44, 25.2% from 45 to 64, and 19.2% who were 65 years of age or older. The median age was 41 years. For every 100 females there were 97.2 males. For every 100 females age 18 and over, there were 94.2 males.
The median income for a household in the county was $35,938, and the median income for a family was $43,750. Males had a median income of $30,000 versus $20,000 for females. The per capita income for the county was $17,845. About 8.2% of families and 11.2% of the population were below the poverty line, including 14.2% of those under age 18 and 11.2% of those age 65 or over.
Common Questions
What is the Total Population of Jerauld County?
Total Population of Jerauld County is 1,836.
What is the Total Male Population of Jerauld County?
Total Male Population of Jerauld County is 916.
What is the Total Female Population of Jerauld County?
Total Female Population of Jerauld County is 920.
What is the Ratio of Males per 100 Females in Jerauld County?
There are 99.57 Males per 100 Females in Jerauld County.
What is the Ratio of Females per 100 Males in Jerauld County?
There are 100.44 Females per 100 Males in Jerauld County.
What is the Median Population Age in Jerauld County?
Median Population Age in Jerauld County is 50.5 Years.
What is the Average Family Size in Jerauld County
Average Family Size in Jerauld County is 2.7 People.
What is the Average Household Size in Jerauld County
Average Household Size in Jerauld County is 2.1 People.
What is Per Capita Income in Jerauld County?
Per Capita income in Jerauld County is $47,964.
What is the Median Family Income in Jerauld County?
Median Family Income in Jerauld County is $88,563.
What is the Median Household income in Jerauld County?
Median Household Income in Jerauld County is $66,607.
What is Income or Wage Gap in Jerauld County?
Income or Wage Gap in Jerauld County is 59.5%.
Women in Jerauld County earn 40.5 cents for every dollar earned by a man.
What is Family Income Deficit in Jerauld County?
Family Income Deficit in Jerauld County is $10,150.
Families that are below poverty line in Jerauld County earn $10,150 less on average than the poverty threshold level.
What is Inequality or Gini Index in Jerauld County?
Inequality or Gini Index in Jerauld County is 0.53.
How Large is the Labor Force in Jerauld County?
There are 975 People in the Labor Forcein in Jerauld County.
What is the Percentage of People in the Labor Force in Jerauld County?
65.1% of People are in the Labor Force in Jerauld County.
What is the Unemployment Rate in Jerauld County?
Unemployment Rate in Jerauld County is 0.7%.