Hutchinson County, SD
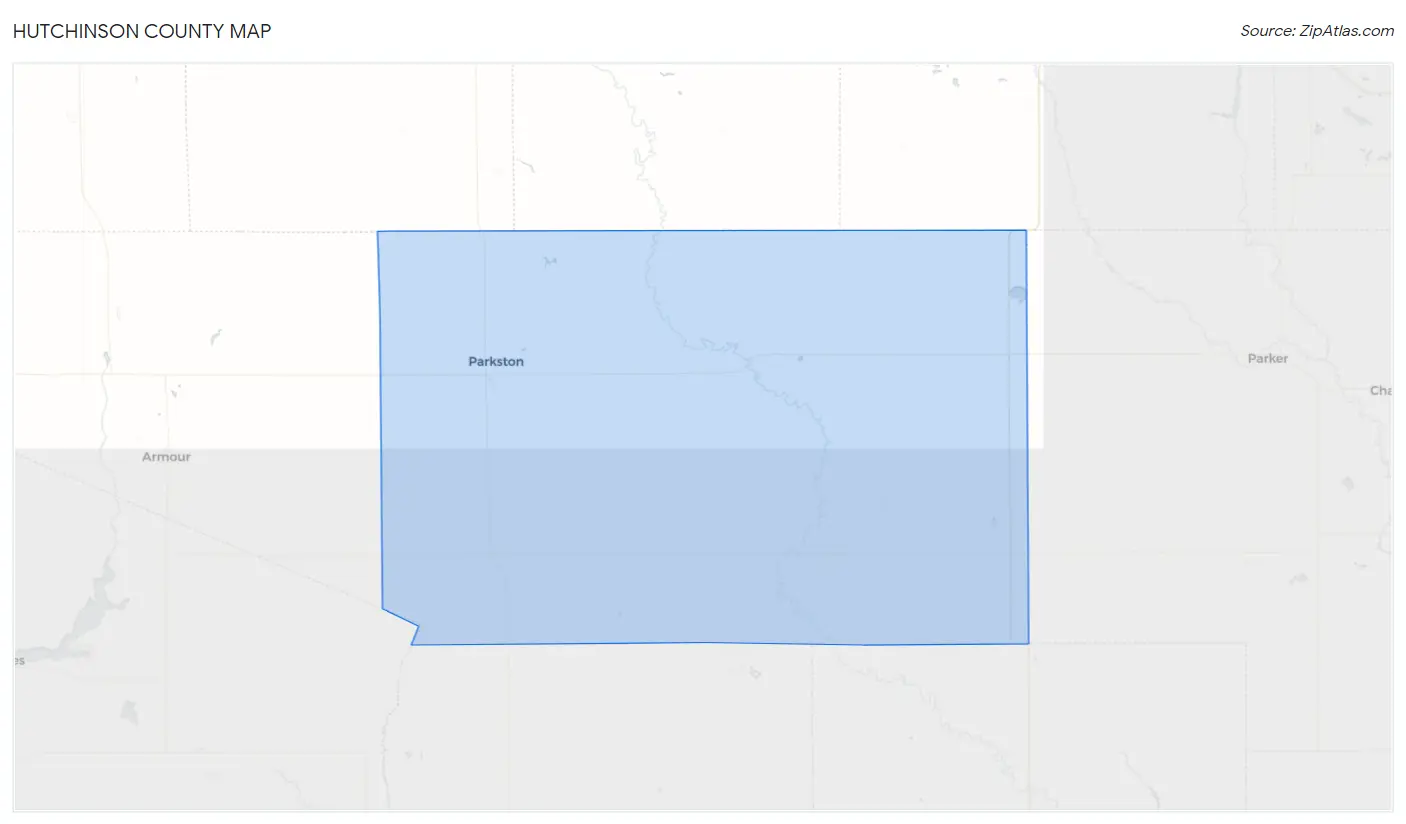
Hutchinson County Map
Hutchinson County Overview
7,401
TOTAL POPULATION
3,671
MALE POPULATION
3,730
FEMALE POPULATION
98.42
MALES / 100 FEMALES
101.61
FEMALES / 100 MALES
41.7
MEDIAN AGE
3.1
AVG FAMILY SIZE
2.4
AVG HOUSEHOLD SIZE
$35,631
PER CAPITA INCOME
$91,563
AVG FAMILY INCOME
$69,139
AVG HOUSEHOLD INCOME
36.0%
WAGE / INCOME GAP [ % ]
64.0¢/ $1
WAGE / INCOME GAP [ $ ]
0.42
INEQUALITY / GINI INDEX
3,765
LABOR FORCE [ PEOPLE ]
66.8%
PERCENT IN LABOR FORCE
1.5%
UNEMPLOYMENT RATE
Hutchinson County Area Codes
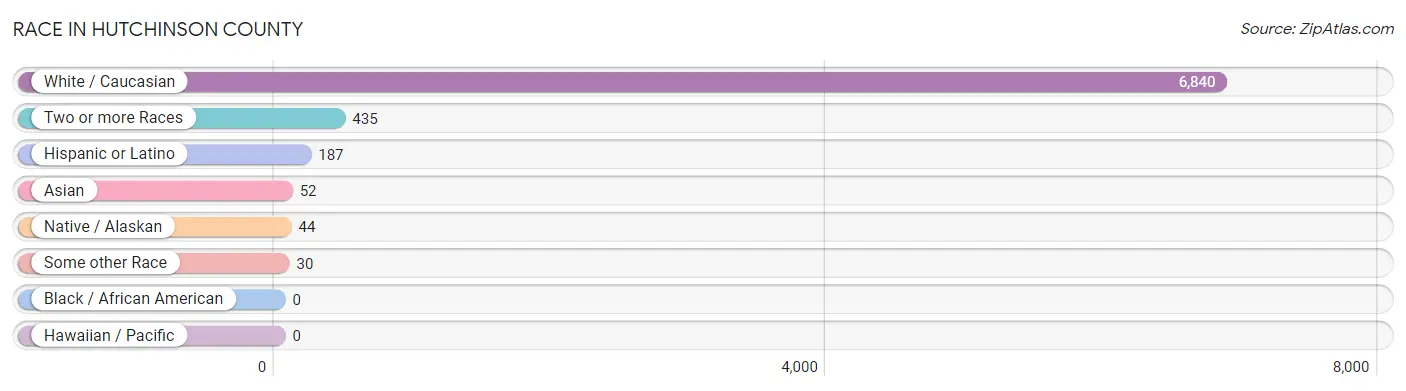
Race in Hutchinson County
The most populous races in Hutchinson County are White / Caucasian (6,840 | 92.4%), Two or more Races (435 | 5.9%), and Hispanic or Latino (187 | 2.5%).
| Race | # Population | % Population |
| Asian | 52 | 0.7% |
| Black / African American | 0 | 0.0% |
| Hawaiian / Pacific | 0 | 0.0% |
| Hispanic or Latino | 187 | 2.5% |
| Native / Alaskan | 44 | 0.6% |
| White / Caucasian | 6,840 | 92.4% |
| Two or more Races | 435 | 5.9% |
| Some other Race | 30 | 0.4% |
| Total | 7,401 | 100.0% |
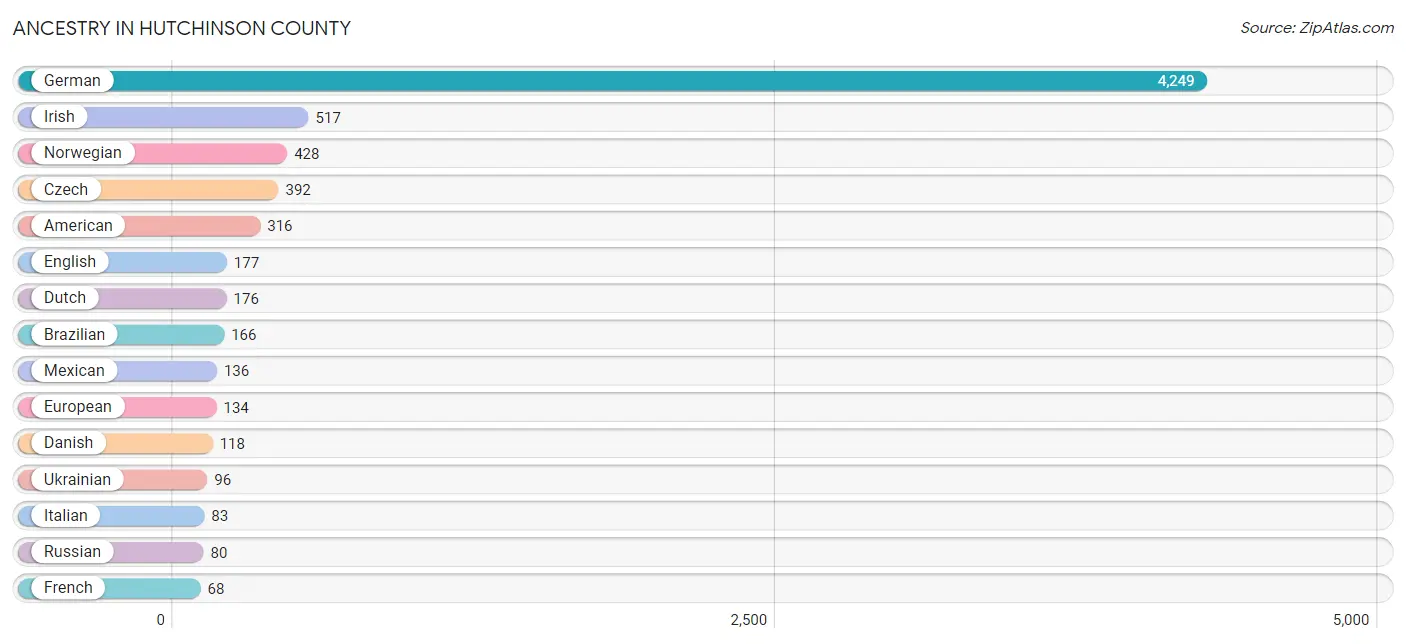
Ancestry in Hutchinson County
The most populous ancestries reported in Hutchinson County are German (4,249 | 57.4%), Irish (517 | 7.0%), Norwegian (428 | 5.8%), Czech (392 | 5.3%), and American (316 | 4.3%), together accounting for 79.7% of all Hutchinson County residents.
| Ancestry | # Population | % Population |
| American | 316 | 4.3% |
| Apache | 12 | 0.2% |
| Arab | 4 | 0.1% |
| Austrian | 32 | 0.4% |
| Blackfeet | 1 | 0.0% |
| Brazilian | 166 | 2.2% |
| British | 13 | 0.2% |
| Burmese | 5 | 0.1% |
| Cajun | 4 | 0.1% |
| Canadian | 5 | 0.1% |
| Central American | 45 | 0.6% |
| Cherokee | 16 | 0.2% |
| Cuban | 6 | 0.1% |
| Czech | 392 | 5.3% |
| Czechoslovakian | 32 | 0.4% |
| Danish | 118 | 1.6% |
| Dutch | 176 | 2.4% |
| Eastern European | 3 | 0.0% |
| English | 177 | 2.4% |
| European | 134 | 1.8% |
| Finnish | 8 | 0.1% |
| French | 68 | 0.9% |
| French Canadian | 22 | 0.3% |
| German | 4,249 | 57.4% |
| German Russian | 5 | 0.1% |
| Greek | 1 | 0.0% |
| Guatemalan | 45 | 0.6% |
| Hungarian | 14 | 0.2% |
| Icelander | 13 | 0.2% |
| Irish | 517 | 7.0% |
| Italian | 83 | 1.1% |
| Korean | 31 | 0.4% |
| Lithuanian | 3 | 0.0% |
| Mexican | 136 | 1.8% |
| Mexican American Indian | 10 | 0.1% |
| Nigerian | 13 | 0.2% |
| Norwegian | 428 | 5.8% |
| Pennsylvania German | 11 | 0.2% |
| Polish | 28 | 0.4% |
| Portuguese | 3 | 0.0% |
| Russian | 80 | 1.1% |
| Scandinavian | 68 | 0.9% |
| Scotch-Irish | 28 | 0.4% |
| Scottish | 47 | 0.6% |
| Sioux | 37 | 0.5% |
| South African | 2 | 0.0% |
| Subsaharan African | 15 | 0.2% |
| Swedish | 37 | 0.5% |
| Swiss | 8 | 0.1% |
| Syrian | 2 | 0.0% |
| Thai | 8 | 0.1% |
| Ukrainian | 96 | 1.3% |
| Vietnamese | 8 | 0.1% |
| Welsh | 5 | 0.1% | View All 54 Rows |
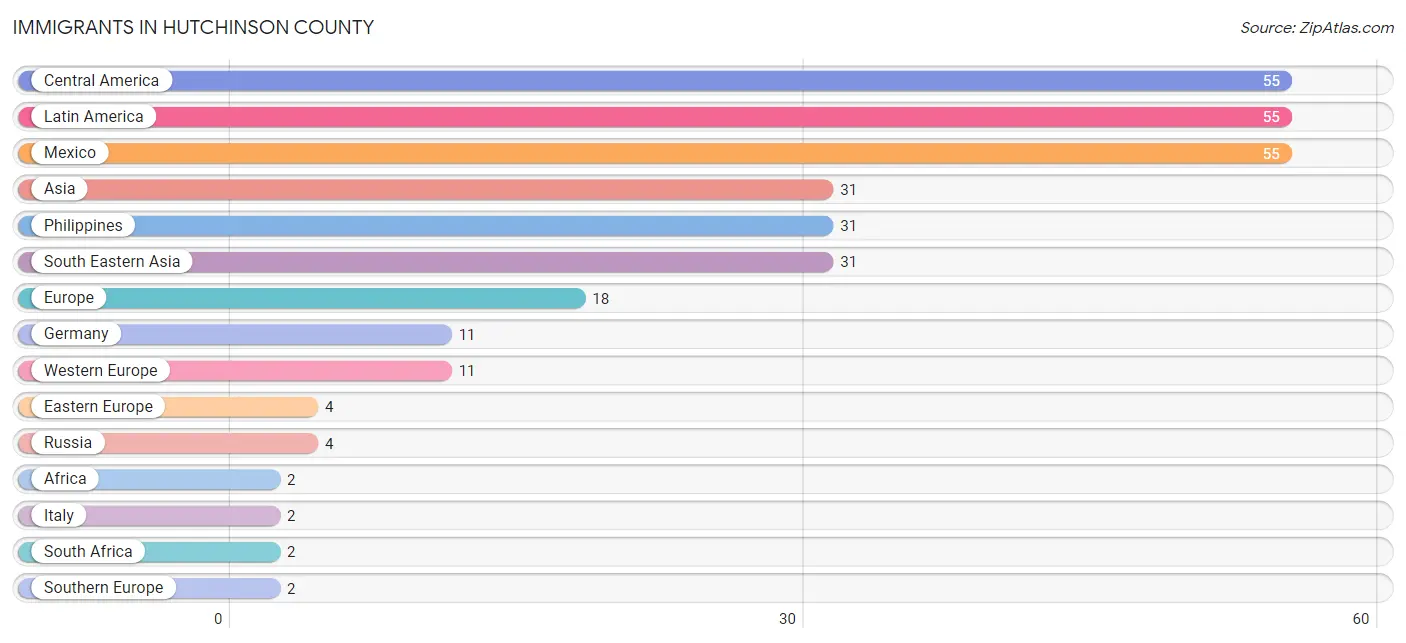
Immigrants in Hutchinson County
The most numerous immigrant groups reported in Hutchinson County came from Central America (55 | 0.7%), Latin America (55 | 0.7%), Mexico (55 | 0.7%), Asia (31 | 0.4%), and Philippines (31 | 0.4%), together accounting for 3.1% of all Hutchinson County residents.
| Immigration Origin | # Population | % Population |
| Africa | 2 | 0.0% |
| Asia | 31 | 0.4% |
| Central America | 55 | 0.7% |
| Eastern Europe | 4 | 0.1% |
| Europe | 18 | 0.2% |
| Germany | 11 | 0.2% |
| Italy | 2 | 0.0% |
| Latin America | 55 | 0.7% |
| Mexico | 55 | 0.7% |
| Northern Europe | 1 | 0.0% |
| Norway | 1 | 0.0% |
| Philippines | 31 | 0.4% |
| Russia | 4 | 0.1% |
| South Africa | 2 | 0.0% |
| South Eastern Asia | 31 | 0.4% |
| Southern Europe | 2 | 0.0% |
| Western Europe | 11 | 0.2% | View All 17 Rows |
Sex and Age in Hutchinson County
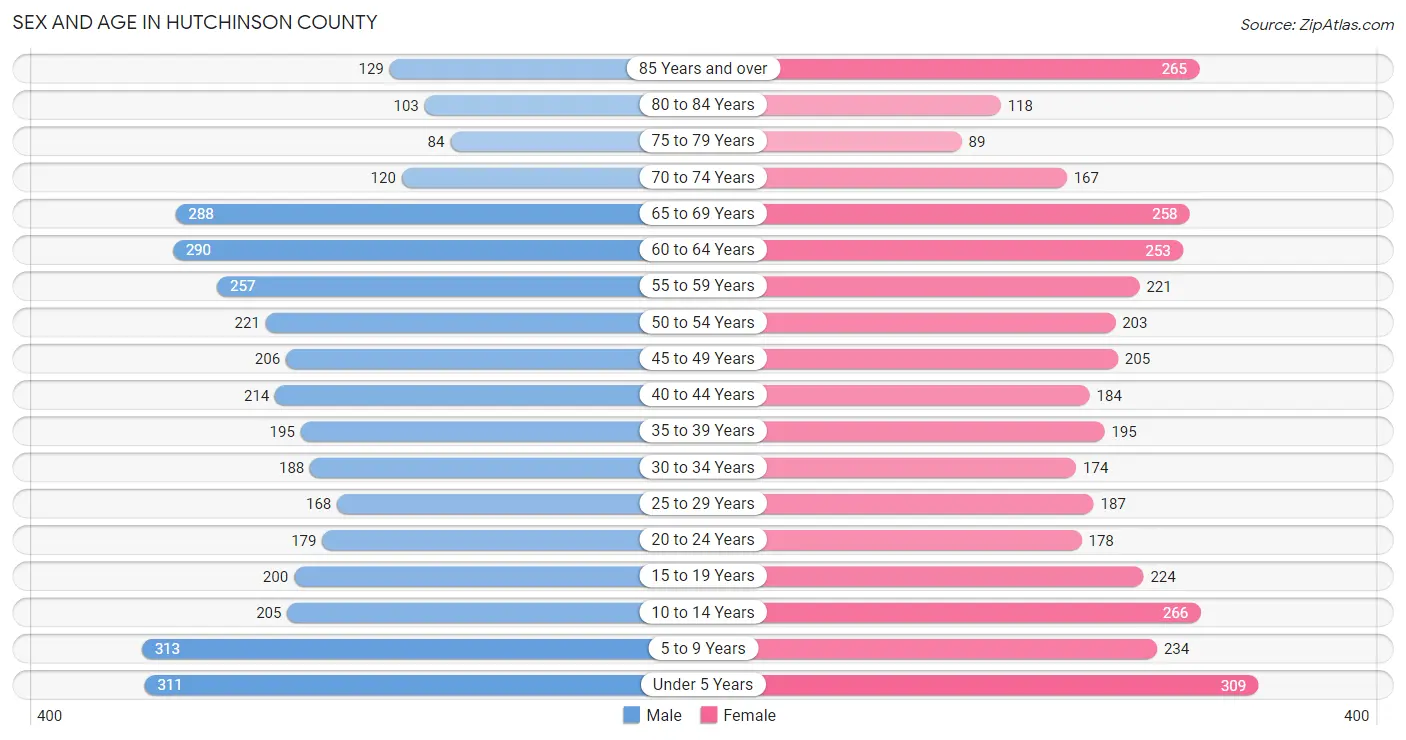
Sex and Age in Hutchinson County
The most populous age groups in Hutchinson County are 5 to 9 Years (313 | 8.5%) for men and Under 5 Years (309 | 8.3%) for women.
| Age Bracket | Male | Female |
| Under 5 Years | 311 (8.5%) | 309 (8.3%) |
| 5 to 9 Years | 313 (8.5%) | 234 (6.3%) |
| 10 to 14 Years | 205 (5.6%) | 266 (7.1%) |
| 15 to 19 Years | 200 (5.4%) | 224 (6.0%) |
| 20 to 24 Years | 179 (4.9%) | 178 (4.8%) |
| 25 to 29 Years | 168 (4.6%) | 187 (5.0%) |
| 30 to 34 Years | 188 (5.1%) | 174 (4.7%) |
| 35 to 39 Years | 195 (5.3%) | 195 (5.2%) |
| 40 to 44 Years | 214 (5.8%) | 184 (4.9%) |
| 45 to 49 Years | 206 (5.6%) | 205 (5.5%) |
| 50 to 54 Years | 221 (6.0%) | 203 (5.4%) |
| 55 to 59 Years | 257 (7.0%) | 221 (5.9%) |
| 60 to 64 Years | 290 (7.9%) | 253 (6.8%) |
| 65 to 69 Years | 288 (7.9%) | 258 (6.9%) |
| 70 to 74 Years | 120 (3.3%) | 167 (4.5%) |
| 75 to 79 Years | 84 (2.3%) | 89 (2.4%) |
| 80 to 84 Years | 103 (2.8%) | 118 (3.2%) |
| 85 Years and over | 129 (3.5%) | 265 (7.1%) |
| Total | 3,671 (100.0%) | 3,730 (100.0%) |
Families and Households in Hutchinson County
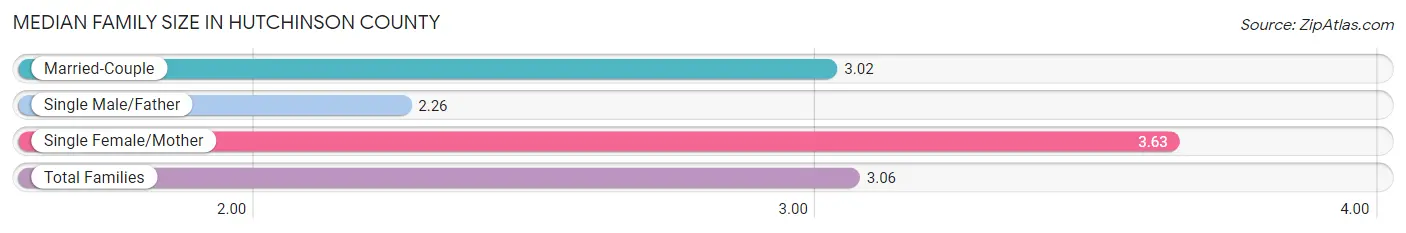
Median Family Size in Hutchinson County
The median family size in Hutchinson County is 3.06 persons per family, with single female/mother families (210 | 11.1%) accounting for the largest median family size of 3.63 persons per family. On the other hand, single male/father families (89 | 4.7%) represent the smallest median family size with 2.26 persons per family.
| Family Type | # Families | Family Size |
| Married-Couple | 1,596 (84.2%) | 3.02 |
| Single Male/Father | 89 (4.7%) | 2.26 |
| Single Female/Mother | 210 (11.1%) | 3.63 |
| Total Families | 1,895 (100.0%) | 3.06 |
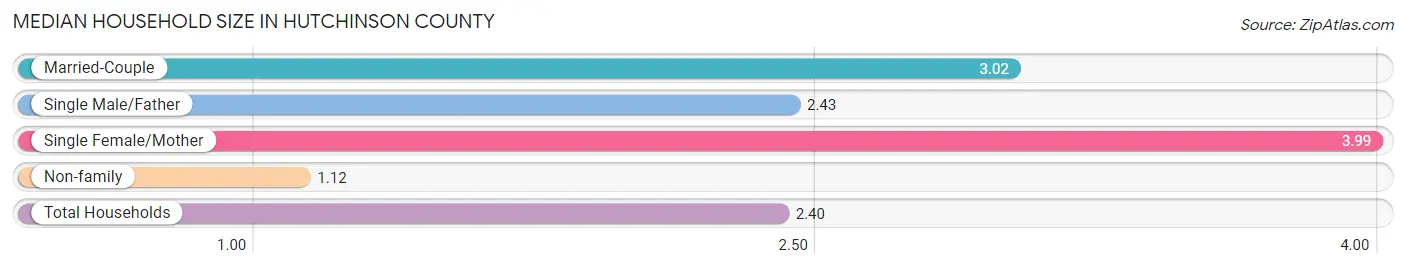
Median Household Size in Hutchinson County
The median household size in Hutchinson County is 2.40 persons per household, with single female/mother households (210 | 7.2%) accounting for the largest median household size of 3.99 persons per household. non-family households (1,036 | 35.3%) represent the smallest median household size with 1.12 persons per household.
| Household Type | # Households | Household Size |
| Married-Couple | 1,596 (54.4%) | 3.02 |
| Single Male/Father | 89 (3.0%) | 2.43 |
| Single Female/Mother | 210 (7.2%) | 3.99 |
| Non-family | 1,036 (35.3%) | 1.12 |
| Total Households | 2,931 (100.0%) | 2.40 |
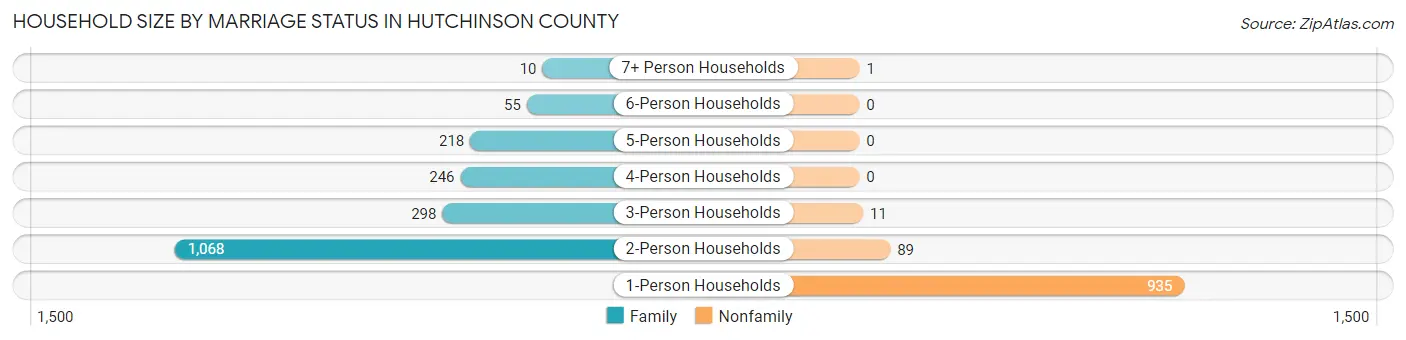
Household Size by Marriage Status in Hutchinson County
Out of a total of 2,931 households in Hutchinson County, 1,895 (64.6%) are family households, while 1,036 (35.3%) are nonfamily households. The most numerous type of family households are 2-person households, comprising 1,068, and the most common type of nonfamily households are 1-person households, comprising 935.
| Household Size | Family Households | Nonfamily Households |
| 1-Person Households | - | 935 (31.9%) |
| 2-Person Households | 1,068 (36.4%) | 89 (3.0%) |
| 3-Person Households | 298 (10.2%) | 11 (0.4%) |
| 4-Person Households | 246 (8.4%) | 0 (0.0%) |
| 5-Person Households | 218 (7.4%) | 0 (0.0%) |
| 6-Person Households | 55 (1.9%) | 0 (0.0%) |
| 7+ Person Households | 10 (0.3%) | 1 (0.0%) |
| Total | 1,895 (64.6%) | 1,036 (35.3%) |
Female Fertility in Hutchinson County
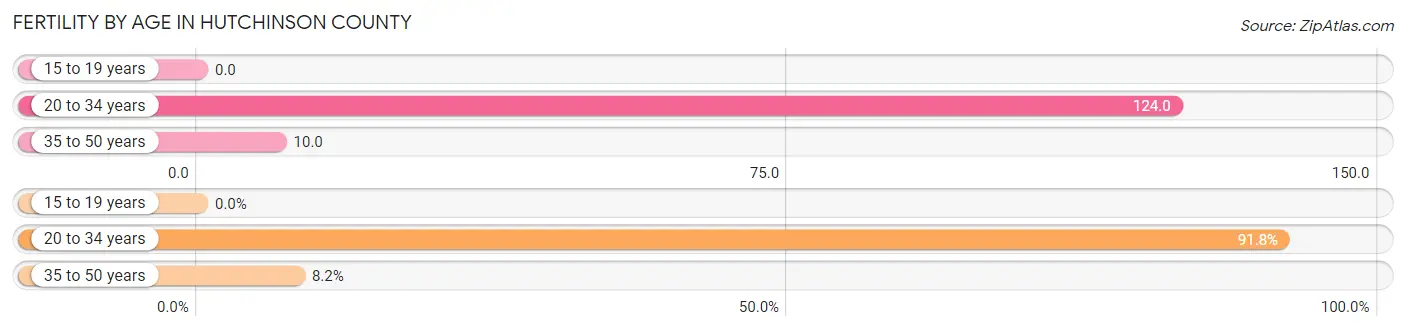
Fertility by Age in Hutchinson County
Average fertility rate in Hutchinson County is 54.0 births per 1,000 women. Women in the age bracket of 20 to 34 years have the highest fertility rate with 124.0 births per 1,000 women. Women in the age bracket of 20 to 34 years acount for 91.8% of all women with births.
| Age Bracket | Women with Births | Births / 1,000 Women |
| 15 to 19 years | 0 (0.0%) | 0.0 |
| 20 to 34 years | 67 (91.8%) | 124.0 |
| 35 to 50 years | 6 (8.2%) | 10.0 |
| Total | 73 (100.0%) | 54.0 |
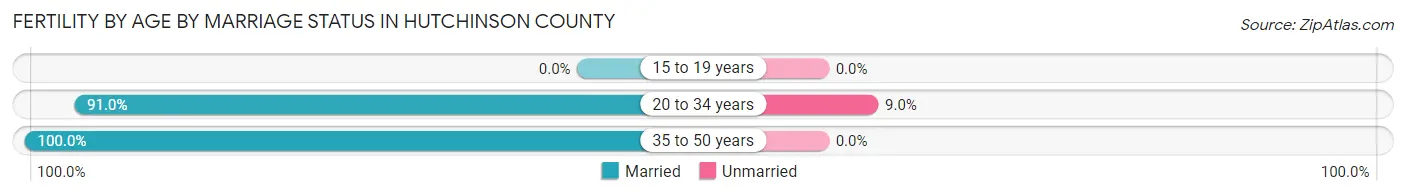
Fertility by Age by Marriage Status in Hutchinson County
91.8% of women with births (73) in Hutchinson County are married. The highest percentage of unmarried women with births falls into 20 to 34 years age bracket with 9.0% of them unmarried at the time of birth, while the lowest percentage of unmarried women with births belong to 35 to 50 years age bracket with 0.0% of them unmarried.
| Age Bracket | Married | Unmarried |
| 15 to 19 years | 0 (0.0%) | 0 (0.0%) |
| 20 to 34 years | 61 (91.0%) | 6 (9.0%) |
| 35 to 50 years | 6 (100.0%) | 0 (0.0%) |
| Total | 67 (91.8%) | 6 (8.2%) |
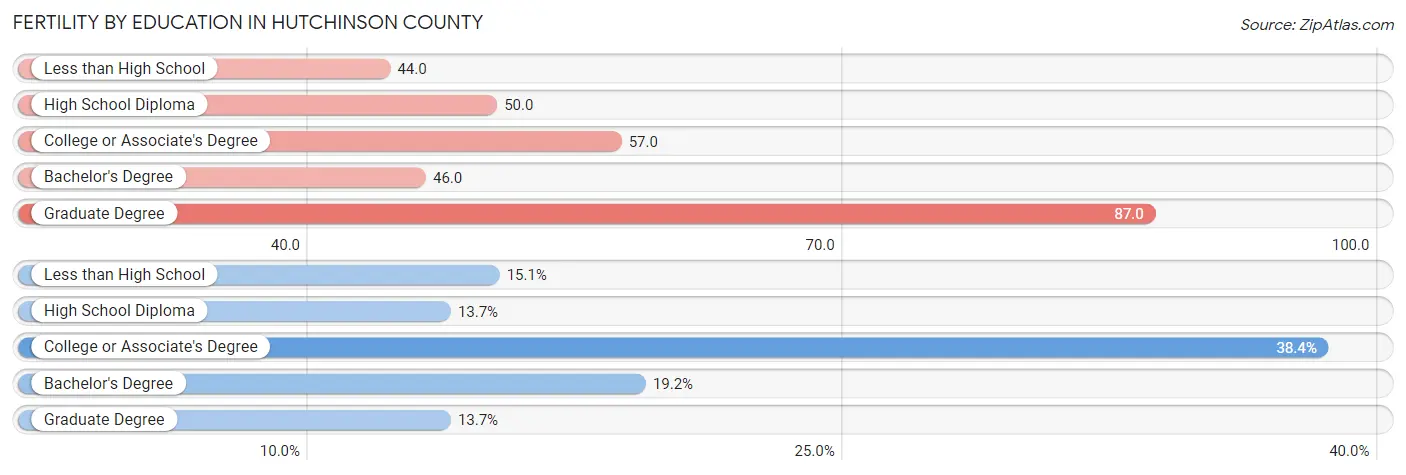
Fertility by Education in Hutchinson County
Average fertility rate in Hutchinson County is 54.0 births per 1,000 women. Women with the education attainment of graduate degree have the highest fertility rate of 87.0 births per 1,000 women, while women with the education attainment of less than high school have the lowest fertility at 44.0 births per 1,000 women. Women with the education attainment of college or associate's degree represent 38.4% of all women with births.
| Educational Attainment | Women with Births | Births / 1,000 Women |
| Less than High School | 11 (15.1%) | 44.0 |
| High School Diploma | 10 (13.7%) | 50.0 |
| College or Associate's Degree | 28 (38.4%) | 57.0 |
| Bachelor's Degree | 14 (19.2%) | 46.0 |
| Graduate Degree | 10 (13.7%) | 87.0 |
| Total | 73 (100.0%) | 54.0 |
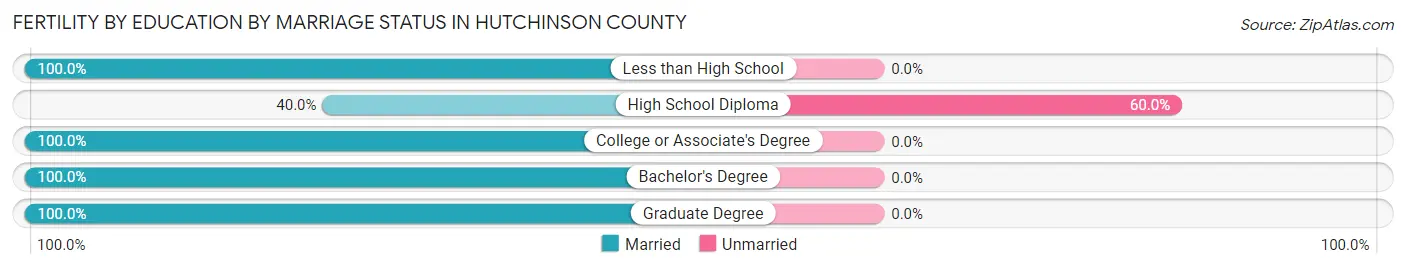
Fertility by Education by Marriage Status in Hutchinson County
8.2% of women with births in Hutchinson County are unmarried. Women with the educational attainment of less than high school are most likely to be married with 100.0% of them married at childbirth, while women with the educational attainment of high school diploma are least likely to be married with 60.0% of them unmarried at childbirth.
| Educational Attainment | Married | Unmarried |
| Less than High School | 11 (100.0%) | 0 (0.0%) |
| High School Diploma | 4 (40.0%) | 6 (60.0%) |
| College or Associate's Degree | 28 (100.0%) | 0 (0.0%) |
| Bachelor's Degree | 14 (100.0%) | 0 (0.0%) |
| Graduate Degree | 10 (100.0%) | 0 (0.0%) |
| Total | 67 (91.8%) | 6 (8.2%) |
Income in Hutchinson County
Income Overview in Hutchinson County
Per Capita Income in Hutchinson County is $35,631, while median incomes of families and households are $91,563 and $69,139 respectively.
| Characteristic | Number | Measure |
| Per Capita Income | 7,401 | $35,631 |
| Median Family Income | 1,895 | $91,563 |
| Mean Family Income | 1,895 | $105,297 |
| Median Household Income | 2,931 | $69,139 |
| Mean Household Income | 2,931 | $87,737 |
| Income Deficit | 1,895 | $0 |
| Wage / Income Gap (%) | 7,401 | 35.97% |
| Wage / Income Gap ($) | 7,401 | 64.03¢ per $1 |
| Gini / Inequality Index | 7,401 | 0.42 |
Earnings by Sex in Hutchinson County
Average Earnings in Hutchinson County are $42,038, $51,528 for men and $32,995 for women, a difference of 36.0%.
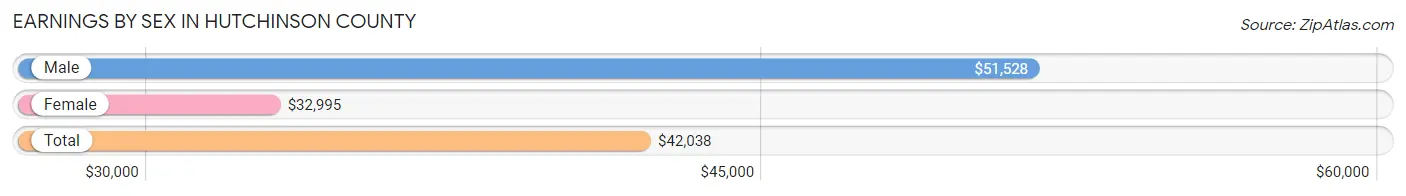
| Sex | Number | Average Earnings |
| Male | 2,092 (52.1%) | $51,528 |
| Female | 1,924 (47.9%) | $32,995 |
| Total | 4,016 (100.0%) | $42,038 |
Earnings by Sex by Income Bracket in Hutchinson County
The most common earnings brackets in Hutchinson County are $100,000+ for men (307 | 14.7%) and $40,000 to $44,999 for women (189 | 9.8%).
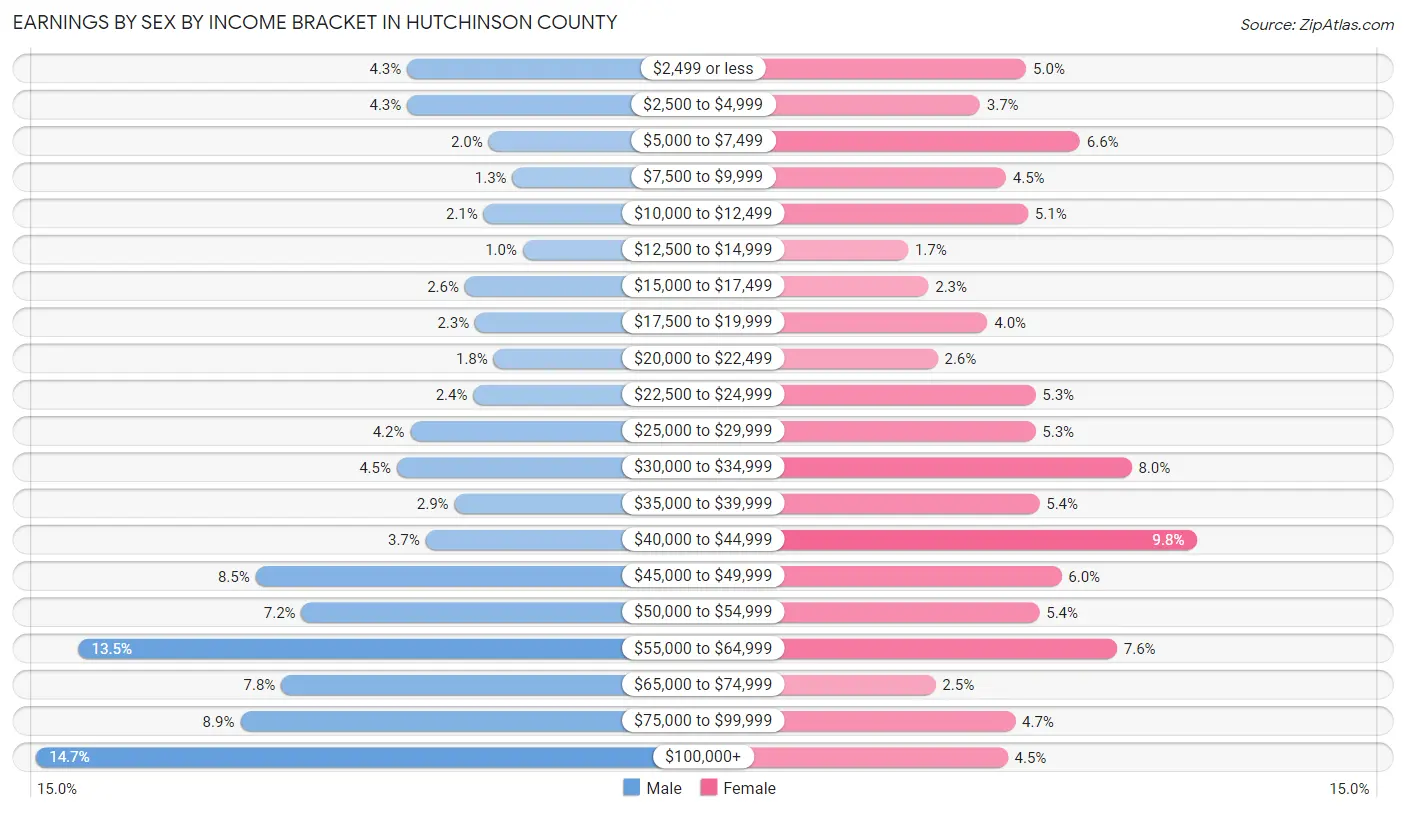
| Income | Male | Female |
| $2,499 or less | 89 (4.3%) | 97 (5.0%) |
| $2,500 to $4,999 | 89 (4.3%) | 72 (3.7%) |
| $5,000 to $7,499 | 41 (2.0%) | 126 (6.6%) |
| $7,500 to $9,999 | 27 (1.3%) | 86 (4.5%) |
| $10,000 to $12,499 | 44 (2.1%) | 98 (5.1%) |
| $12,500 to $14,999 | 21 (1.0%) | 33 (1.7%) |
| $15,000 to $17,499 | 55 (2.6%) | 44 (2.3%) |
| $17,500 to $19,999 | 49 (2.3%) | 76 (4.0%) |
| $20,000 to $22,499 | 38 (1.8%) | 49 (2.5%) |
| $22,500 to $24,999 | 50 (2.4%) | 102 (5.3%) |
| $25,000 to $29,999 | 87 (4.2%) | 102 (5.3%) |
| $30,000 to $34,999 | 95 (4.5%) | 154 (8.0%) |
| $35,000 to $39,999 | 61 (2.9%) | 104 (5.4%) |
| $40,000 to $44,999 | 78 (3.7%) | 189 (9.8%) |
| $45,000 to $49,999 | 178 (8.5%) | 116 (6.0%) |
| $50,000 to $54,999 | 151 (7.2%) | 104 (5.4%) |
| $55,000 to $64,999 | 282 (13.5%) | 146 (7.6%) |
| $65,000 to $74,999 | 163 (7.8%) | 48 (2.5%) |
| $75,000 to $99,999 | 187 (8.9%) | 91 (4.7%) |
| $100,000+ | 307 (14.7%) | 87 (4.5%) |
| Total | 2,092 (100.0%) | 1,924 (100.0%) |
Earnings by Sex by Educational Attainment in Hutchinson County
Average earnings in Hutchinson County are $55,600 for men and $37,500 for women, a difference of 32.6%. Men with an educational attainment of bachelor's degree enjoy the highest average annual earnings of $66,875, while those with less than high school education earn the least with $29,583. Women with an educational attainment of graduate degree earn the most with the average annual earnings of $64,792, while those with college or associate's degree education have the smallest earnings of $31,848.
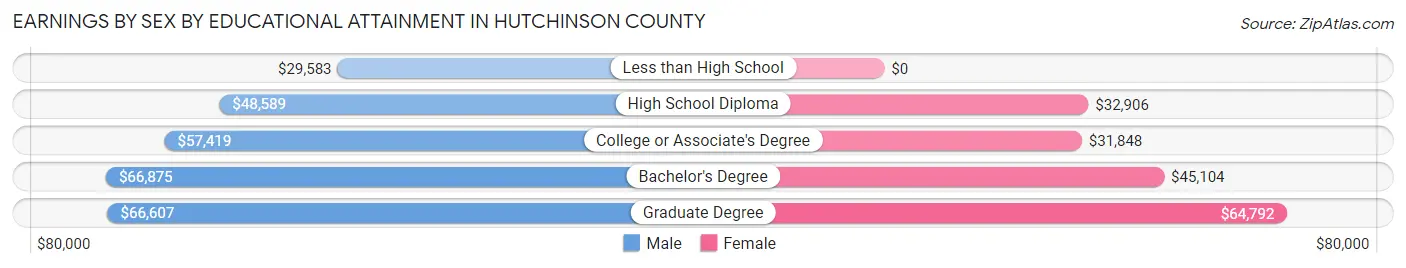
| Educational Attainment | Male Income | Female Income |
| Less than High School | $29,583 | $0 |
| High School Diploma | $48,589 | $32,906 |
| College or Associate's Degree | $57,419 | $31,848 |
| Bachelor's Degree | $66,875 | $45,104 |
| Graduate Degree | $66,607 | $64,792 |
| Total | $55,600 | $37,500 |
Family Income in Hutchinson County
Family Income Brackets in Hutchinson County
According to the Hutchinson County family income data, there are 591 families falling into the $100,000 to $149,999 income range, which is the most common income bracket and makes up 31.2% of all families. Conversely, the $10,000 to $14,999 income bracket is the least frequent group with only 21 families (1.1%) belonging to this category.
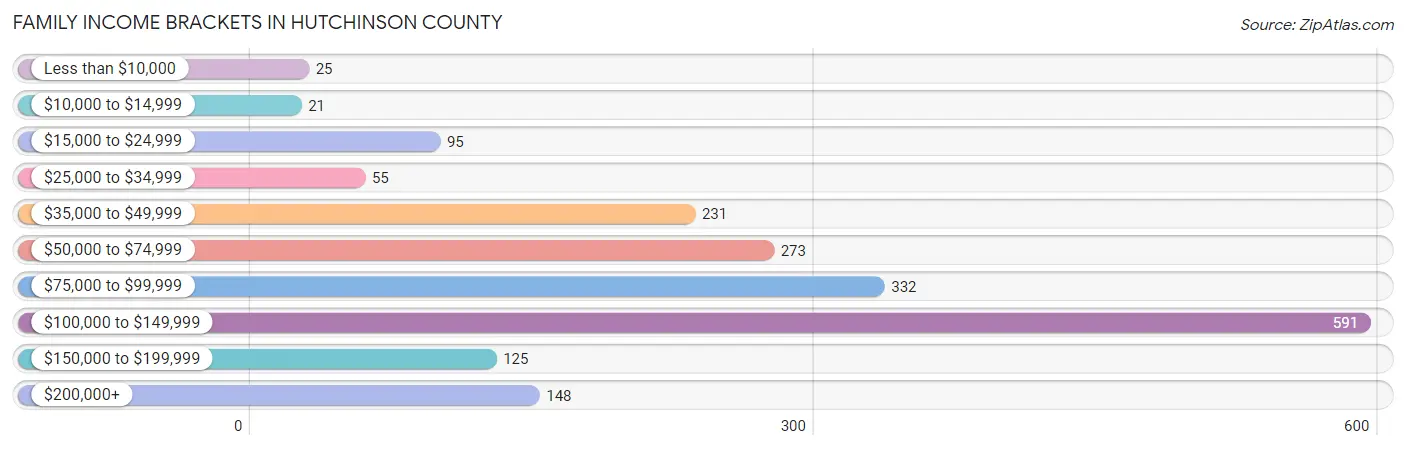
| Income Bracket | # Families | % Families |
| Less than $10,000 | 25 | 1.3% |
| $10,000 to $14,999 | 21 | 1.1% |
| $15,000 to $24,999 | 95 | 5.0% |
| $25,000 to $34,999 | 55 | 2.9% |
| $35,000 to $49,999 | 231 | 12.2% |
| $50,000 to $74,999 | 273 | 14.4% |
| $75,000 to $99,999 | 332 | 17.5% |
| $100,000 to $149,999 | 591 | 31.2% |
| $150,000 to $199,999 | 125 | 6.6% |
| $200,000+ | 148 | 7.8% |
Family Income by Famaliy Size in Hutchinson County
6-person families (43 | 2.3%) account for the highest median family income in Hutchinson County with $112,083 per family, while 2-person families (1,099 | 58.0%) have the highest median income of $43,708 per family member.
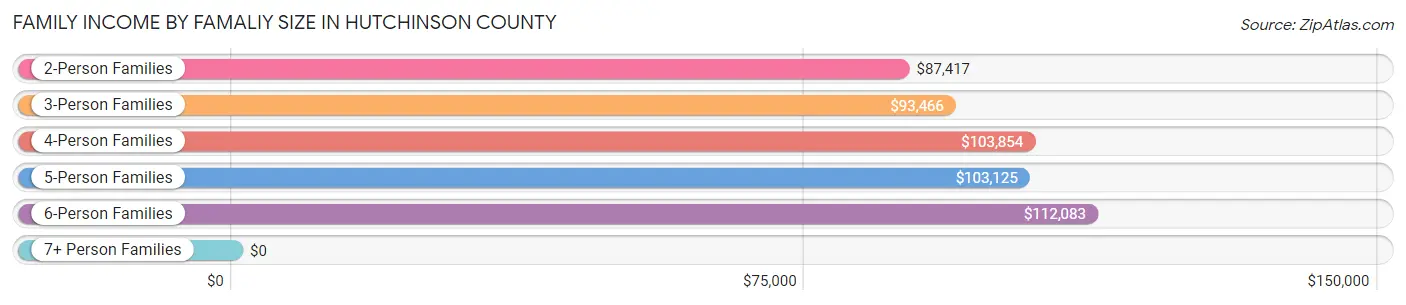
| Income Bracket | # Families | Median Income |
| 2-Person Families | 1,099 (58.0%) | $87,417 |
| 3-Person Families | 293 (15.5%) | $93,466 |
| 4-Person Families | 227 (12.0%) | $103,854 |
| 5-Person Families | 223 (11.8%) | $103,125 |
| 6-Person Families | 43 (2.3%) | $112,083 |
| 7+ Person Families | 10 (0.5%) | $0 |
| Total | 1,895 (100.0%) | $91,563 |
Family Income by Number of Earners in Hutchinson County
The median family income in Hutchinson County is $91,563, with families comprising 3+ earners (134) having the highest median family income of $108,182, while families with no earners (227) have the lowest median family income of $49,125, accounting for 7.1% and 12.0% of families, respectively.
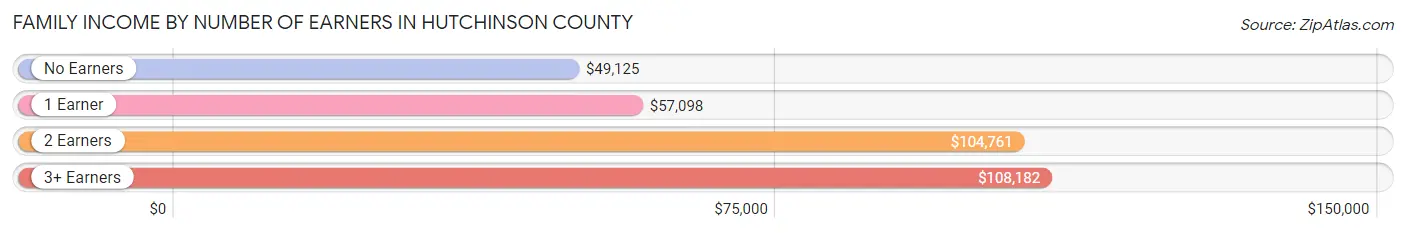
| Number of Earners | # Families | Median Income |
| No Earners | 227 (12.0%) | $49,125 |
| 1 Earner | 495 (26.1%) | $57,098 |
| 2 Earners | 1,039 (54.8%) | $104,761 |
| 3+ Earners | 134 (7.1%) | $108,182 |
| Total | 1,895 (100.0%) | $91,563 |
Household Income in Hutchinson County
Household Income Brackets in Hutchinson County
With 654 households falling in the category, the $100,000 to $149,999 income range is the most frequent in Hutchinson County, accounting for 22.3% of all households. In contrast, only 97 households (3.3%) fall into the $10,000 to $14,999 income bracket, making it the least populous group.
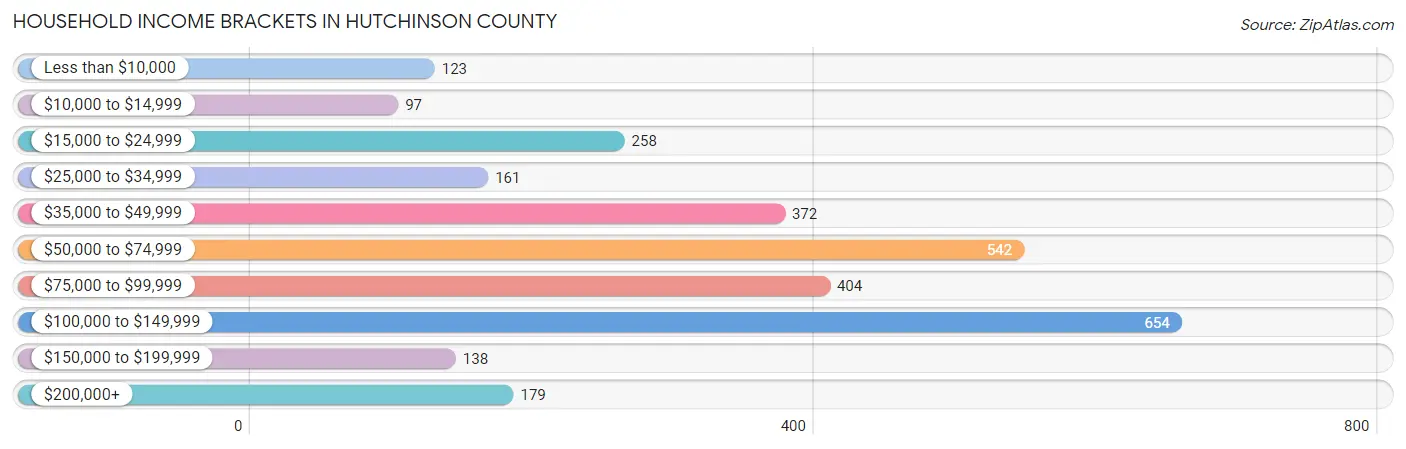
| Income Bracket | # Households | % Households |
| Less than $10,000 | 123 | 4.2% |
| $10,000 to $14,999 | 97 | 3.3% |
| $15,000 to $24,999 | 258 | 8.8% |
| $25,000 to $34,999 | 161 | 5.5% |
| $35,000 to $49,999 | 372 | 12.7% |
| $50,000 to $74,999 | 542 | 18.5% |
| $75,000 to $99,999 | 404 | 13.8% |
| $100,000 to $149,999 | 654 | 22.3% |
| $150,000 to $199,999 | 138 | 4.7% |
| $200,000+ | 179 | 6.1% |
Household Income by Householder Age in Hutchinson County
The median household income in Hutchinson County is $69,139, with the highest median household income of $87,159 found in the 45 to 64 years age bracket for the primary householder. A total of 1,095 households (37.4%) fall into this category. Meanwhile, the 65+ years age bracket for the primary householder has the lowest median household income of $47,625, with 904 households (30.8%) in this group.
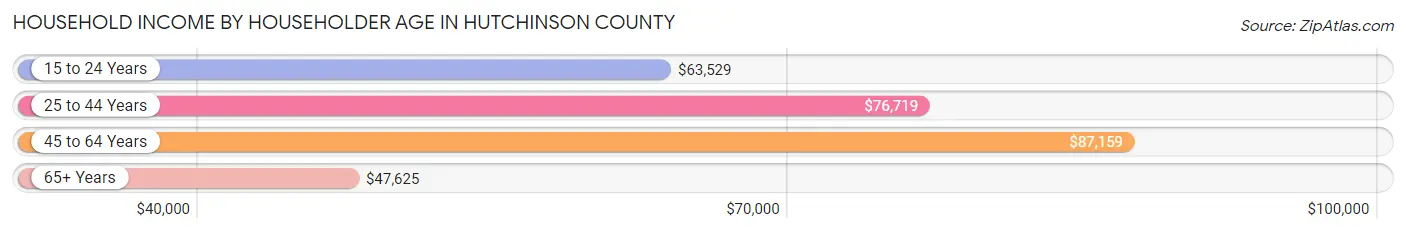
| Income Bracket | # Households | Median Income |
| 15 to 24 Years | 134 (4.6%) | $63,529 |
| 25 to 44 Years | 798 (27.2%) | $76,719 |
| 45 to 64 Years | 1,095 (37.4%) | $87,159 |
| 65+ Years | 904 (30.8%) | $47,625 |
| Total | 2,931 (100.0%) | $69,139 |
Poverty in Hutchinson County
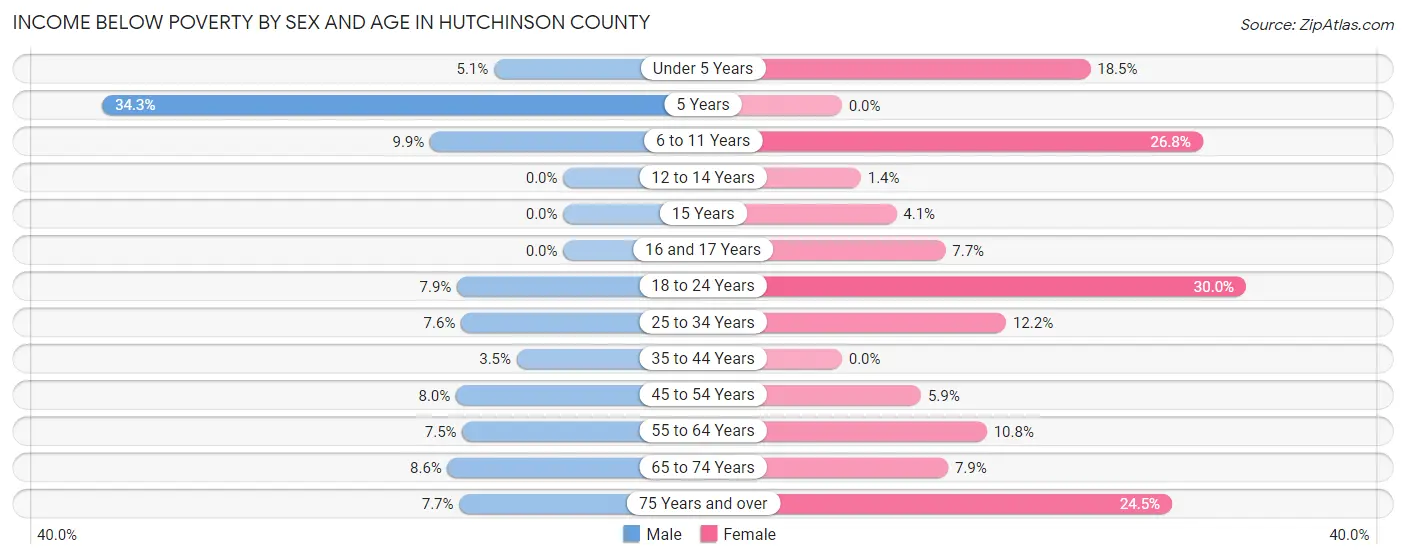
Income Below Poverty by Sex and Age in Hutchinson County
With 7.4% poverty level for males and 12.3% for females among the residents of Hutchinson County, 5 year old males and 18 to 24 year old females are the most vulnerable to poverty, with 25 males (34.3%) and 75 females (30.0%) in their respective age groups living below the poverty level.
| Age Bracket | Male | Female |
| Under 5 Years | 16 (5.1%) | 57 (18.4%) |
| 5 Years | 25 (34.3%) | 0 (0.0%) |
| 6 to 11 Years | 28 (9.9%) | 60 (26.8%) |
| 12 to 14 Years | 0 (0.0%) | 3 (1.4%) |
| 15 Years | 0 (0.0%) | 3 (4.1%) |
| 16 and 17 Years | 0 (0.0%) | 6 (7.7%) |
| 18 to 24 Years | 19 (7.9%) | 75 (30.0%) |
| 25 to 34 Years | 27 (7.6%) | 44 (12.2%) |
| 35 to 44 Years | 14 (3.5%) | 0 (0.0%) |
| 45 to 54 Years | 34 (8.0%) | 24 (5.9%) |
| 55 to 64 Years | 40 (7.5%) | 51 (10.8%) |
| 65 to 74 Years | 34 (8.6%) | 32 (7.9%) |
| 75 Years and over | 21 (7.7%) | 88 (24.5%) |
| Total | 258 (7.4%) | 443 (12.3%) |
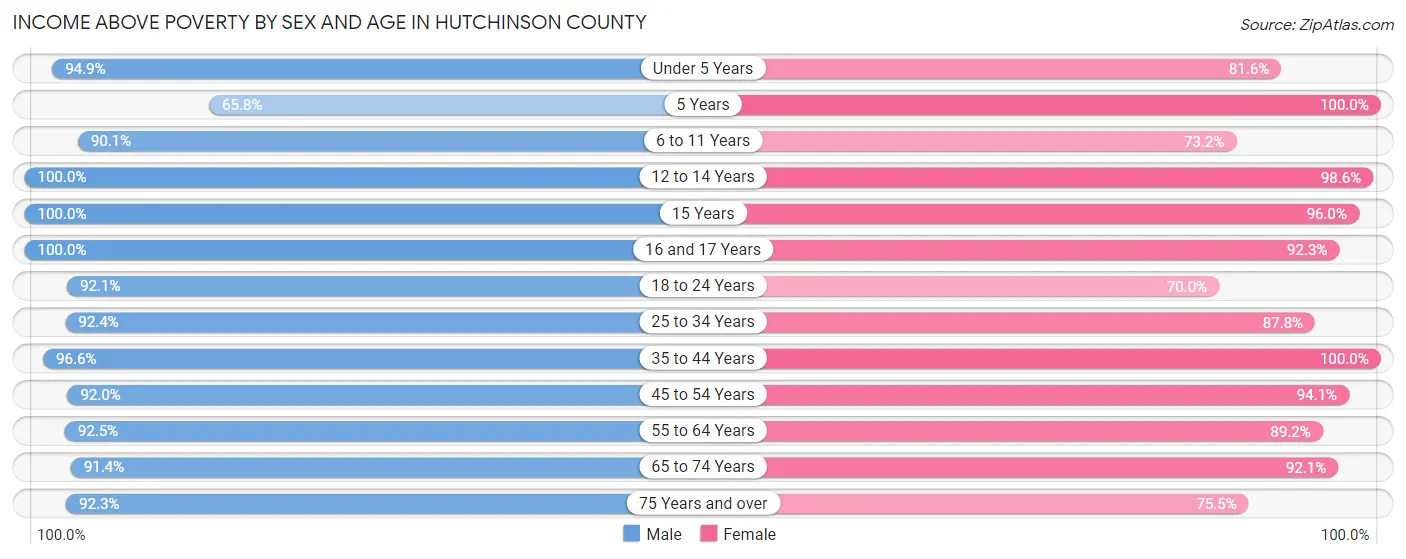
Income Above Poverty by Sex and Age in Hutchinson County
According to the poverty statistics in Hutchinson County, males aged 12 to 14 years and females aged 5 years are the age groups that are most secure financially, with 100.0% of males and 100.0% of females in these age groups living above the poverty line.
| Age Bracket | Male | Female |
| Under 5 Years | 295 (94.9%) | 252 (81.6%) |
| 5 Years | 48 (65.7%) | 51 (100.0%) |
| 6 to 11 Years | 255 (90.1%) | 164 (73.2%) |
| 12 to 14 Years | 66 (100.0%) | 210 (98.6%) |
| 15 Years | 53 (100.0%) | 71 (96.0%) |
| 16 and 17 Years | 80 (100.0%) | 72 (92.3%) |
| 18 to 24 Years | 222 (92.1%) | 175 (70.0%) |
| 25 to 34 Years | 329 (92.4%) | 317 (87.8%) |
| 35 to 44 Years | 392 (96.6%) | 379 (100.0%) |
| 45 to 54 Years | 393 (92.0%) | 384 (94.1%) |
| 55 to 64 Years | 494 (92.5%) | 423 (89.2%) |
| 65 to 74 Years | 362 (91.4%) | 374 (92.1%) |
| 75 Years and over | 251 (92.3%) | 271 (75.5%) |
| Total | 3,240 (92.6%) | 3,143 (87.6%) |
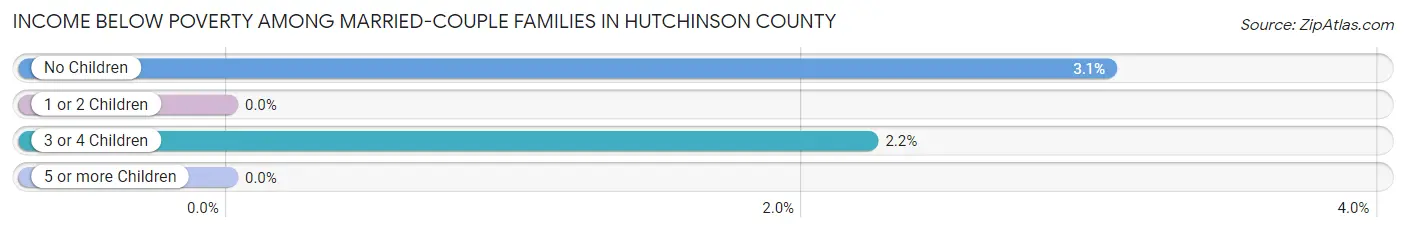
Income Below Poverty Among Married-Couple Families in Hutchinson County
The poverty statistics for married-couple families in Hutchinson County show that 2.3% or 36 of the total 1,596 families live below the poverty line. Families with no children have the highest poverty rate of 3.1%, comprising of 31 families. On the other hand, families with 1 or 2 children have the lowest poverty rate of 0.0%, which includes 0 families.
| Children | Above Poverty | Below Poverty |
| No Children | 982 (96.9%) | 31 (3.1%) |
| 1 or 2 Children | 349 (100.0%) | 0 (0.0%) |
| 3 or 4 Children | 219 (97.8%) | 5 (2.2%) |
| 5 or more Children | 10 (100.0%) | 0 (0.0%) |
| Total | 1,560 (97.7%) | 36 (2.3%) |
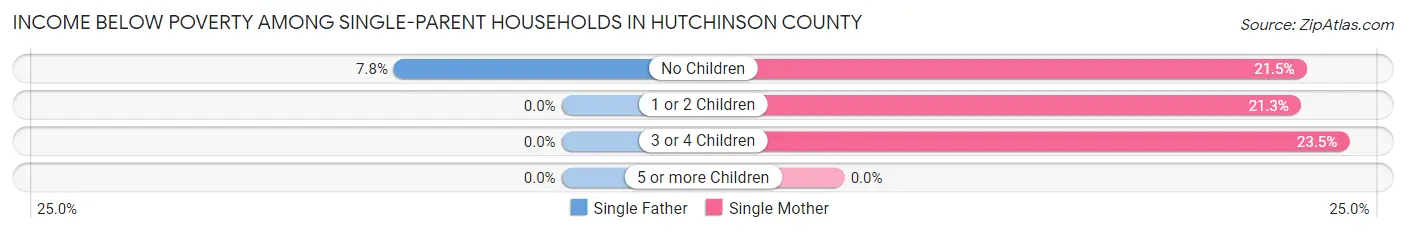
Income Below Poverty Among Single-Parent Households in Hutchinson County
According to the poverty data in Hutchinson County, 5.6% or 5 single-father households and 21.9% or 46 single-mother households are living below the poverty line. Among single-father households, those with no children have the highest poverty rate, with 5 households (7.8%) experiencing poverty. Likewise, among single-mother households, those with 3 or 4 children have the highest poverty rate, with 12 households (23.5%) falling below the poverty line.
| Children | Single Father | Single Mother |
| No Children | 5 (7.8%) | 14 (21.5%) |
| 1 or 2 Children | 0 (0.0%) | 20 (21.3%) |
| 3 or 4 Children | 0 (0.0%) | 12 (23.5%) |
| 5 or more Children | 0 (0.0%) | 0 (0.0%) |
| Total | 5 (5.6%) | 46 (21.9%) |
Income Below Poverty Among Married-Couple vs Single-Parent Households in Hutchinson County
The poverty data for Hutchinson County shows that 36 of the married-couple family households (2.3%) and 51 of the single-parent households (17.1%) are living below the poverty level. Within the married-couple family households, those with no children have the highest poverty rate, with 31 households (3.1%) falling below the poverty line. Among the single-parent households, those with 3 or 4 children have the highest poverty rate, with 12 household (23.5%) living below poverty.
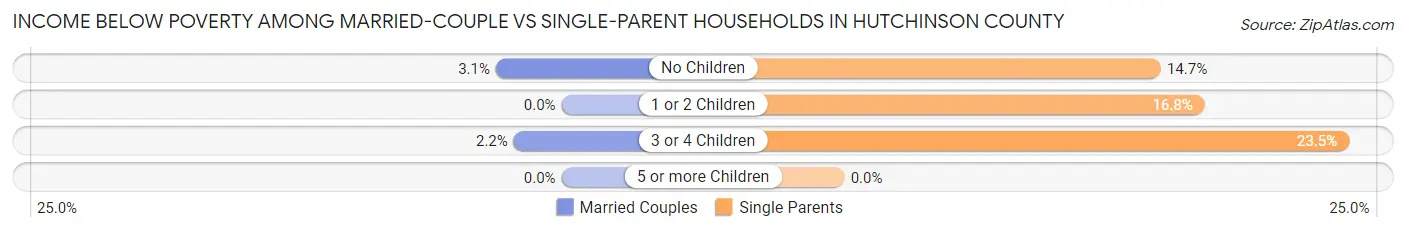
| Children | Married-Couple Families | Single-Parent Households |
| No Children | 31 (3.1%) | 19 (14.7%) |
| 1 or 2 Children | 0 (0.0%) | 20 (16.8%) |
| 3 or 4 Children | 5 (2.2%) | 12 (23.5%) |
| 5 or more Children | 0 (0.0%) | 0 (0.0%) |
| Total | 36 (2.3%) | 51 (17.1%) |
Employment Characteristics in Hutchinson County
Employment by Class of Employer in Hutchinson County
Among the 3,649 employed individuals in Hutchinson County, private company employees (2,075 | 56.9%), self-employed (not incorporated) (520 | 14.2%), and not-for-profit organizations (389 | 10.7%) make up the most common classes of employment.
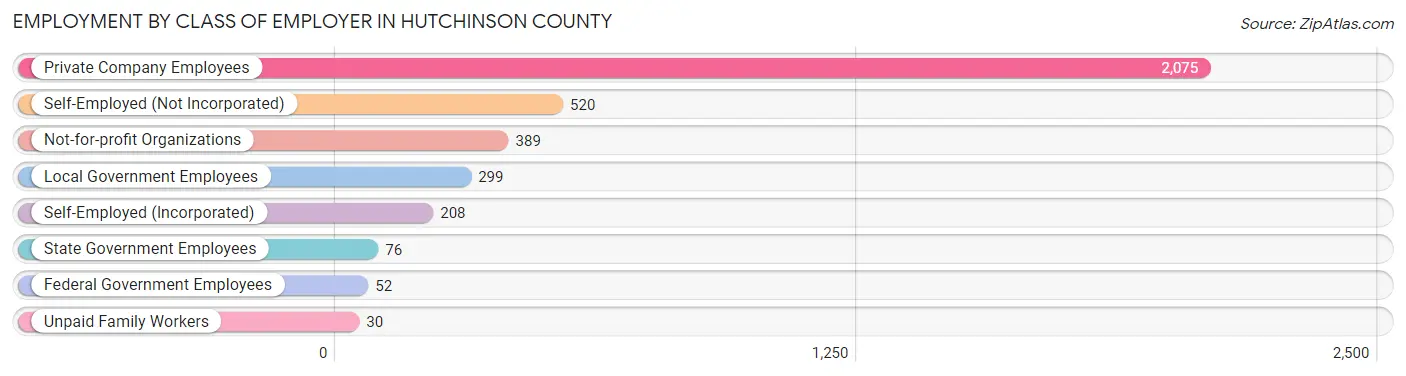
| Employer Class | # Employees | % Employees |
| Private Company Employees | 2,075 | 56.9% |
| Self-Employed (Incorporated) | 208 | 5.7% |
| Self-Employed (Not Incorporated) | 520 | 14.2% |
| Not-for-profit Organizations | 389 | 10.7% |
| Local Government Employees | 299 | 8.2% |
| State Government Employees | 76 | 2.1% |
| Federal Government Employees | 52 | 1.4% |
| Unpaid Family Workers | 30 | 0.8% |
| Total | 3,649 | 100.0% |
Employment Status by Age in Hutchinson County
According to the labor force statistics for Hutchinson County, out of the total population over 16 years of age (5,636), 66.8% or 3,765 individuals are in the labor force, with 1.5% or 56 of them unemployed. The age group with the highest labor force participation rate is 30 to 34 years, with 93.9% or 340 individuals in the labor force. Within the labor force, the 16 to 19 years age range has the highest percentage of unemployed individuals, with 5.4% or 9 of them being unemployed.
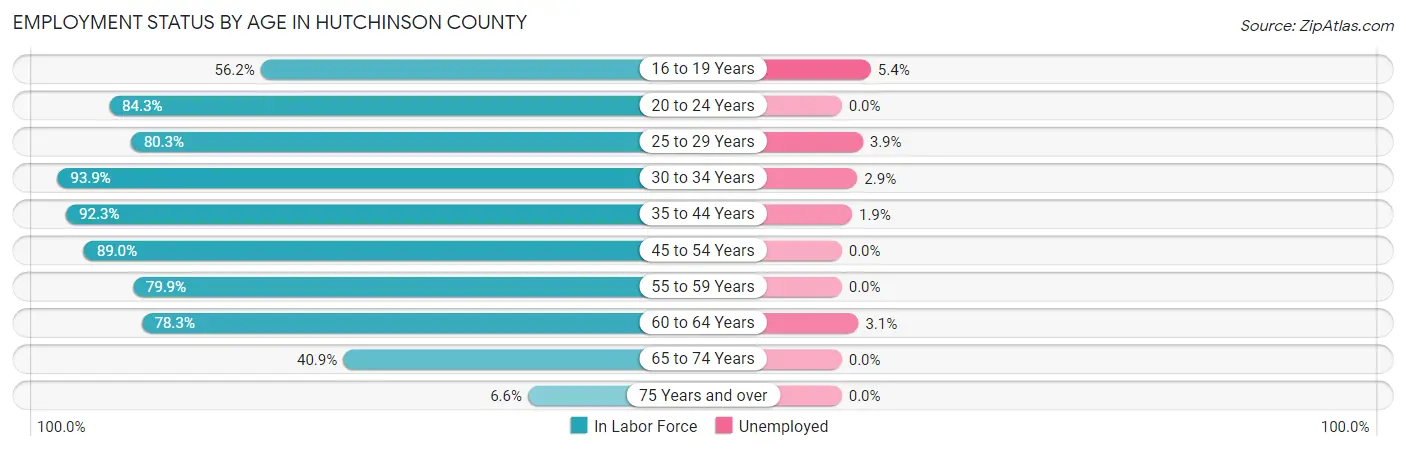
| Age Bracket | In Labor Force | Unemployed |
| 16 to 19 Years | 167 (56.2%) | 9 (5.4%) |
| 20 to 24 Years | 301 (84.3%) | 0 (0.0%) |
| 25 to 29 Years | 285 (80.3%) | 11 (3.9%) |
| 30 to 34 Years | 340 (93.9%) | 10 (2.9%) |
| 35 to 44 Years | 727 (92.3%) | 14 (1.9%) |
| 45 to 54 Years | 743 (89.0%) | 0 (0.0%) |
| 55 to 59 Years | 382 (79.9%) | 0 (0.0%) |
| 60 to 64 Years | 425 (78.3%) | 13 (3.1%) |
| 65 to 74 Years | 341 (40.9%) | 0 (0.0%) |
| 75 Years and over | 52 (6.6%) | 0 (0.0%) |
| Total | 3,765 (66.8%) | 56 (1.5%) |
Employment Status by Educational Attainment in Hutchinson County
According to labor force statistics for Hutchinson County, 86.3% of individuals (2,901) out of the total population between 25 and 64 years of age (3,361) are in the labor force, with 1.7% or 49 of them being unemployed. The group with the highest labor force participation rate are those with the educational attainment of bachelor's degree or higher, with 91.2% or 946 individuals in the labor force. Within the labor force, individuals with less than high school education have the highest percentage of unemployment, with 4.0% or 3 of them being unemployed.
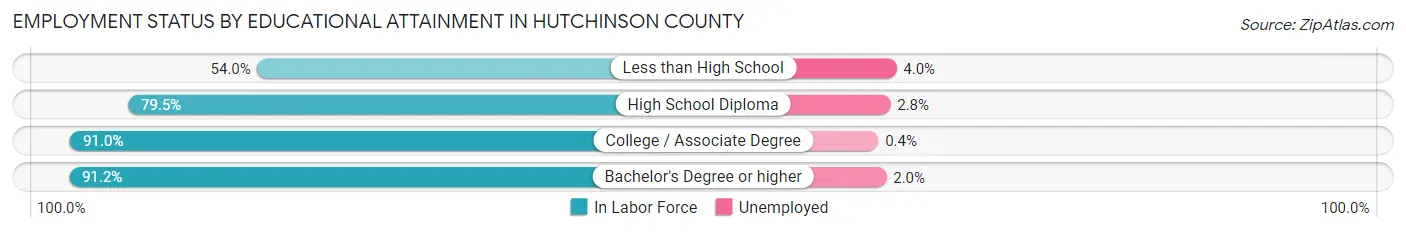
| Educational Attainment | In Labor Force | Unemployed |
| Less than High School | 75 (54.0%) | 6 (4.0%) |
| High School Diploma | 740 (79.5%) | 26 (2.8%) |
| College / Associate Degree | 1,141 (91.0%) | 5 (0.4%) |
| Bachelor's Degree or higher | 946 (91.2%) | 21 (2.0%) |
| Total | 2,901 (86.3%) | 57 (1.7%) |
Employment Occupations by Sex in Hutchinson County
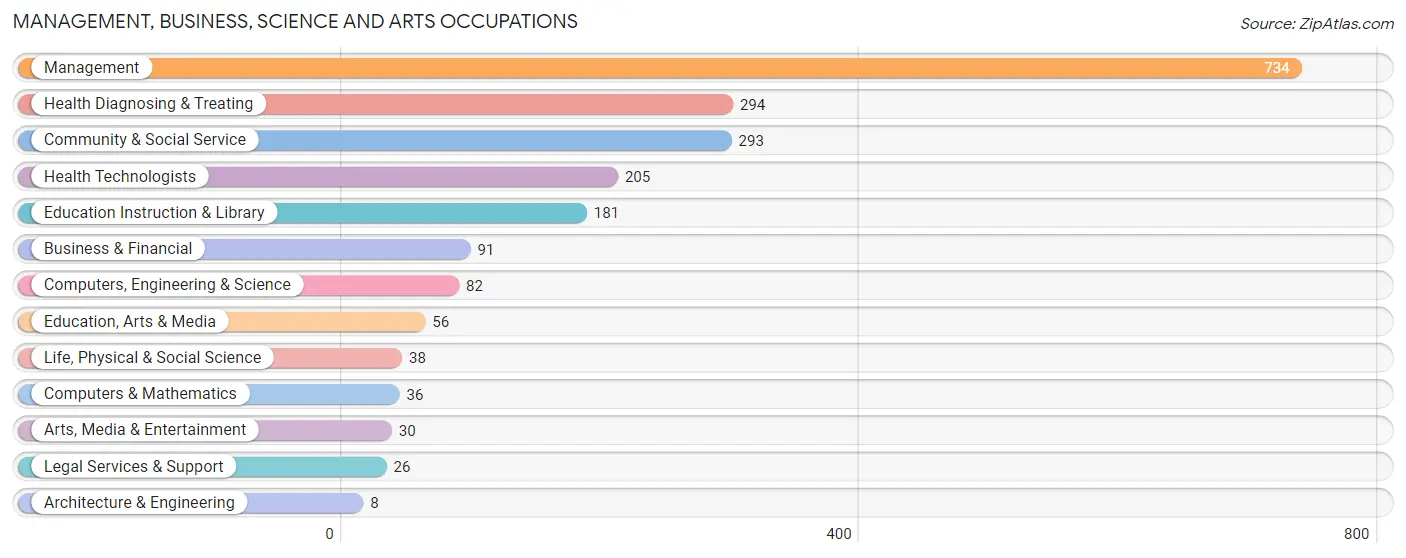
Management, Business, Science and Arts Occupations
The most common Management, Business, Science and Arts occupations in Hutchinson County are Management (734 | 19.8%), Health Diagnosing & Treating (294 | 7.9%), Community & Social Service (293 | 7.9%), Health Technologists (205 | 5.5%), and Education Instruction & Library (181 | 4.9%).
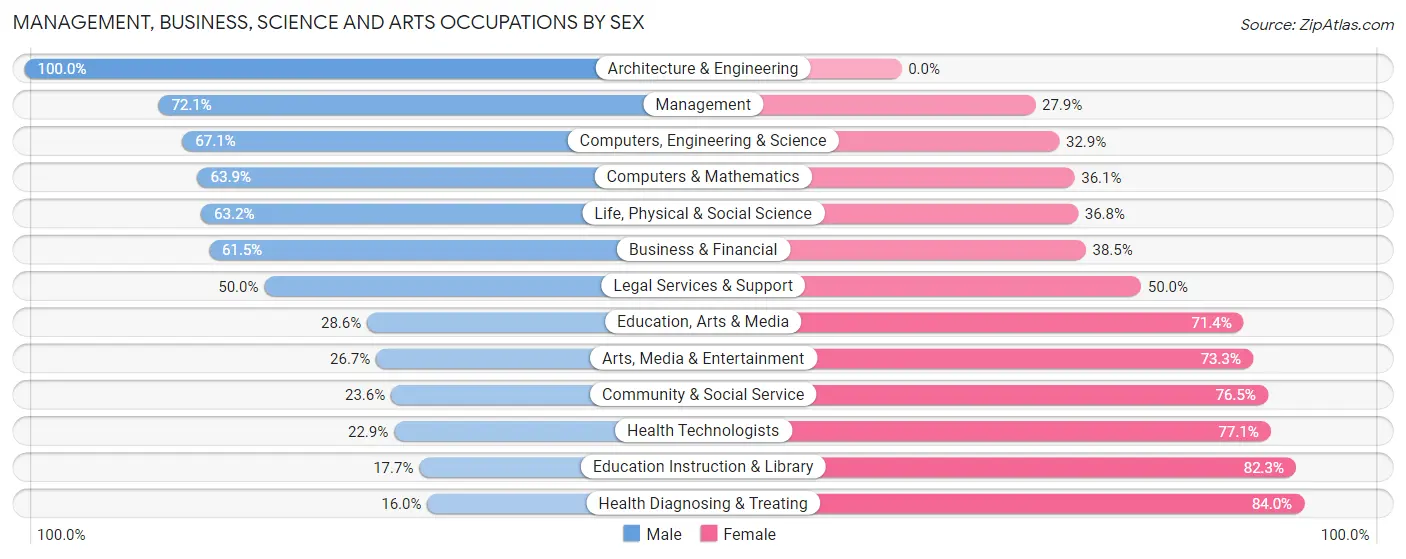
Management, Business, Science and Arts Occupations by Sex
Within the Management, Business, Science and Arts occupations in Hutchinson County, the most male-oriented occupations are Architecture & Engineering (100.0%), Management (72.1%), and Computers, Engineering & Science (67.1%), while the most female-oriented occupations are Health Diagnosing & Treating (84.0%), Education Instruction & Library (82.3%), and Health Technologists (77.1%).
| Occupation | Male | Female |
| Management | 529 (72.1%) | 205 (27.9%) |
| Business & Financial | 56 (61.5%) | 35 (38.5%) |
| Computers, Engineering & Science | 55 (67.1%) | 27 (32.9%) |
| Computers & Mathematics | 23 (63.9%) | 13 (36.1%) |
| Architecture & Engineering | 8 (100.0%) | 0 (0.0%) |
| Life, Physical & Social Science | 24 (63.2%) | 14 (36.8%) |
| Community & Social Service | 69 (23.5%) | 224 (76.4%) |
| Education, Arts & Media | 16 (28.6%) | 40 (71.4%) |
| Legal Services & Support | 13 (50.0%) | 13 (50.0%) |
| Education Instruction & Library | 32 (17.7%) | 149 (82.3%) |
| Arts, Media & Entertainment | 8 (26.7%) | 22 (73.3%) |
| Health Diagnosing & Treating | 47 (16.0%) | 247 (84.0%) |
| Health Technologists | 47 (22.9%) | 158 (77.1%) |
| Total (Category) | 756 (50.6%) | 738 (49.4%) |
| Total (Overall) | 1,934 (52.2%) | 1,772 (47.8%) |
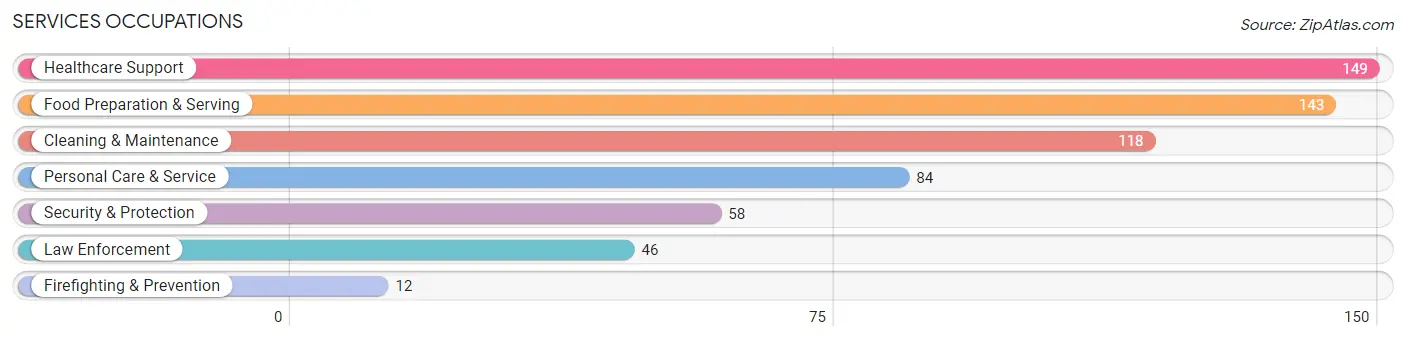
Services Occupations
The most common Services occupations in Hutchinson County are Healthcare Support (149 | 4.0%), Food Preparation & Serving (143 | 3.9%), Cleaning & Maintenance (118 | 3.2%), Personal Care & Service (84 | 2.3%), and Security & Protection (58 | 1.6%).
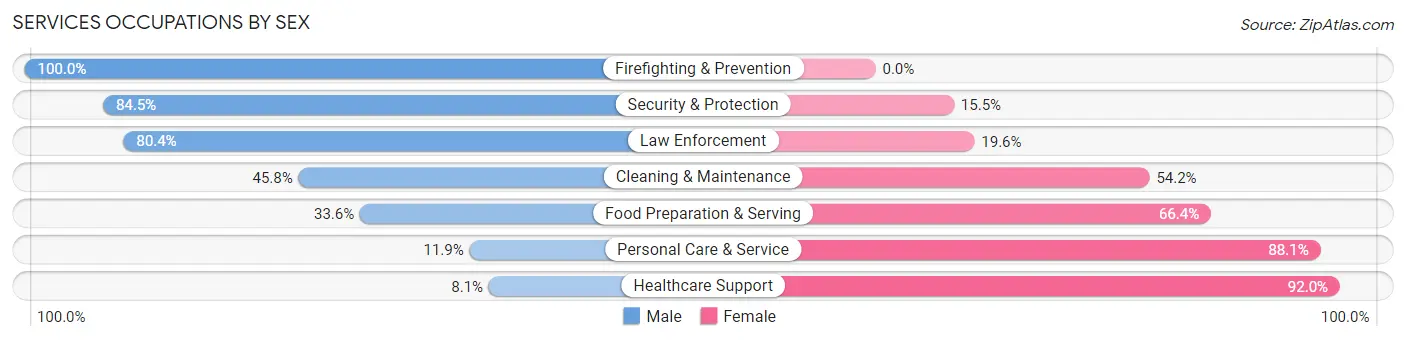
Services Occupations by Sex
Within the Services occupations in Hutchinson County, the most male-oriented occupations are Firefighting & Prevention (100.0%), Security & Protection (84.5%), and Law Enforcement (80.4%), while the most female-oriented occupations are Healthcare Support (91.9%), Personal Care & Service (88.1%), and Food Preparation & Serving (66.4%).
| Occupation | Male | Female |
| Healthcare Support | 12 (8.1%) | 137 (91.9%) |
| Security & Protection | 49 (84.5%) | 9 (15.5%) |
| Firefighting & Prevention | 12 (100.0%) | 0 (0.0%) |
| Law Enforcement | 37 (80.4%) | 9 (19.6%) |
| Food Preparation & Serving | 48 (33.6%) | 95 (66.4%) |
| Cleaning & Maintenance | 54 (45.8%) | 64 (54.2%) |
| Personal Care & Service | 10 (11.9%) | 74 (88.1%) |
| Total (Category) | 173 (31.3%) | 379 (68.7%) |
| Total (Overall) | 1,934 (52.2%) | 1,772 (47.8%) |
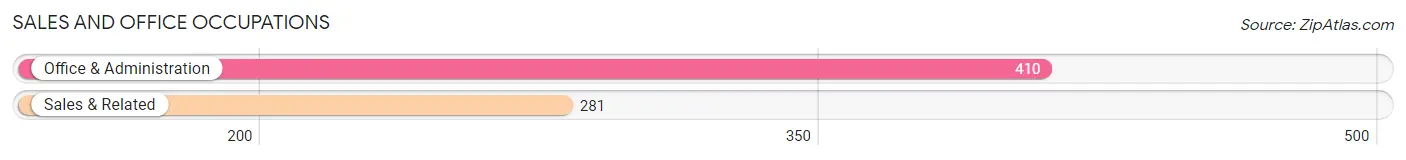
Sales and Office Occupations
The most common Sales and Office occupations in Hutchinson County are Office & Administration (410 | 11.1%), and Sales & Related (281 | 7.6%).
Sales and Office Occupations by Sex
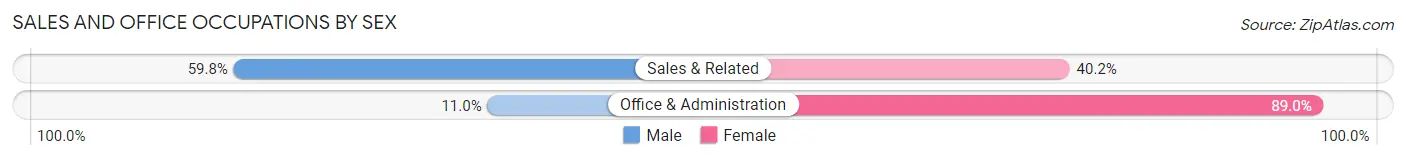
| Occupation | Male | Female |
| Sales & Related | 168 (59.8%) | 113 (40.2%) |
| Office & Administration | 45 (11.0%) | 365 (89.0%) |
| Total (Category) | 213 (30.8%) | 478 (69.2%) |
| Total (Overall) | 1,934 (52.2%) | 1,772 (47.8%) |
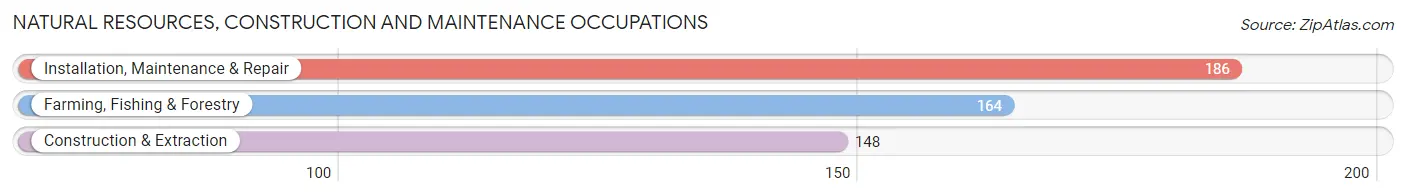
Natural Resources, Construction and Maintenance Occupations
The most common Natural Resources, Construction and Maintenance occupations in Hutchinson County are Installation, Maintenance & Repair (186 | 5.0%), Farming, Fishing & Forestry (164 | 4.4%), and Construction & Extraction (148 | 4.0%).
Natural Resources, Construction and Maintenance Occupations by Sex
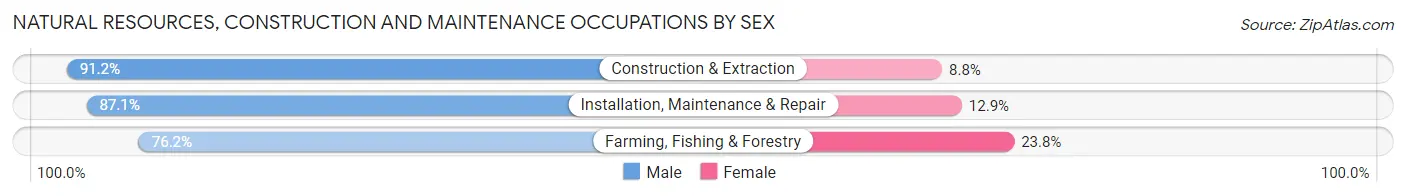
| Occupation | Male | Female |
| Farming, Fishing & Forestry | 125 (76.2%) | 39 (23.8%) |
| Construction & Extraction | 135 (91.2%) | 13 (8.8%) |
| Installation, Maintenance & Repair | 162 (87.1%) | 24 (12.9%) |
| Total (Category) | 422 (84.7%) | 76 (15.3%) |
| Total (Overall) | 1,934 (52.2%) | 1,772 (47.8%) |
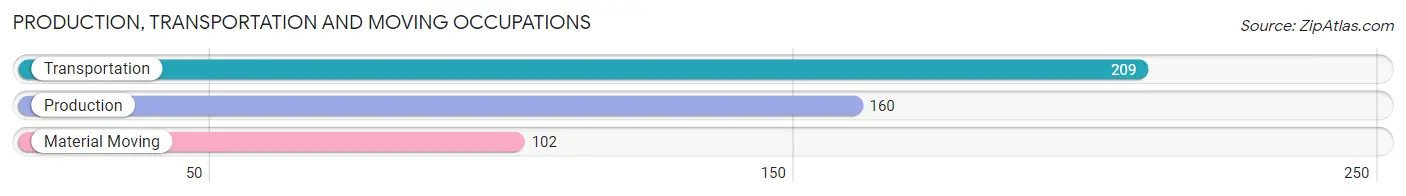
Production, Transportation and Moving Occupations
The most common Production, Transportation and Moving occupations in Hutchinson County are Transportation (209 | 5.6%), Production (160 | 4.3%), and Material Moving (102 | 2.8%).
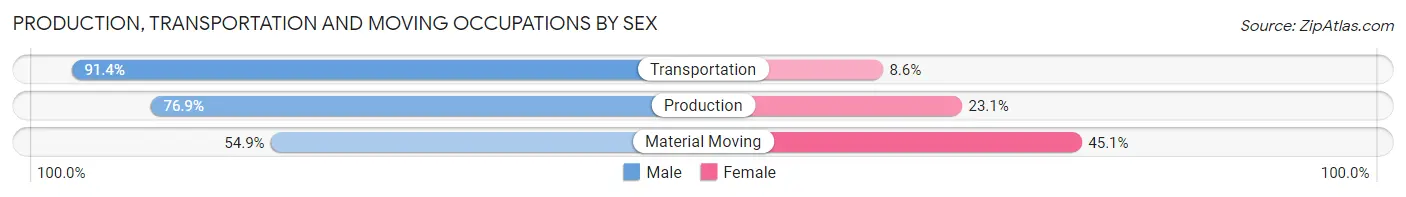
Production, Transportation and Moving Occupations by Sex
| Occupation | Male | Female |
| Production | 123 (76.9%) | 37 (23.1%) |
| Transportation | 191 (91.4%) | 18 (8.6%) |
| Material Moving | 56 (54.9%) | 46 (45.1%) |
| Total (Category) | 370 (78.6%) | 101 (21.4%) |
| Total (Overall) | 1,934 (52.2%) | 1,772 (47.8%) |
Employment Industries by Sex in Hutchinson County
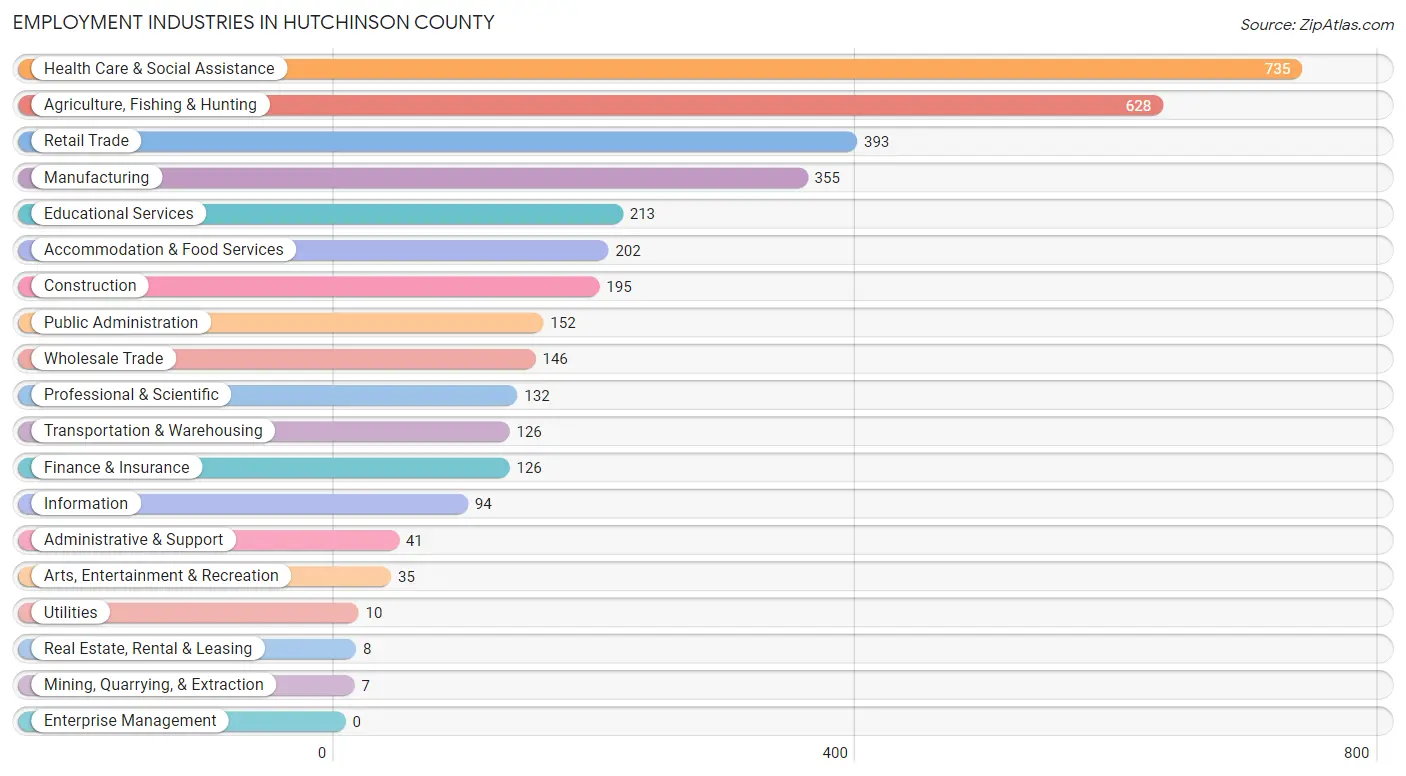
Employment Industries in Hutchinson County
The major employment industries in Hutchinson County include Health Care & Social Assistance (735 | 19.8%), Agriculture, Fishing & Hunting (628 | 17.0%), Retail Trade (393 | 10.6%), Manufacturing (355 | 9.6%), and Educational Services (213 | 5.8%).
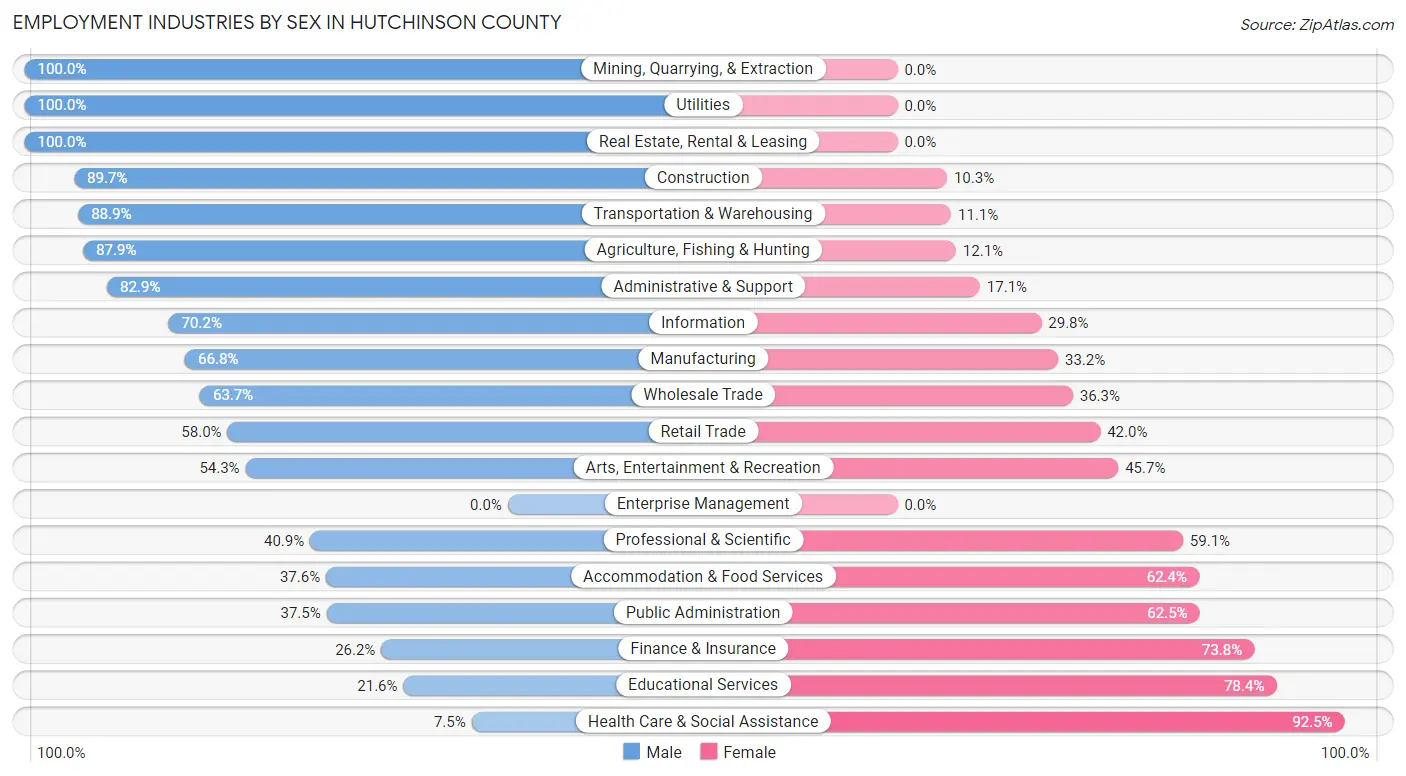
Employment Industries by Sex in Hutchinson County
The Hutchinson County industries that see more men than women are Mining, Quarrying, & Extraction (100.0%), Utilities (100.0%), and Real Estate, Rental & Leasing (100.0%), whereas the industries that tend to have a higher number of women are Health Care & Social Assistance (92.5%), Educational Services (78.4%), and Finance & Insurance (73.8%).
| Industry | Male | Female |
| Agriculture, Fishing & Hunting | 552 (87.9%) | 76 (12.1%) |
| Mining, Quarrying, & Extraction | 7 (100.0%) | 0 (0.0%) |
| Construction | 175 (89.7%) | 20 (10.3%) |
| Manufacturing | 237 (66.8%) | 118 (33.2%) |
| Wholesale Trade | 93 (63.7%) | 53 (36.3%) |
| Retail Trade | 228 (58.0%) | 165 (42.0%) |
| Transportation & Warehousing | 112 (88.9%) | 14 (11.1%) |
| Utilities | 10 (100.0%) | 0 (0.0%) |
| Information | 66 (70.2%) | 28 (29.8%) |
| Finance & Insurance | 33 (26.2%) | 93 (73.8%) |
| Real Estate, Rental & Leasing | 8 (100.0%) | 0 (0.0%) |
| Professional & Scientific | 54 (40.9%) | 78 (59.1%) |
| Enterprise Management | 0 (0.0%) | 0 (0.0%) |
| Administrative & Support | 34 (82.9%) | 7 (17.1%) |
| Educational Services | 46 (21.6%) | 167 (78.4%) |
| Health Care & Social Assistance | 55 (7.5%) | 680 (92.5%) |
| Arts, Entertainment & Recreation | 19 (54.3%) | 16 (45.7%) |
| Accommodation & Food Services | 76 (37.6%) | 126 (62.4%) |
| Public Administration | 57 (37.5%) | 95 (62.5%) |
| Total | 1,934 (52.2%) | 1,772 (47.8%) |
Education in Hutchinson County
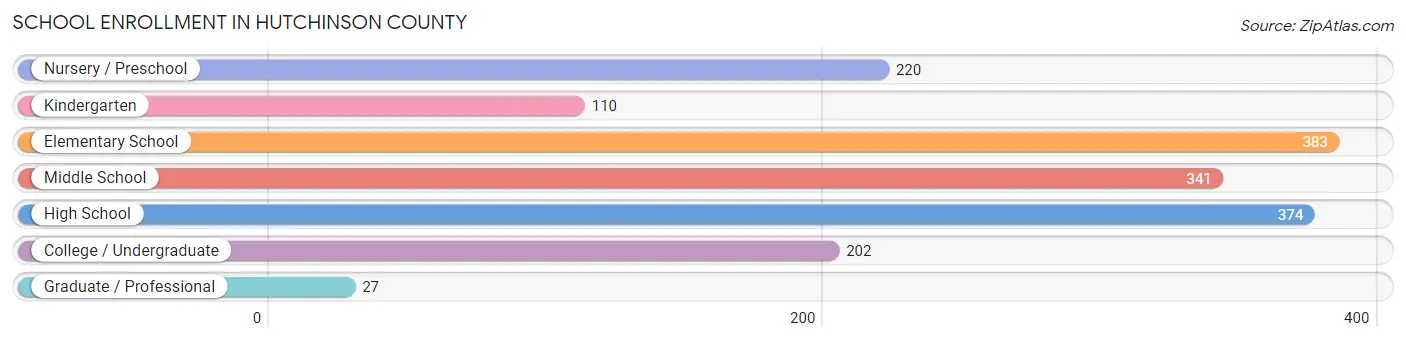
School Enrollment in Hutchinson County
The most common levels of schooling among the 1,657 students in Hutchinson County are elementary school (383 | 23.1%), high school (374 | 22.6%), and middle school (341 | 20.6%).
| School Level | # Students | % Students |
| Nursery / Preschool | 220 | 13.3% |
| Kindergarten | 110 | 6.6% |
| Elementary School | 383 | 23.1% |
| Middle School | 341 | 20.6% |
| High School | 374 | 22.6% |
| College / Undergraduate | 202 | 12.2% |
| Graduate / Professional | 27 | 1.6% |
| Total | 1,657 | 100.0% |
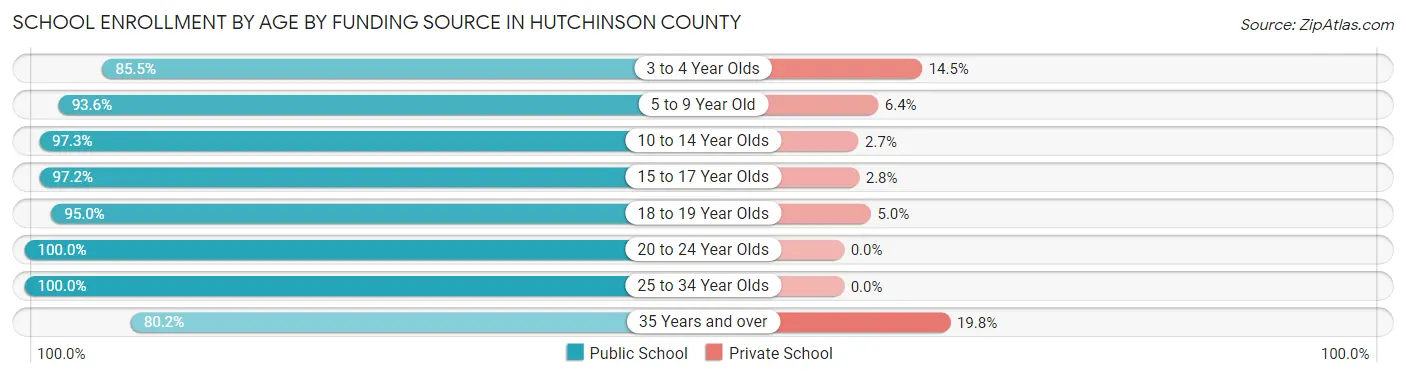
School Enrollment by Age by Funding Source in Hutchinson County
Out of a total of 1,657 students who are enrolled in schools in Hutchinson County, 94 (5.7%) attend a private institution, while the remaining 1,563 (94.3%) are enrolled in public schools. The age group of 35 years and over has the highest likelihood of being enrolled in private schools, with 20 (19.8% in the age bracket) enrolled. Conversely, the age group of 20 to 24 year olds has the lowest likelihood of being enrolled in a private school, with 121 (100.0% in the age bracket) attending a public institution.
| Age Bracket | Public School | Private School |
| 3 to 4 Year Olds | 100 (85.5%) | 17 (14.5%) |
| 5 to 9 Year Old | 486 (93.6%) | 33 (6.4%) |
| 10 to 14 Year Olds | 432 (97.3%) | 12 (2.7%) |
| 15 to 17 Year Olds | 242 (97.2%) | 7 (2.8%) |
| 18 to 19 Year Olds | 95 (95.0%) | 5 (5.0%) |
| 20 to 24 Year Olds | 121 (100.0%) | 0 (0.0%) |
| 25 to 34 Year Olds | 6 (100.0%) | 0 (0.0%) |
| 35 Years and over | 81 (80.2%) | 20 (19.8%) |
| Total | 1,563 (94.3%) | 94 (5.7%) |
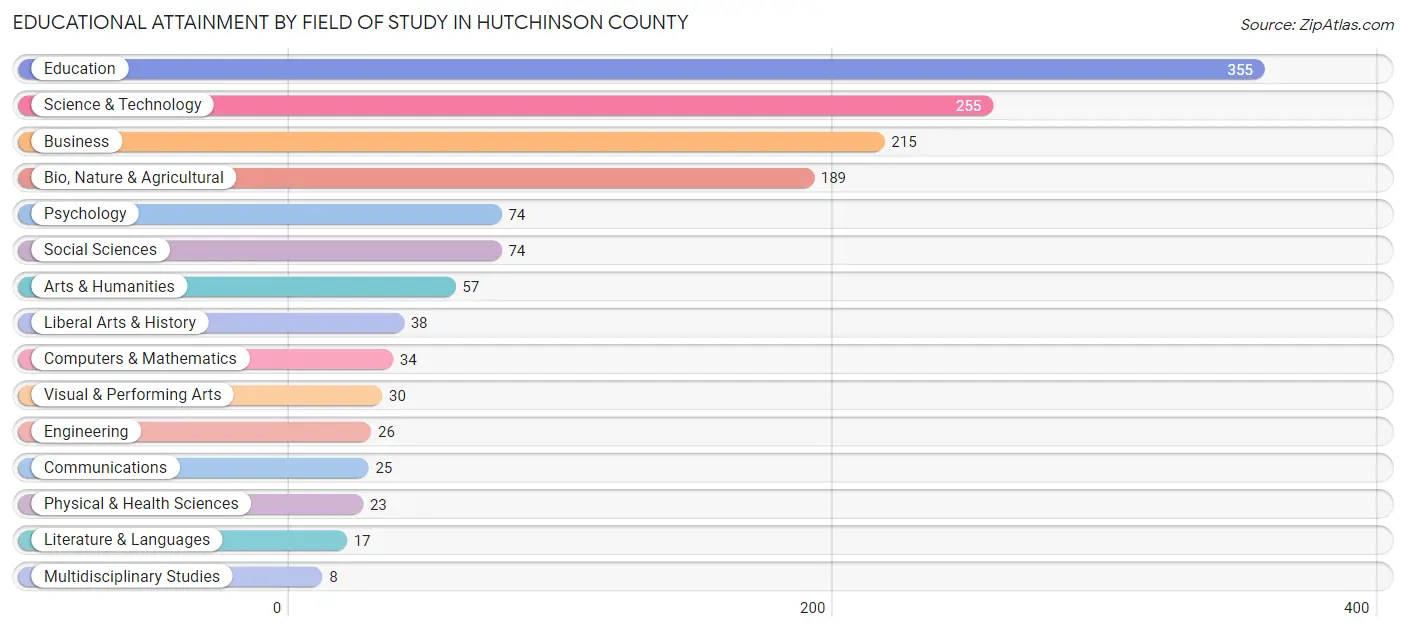
Educational Attainment by Field of Study in Hutchinson County
Education (355 | 25.0%), science & technology (255 | 18.0%), business (215 | 15.1%), bio, nature & agricultural (189 | 13.3%), and psychology (74 | 5.2%) are the most common fields of study among 1,420 individuals in Hutchinson County who have obtained a bachelor's degree or higher.
| Field of Study | # Graduates | % Graduates |
| Computers & Mathematics | 34 | 2.4% |
| Bio, Nature & Agricultural | 189 | 13.3% |
| Physical & Health Sciences | 23 | 1.6% |
| Psychology | 74 | 5.2% |
| Social Sciences | 74 | 5.2% |
| Engineering | 26 | 1.8% |
| Multidisciplinary Studies | 8 | 0.6% |
| Science & Technology | 255 | 18.0% |
| Business | 215 | 15.1% |
| Education | 355 | 25.0% |
| Literature & Languages | 17 | 1.2% |
| Liberal Arts & History | 38 | 2.7% |
| Visual & Performing Arts | 30 | 2.1% |
| Communications | 25 | 1.8% |
| Arts & Humanities | 57 | 4.0% |
| Total | 1,420 | 100.0% |
Transportation & Commute in Hutchinson County
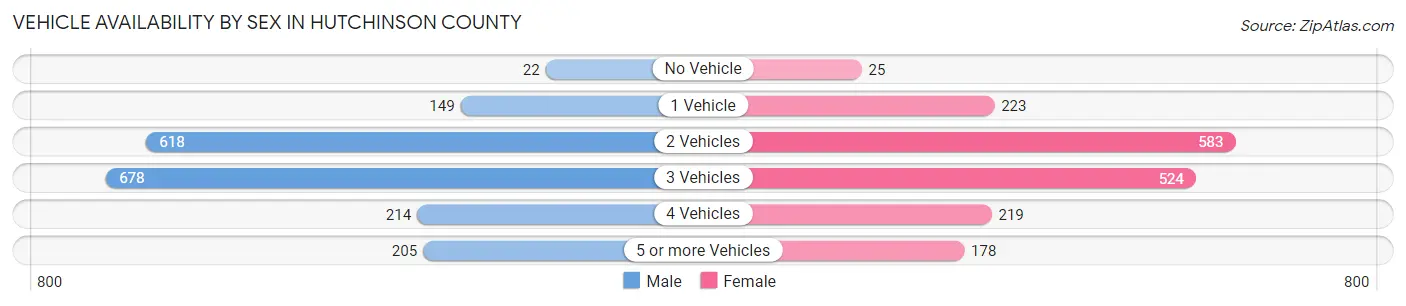
Vehicle Availability by Sex in Hutchinson County
The most prevalent vehicle ownership categories in Hutchinson County are males with 3 vehicles (678, accounting for 35.9%) and females with 3 vehicles (524, making up 38.7%).
| Vehicles Available | Male | Female |
| No Vehicle | 22 (1.2%) | 25 (1.4%) |
| 1 Vehicle | 149 (7.9%) | 223 (12.7%) |
| 2 Vehicles | 618 (32.8%) | 583 (33.3%) |
| 3 Vehicles | 678 (35.9%) | 524 (29.9%) |
| 4 Vehicles | 214 (11.4%) | 219 (12.5%) |
| 5 or more Vehicles | 205 (10.9%) | 178 (10.2%) |
| Total | 1,886 (100.0%) | 1,752 (100.0%) |
Commute Time in Hutchinson County
The most frequently occuring commute durations in Hutchinson County are less than 5 minutes (817 commuters, 24.2%), 5 to 9 minutes (699 commuters, 20.7%), and 15 to 19 minutes (406 commuters, 12.0%).
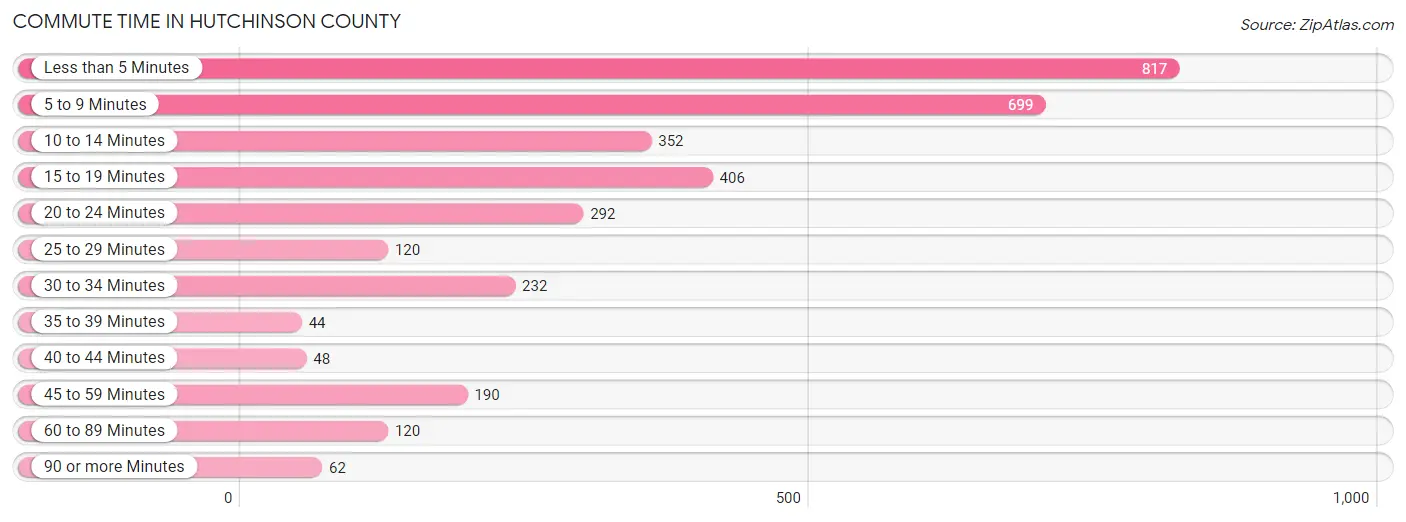
| Commute Time | # Commuters | % Commuters |
| Less than 5 Minutes | 817 | 24.2% |
| 5 to 9 Minutes | 699 | 20.7% |
| 10 to 14 Minutes | 352 | 10.4% |
| 15 to 19 Minutes | 406 | 12.0% |
| 20 to 24 Minutes | 292 | 8.6% |
| 25 to 29 Minutes | 120 | 3.5% |
| 30 to 34 Minutes | 232 | 6.9% |
| 35 to 39 Minutes | 44 | 1.3% |
| 40 to 44 Minutes | 48 | 1.4% |
| 45 to 59 Minutes | 190 | 5.6% |
| 60 to 89 Minutes | 120 | 3.5% |
| 90 or more Minutes | 62 | 1.8% |
Commute Time by Sex in Hutchinson County
The most common commute times in Hutchinson County are less than 5 minutes (462 commuters, 27.1%) for males and less than 5 minutes (355 commuters, 21.2%) for females.
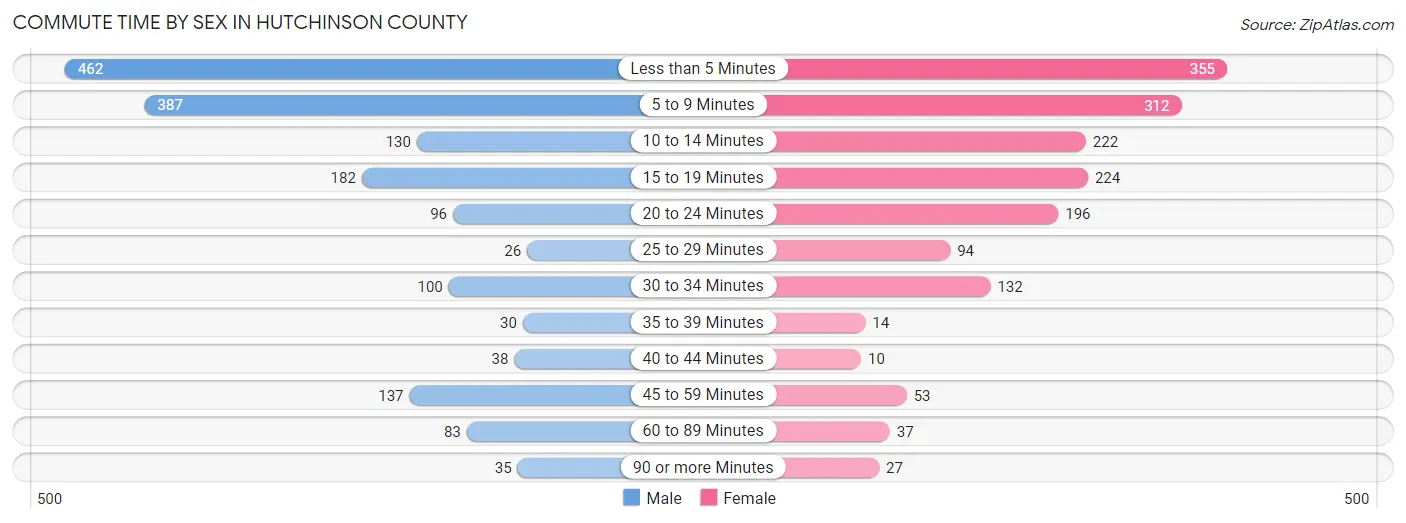
| Commute Time | Male | Female |
| Less than 5 Minutes | 462 (27.1%) | 355 (21.2%) |
| 5 to 9 Minutes | 387 (22.7%) | 312 (18.6%) |
| 10 to 14 Minutes | 130 (7.6%) | 222 (13.3%) |
| 15 to 19 Minutes | 182 (10.7%) | 224 (13.4%) |
| 20 to 24 Minutes | 96 (5.6%) | 196 (11.7%) |
| 25 to 29 Minutes | 26 (1.5%) | 94 (5.6%) |
| 30 to 34 Minutes | 100 (5.9%) | 132 (7.9%) |
| 35 to 39 Minutes | 30 (1.8%) | 14 (0.8%) |
| 40 to 44 Minutes | 38 (2.2%) | 10 (0.6%) |
| 45 to 59 Minutes | 137 (8.0%) | 53 (3.2%) |
| 60 to 89 Minutes | 83 (4.9%) | 37 (2.2%) |
| 90 or more Minutes | 35 (2.1%) | 27 (1.6%) |
Time of Departure to Work by Sex in Hutchinson County
The most frequent times of departure to work in Hutchinson County are 7:30 AM to 7:59 AM (334, 19.6%) for males and 7:30 AM to 7:59 AM (458, 27.3%) for females.
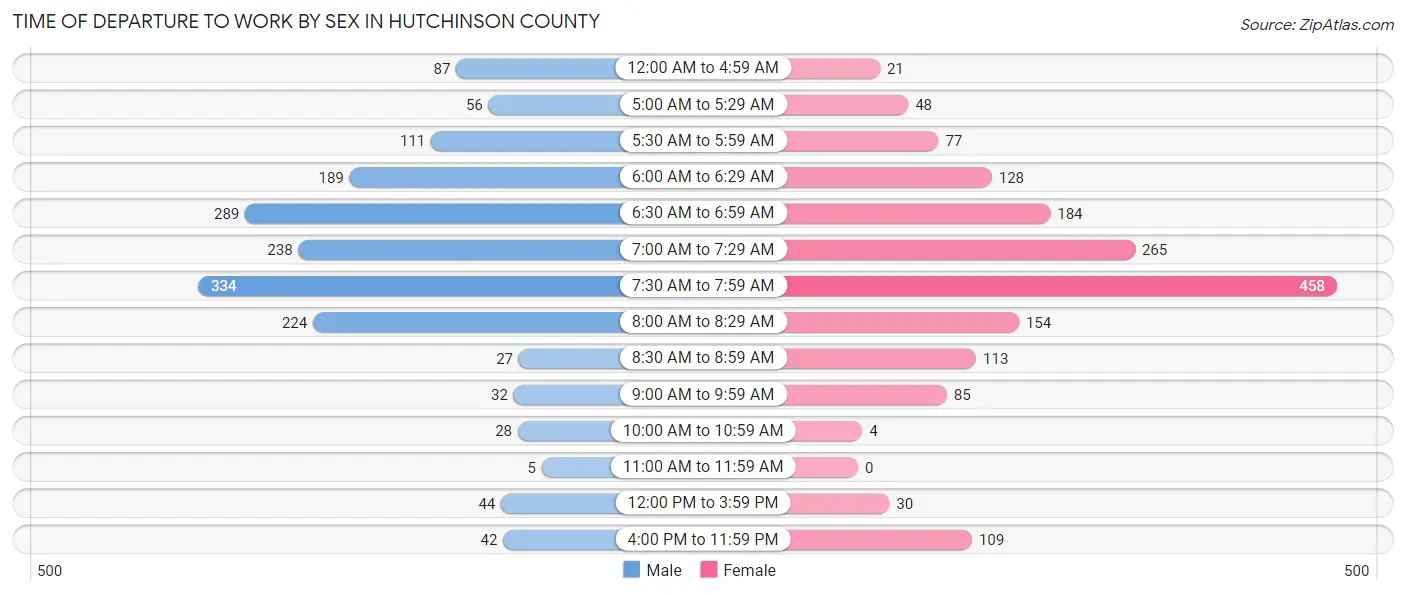
| Time of Departure | Male | Female |
| 12:00 AM to 4:59 AM | 87 (5.1%) | 21 (1.3%) |
| 5:00 AM to 5:29 AM | 56 (3.3%) | 48 (2.9%) |
| 5:30 AM to 5:59 AM | 111 (6.5%) | 77 (4.6%) |
| 6:00 AM to 6:29 AM | 189 (11.1%) | 128 (7.6%) |
| 6:30 AM to 6:59 AM | 289 (16.9%) | 184 (11.0%) |
| 7:00 AM to 7:29 AM | 238 (14.0%) | 265 (15.8%) |
| 7:30 AM to 7:59 AM | 334 (19.6%) | 458 (27.3%) |
| 8:00 AM to 8:29 AM | 224 (13.1%) | 154 (9.2%) |
| 8:30 AM to 8:59 AM | 27 (1.6%) | 113 (6.7%) |
| 9:00 AM to 9:59 AM | 32 (1.9%) | 85 (5.1%) |
| 10:00 AM to 10:59 AM | 28 (1.6%) | 4 (0.2%) |
| 11:00 AM to 11:59 AM | 5 (0.3%) | 0 (0.0%) |
| 12:00 PM to 3:59 PM | 44 (2.6%) | 30 (1.8%) |
| 4:00 PM to 11:59 PM | 42 (2.5%) | 109 (6.5%) |
| Total | 1,706 (100.0%) | 1,676 (100.0%) |
Housing Occupancy in Hutchinson County
Occupancy by Ownership in Hutchinson County
Of the total 2,931 dwellings in Hutchinson County, owner-occupied units account for 2,248 (76.7%), while renter-occupied units make up 683 (23.3%).
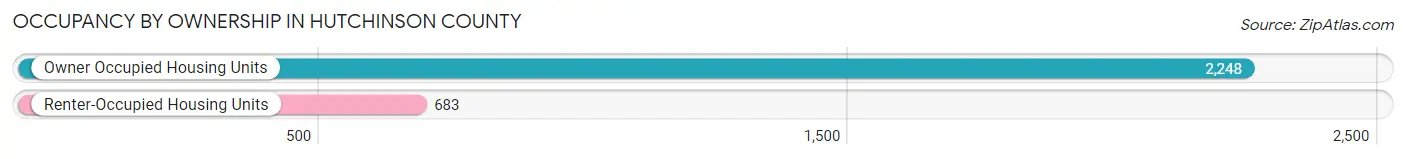
| Occupancy | # Housing Units | % Housing Units |
| Owner Occupied Housing Units | 2,248 | 76.7% |
| Renter-Occupied Housing Units | 683 | 23.3% |
| Total Occupied Housing Units | 2,931 | 100.0% |
Occupancy by Household Size in Hutchinson County
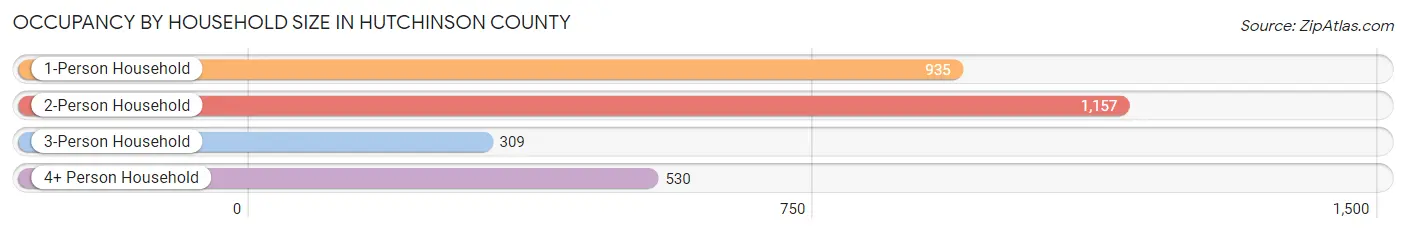
| Household Size | # Housing Units | % Housing Units |
| 1-Person Household | 935 | 31.9% |
| 2-Person Household | 1,157 | 39.5% |
| 3-Person Household | 309 | 10.5% |
| 4+ Person Household | 530 | 18.1% |
| Total Housing Units | 2,931 | 100.0% |
Occupancy by Ownership by Household Size in Hutchinson County
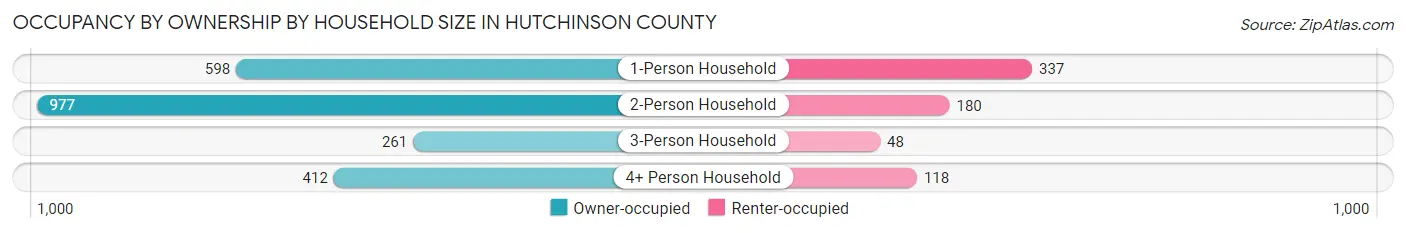
| Household Size | Owner-occupied | Renter-occupied |
| 1-Person Household | 598 (64.0%) | 337 (36.0%) |
| 2-Person Household | 977 (84.4%) | 180 (15.6%) |
| 3-Person Household | 261 (84.5%) | 48 (15.5%) |
| 4+ Person Household | 412 (77.7%) | 118 (22.3%) |
| Total Housing Units | 2,248 (76.7%) | 683 (23.3%) |
Occupancy by Educational Attainment in Hutchinson County
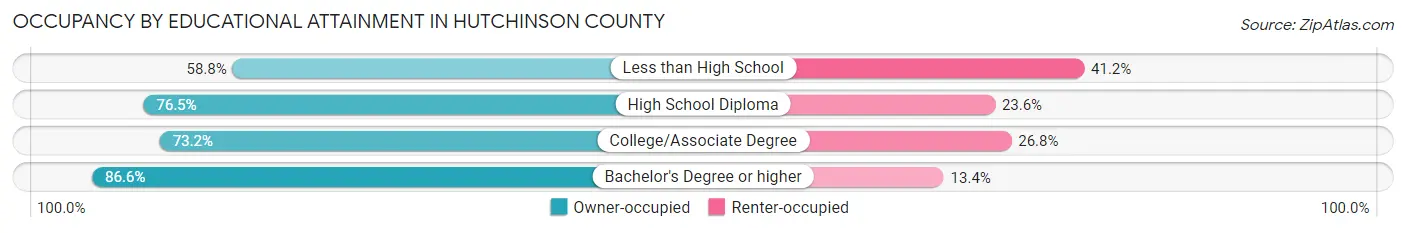
| Household Size | Owner-occupied | Renter-occupied |
| Less than High School | 124 (58.8%) | 87 (41.2%) |
| High School Diploma | 672 (76.4%) | 207 (23.5%) |
| College/Associate Degree | 779 (73.2%) | 285 (26.8%) |
| Bachelor's Degree or higher | 673 (86.6%) | 104 (13.4%) |
Occupancy by Age of Householder in Hutchinson County
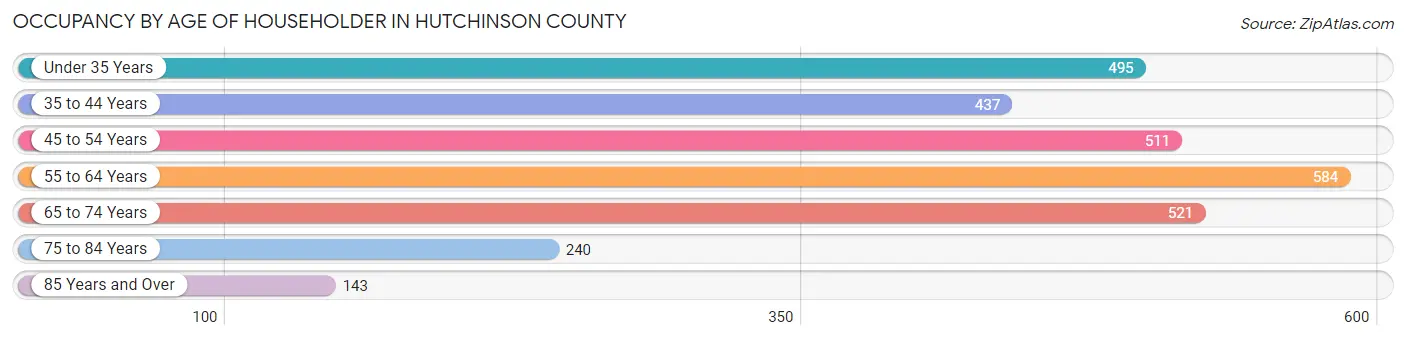
| Age Bracket | # Households | % Households |
| Under 35 Years | 495 | 16.9% |
| 35 to 44 Years | 437 | 14.9% |
| 45 to 54 Years | 511 | 17.4% |
| 55 to 64 Years | 584 | 19.9% |
| 65 to 74 Years | 521 | 17.8% |
| 75 to 84 Years | 240 | 8.2% |
| 85 Years and Over | 143 | 4.9% |
| Total | 2,931 | 100.0% |
Housing Finances in Hutchinson County
Median Income by Occupancy in Hutchinson County
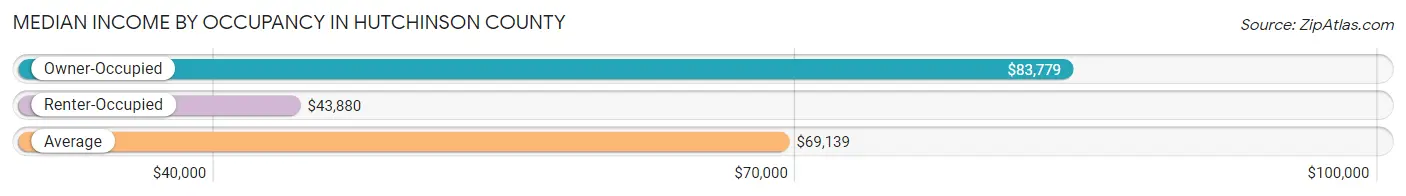
| Occupancy Type | # Households | Median Income |
| Owner-Occupied | 2,248 (76.7%) | $83,779 |
| Renter-Occupied | 683 (23.3%) | $43,880 |
| Average | 2,931 (100.0%) | $69,139 |
Occupancy by Householder Income Bracket in Hutchinson County
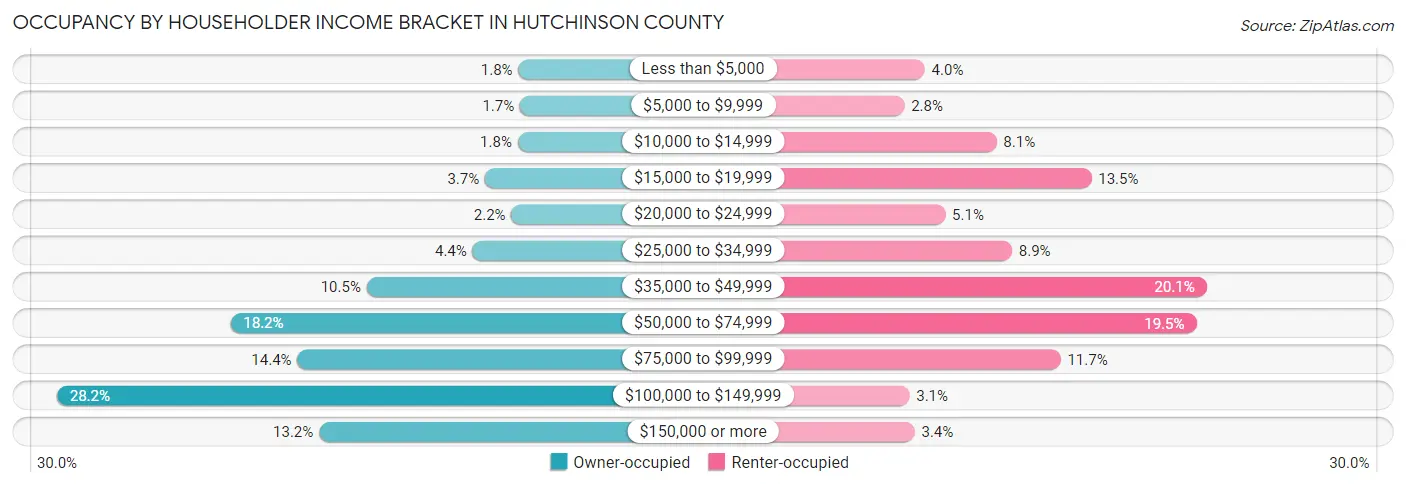
| Income Bracket | Owner-occupied | Renter-occupied |
| Less than $5,000 | 40 (1.8%) | 27 (4.0%) |
| $5,000 to $9,999 | 38 (1.7%) | 19 (2.8%) |
| $10,000 to $14,999 | 41 (1.8%) | 55 (8.1%) |
| $15,000 to $19,999 | 83 (3.7%) | 92 (13.5%) |
| $20,000 to $24,999 | 49 (2.2%) | 35 (5.1%) |
| $25,000 to $34,999 | 99 (4.4%) | 61 (8.9%) |
| $35,000 to $49,999 | 235 (10.4%) | 137 (20.1%) |
| $50,000 to $74,999 | 410 (18.2%) | 133 (19.5%) |
| $75,000 to $99,999 | 324 (14.4%) | 80 (11.7%) |
| $100,000 to $149,999 | 633 (28.2%) | 21 (3.1%) |
| $150,000 or more | 296 (13.2%) | 23 (3.4%) |
| Total | 2,248 (100.0%) | 683 (100.0%) |
Monthly Housing Cost Tiers in Hutchinson County
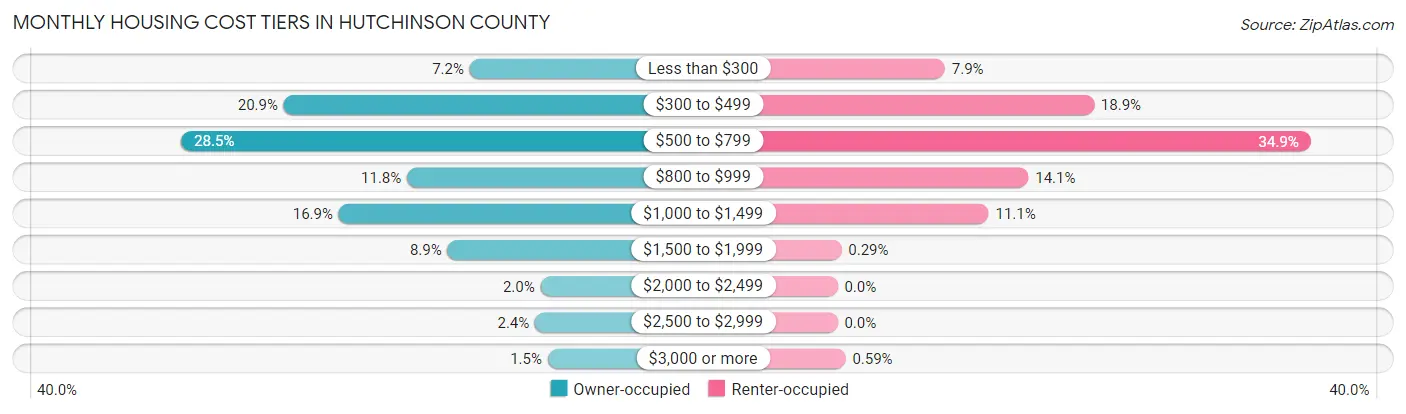
| Monthly Cost | Owner-occupied | Renter-occupied |
| Less than $300 | 162 (7.2%) | 54 (7.9%) |
| $300 to $499 | 470 (20.9%) | 129 (18.9%) |
| $500 to $799 | 640 (28.5%) | 238 (34.8%) |
| $800 to $999 | 266 (11.8%) | 96 (14.1%) |
| $1,000 to $1,499 | 379 (16.9%) | 76 (11.1%) |
| $1,500 to $1,999 | 199 (8.8%) | 2 (0.3%) |
| $2,000 to $2,499 | 45 (2.0%) | 0 (0.0%) |
| $2,500 to $2,999 | 54 (2.4%) | 0 (0.0%) |
| $3,000 or more | 33 (1.5%) | 4 (0.6%) |
| Total | 2,248 (100.0%) | 683 (100.0%) |
Physical Housing Characteristics in Hutchinson County
Housing Structures in Hutchinson County
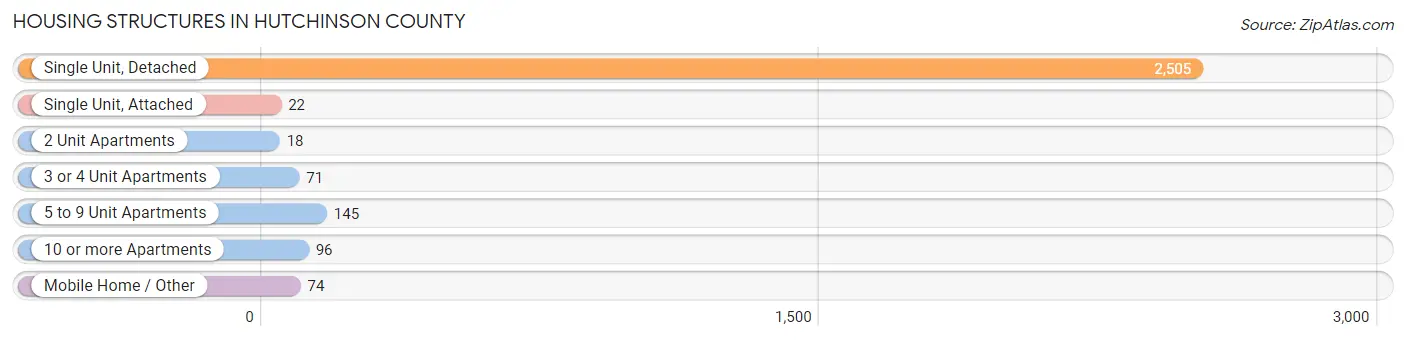
| Structure Type | # Housing Units | % Housing Units |
| Single Unit, Detached | 2,505 | 85.5% |
| Single Unit, Attached | 22 | 0.7% |
| 2 Unit Apartments | 18 | 0.6% |
| 3 or 4 Unit Apartments | 71 | 2.4% |
| 5 to 9 Unit Apartments | 145 | 5.0% |
| 10 or more Apartments | 96 | 3.3% |
| Mobile Home / Other | 74 | 2.5% |
| Total | 2,931 | 100.0% |
Housing Structures by Occupancy in Hutchinson County
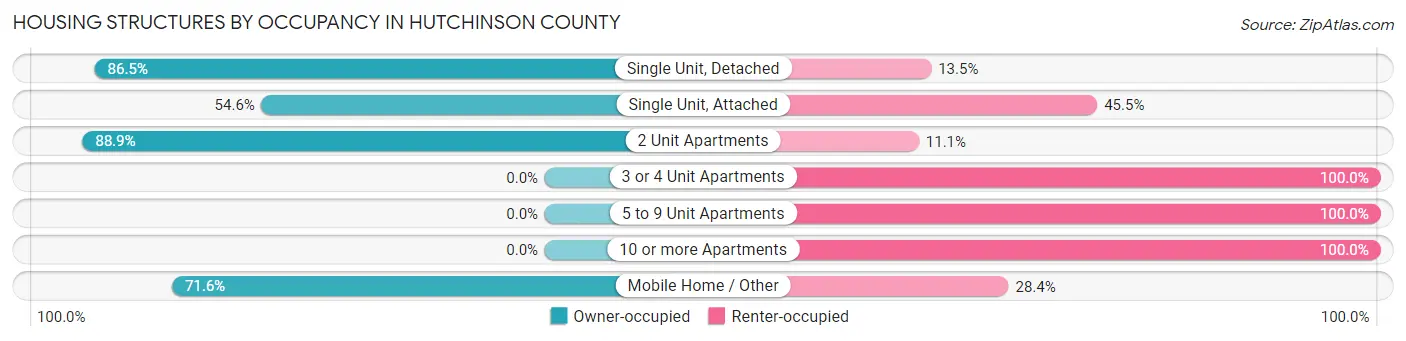
| Structure Type | Owner-occupied | Renter-occupied |
| Single Unit, Detached | 2,167 (86.5%) | 338 (13.5%) |
| Single Unit, Attached | 12 (54.5%) | 10 (45.5%) |
| 2 Unit Apartments | 16 (88.9%) | 2 (11.1%) |
| 3 or 4 Unit Apartments | 0 (0.0%) | 71 (100.0%) |
| 5 to 9 Unit Apartments | 0 (0.0%) | 145 (100.0%) |
| 10 or more Apartments | 0 (0.0%) | 96 (100.0%) |
| Mobile Home / Other | 53 (71.6%) | 21 (28.4%) |
| Total | 2,248 (76.7%) | 683 (23.3%) |
Housing Structures by Number of Rooms in Hutchinson County
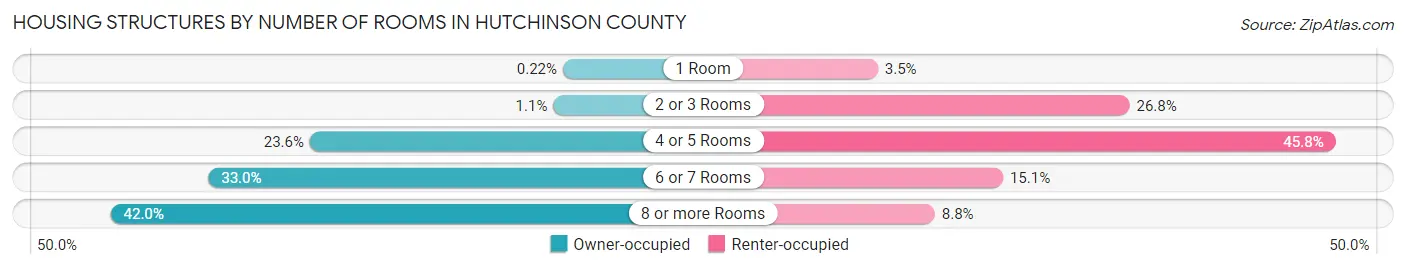
| Number of Rooms | Owner-occupied | Renter-occupied |
| 1 Room | 5 (0.2%) | 24 (3.5%) |
| 2 or 3 Rooms | 25 (1.1%) | 183 (26.8%) |
| 4 or 5 Rooms | 531 (23.6%) | 313 (45.8%) |
| 6 or 7 Rooms | 742 (33.0%) | 103 (15.1%) |
| 8 or more Rooms | 945 (42.0%) | 60 (8.8%) |
| Total | 2,248 (100.0%) | 683 (100.0%) |
Housing Structure by Heating Type in Hutchinson County
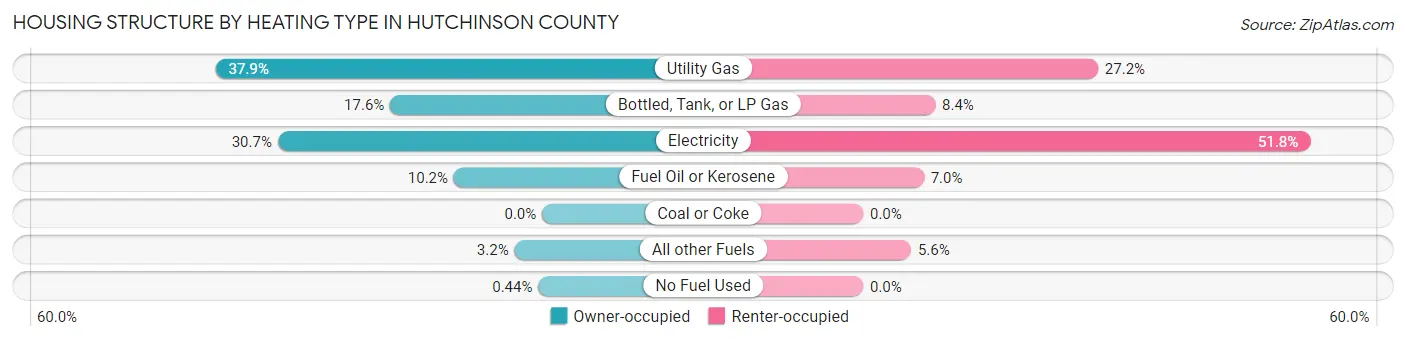
| Heating Type | Owner-occupied | Renter-occupied |
| Utility Gas | 851 (37.9%) | 186 (27.2%) |
| Bottled, Tank, or LP Gas | 396 (17.6%) | 57 (8.4%) |
| Electricity | 689 (30.6%) | 354 (51.8%) |
| Fuel Oil or Kerosene | 230 (10.2%) | 48 (7.0%) |
| Coal or Coke | 0 (0.0%) | 0 (0.0%) |
| All other Fuels | 72 (3.2%) | 38 (5.6%) |
| No Fuel Used | 10 (0.4%) | 0 (0.0%) |
| Total | 2,248 (100.0%) | 683 (100.0%) |
Household Vehicle Usage in Hutchinson County
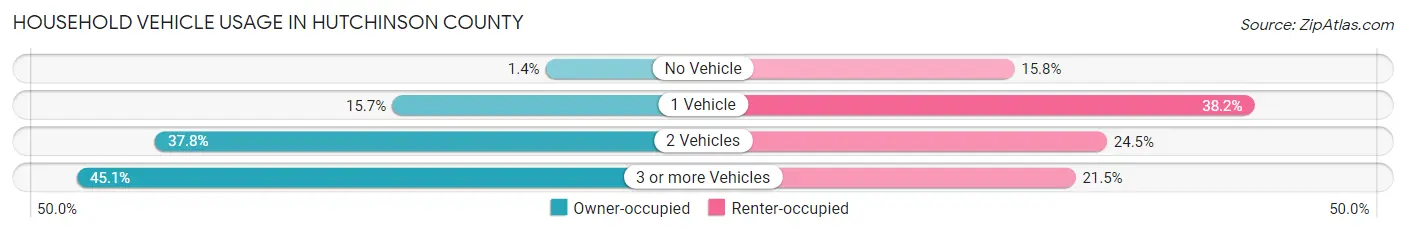
| Vehicles per Household | Owner-occupied | Renter-occupied |
| No Vehicle | 31 (1.4%) | 108 (15.8%) |
| 1 Vehicle | 353 (15.7%) | 261 (38.2%) |
| 2 Vehicles | 850 (37.8%) | 167 (24.4%) |
| 3 or more Vehicles | 1,014 (45.1%) | 147 (21.5%) |
| Total | 2,248 (100.0%) | 683 (100.0%) |
Real Estate & Mortgages in Hutchinson County
Real Estate and Mortgage Overview in Hutchinson County
| Characteristic | Without Mortgage | With Mortgage |
| Housing Units | 1,326 | 922 |
| Median Property Value | $130,500 | $167,400 |
| Median Household Income | $71,806 | $119 |
| Monthly Housing Costs | $519 | $33 |
| Real Estate Taxes | $1,636 | $20 |
Property Value by Mortgage Status in Hutchinson County
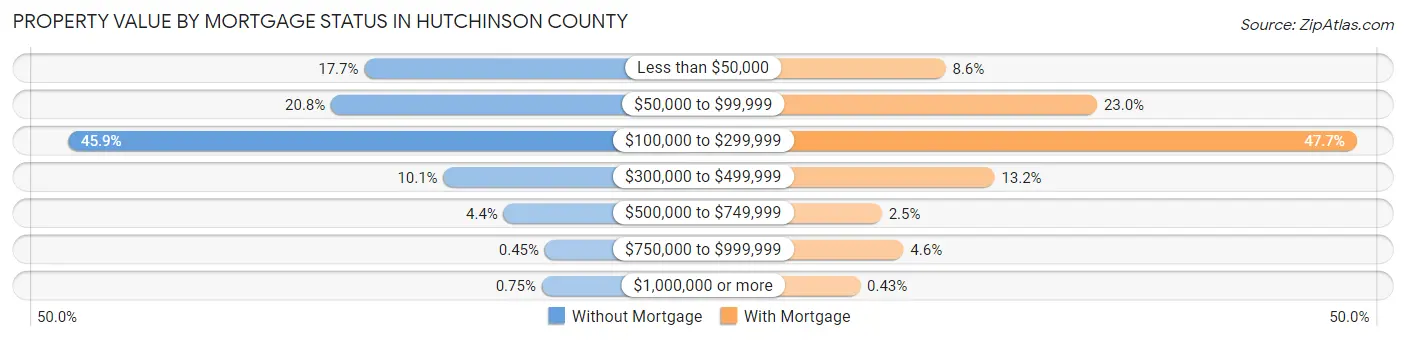
| Property Value | Without Mortgage | With Mortgage |
| Less than $50,000 | 234 (17.6%) | 79 (8.6%) |
| $50,000 to $99,999 | 276 (20.8%) | 212 (23.0%) |
| $100,000 to $299,999 | 608 (45.9%) | 440 (47.7%) |
| $300,000 to $499,999 | 134 (10.1%) | 122 (13.2%) |
| $500,000 to $749,999 | 58 (4.4%) | 23 (2.5%) |
| $750,000 to $999,999 | 6 (0.4%) | 42 (4.6%) |
| $1,000,000 or more | 10 (0.7%) | 4 (0.4%) |
| Total | 1,326 (100.0%) | 922 (100.0%) |
Household Income by Mortgage Status in Hutchinson County
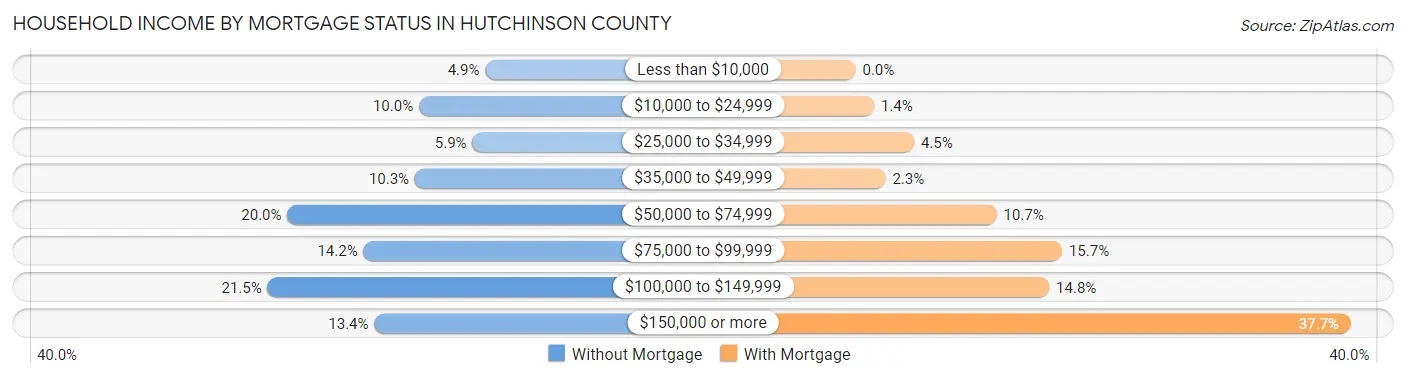
| Household Income | Without Mortgage | With Mortgage |
| Less than $10,000 | 65 (4.9%) | 0 (0.0%) |
| $10,000 to $24,999 | 132 (10.0%) | 13 (1.4%) |
| $25,000 to $34,999 | 78 (5.9%) | 41 (4.4%) |
| $35,000 to $49,999 | 136 (10.3%) | 21 (2.3%) |
| $50,000 to $74,999 | 265 (20.0%) | 99 (10.7%) |
| $75,000 to $99,999 | 188 (14.2%) | 145 (15.7%) |
| $100,000 to $149,999 | 285 (21.5%) | 136 (14.7%) |
| $150,000 or more | 177 (13.4%) | 348 (37.7%) |
| Total | 1,326 (100.0%) | 922 (100.0%) |
Property Value to Household Income Ratio in Hutchinson County
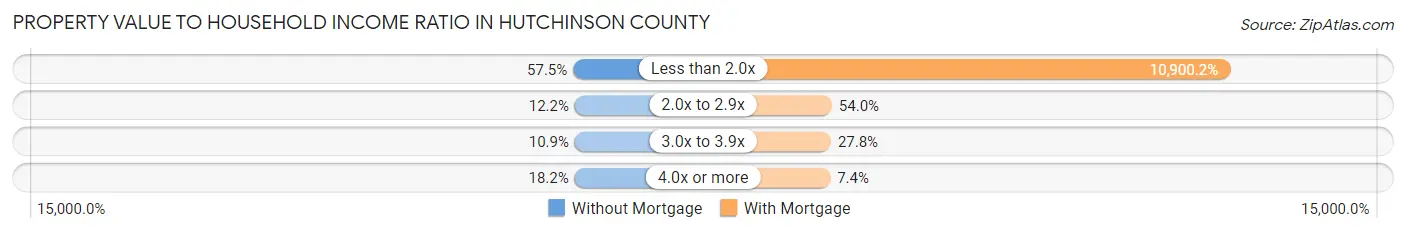
| Value-to-Income Ratio | Without Mortgage | With Mortgage |
| Less than 2.0x | 762 (57.5%) | 100,500 (10,900.2%) |
| 2.0x to 2.9x | 162 (12.2%) | 498 (54.0%) |
| 3.0x to 3.9x | 145 (10.9%) | 256 (27.8%) |
| 4.0x or more | 241 (18.2%) | 68 (7.4%) |
| Total | 1,326 (100.0%) | 922 (100.0%) |
Real Estate Taxes by Mortgage Status in Hutchinson County
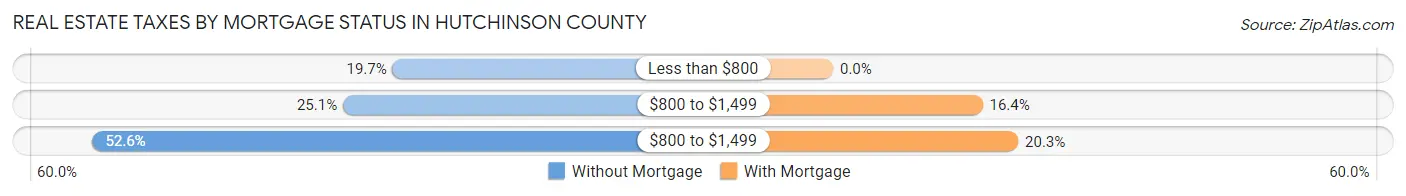
| Property Taxes | Without Mortgage | With Mortgage |
| Less than $800 | 261 (19.7%) | 0 (0.0%) |
| $800 to $1,499 | 333 (25.1%) | 151 (16.4%) |
| $800 to $1,499 | 697 (52.6%) | 187 (20.3%) |
| Total | 1,326 (100.0%) | 922 (100.0%) |
Health & Disability in Hutchinson County
Health Insurance Coverage by Age in Hutchinson County
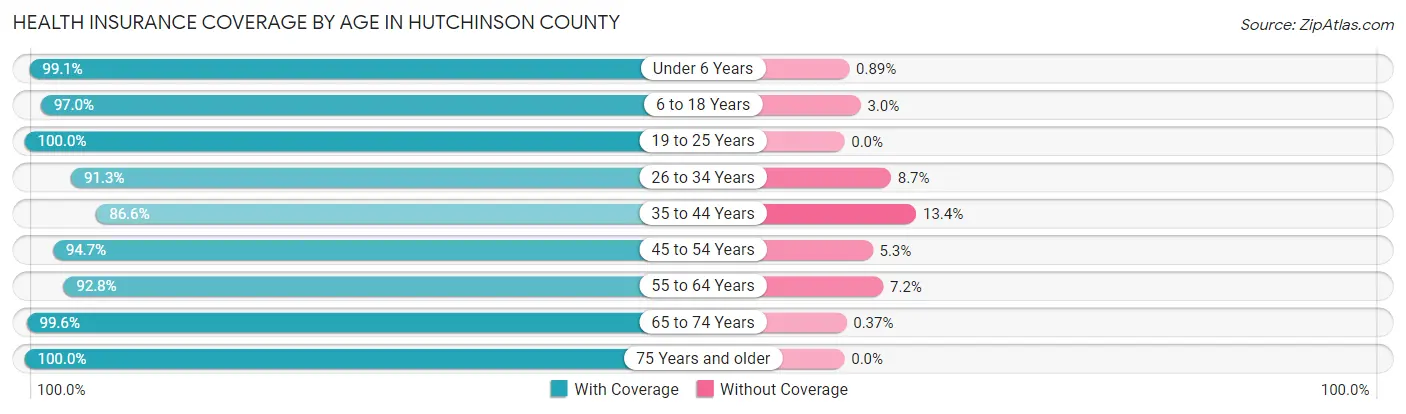
| Age Bracket | With Coverage | Without Coverage |
| Under 6 Years | 776 (99.1%) | 7 (0.9%) |
| 6 to 18 Years | 1,194 (97.0%) | 37 (3.0%) |
| 19 to 25 Years | 517 (100.0%) | 0 (0.0%) |
| 26 to 34 Years | 548 (91.3%) | 52 (8.7%) |
| 35 to 44 Years | 680 (86.6%) | 105 (13.4%) |
| 45 to 54 Years | 791 (94.7%) | 44 (5.3%) |
| 55 to 64 Years | 935 (92.8%) | 73 (7.2%) |
| 65 to 74 Years | 799 (99.6%) | 3 (0.4%) |
| 75 Years and older | 631 (100.0%) | 0 (0.0%) |
| Total | 6,871 (95.5%) | 321 (4.5%) |
Health Insurance Coverage by Citizenship Status in Hutchinson County
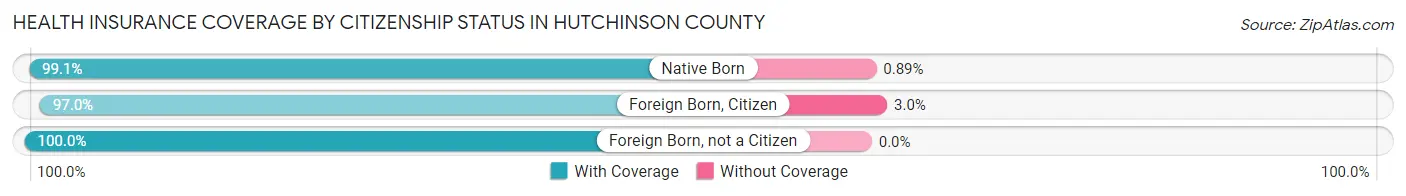
| Citizenship Status | With Coverage | Without Coverage |
| Native Born | 776 (99.1%) | 7 (0.9%) |
| Foreign Born, Citizen | 1,194 (97.0%) | 37 (3.0%) |
| Foreign Born, not a Citizen | 517 (100.0%) | 0 (0.0%) |
Health Insurance Coverage by Household Income in Hutchinson County
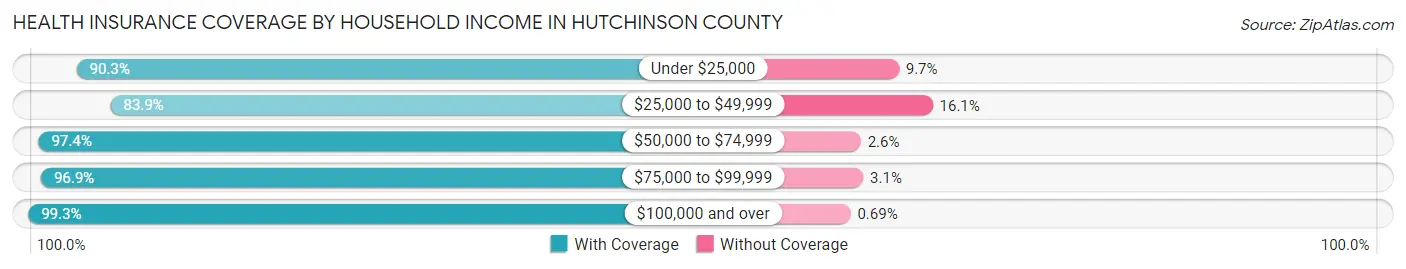
| Household Income | With Coverage | Without Coverage |
| Under $25,000 | 593 (90.3%) | 64 (9.7%) |
| $25,000 to $49,999 | 882 (83.9%) | 169 (16.1%) |
| $50,000 to $74,999 | 1,308 (97.4%) | 35 (2.6%) |
| $75,000 to $99,999 | 1,041 (96.9%) | 33 (3.1%) |
| $100,000 and over | 2,897 (99.3%) | 20 (0.7%) |
Public vs Private Health Insurance Coverage by Age in Hutchinson County
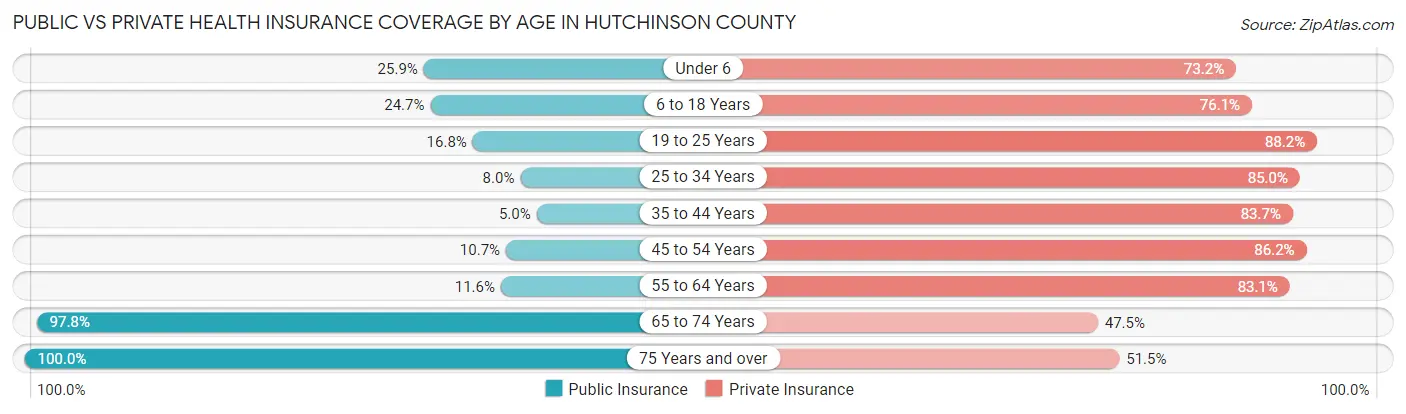
| Age Bracket | Public Insurance | Private Insurance |
| Under 6 | 203 (25.9%) | 573 (73.2%) |
| 6 to 18 Years | 304 (24.7%) | 937 (76.1%) |
| 19 to 25 Years | 87 (16.8%) | 456 (88.2%) |
| 25 to 34 Years | 48 (8.0%) | 510 (85.0%) |
| 35 to 44 Years | 39 (5.0%) | 657 (83.7%) |
| 45 to 54 Years | 89 (10.7%) | 720 (86.2%) |
| 55 to 64 Years | 117 (11.6%) | 838 (83.1%) |
| 65 to 74 Years | 784 (97.8%) | 381 (47.5%) |
| 75 Years and over | 631 (100.0%) | 325 (51.5%) |
| Total | 2,302 (32.0%) | 5,397 (75.0%) |
Disability Status by Sex by Age in Hutchinson County
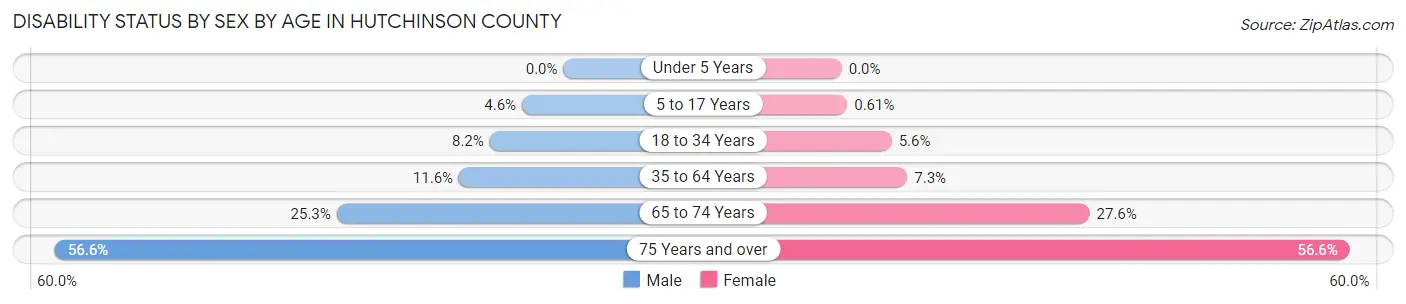
| Age Bracket | Male | Female |
| Under 5 Years | 0 (0.0%) | 0 (0.0%) |
| 5 to 17 Years | 30 (4.6%) | 4 (0.6%) |
| 18 to 34 Years | 49 (8.2%) | 34 (5.6%) |
| 35 to 64 Years | 159 (11.6%) | 92 (7.3%) |
| 65 to 74 Years | 100 (25.3%) | 112 (27.6%) |
| 75 Years and over | 154 (56.6%) | 203 (56.6%) |
Disability Class by Sex by Age in Hutchinson County
Disability Class: Hearing Difficulty
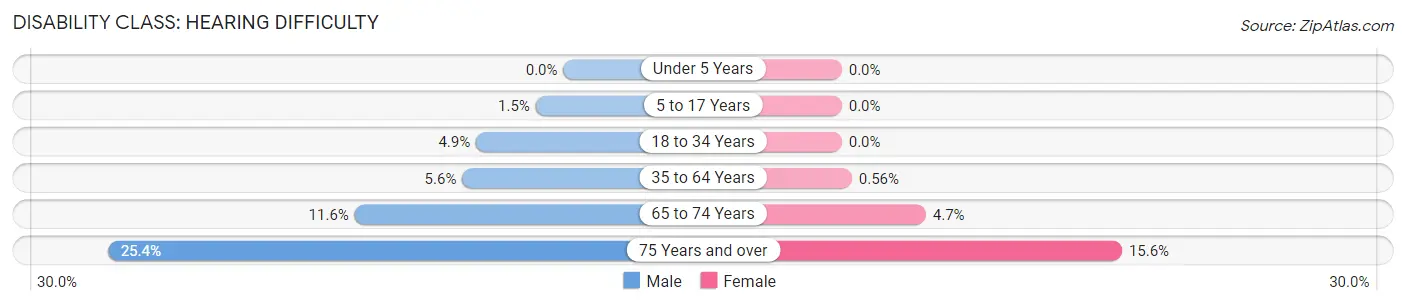
| Age Bracket | Male | Female |
| Under 5 Years | 0 (0.0%) | 0 (0.0%) |
| 5 to 17 Years | 10 (1.5%) | 0 (0.0%) |
| 18 to 34 Years | 29 (4.9%) | 0 (0.0%) |
| 35 to 64 Years | 77 (5.6%) | 7 (0.6%) |
| 65 to 74 Years | 46 (11.6%) | 19 (4.7%) |
| 75 Years and over | 69 (25.4%) | 56 (15.6%) |
Disability Class: Vision Difficulty
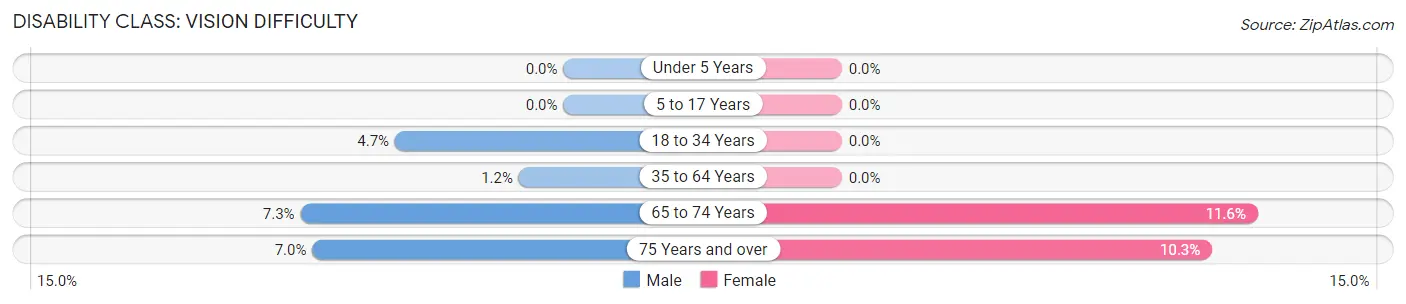
| Age Bracket | Male | Female |
| Under 5 Years | 0 (0.0%) | 0 (0.0%) |
| 5 to 17 Years | 0 (0.0%) | 0 (0.0%) |
| 18 to 34 Years | 28 (4.7%) | 0 (0.0%) |
| 35 to 64 Years | 17 (1.2%) | 0 (0.0%) |
| 65 to 74 Years | 29 (7.3%) | 47 (11.6%) |
| 75 Years and over | 19 (7.0%) | 37 (10.3%) |
Disability Class: Cognitive Difficulty
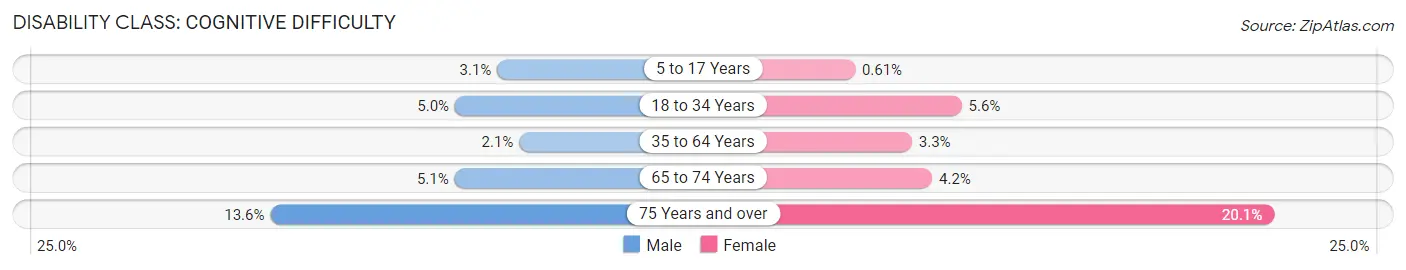
| Age Bracket | Male | Female |
| 5 to 17 Years | 20 (3.1%) | 4 (0.6%) |
| 18 to 34 Years | 30 (5.0%) | 34 (5.6%) |
| 35 to 64 Years | 28 (2.1%) | 41 (3.3%) |
| 65 to 74 Years | 20 (5.1%) | 17 (4.2%) |
| 75 Years and over | 37 (13.6%) | 72 (20.1%) |
Disability Class: Ambulatory Difficulty
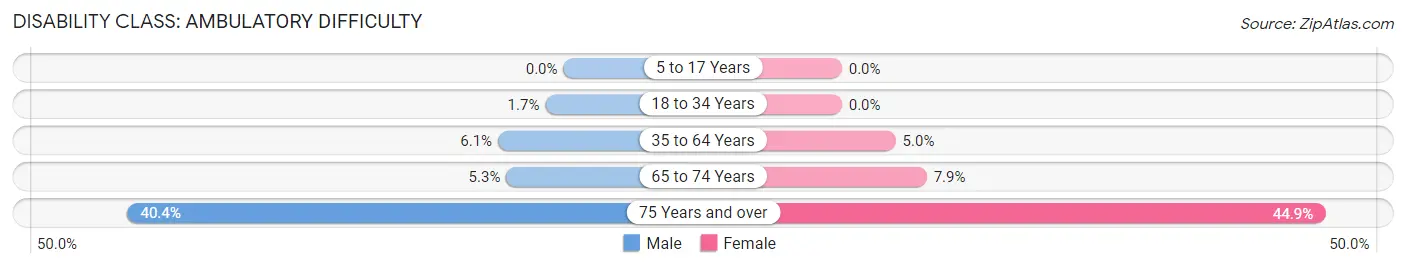
| Age Bracket | Male | Female |
| 5 to 17 Years | 0 (0.0%) | 0 (0.0%) |
| 18 to 34 Years | 10 (1.7%) | 0 (0.0%) |
| 35 to 64 Years | 83 (6.1%) | 63 (5.0%) |
| 65 to 74 Years | 21 (5.3%) | 32 (7.9%) |
| 75 Years and over | 110 (40.4%) | 161 (44.9%) |
Disability Class: Self-Care Difficulty
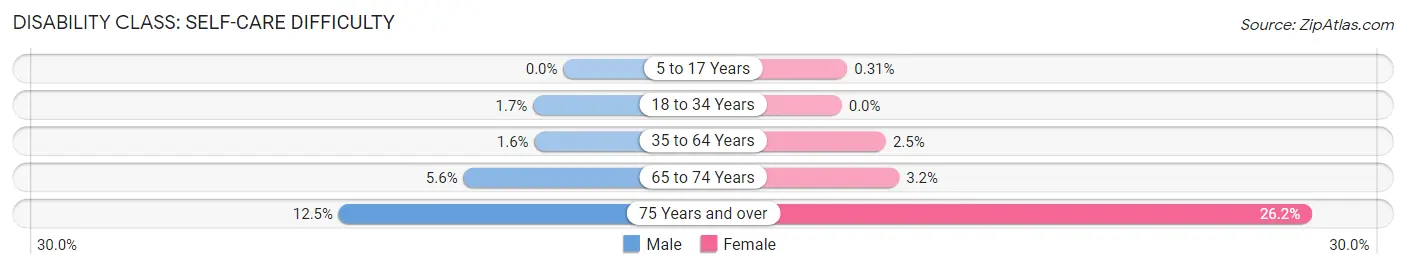
| Age Bracket | Male | Female |
| 5 to 17 Years | 0 (0.0%) | 2 (0.3%) |
| 18 to 34 Years | 10 (1.7%) | 0 (0.0%) |
| 35 to 64 Years | 22 (1.6%) | 31 (2.5%) |
| 65 to 74 Years | 22 (5.6%) | 13 (3.2%) |
| 75 Years and over | 34 (12.5%) | 94 (26.2%) |
Technology Access in Hutchinson County
Computing Device Access in Hutchinson County
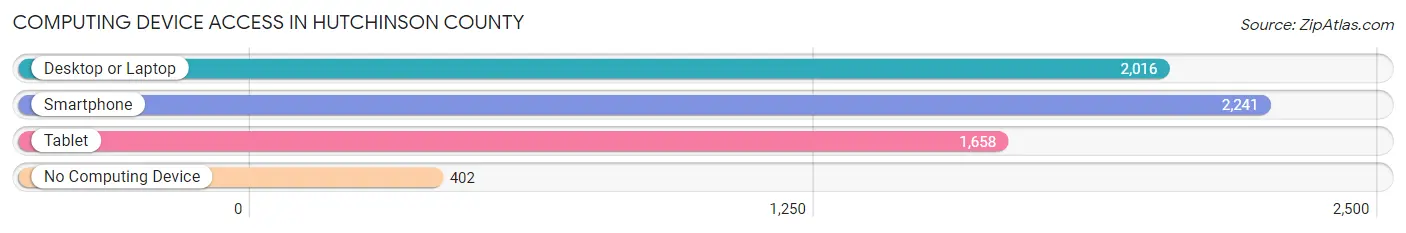
| Device Type | # Households | % Households |
| Desktop or Laptop | 2,016 | 68.8% |
| Smartphone | 2,241 | 76.5% |
| Tablet | 1,658 | 56.6% |
| No Computing Device | 402 | 13.7% |
| Total | 2,931 | 100.0% |
Internet Access in Hutchinson County
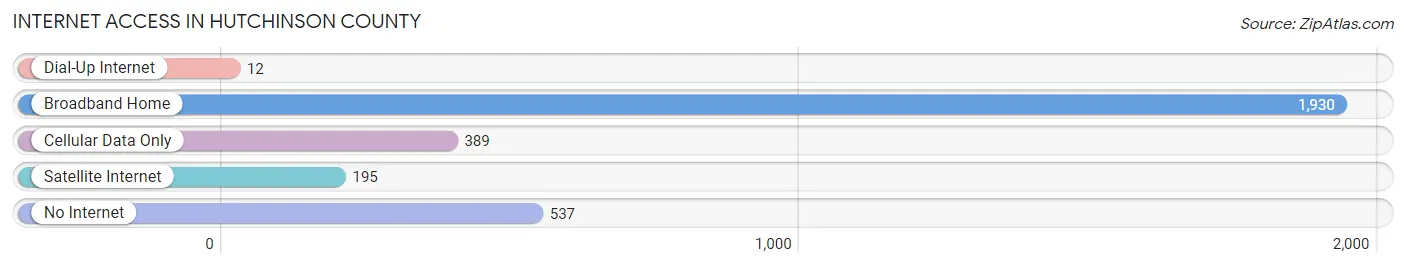
| Internet Type | # Households | % Households |
| Dial-Up Internet | 12 | 0.4% |
| Broadband Home | 1,930 | 65.8% |
| Cellular Data Only | 389 | 13.3% |
| Satellite Internet | 195 | 6.7% |
| No Internet | 537 | 18.3% |
| Total | 2,931 | 100.0% |
Hutchinson County Summary
Hutchinson County, South Dakota is located in the central part of the state, and is bordered by Kingsbury County to the north, Miner County to the east, Sanborn County to the south, and Beadle County to the west. The county seat is Olivet, and the largest city is Parkston. The county was named after William Hutchinson, a former territorial governor of South Dakota.
Geography
Hutchinson County covers an area of 845 square miles, and is mostly flat, with some rolling hills in the western part of the county. The county is drained by the James River, which flows through the county from north to south. The county is mostly agricultural, with some small towns scattered throughout. The county is home to several lakes, including Lake Farley, Lake Poinsett, and Lake Thompson.
Demographics
As of the 2010 census, Hutchinson County had a population of 6,845. The racial makeup of the county was 97.2% White, 0.3% African American, 0.3% Native American, 0.3% Asian, 0.1% Pacific Islander, 0.7% from other races, and 1.1% from two or more races. Hispanic or Latino of any race were 1.7% of the population.
The median income for a household in the county was $45,945, and the median income for a family was $51,945. The per capita income for the county was $20,945. About 8.2% of families and 10.2% of the population were below the poverty line, including 12.2% of those under age 18 and 8.2% of those age 65 or over.
Economy
Hutchinson County is primarily an agricultural county, with the majority of the population employed in farming and ranching. The county is home to several large farms, including the Poinsett Farms, which is one of the largest in the state. Other major industries in the county include manufacturing, retail, and tourism.
The county is home to several small towns, including Olivet, Parkston, and Tripp. Olivet is the county seat, and is home to the Hutchinson County Courthouse. Parkston is the largest city in the county, and is home to several businesses, including a grocery store, a hardware store, and a bank. Tripp is a small town located in the western part of the county, and is home to a few businesses, including a gas station and a restaurant.
Conclusion
Hutchinson County, South Dakota is a rural county located in the central part of the state. The county is mostly agricultural, with some small towns scattered throughout. The county is home to several large farms, and is also home to several small businesses. The county has a population of 6,845, and the median income for a household is $45,945. Hutchinson County is a great place to live and work, and is a great place to raise a family.
Common Questions
What is the Total Population of Hutchinson County?
Total Population of Hutchinson County is 7,401.
What is the Total Male Population of Hutchinson County?
Total Male Population of Hutchinson County is 3,671.
What is the Total Female Population of Hutchinson County?
Total Female Population of Hutchinson County is 3,730.
What is the Ratio of Males per 100 Females in Hutchinson County?
There are 98.42 Males per 100 Females in Hutchinson County.
What is the Ratio of Females per 100 Males in Hutchinson County?
There are 101.61 Females per 100 Males in Hutchinson County.
What is the Median Population Age in Hutchinson County?
Median Population Age in Hutchinson County is 41.7 Years.
What is the Average Family Size in Hutchinson County
Average Family Size in Hutchinson County is 3.1 People.
What is the Average Household Size in Hutchinson County
Average Household Size in Hutchinson County is 2.4 People.
What is Per Capita Income in Hutchinson County?
Per Capita income in Hutchinson County is $35,631.
What is the Median Family Income in Hutchinson County?
Median Family Income in Hutchinson County is $91,563.
What is the Median Household income in Hutchinson County?
Median Household Income in Hutchinson County is $69,139.
What is Income or Wage Gap in Hutchinson County?
Income or Wage Gap in Hutchinson County is 36.0%.
Women in Hutchinson County earn 64.0 cents for every dollar earned by a man.
What is Inequality or Gini Index in Hutchinson County?
Inequality or Gini Index in Hutchinson County is 0.42.
How Large is the Labor Force in Hutchinson County?
There are 3,765 People in the Labor Forcein in Hutchinson County.
What is the Percentage of People in the Labor Force in Hutchinson County?
66.8% of People are in the Labor Force in Hutchinson County.
What is the Unemployment Rate in Hutchinson County?
Unemployment Rate in Hutchinson County is 1.5%.