Grant County, SD
Grant County Overview
7,533
TOTAL POPULATION
3,867
MALE POPULATION
3,666
FEMALE POPULATION
105.48
MALES / 100 FEMALES
94.80
FEMALES / 100 MALES
43.8
MEDIAN AGE
2.9
AVG FAMILY SIZE
2.4
AVG HOUSEHOLD SIZE
$38,787
PER CAPITA INCOME
$87,722
AVG FAMILY INCOME
$70,851
AVG HOUSEHOLD INCOME
31.9%
WAGE / INCOME GAP [ % ]
68.1¢/ $1
WAGE / INCOME GAP [ $ ]
$10,876
FAMILY INCOME DEFICIT
0.46
INEQUALITY / GINI INDEX
3,907
LABOR FORCE [ PEOPLE ]
64.2%
PERCENT IN LABOR FORCE
3.3%
UNEMPLOYMENT RATE
Grant County Area Codes
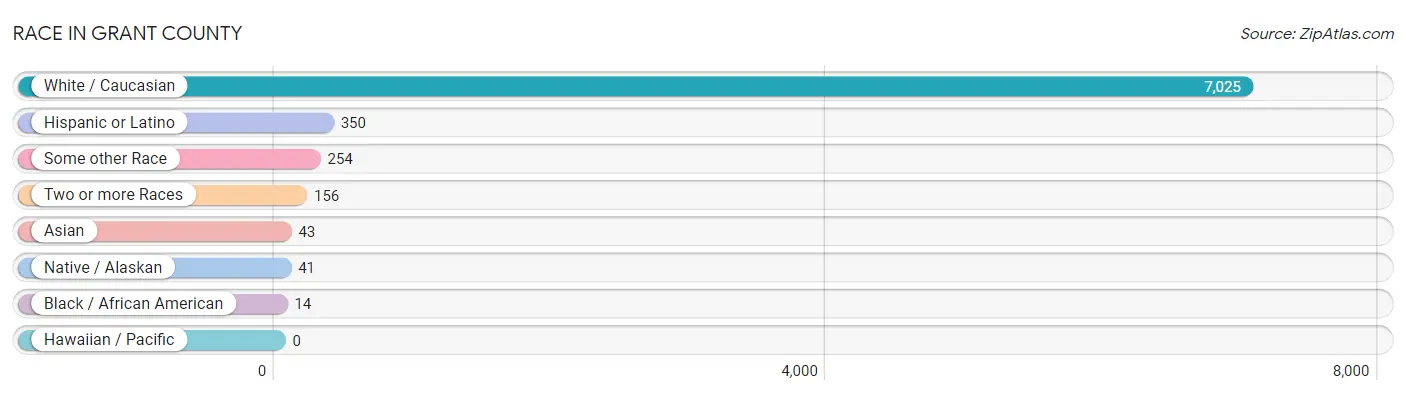
Race in Grant County
The most populous races in Grant County are White / Caucasian (7,025 | 93.3%), Hispanic or Latino (350 | 4.6%), and Some other Race (254 | 3.4%).
| Race | # Population | % Population |
| Asian | 43 | 0.6% |
| Black / African American | 14 | 0.2% |
| Hawaiian / Pacific | 0 | 0.0% |
| Hispanic or Latino | 350 | 4.6% |
| Native / Alaskan | 41 | 0.5% |
| White / Caucasian | 7,025 | 93.3% |
| Two or more Races | 156 | 2.1% |
| Some other Race | 254 | 3.4% |
| Total | 7,533 | 100.0% |
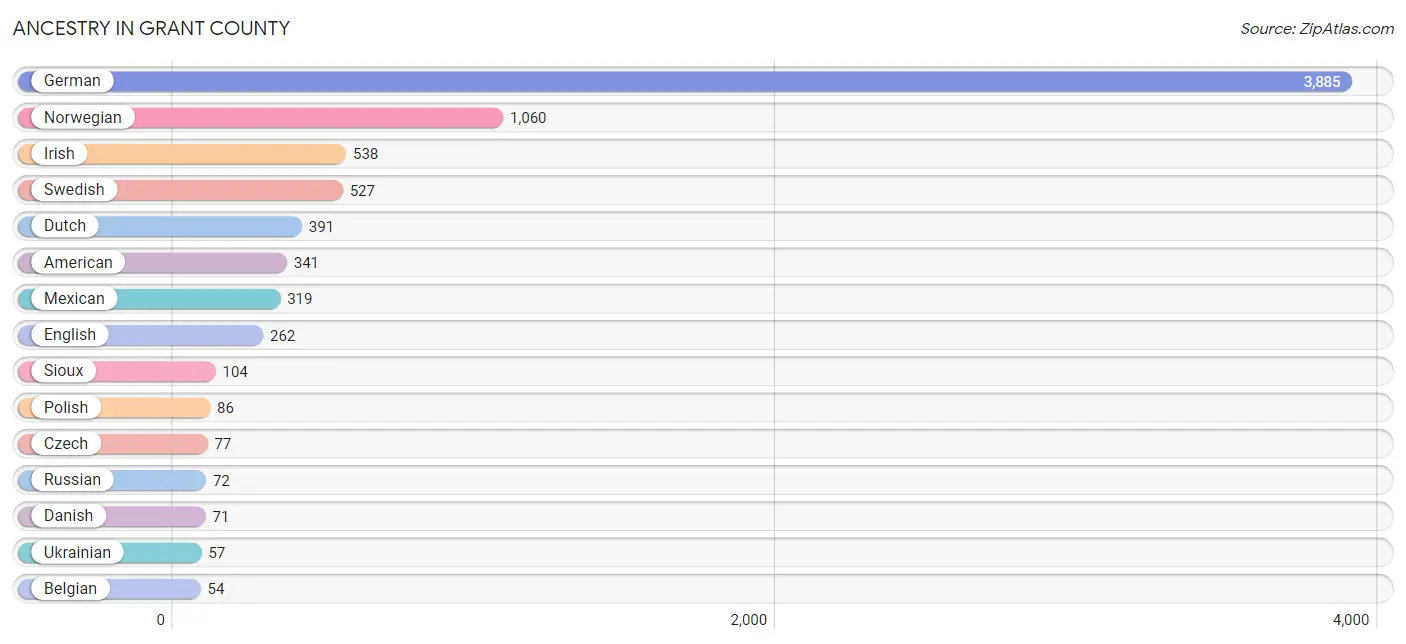
Ancestry in Grant County
The most populous ancestries reported in Grant County are German (3,885 | 51.6%), Norwegian (1,060 | 14.1%), Irish (538 | 7.1%), Swedish (527 | 7.0%), and Dutch (391 | 5.2%), together accounting for 85.0% of all Grant County residents.
| Ancestry | # Population | % Population |
| American | 341 | 4.5% |
| Austrian | 23 | 0.3% |
| Belgian | 54 | 0.7% |
| Bhutanese | 8 | 0.1% |
| British | 29 | 0.4% |
| Central American | 17 | 0.2% |
| Cherokee | 2 | 0.0% |
| Croatian | 1 | 0.0% |
| Czech | 77 | 1.0% |
| Czechoslovakian | 27 | 0.4% |
| Danish | 71 | 0.9% |
| Dutch | 391 | 5.2% |
| English | 262 | 3.5% |
| Ethiopian | 10 | 0.1% |
| European | 53 | 0.7% |
| Finnish | 25 | 0.3% |
| French | 52 | 0.7% |
| French Canadian | 3 | 0.0% |
| German | 3,885 | 51.6% |
| Guamanian / Chamorro | 3 | 0.0% |
| Guatemalan | 17 | 0.2% |
| Indian (Asian) | 1 | 0.0% |
| Indonesian | 36 | 0.5% |
| Irish | 538 | 7.1% |
| Iroquois | 2 | 0.0% |
| Italian | 22 | 0.3% |
| Korean | 2 | 0.0% |
| Lithuanian | 1 | 0.0% |
| Luxembourger | 6 | 0.1% |
| Mexican | 319 | 4.2% |
| Mexican American Indian | 1 | 0.0% |
| Northern European | 29 | 0.4% |
| Norwegian | 1,060 | 14.1% |
| Pennsylvania German | 31 | 0.4% |
| Polish | 86 | 1.1% |
| Puerto Rican | 1 | 0.0% |
| Romanian | 2 | 0.0% |
| Russian | 72 | 1.0% |
| Scandinavian | 49 | 0.6% |
| Scotch-Irish | 3 | 0.0% |
| Scottish | 29 | 0.4% |
| Sioux | 104 | 1.4% |
| Slavic | 2 | 0.0% |
| Spanish | 12 | 0.2% |
| Subsaharan African | 14 | 0.2% |
| Swedish | 527 | 7.0% |
| Swiss | 10 | 0.1% |
| Ugandan | 4 | 0.1% |
| Ukrainian | 57 | 0.8% |
| Welsh | 6 | 0.1% | View All 50 Rows |
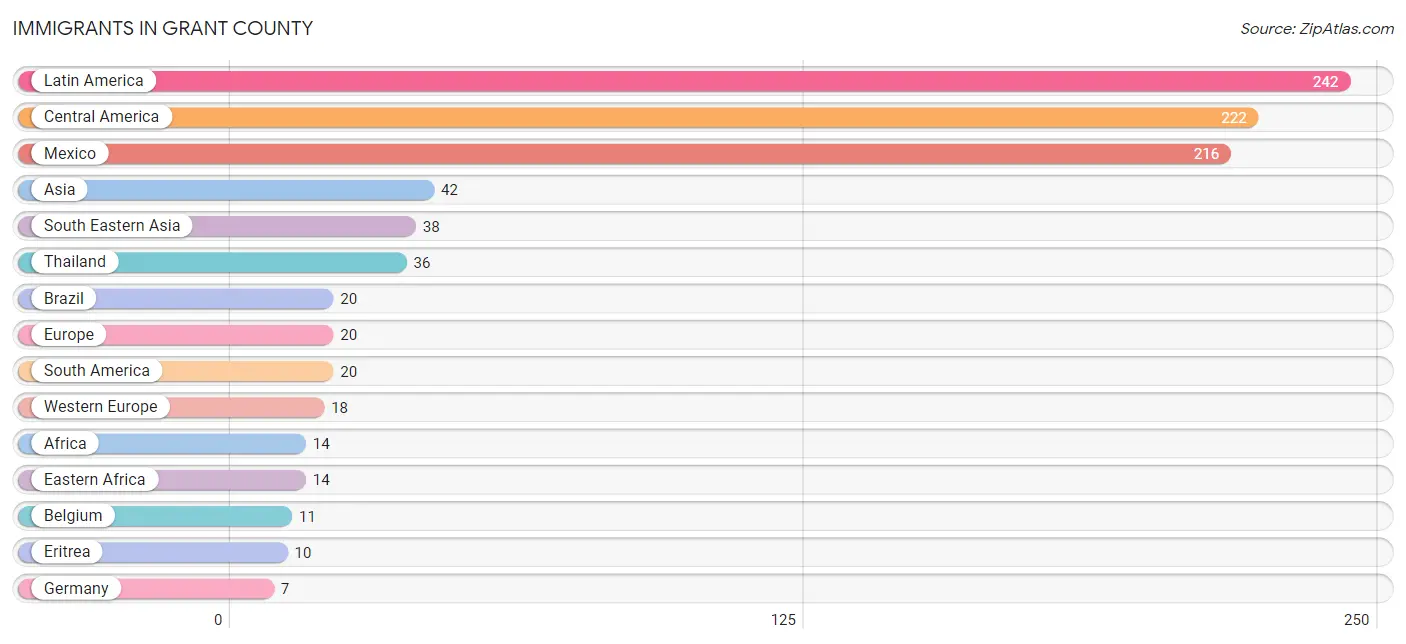
Immigrants in Grant County
The most numerous immigrant groups reported in Grant County came from Latin America (242 | 3.2%), Central America (222 | 2.9%), Mexico (216 | 2.9%), Asia (42 | 0.6%), and South Eastern Asia (38 | 0.5%), together accounting for 10.1% of all Grant County residents.
| Immigration Origin | # Population | % Population |
| Africa | 14 | 0.2% |
| Asia | 42 | 0.6% |
| Belgium | 11 | 0.2% |
| Brazil | 20 | 0.3% |
| Central America | 222 | 2.9% |
| Eastern Africa | 14 | 0.2% |
| Eastern Asia | 4 | 0.1% |
| Eastern Europe | 2 | 0.0% |
| Eritrea | 10 | 0.1% |
| Europe | 20 | 0.3% |
| Germany | 7 | 0.1% |
| Guatemala | 6 | 0.1% |
| Japan | 4 | 0.1% |
| Latin America | 242 | 3.2% |
| Mexico | 216 | 2.9% |
| Philippines | 2 | 0.0% |
| Romania | 2 | 0.0% |
| South America | 20 | 0.3% |
| South Eastern Asia | 38 | 0.5% |
| Thailand | 36 | 0.5% |
| Uganda | 4 | 0.1% |
| Western Europe | 18 | 0.2% | View All 22 Rows |
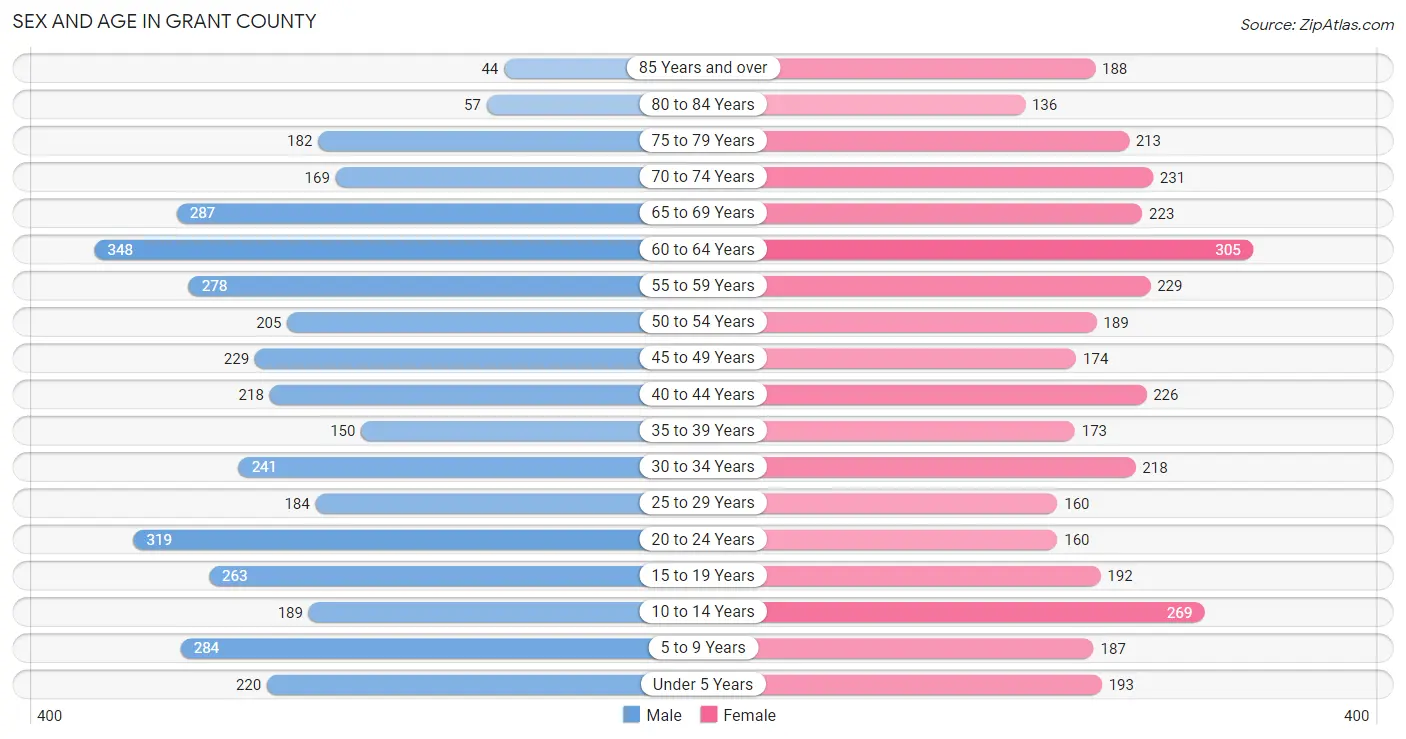
Sex and Age in Grant County
Sex and Age in Grant County
The most populous age groups in Grant County are 60 to 64 Years (348 | 9.0%) for men and 60 to 64 Years (305 | 8.3%) for women.
| Age Bracket | Male | Female |
| Under 5 Years | 220 (5.7%) | 193 (5.3%) |
| 5 to 9 Years | 284 (7.3%) | 187 (5.1%) |
| 10 to 14 Years | 189 (4.9%) | 269 (7.3%) |
| 15 to 19 Years | 263 (6.8%) | 192 (5.2%) |
| 20 to 24 Years | 319 (8.3%) | 160 (4.4%) |
| 25 to 29 Years | 184 (4.8%) | 160 (4.4%) |
| 30 to 34 Years | 241 (6.2%) | 218 (5.9%) |
| 35 to 39 Years | 150 (3.9%) | 173 (4.7%) |
| 40 to 44 Years | 218 (5.6%) | 226 (6.2%) |
| 45 to 49 Years | 229 (5.9%) | 174 (4.8%) |
| 50 to 54 Years | 205 (5.3%) | 189 (5.2%) |
| 55 to 59 Years | 278 (7.2%) | 229 (6.2%) |
| 60 to 64 Years | 348 (9.0%) | 305 (8.3%) |
| 65 to 69 Years | 287 (7.4%) | 223 (6.1%) |
| 70 to 74 Years | 169 (4.4%) | 231 (6.3%) |
| 75 to 79 Years | 182 (4.7%) | 213 (5.8%) |
| 80 to 84 Years | 57 (1.5%) | 136 (3.7%) |
| 85 Years and over | 44 (1.1%) | 188 (5.1%) |
| Total | 3,867 (100.0%) | 3,666 (100.0%) |
Families and Households in Grant County
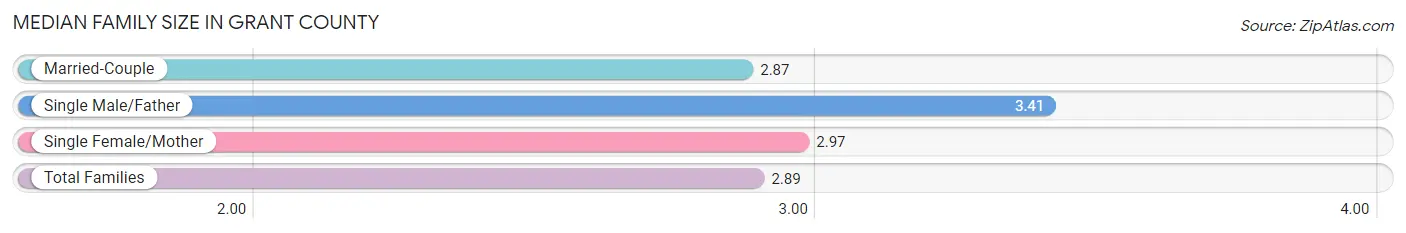
Median Family Size in Grant County
The median family size in Grant County is 2.89 persons per family, with single male/father families (49 | 2.3%) accounting for the largest median family size of 3.41 persons per family. On the other hand, married-couple families (1,906 | 90.3%) represent the smallest median family size with 2.87 persons per family.
| Family Type | # Families | Family Size |
| Married-Couple | 1,906 (90.3%) | 2.87 |
| Single Male/Father | 49 (2.3%) | 3.41 |
| Single Female/Mother | 156 (7.4%) | 2.97 |
| Total Families | 2,111 (100.0%) | 2.89 |
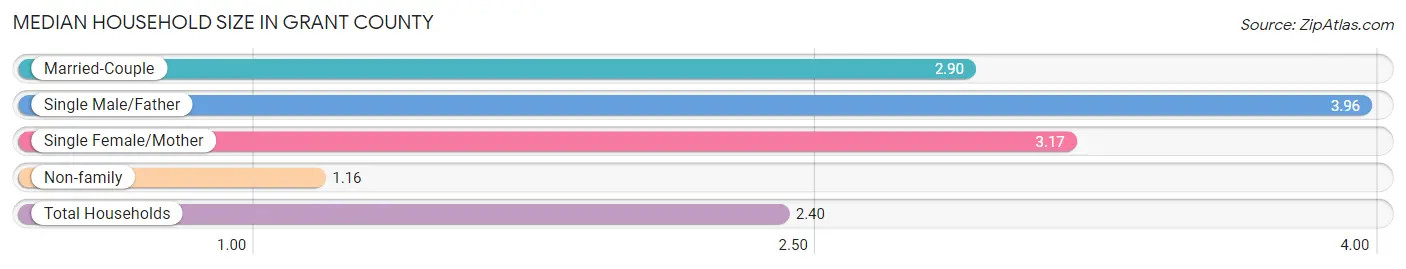
Median Household Size in Grant County
The median household size in Grant County is 2.40 persons per household, with single male/father households (49 | 1.6%) accounting for the largest median household size of 3.96 persons per household. non-family households (920 | 30.3%) represent the smallest median household size with 1.16 persons per household.
| Household Type | # Households | Household Size |
| Married-Couple | 1,906 (62.9%) | 2.90 |
| Single Male/Father | 49 (1.6%) | 3.96 |
| Single Female/Mother | 156 (5.1%) | 3.17 |
| Non-family | 920 (30.3%) | 1.16 |
| Total Households | 3,031 (100.0%) | 2.40 |
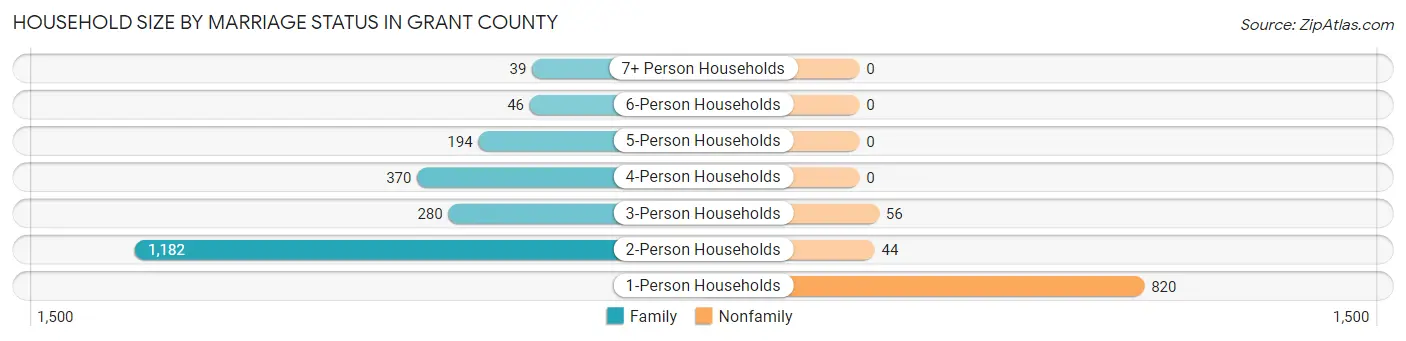
Household Size by Marriage Status in Grant County
Out of a total of 3,031 households in Grant County, 2,111 (69.7%) are family households, while 920 (30.3%) are nonfamily households. The most numerous type of family households are 2-person households, comprising 1,182, and the most common type of nonfamily households are 1-person households, comprising 820.
| Household Size | Family Households | Nonfamily Households |
| 1-Person Households | - | 820 (27.1%) |
| 2-Person Households | 1,182 (39.0%) | 44 (1.5%) |
| 3-Person Households | 280 (9.2%) | 56 (1.8%) |
| 4-Person Households | 370 (12.2%) | 0 (0.0%) |
| 5-Person Households | 194 (6.4%) | 0 (0.0%) |
| 6-Person Households | 46 (1.5%) | 0 (0.0%) |
| 7+ Person Households | 39 (1.3%) | 0 (0.0%) |
| Total | 2,111 (69.7%) | 920 (30.3%) |
Female Fertility in Grant County
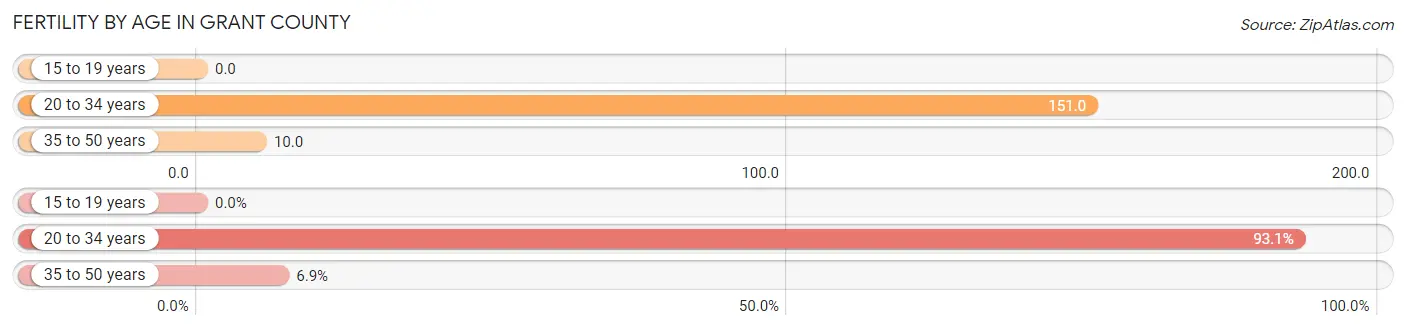
Fertility by Age in Grant County
Average fertility rate in Grant County is 65.0 births per 1,000 women. Women in the age bracket of 20 to 34 years have the highest fertility rate with 151.0 births per 1,000 women. Women in the age bracket of 20 to 34 years acount for 93.1% of all women with births.
| Age Bracket | Women with Births | Births / 1,000 Women |
| 15 to 19 years | 0 (0.0%) | 0.0 |
| 20 to 34 years | 81 (93.1%) | 151.0 |
| 35 to 50 years | 6 (6.9%) | 10.0 |
| Total | 87 (100.0%) | 65.0 |
Fertility by Age by Marriage Status in Grant County
88.5% of women with births (87) in Grant County are married. The highest percentage of unmarried women with births falls into 20 to 34 years age bracket with 12.3% of them unmarried at the time of birth, while the lowest percentage of unmarried women with births belong to 35 to 50 years age bracket with 0.0% of them unmarried.
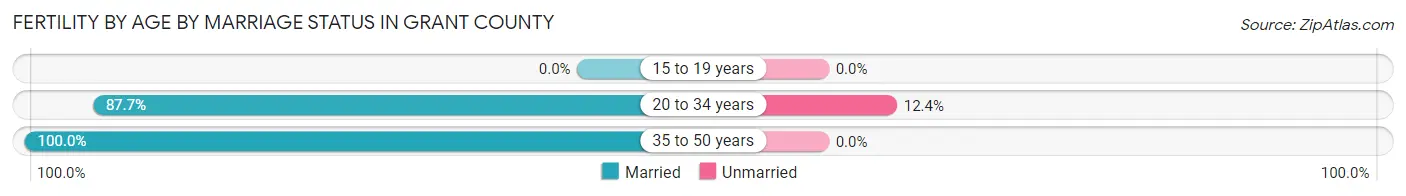
| Age Bracket | Married | Unmarried |
| 15 to 19 years | 0 (0.0%) | 0 (0.0%) |
| 20 to 34 years | 71 (87.6%) | 10 (12.3%) |
| 35 to 50 years | 6 (100.0%) | 0 (0.0%) |
| Total | 77 (88.5%) | 10 (11.5%) |
Fertility by Education in Grant County
Average fertility rate in Grant County is 65.0 births per 1,000 women. Women with the education attainment of college or associate's degree have the highest fertility rate of 167.0 births per 1,000 women, while women with the education attainment of less than high school have the lowest fertility at 4.0 births per 1,000 women. Women with the education attainment of college or associate's degree represent 78.2% of all women with births.
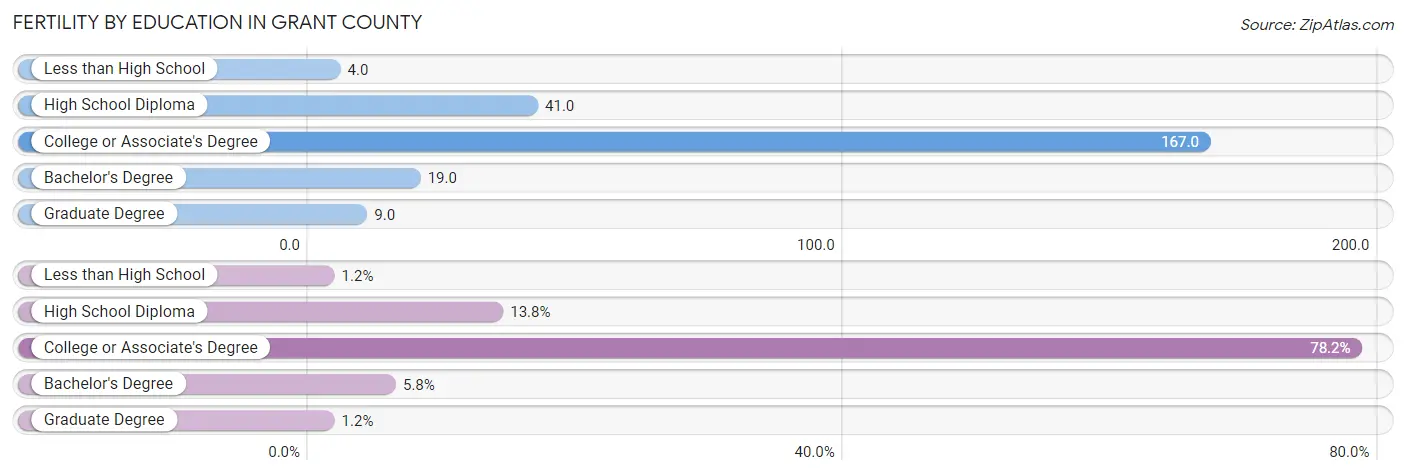
| Educational Attainment | Women with Births | Births / 1,000 Women |
| Less than High School | 1 (1.1%) | 4.0 |
| High School Diploma | 12 (13.8%) | 41.0 |
| College or Associate's Degree | 68 (78.2%) | 167.0 |
| Bachelor's Degree | 5 (5.8%) | 19.0 |
| Graduate Degree | 1 (1.1%) | 9.0 |
| Total | 87 (100.0%) | 65.0 |
Fertility by Education by Marriage Status in Grant County
11.5% of women with births in Grant County are unmarried. Women with the educational attainment of less than high school are most likely to be married with 100.0% of them married at childbirth, while women with the educational attainment of high school diploma are least likely to be married with 50.0% of them unmarried at childbirth.
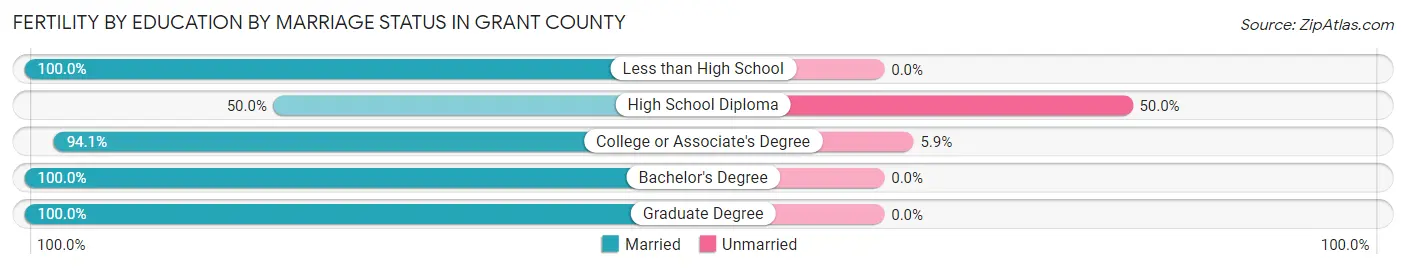
| Educational Attainment | Married | Unmarried |
| Less than High School | 1 (100.0%) | 0 (0.0%) |
| High School Diploma | 6 (50.0%) | 6 (50.0%) |
| College or Associate's Degree | 64 (94.1%) | 4 (5.9%) |
| Bachelor's Degree | 5 (100.0%) | 0 (0.0%) |
| Graduate Degree | 1 (100.0%) | 0 (0.0%) |
| Total | 77 (88.5%) | 10 (11.5%) |
Income in Grant County
Income Overview in Grant County
Per Capita Income in Grant County is $38,787, while median incomes of families and households are $87,722 and $70,851 respectively.
| Characteristic | Number | Measure |
| Per Capita Income | 7,533 | $38,787 |
| Median Family Income | 2,111 | $87,722 |
| Mean Family Income | 2,111 | $112,714 |
| Median Household Income | 3,031 | $70,851 |
| Mean Household Income | 3,031 | $92,894 |
| Income Deficit | 2,111 | $10,876 |
| Wage / Income Gap (%) | 7,533 | 31.94% |
| Wage / Income Gap ($) | 7,533 | 68.06¢ per $1 |
| Gini / Inequality Index | 7,533 | 0.46 |
Earnings by Sex in Grant County
Average Earnings in Grant County are $37,435, $45,794 for men and $31,167 for women, a difference of 31.9%.
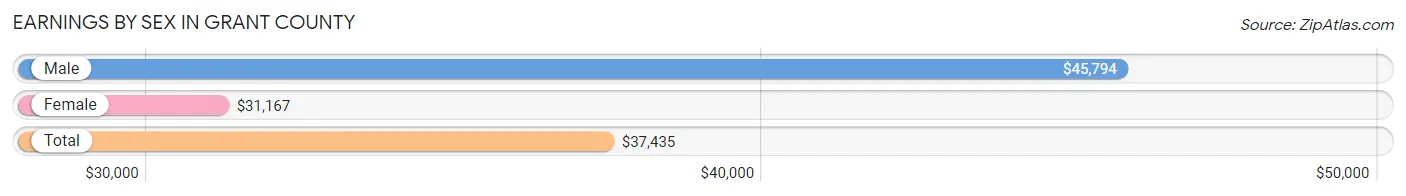
| Sex | Number | Average Earnings |
| Male | 2,521 (58.5%) | $45,794 |
| Female | 1,790 (41.5%) | $31,167 |
| Total | 4,311 (100.0%) | $37,435 |
Earnings by Sex by Income Bracket in Grant County
The most common earnings brackets in Grant County are $100,000+ for men (335 | 13.3%) and $55,000 to $64,999 for women (173 | 9.7%).
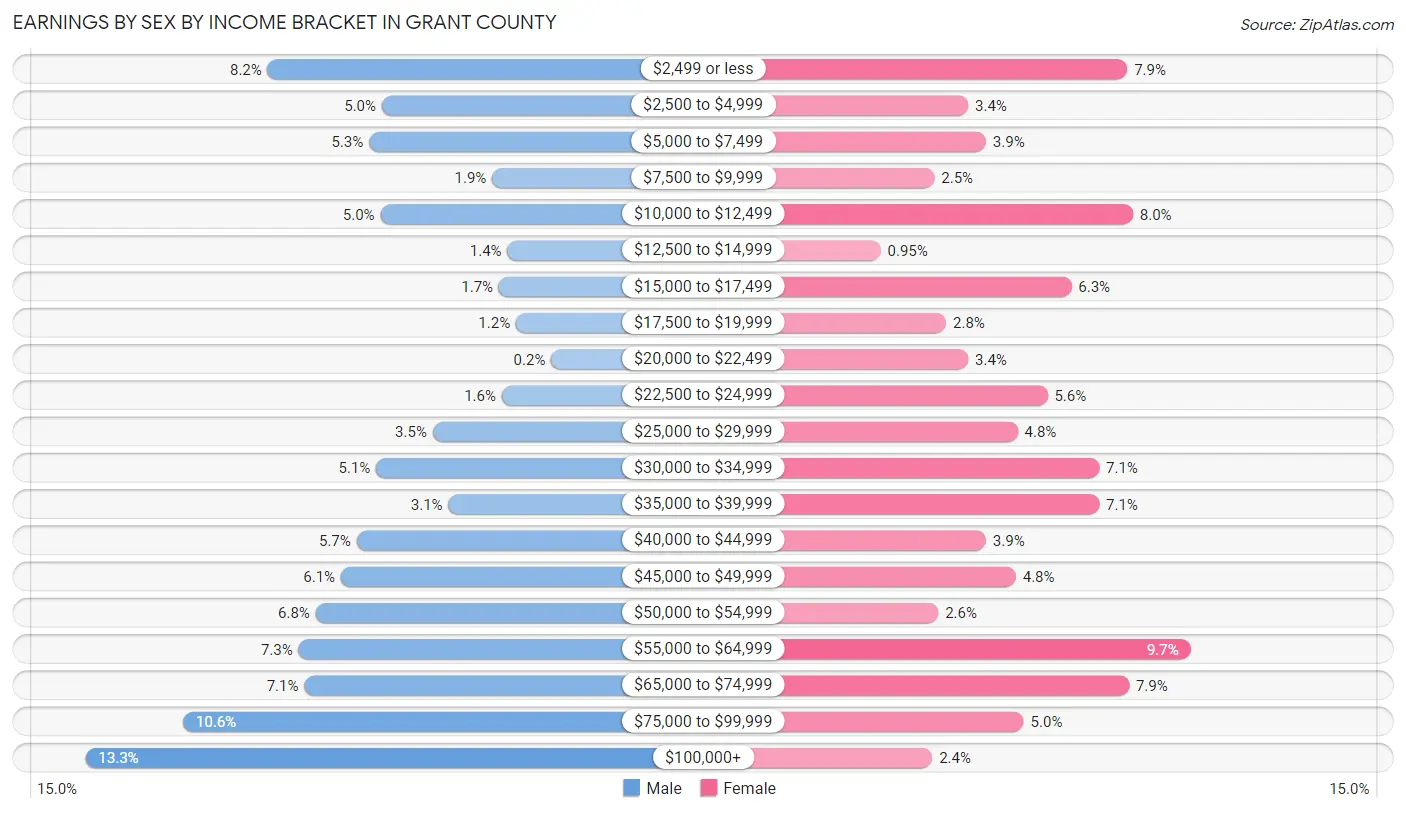
| Income | Male | Female |
| $2,499 or less | 206 (8.2%) | 141 (7.9%) |
| $2,500 to $4,999 | 125 (5.0%) | 61 (3.4%) |
| $5,000 to $7,499 | 134 (5.3%) | 70 (3.9%) |
| $7,500 to $9,999 | 47 (1.9%) | 44 (2.5%) |
| $10,000 to $12,499 | 126 (5.0%) | 144 (8.0%) |
| $12,500 to $14,999 | 36 (1.4%) | 17 (0.9%) |
| $15,000 to $17,499 | 42 (1.7%) | 113 (6.3%) |
| $17,500 to $19,999 | 30 (1.2%) | 50 (2.8%) |
| $20,000 to $22,499 | 5 (0.2%) | 61 (3.4%) |
| $22,500 to $24,999 | 40 (1.6%) | 101 (5.6%) |
| $25,000 to $29,999 | 89 (3.5%) | 86 (4.8%) |
| $30,000 to $34,999 | 129 (5.1%) | 127 (7.1%) |
| $35,000 to $39,999 | 78 (3.1%) | 127 (7.1%) |
| $40,000 to $44,999 | 143 (5.7%) | 70 (3.9%) |
| $45,000 to $49,999 | 154 (6.1%) | 85 (4.8%) |
| $50,000 to $54,999 | 172 (6.8%) | 46 (2.6%) |
| $55,000 to $64,999 | 184 (7.3%) | 173 (9.7%) |
| $65,000 to $74,999 | 180 (7.1%) | 142 (7.9%) |
| $75,000 to $99,999 | 266 (10.5%) | 89 (5.0%) |
| $100,000+ | 335 (13.3%) | 43 (2.4%) |
| Total | 2,521 (100.0%) | 1,790 (100.0%) |
Earnings by Sex by Educational Attainment in Grant County
Average earnings in Grant County are $53,000 for men and $33,688 for women, a difference of 36.4%. Men with an educational attainment of bachelor's degree enjoy the highest average annual earnings of $73,958, while those with less than high school education earn the least with $42,727. Women with an educational attainment of college or associate's degree earn the most with the average annual earnings of $33,261, while those with less than high school education have the smallest earnings of $19,931.
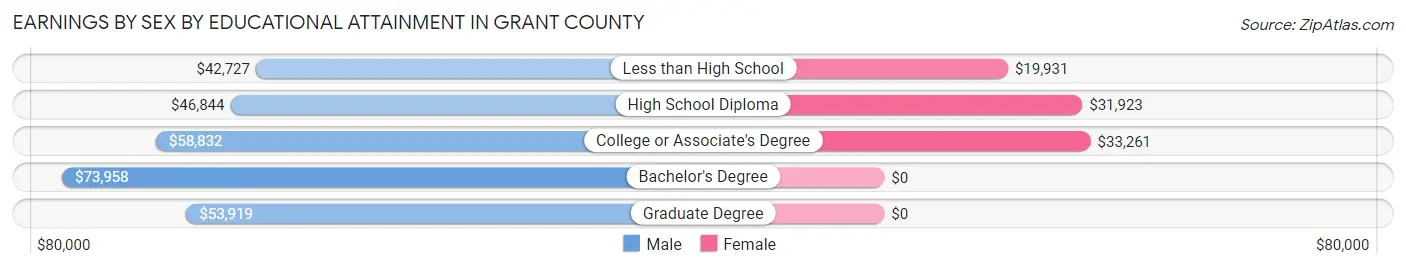
| Educational Attainment | Male Income | Female Income |
| Less than High School | $42,727 | $19,931 |
| High School Diploma | $46,844 | $31,923 |
| College or Associate's Degree | $58,832 | $33,261 |
| Bachelor's Degree | $73,958 | $0 |
| Graduate Degree | $53,919 | $0 |
| Total | $53,000 | $33,688 |
Family Income in Grant County
Family Income Brackets in Grant County
According to the Grant County family income data, there are 502 families falling into the $75,000 to $99,999 income range, which is the most common income bracket and makes up 23.8% of all families. Conversely, the $10,000 to $14,999 income bracket is the least frequent group with only 2 families (0.1%) belonging to this category.
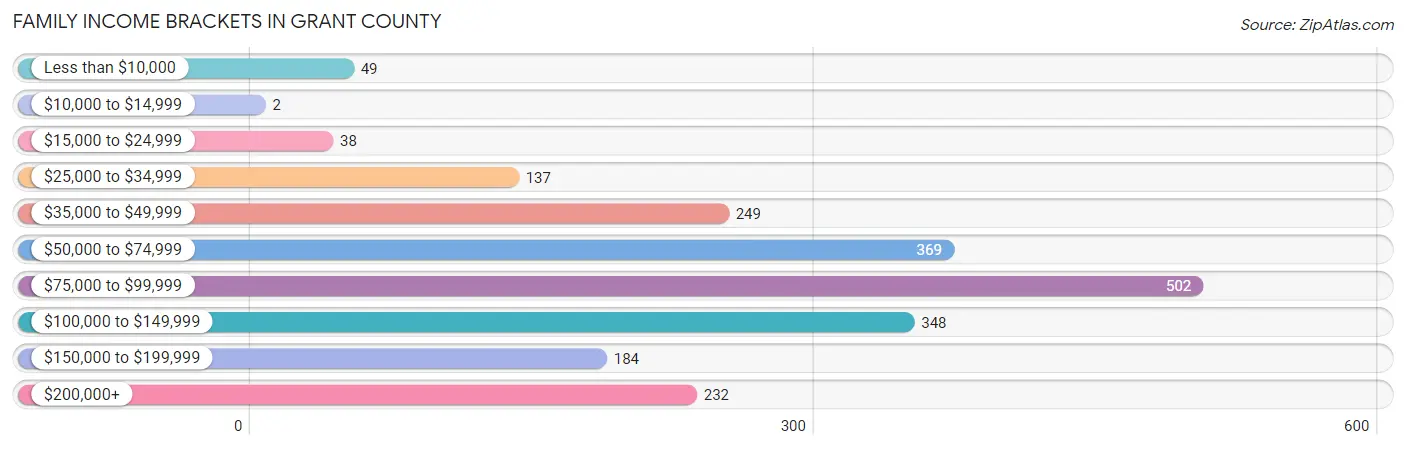
| Income Bracket | # Families | % Families |
| Less than $10,000 | 49 | 2.3% |
| $10,000 to $14,999 | 2 | 0.1% |
| $15,000 to $24,999 | 38 | 1.8% |
| $25,000 to $34,999 | 137 | 6.5% |
| $35,000 to $49,999 | 249 | 11.8% |
| $50,000 to $74,999 | 369 | 17.5% |
| $75,000 to $99,999 | 502 | 23.8% |
| $100,000 to $149,999 | 348 | 16.5% |
| $150,000 to $199,999 | 184 | 8.7% |
| $200,000+ | 232 | 11.0% |
Family Income by Famaliy Size in Grant County
7+ person families (39 | 1.8%) account for the highest median family income in Grant County with $250,001 per family, while 2-person families (1,216 | 57.6%) have the highest median income of $42,076 per family member.
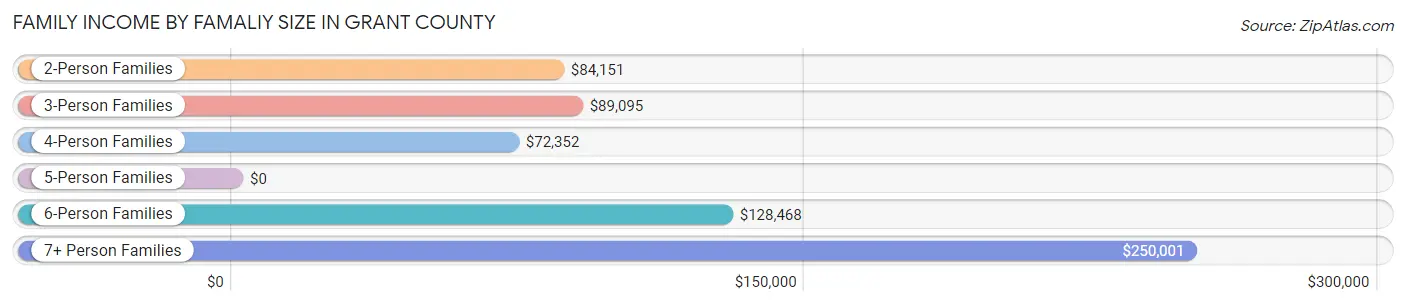
| Income Bracket | # Families | Median Income |
| 2-Person Families | 1,216 (57.6%) | $84,151 |
| 3-Person Families | 281 (13.3%) | $89,095 |
| 4-Person Families | 343 (16.3%) | $72,352 |
| 5-Person Families | 186 (8.8%) | $0 |
| 6-Person Families | 46 (2.2%) | $128,468 |
| 7+ Person Families | 39 (1.8%) | $250,001 |
| Total | 2,111 (100.0%) | $87,722 |
Family Income by Number of Earners in Grant County
The median family income in Grant County is $87,722, with families comprising 2 earners (1,094) having the highest median family income of $97,750, while families with no earners (246) have the lowest median family income of $49,286, accounting for 51.8% and 11.7% of families, respectively.
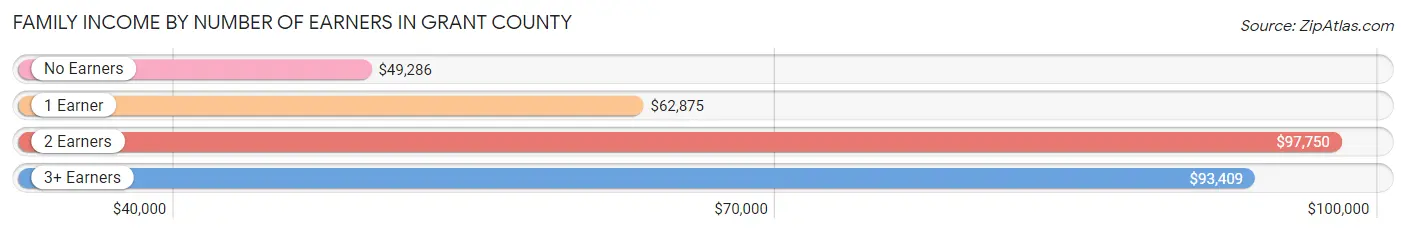
| Number of Earners | # Families | Median Income |
| No Earners | 246 (11.7%) | $49,286 |
| 1 Earner | 507 (24.0%) | $62,875 |
| 2 Earners | 1,094 (51.8%) | $97,750 |
| 3+ Earners | 264 (12.5%) | $93,409 |
| Total | 2,111 (100.0%) | $87,722 |
Household Income in Grant County
Household Income Brackets in Grant County
With 540 households falling in the category, the $75,000 to $99,999 income range is the most frequent in Grant County, accounting for 17.8% of all households. In contrast, only 61 households (2.0%) fall into the $10,000 to $14,999 income bracket, making it the least populous group.
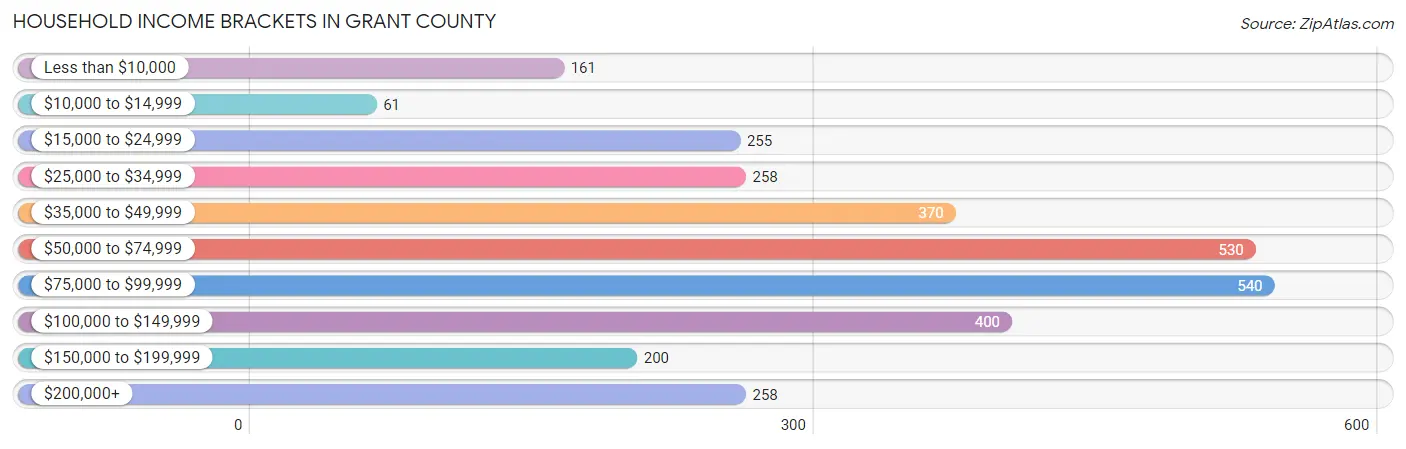
| Income Bracket | # Households | % Households |
| Less than $10,000 | 161 | 5.3% |
| $10,000 to $14,999 | 61 | 2.0% |
| $15,000 to $24,999 | 255 | 8.4% |
| $25,000 to $34,999 | 258 | 8.5% |
| $35,000 to $49,999 | 370 | 12.2% |
| $50,000 to $74,999 | 530 | 17.5% |
| $75,000 to $99,999 | 540 | 17.8% |
| $100,000 to $149,999 | 400 | 13.2% |
| $150,000 to $199,999 | 200 | 6.6% |
| $200,000+ | 258 | 8.5% |
Household Income by Householder Age in Grant County
The median household income in Grant County is $70,851, with the highest median household income of $86,534 found in the 45 to 64 years age bracket for the primary householder. A total of 1,088 households (35.9%) fall into this category. Meanwhile, the 15 to 24 years age bracket for the primary householder has the lowest median household income of $29,444, with 116 households (3.8%) in this group.
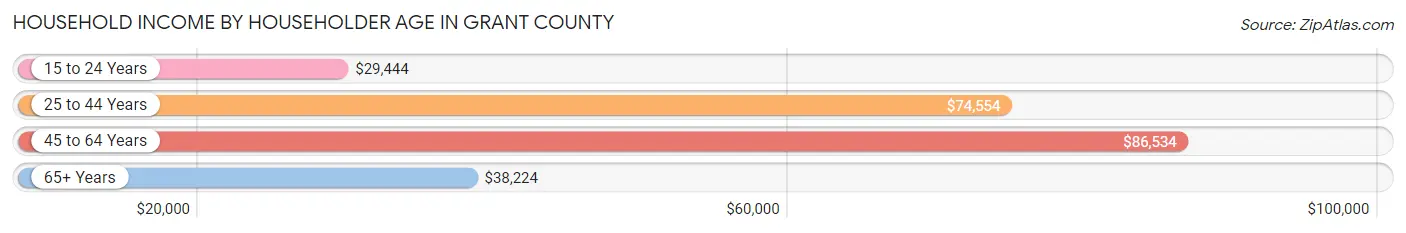
| Income Bracket | # Households | Median Income |
| 15 to 24 Years | 116 (3.8%) | $29,444 |
| 25 to 44 Years | 776 (25.6%) | $74,554 |
| 45 to 64 Years | 1,088 (35.9%) | $86,534 |
| 65+ Years | 1,051 (34.7%) | $38,224 |
| Total | 3,031 (100.0%) | $70,851 |
Poverty in Grant County
Income Below Poverty by Sex and Age in Grant County
With 9.8% poverty level for males and 9.9% for females among the residents of Grant County, 5 year old males and 75 year old and over females are the most vulnerable to poverty, with 2 males (50.0%) and 113 females (23.1%) in their respective age groups living below the poverty level.
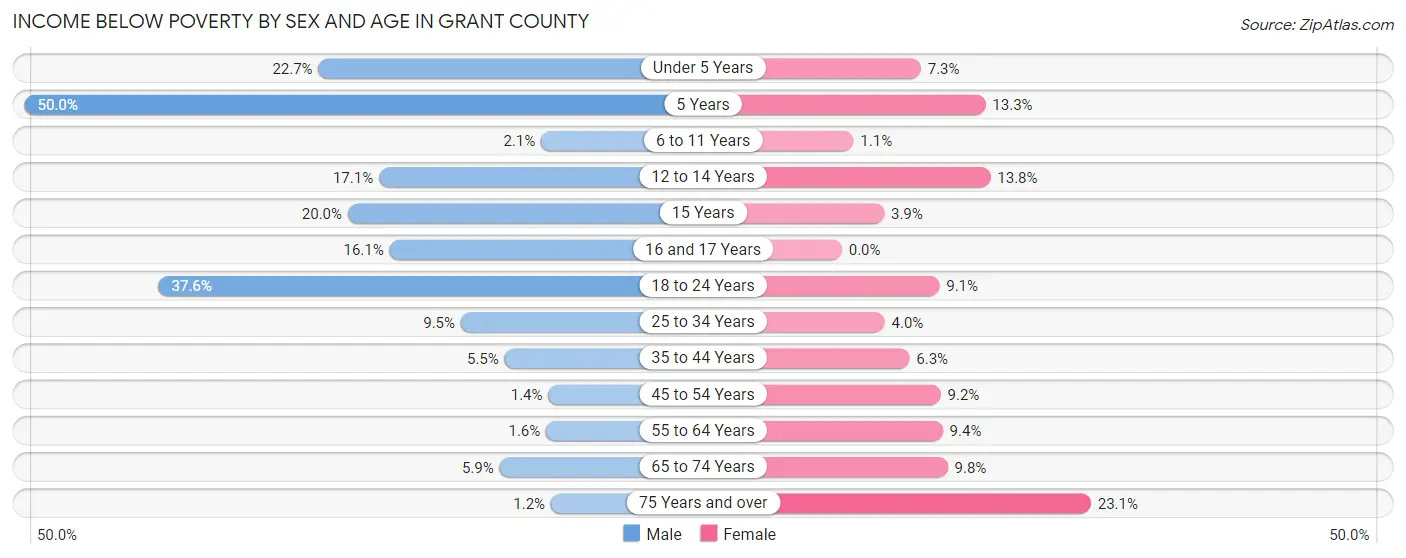
| Age Bracket | Male | Female |
| Under 5 Years | 50 (22.7%) | 14 (7.3%) |
| 5 Years | 2 (50.0%) | 6 (13.3%) |
| 6 to 11 Years | 6 (2.1%) | 2 (1.1%) |
| 12 to 14 Years | 26 (17.1%) | 28 (13.8%) |
| 15 Years | 11 (20.0%) | 2 (3.9%) |
| 16 and 17 Years | 20 (16.1%) | 0 (0.0%) |
| 18 to 24 Years | 151 (37.6%) | 21 (9.0%) |
| 25 to 34 Years | 39 (9.5%) | 15 (4.0%) |
| 35 to 44 Years | 20 (5.4%) | 25 (6.3%) |
| 45 to 54 Years | 6 (1.4%) | 33 (9.2%) |
| 55 to 64 Years | 10 (1.6%) | 50 (9.4%) |
| 65 to 74 Years | 27 (5.9%) | 44 (9.8%) |
| 75 Years and over | 3 (1.1%) | 113 (23.1%) |
| Total | 371 (9.8%) | 353 (9.9%) |
Income Above Poverty by Sex and Age in Grant County
According to the poverty statistics in Grant County, males aged 75 years and over and females aged 16 and 17 years are the age groups that are most secure financially, with 98.9% of males and 100.0% of females in these age groups living above the poverty line.
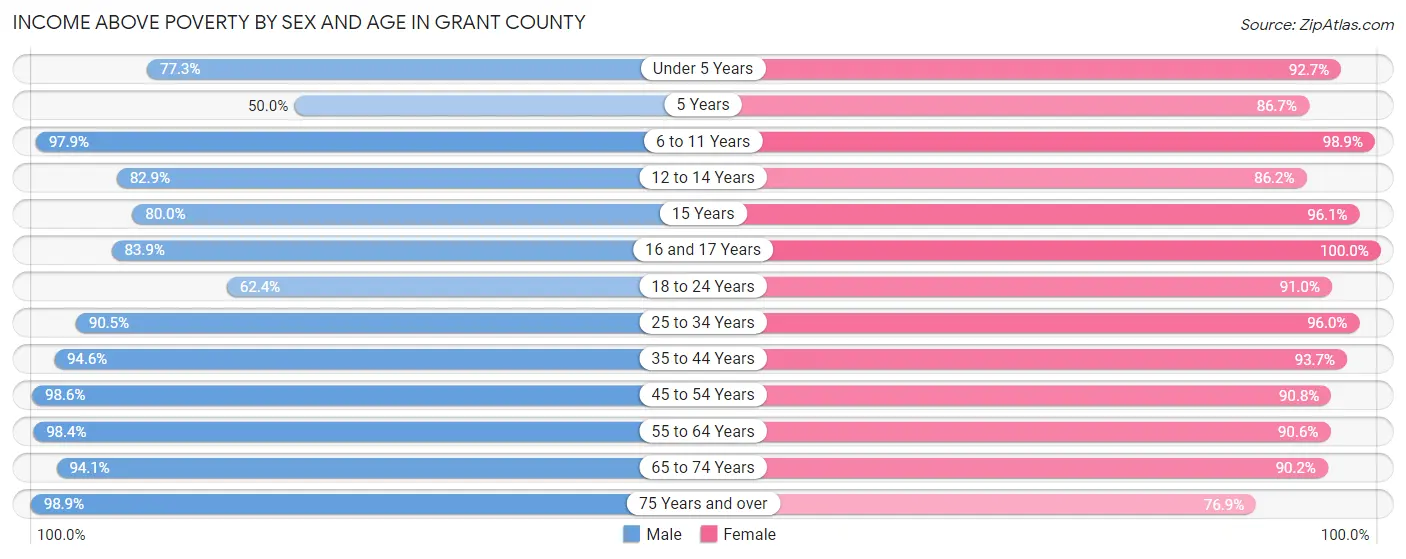
| Age Bracket | Male | Female |
| Under 5 Years | 170 (77.3%) | 177 (92.7%) |
| 5 Years | 2 (50.0%) | 39 (86.7%) |
| 6 to 11 Years | 284 (97.9%) | 183 (98.9%) |
| 12 to 14 Years | 126 (82.9%) | 175 (86.2%) |
| 15 Years | 44 (80.0%) | 49 (96.1%) |
| 16 and 17 Years | 104 (83.9%) | 69 (100.0%) |
| 18 to 24 Years | 251 (62.4%) | 211 (90.9%) |
| 25 to 34 Years | 371 (90.5%) | 363 (96.0%) |
| 35 to 44 Years | 347 (94.6%) | 374 (93.7%) |
| 45 to 54 Years | 427 (98.6%) | 327 (90.8%) |
| 55 to 64 Years | 614 (98.4%) | 484 (90.6%) |
| 65 to 74 Years | 429 (94.1%) | 404 (90.2%) |
| 75 Years and over | 258 (98.9%) | 376 (76.9%) |
| Total | 3,427 (90.2%) | 3,231 (90.1%) |
Income Below Poverty Among Married-Couple Families in Grant County
The poverty statistics for married-couple families in Grant County show that 3.4% or 64 of the total 1,906 families live below the poverty line. Families with 5 or more children have the highest poverty rate of 18.8%, comprising of 3 families. On the other hand, families with 3 or 4 children have the lowest poverty rate of 0.0%, which includes 0 families.
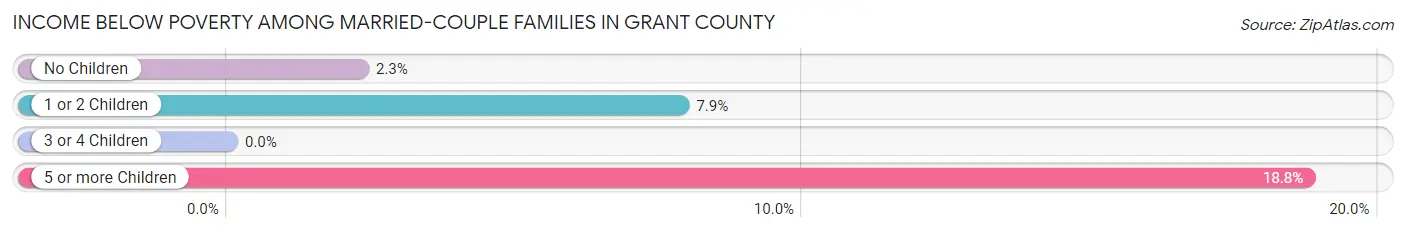
| Children | Above Poverty | Below Poverty |
| No Children | 1,241 (97.7%) | 29 (2.3%) |
| 1 or 2 Children | 375 (92.1%) | 32 (7.9%) |
| 3 or 4 Children | 213 (100.0%) | 0 (0.0%) |
| 5 or more Children | 13 (81.2%) | 3 (18.8%) |
| Total | 1,842 (96.6%) | 64 (3.4%) |
Income Below Poverty Among Single-Parent Households in Grant County
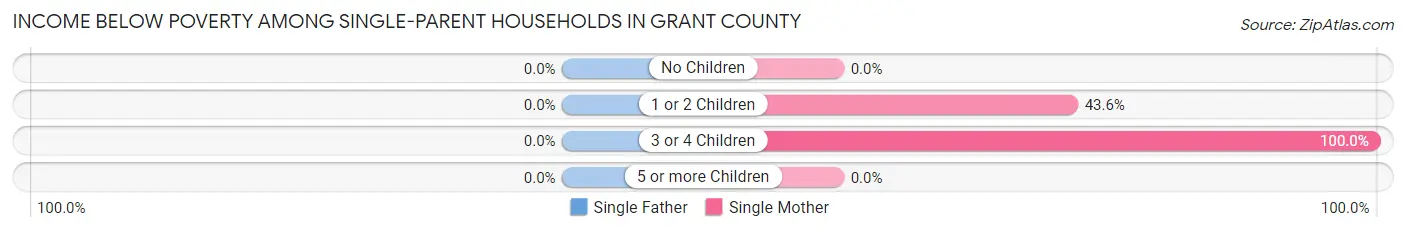
| Children | Single Father | Single Mother |
| No Children | 0 (0.0%) | 0 (0.0%) |
| 1 or 2 Children | 0 (0.0%) | 34 (43.6%) |
| 3 or 4 Children | 0 (0.0%) | 3 (100.0%) |
| 5 or more Children | 0 (0.0%) | 0 (0.0%) |
| Total | 0 (0.0%) | 37 (23.7%) |
Income Below Poverty Among Married-Couple vs Single-Parent Households in Grant County
The poverty data for Grant County shows that 64 of the married-couple family households (3.4%) and 37 of the single-parent households (18.0%) are living below the poverty level. Within the married-couple family households, those with 5 or more children have the highest poverty rate, with 3 households (18.8%) falling below the poverty line. Among the single-parent households, those with 3 or 4 children have the highest poverty rate, with 3 household (50.0%) living below poverty.
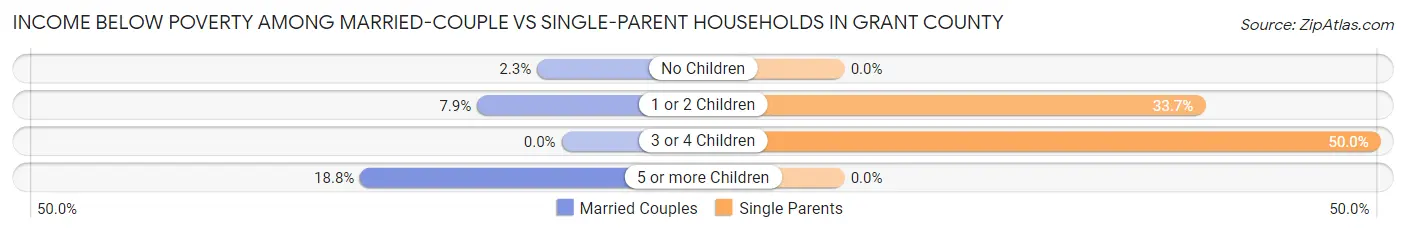
| Children | Married-Couple Families | Single-Parent Households |
| No Children | 29 (2.3%) | 0 (0.0%) |
| 1 or 2 Children | 32 (7.9%) | 34 (33.7%) |
| 3 or 4 Children | 0 (0.0%) | 3 (50.0%) |
| 5 or more Children | 3 (18.8%) | 0 (0.0%) |
| Total | 64 (3.4%) | 37 (18.0%) |
Employment Characteristics in Grant County
Employment by Class of Employer in Grant County
Among the 3,685 employed individuals in Grant County, private company employees (2,467 | 66.9%), self-employed (not incorporated) (397 | 10.8%), and local government employees (322 | 8.7%) make up the most common classes of employment.
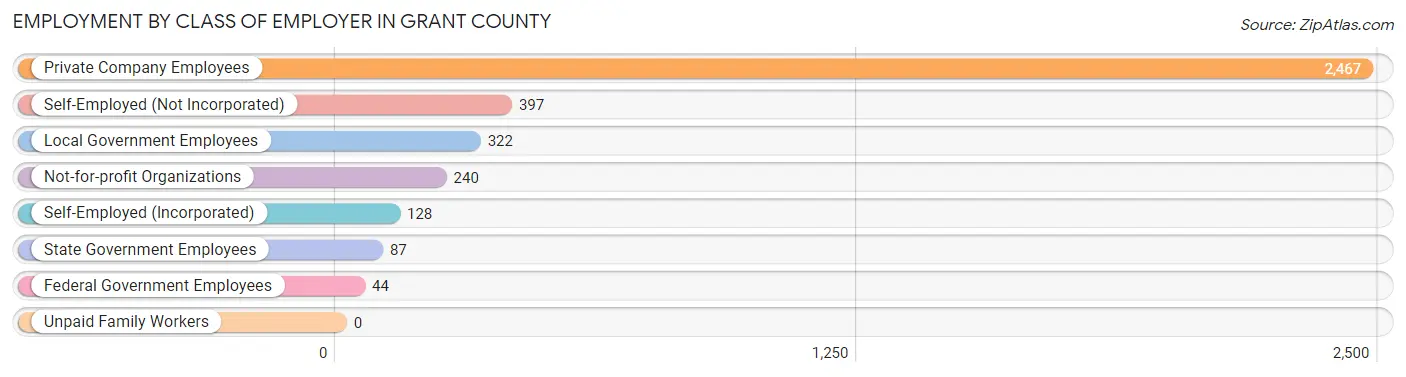
| Employer Class | # Employees | % Employees |
| Private Company Employees | 2,467 | 66.9% |
| Self-Employed (Incorporated) | 128 | 3.5% |
| Self-Employed (Not Incorporated) | 397 | 10.8% |
| Not-for-profit Organizations | 240 | 6.5% |
| Local Government Employees | 322 | 8.7% |
| State Government Employees | 87 | 2.4% |
| Federal Government Employees | 44 | 1.2% |
| Unpaid Family Workers | 0 | 0.0% |
| Total | 3,685 | 100.0% |
Employment Status by Age in Grant County
According to the labor force statistics for Grant County, out of the total population over 16 years of age (6,085), 64.2% or 3,907 individuals are in the labor force, with 3.3% or 129 of them unemployed. The age group with the highest labor force participation rate is 25 to 29 years, with 95.6% or 329 individuals in the labor force. Within the labor force, the 20 to 24 years age range has the highest percentage of unemployed individuals, with 18.8% or 78 of them being unemployed.
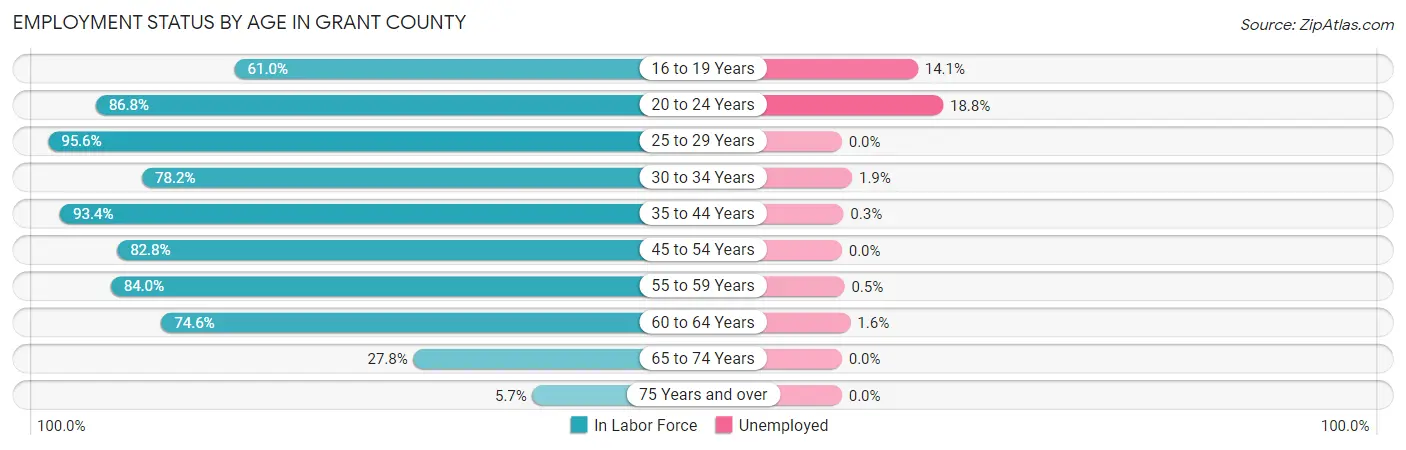
| Age Bracket | In Labor Force | Unemployed |
| 16 to 19 Years | 213 (61.0%) | 30 (14.1%) |
| 20 to 24 Years | 416 (86.8%) | 78 (18.8%) |
| 25 to 29 Years | 329 (95.6%) | 0 (0.0%) |
| 30 to 34 Years | 359 (78.2%) | 7 (1.9%) |
| 35 to 44 Years | 716 (93.4%) | 2 (0.3%) |
| 45 to 54 Years | 660 (82.8%) | 0 (0.0%) |
| 55 to 59 Years | 426 (84.0%) | 2 (0.5%) |
| 60 to 64 Years | 487 (74.6%) | 8 (1.6%) |
| 65 to 74 Years | 253 (27.8%) | 0 (0.0%) |
| 75 Years and over | 47 (5.7%) | 0 (0.0%) |
| Total | 3,907 (64.2%) | 129 (3.3%) |
Employment Status by Educational Attainment in Grant County
According to labor force statistics for Grant County, 84.4% of individuals (2,977) out of the total population between 25 and 64 years of age (3,527) are in the labor force, with 0.6% or 18 of them being unemployed. The group with the highest labor force participation rate are those with the educational attainment of college / associate degree, with 89.3% or 1,039 individuals in the labor force. Within the labor force, individuals with college / associate degree education have the highest percentage of unemployment, with 1.6% or 17 of them being unemployed.
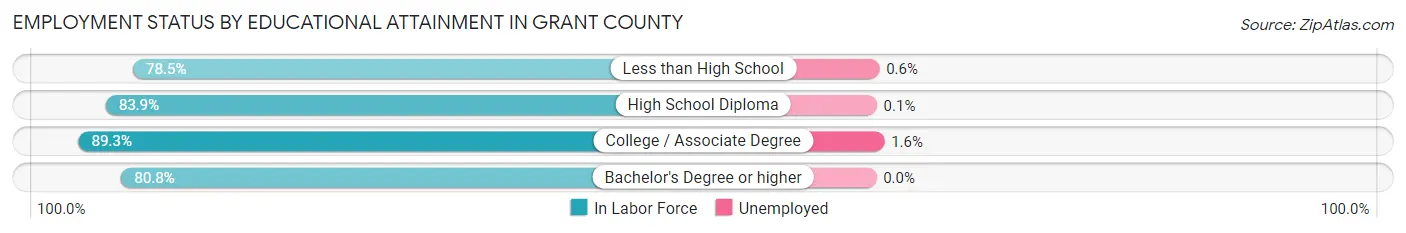
| Educational Attainment | In Labor Force | Unemployed |
| Less than High School | 168 (78.5%) | 1 (0.6%) |
| High School Diploma | 936 (83.9%) | 1 (0.1%) |
| College / Associate Degree | 1,039 (89.3%) | 19 (1.6%) |
| Bachelor's Degree or higher | 835 (80.8%) | 0 (0.0%) |
| Total | 2,977 (84.4%) | 21 (0.6%) |
Employment Occupations by Sex in Grant County
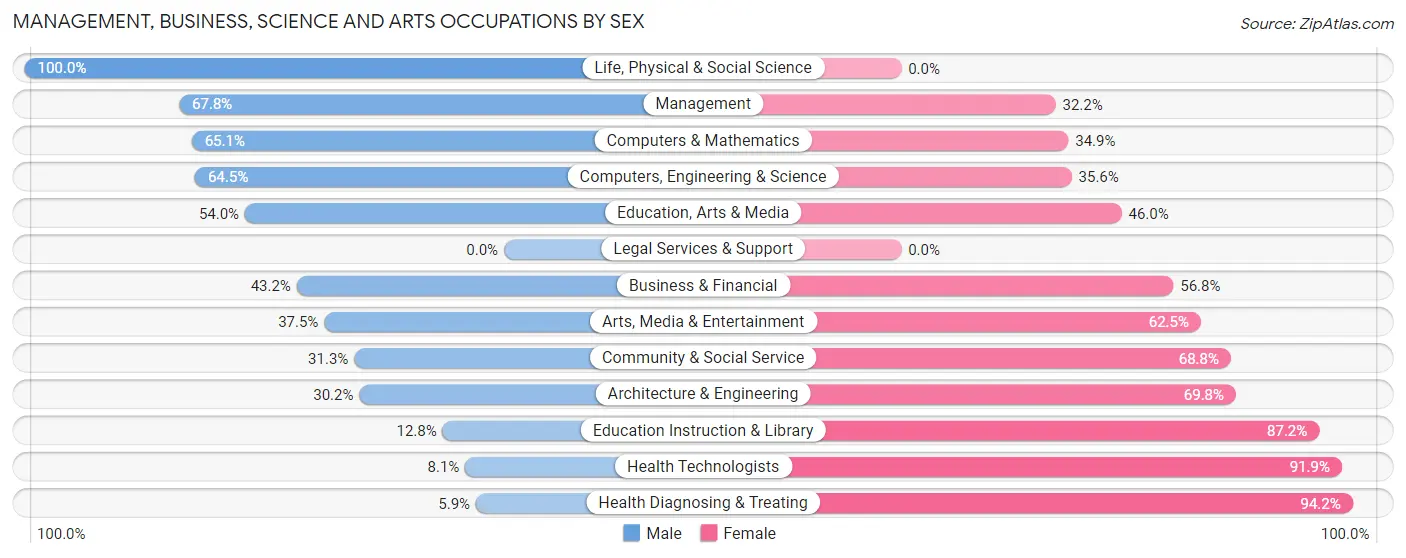
Management, Business, Science and Arts Occupations
The most common Management, Business, Science and Arts occupations in Grant County are Management (528 | 14.0%), Community & Social Service (288 | 7.6%), Computers, Engineering & Science (211 | 5.6%), Health Diagnosing & Treating (188 | 5.0%), and Education Instruction & Library (156 | 4.1%).

Management, Business, Science and Arts Occupations by Sex
Within the Management, Business, Science and Arts occupations in Grant County, the most male-oriented occupations are Life, Physical & Social Science (100.0%), Management (67.8%), and Computers & Mathematics (65.1%), while the most female-oriented occupations are Health Diagnosing & Treating (94.2%), Health Technologists (91.9%), and Education Instruction & Library (87.2%).
| Occupation | Male | Female |
| Management | 358 (67.8%) | 170 (32.2%) |
| Business & Financial | 32 (43.2%) | 42 (56.8%) |
| Computers, Engineering & Science | 136 (64.4%) | 75 (35.5%) |
| Computers & Mathematics | 71 (65.1%) | 38 (34.9%) |
| Architecture & Engineering | 16 (30.2%) | 37 (69.8%) |
| Life, Physical & Social Science | 49 (100.0%) | 0 (0.0%) |
| Community & Social Service | 90 (31.2%) | 198 (68.8%) |
| Education, Arts & Media | 67 (54.0%) | 57 (46.0%) |
| Legal Services & Support | 0 (0.0%) | 0 (0.0%) |
| Education Instruction & Library | 20 (12.8%) | 136 (87.2%) |
| Arts, Media & Entertainment | 3 (37.5%) | 5 (62.5%) |
| Health Diagnosing & Treating | 11 (5.9%) | 177 (94.2%) |
| Health Technologists | 11 (8.1%) | 125 (91.9%) |
| Total (Category) | 627 (48.6%) | 662 (51.4%) |
| Total (Overall) | 2,195 (58.1%) | 1,584 (41.9%) |
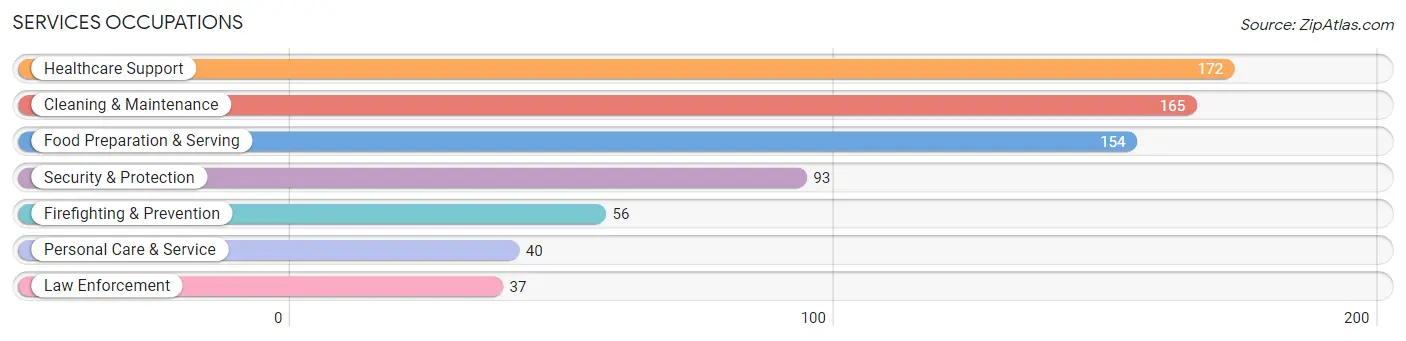
Services Occupations
The most common Services occupations in Grant County are Healthcare Support (172 | 4.5%), Cleaning & Maintenance (165 | 4.4%), Food Preparation & Serving (154 | 4.1%), Security & Protection (93 | 2.5%), and Firefighting & Prevention (56 | 1.5%).
Services Occupations by Sex
Within the Services occupations in Grant County, the most male-oriented occupations are Law Enforcement (100.0%), Security & Protection (97.9%), and Firefighting & Prevention (96.4%), while the most female-oriented occupations are Personal Care & Service (100.0%), Healthcare Support (80.2%), and Food Preparation & Serving (64.9%).
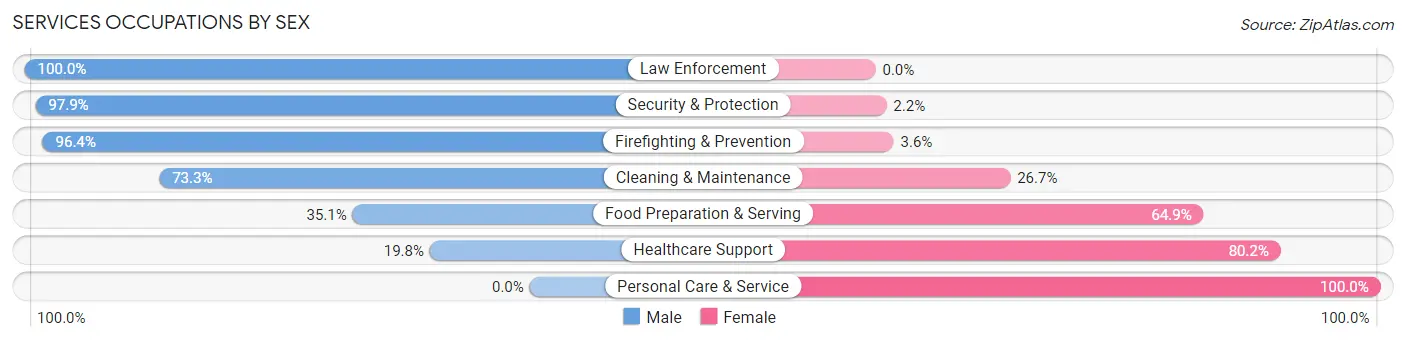
| Occupation | Male | Female |
| Healthcare Support | 34 (19.8%) | 138 (80.2%) |
| Security & Protection | 91 (97.9%) | 2 (2.1%) |
| Firefighting & Prevention | 54 (96.4%) | 2 (3.6%) |
| Law Enforcement | 37 (100.0%) | 0 (0.0%) |
| Food Preparation & Serving | 54 (35.1%) | 100 (64.9%) |
| Cleaning & Maintenance | 121 (73.3%) | 44 (26.7%) |
| Personal Care & Service | 0 (0.0%) | 40 (100.0%) |
| Total (Category) | 300 (48.1%) | 324 (51.9%) |
| Total (Overall) | 2,195 (58.1%) | 1,584 (41.9%) |
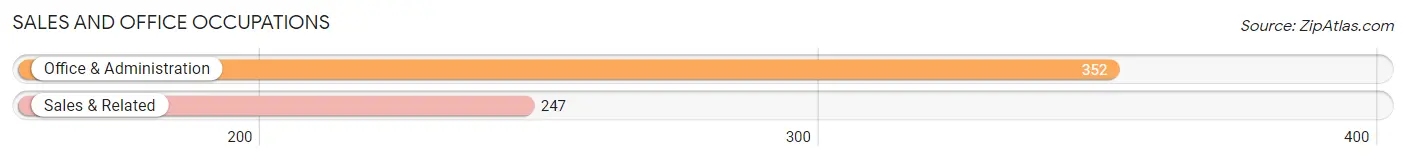
Sales and Office Occupations
The most common Sales and Office occupations in Grant County are Office & Administration (352 | 9.3%), and Sales & Related (247 | 6.5%).
Sales and Office Occupations by Sex
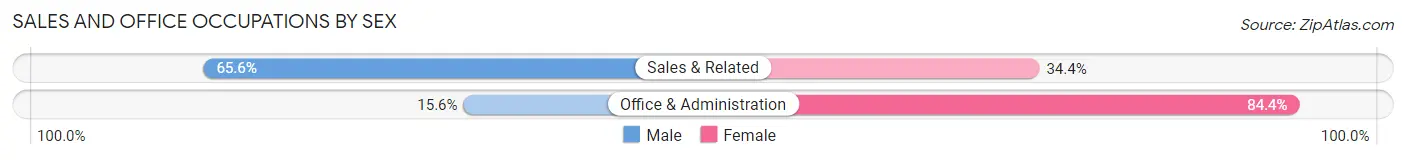
| Occupation | Male | Female |
| Sales & Related | 162 (65.6%) | 85 (34.4%) |
| Office & Administration | 55 (15.6%) | 297 (84.4%) |
| Total (Category) | 217 (36.2%) | 382 (63.8%) |
| Total (Overall) | 2,195 (58.1%) | 1,584 (41.9%) |
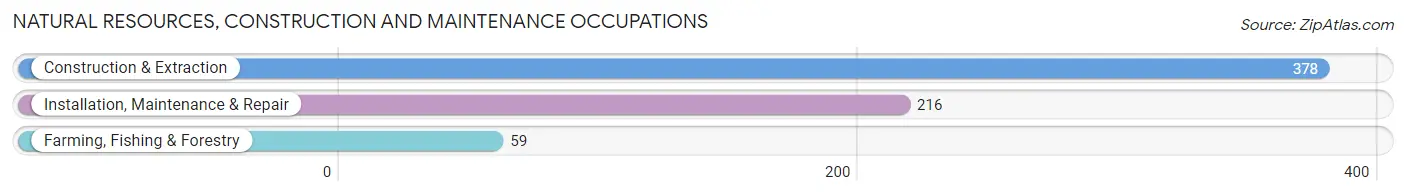
Natural Resources, Construction and Maintenance Occupations
The most common Natural Resources, Construction and Maintenance occupations in Grant County are Construction & Extraction (378 | 10.0%), Installation, Maintenance & Repair (216 | 5.7%), and Farming, Fishing & Forestry (59 | 1.6%).
Natural Resources, Construction and Maintenance Occupations by Sex
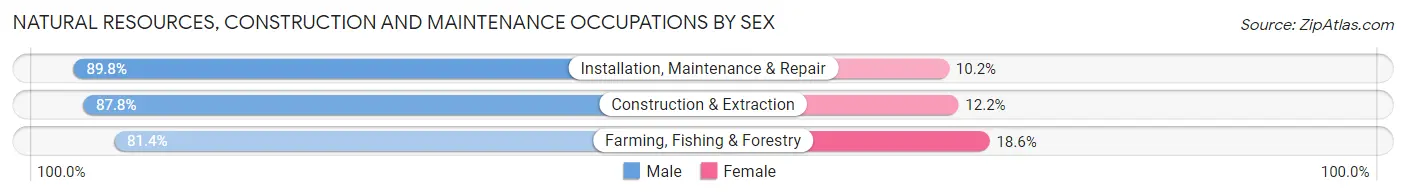
| Occupation | Male | Female |
| Farming, Fishing & Forestry | 48 (81.4%) | 11 (18.6%) |
| Construction & Extraction | 332 (87.8%) | 46 (12.2%) |
| Installation, Maintenance & Repair | 194 (89.8%) | 22 (10.2%) |
| Total (Category) | 574 (87.9%) | 79 (12.1%) |
| Total (Overall) | 2,195 (58.1%) | 1,584 (41.9%) |
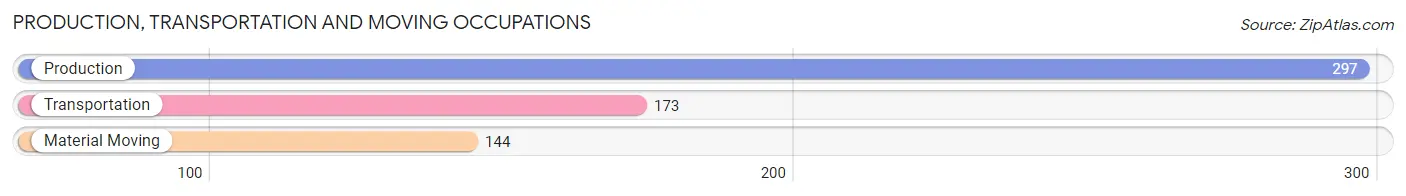
Production, Transportation and Moving Occupations
The most common Production, Transportation and Moving occupations in Grant County are Production (297 | 7.9%), Transportation (173 | 4.6%), and Material Moving (144 | 3.8%).
Production, Transportation and Moving Occupations by Sex
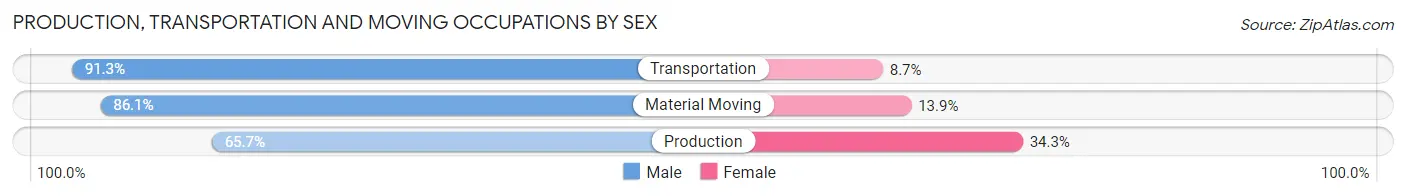
| Occupation | Male | Female |
| Production | 195 (65.7%) | 102 (34.3%) |
| Transportation | 158 (91.3%) | 15 (8.7%) |
| Material Moving | 124 (86.1%) | 20 (13.9%) |
| Total (Category) | 477 (77.7%) | 137 (22.3%) |
| Total (Overall) | 2,195 (58.1%) | 1,584 (41.9%) |
Employment Industries by Sex in Grant County
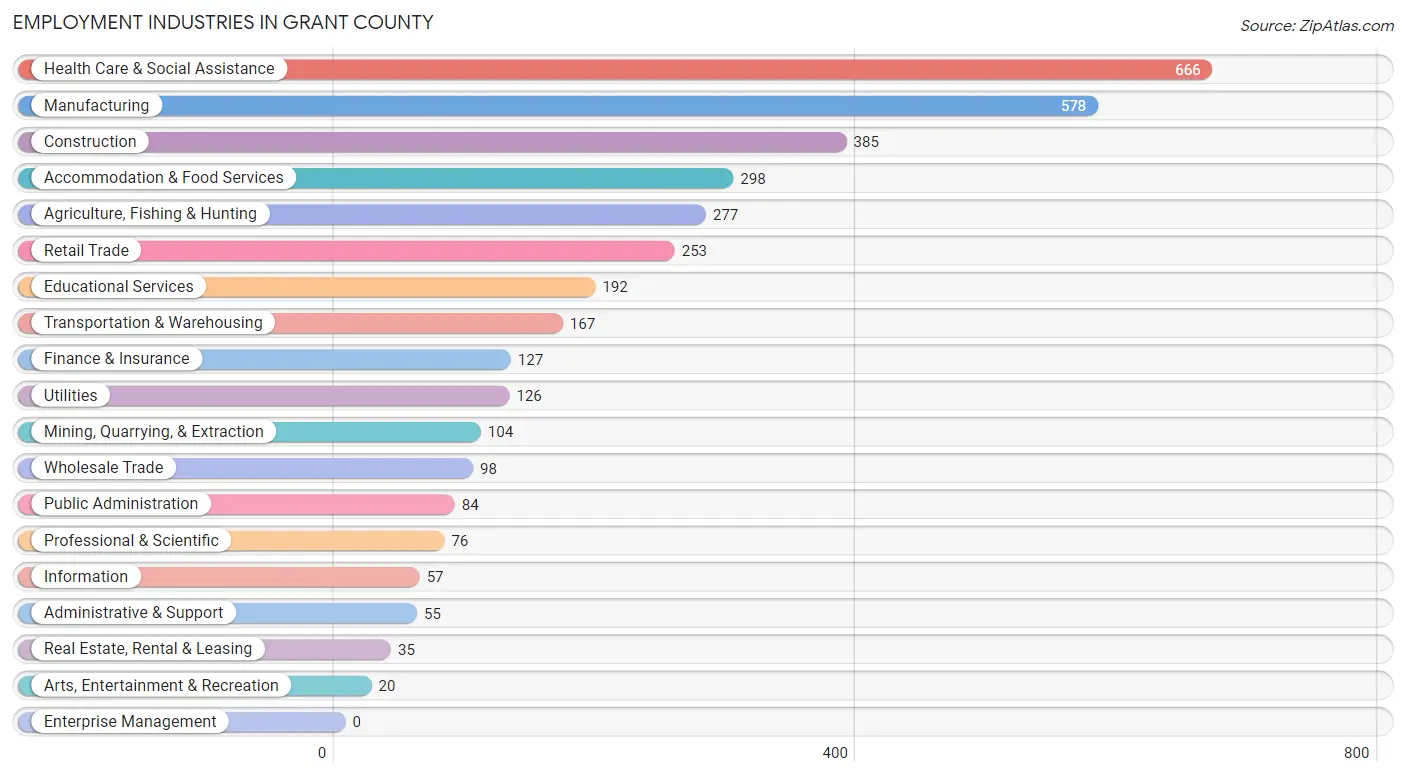
Employment Industries in Grant County
The major employment industries in Grant County include Health Care & Social Assistance (666 | 17.6%), Manufacturing (578 | 15.3%), Construction (385 | 10.2%), Accommodation & Food Services (298 | 7.9%), and Agriculture, Fishing & Hunting (277 | 7.3%).
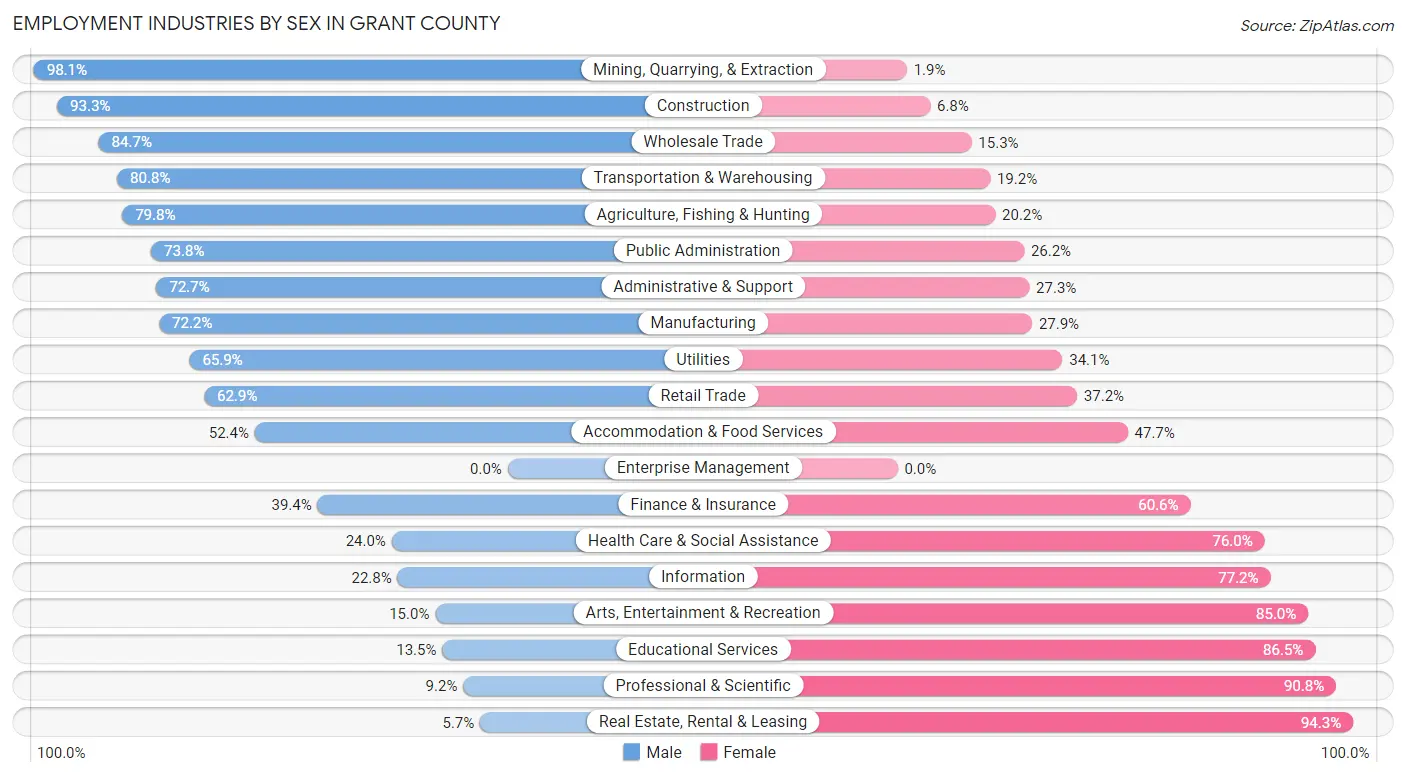
Employment Industries by Sex in Grant County
The Grant County industries that see more men than women are Mining, Quarrying, & Extraction (98.1%), Construction (93.2%), and Wholesale Trade (84.7%), whereas the industries that tend to have a higher number of women are Real Estate, Rental & Leasing (94.3%), Professional & Scientific (90.8%), and Educational Services (86.5%).
| Industry | Male | Female |
| Agriculture, Fishing & Hunting | 221 (79.8%) | 56 (20.2%) |
| Mining, Quarrying, & Extraction | 102 (98.1%) | 2 (1.9%) |
| Construction | 359 (93.2%) | 26 (6.8%) |
| Manufacturing | 417 (72.2%) | 161 (27.9%) |
| Wholesale Trade | 83 (84.7%) | 15 (15.3%) |
| Retail Trade | 159 (62.8%) | 94 (37.1%) |
| Transportation & Warehousing | 135 (80.8%) | 32 (19.2%) |
| Utilities | 83 (65.9%) | 43 (34.1%) |
| Information | 13 (22.8%) | 44 (77.2%) |
| Finance & Insurance | 50 (39.4%) | 77 (60.6%) |
| Real Estate, Rental & Leasing | 2 (5.7%) | 33 (94.3%) |
| Professional & Scientific | 7 (9.2%) | 69 (90.8%) |
| Enterprise Management | 0 (0.0%) | 0 (0.0%) |
| Administrative & Support | 40 (72.7%) | 15 (27.3%) |
| Educational Services | 26 (13.5%) | 166 (86.5%) |
| Health Care & Social Assistance | 160 (24.0%) | 506 (76.0%) |
| Arts, Entertainment & Recreation | 3 (15.0%) | 17 (85.0%) |
| Accommodation & Food Services | 156 (52.3%) | 142 (47.6%) |
| Public Administration | 62 (73.8%) | 22 (26.2%) |
| Total | 2,195 (58.1%) | 1,584 (41.9%) |
Education in Grant County
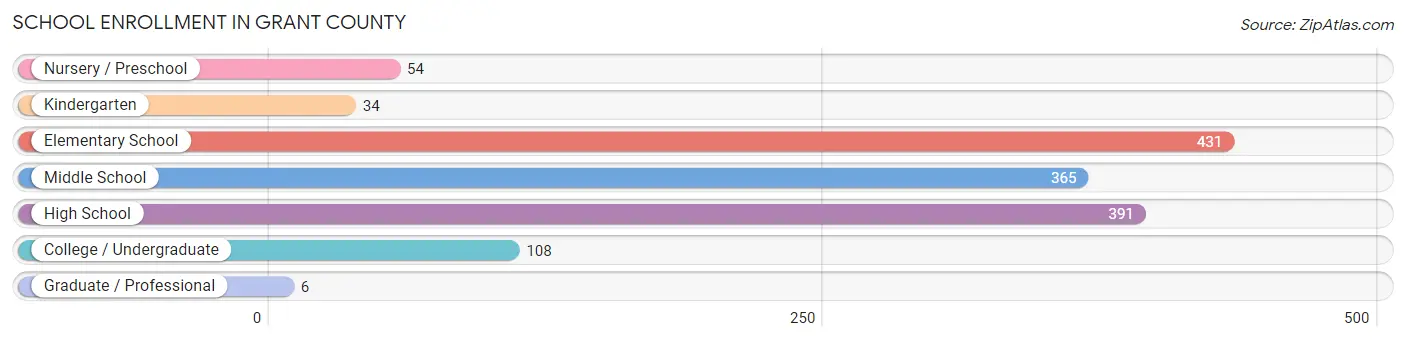
School Enrollment in Grant County
The most common levels of schooling among the 1,389 students in Grant County are elementary school (431 | 31.0%), high school (391 | 28.1%), and middle school (365 | 26.3%).
| School Level | # Students | % Students |
| Nursery / Preschool | 54 | 3.9% |
| Kindergarten | 34 | 2.5% |
| Elementary School | 431 | 31.0% |
| Middle School | 365 | 26.3% |
| High School | 391 | 28.1% |
| College / Undergraduate | 108 | 7.8% |
| Graduate / Professional | 6 | 0.4% |
| Total | 1,389 | 100.0% |
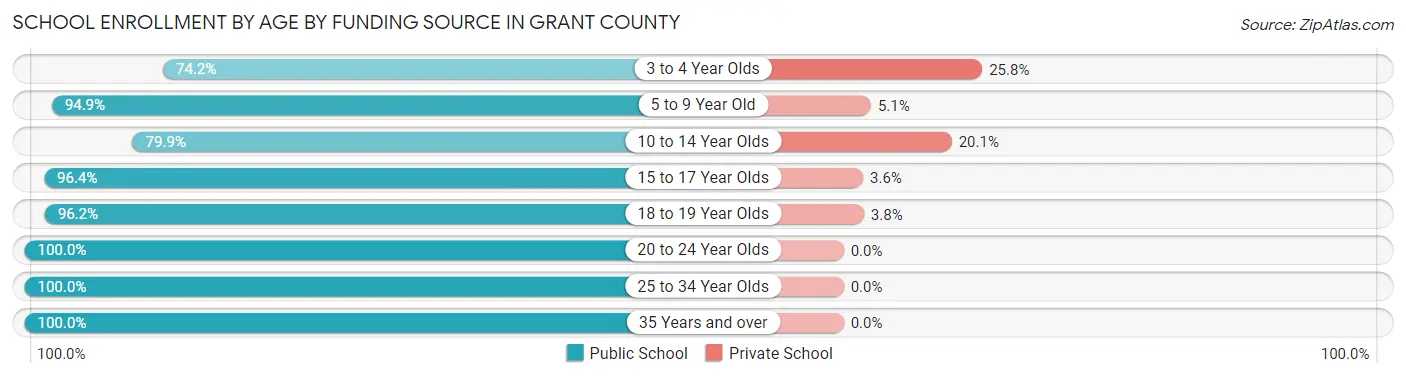
School Enrollment by Age by Funding Source in Grant County
Out of a total of 1,389 students who are enrolled in schools in Grant County, 133 (9.6%) attend a private institution, while the remaining 1,256 (90.4%) are enrolled in public schools. The age group of 3 to 4 year olds has the highest likelihood of being enrolled in private schools, with 8 (25.8% in the age bracket) enrolled. Conversely, the age group of 20 to 24 year olds has the lowest likelihood of being enrolled in a private school, with 58 (100.0% in the age bracket) attending a public institution.
| Age Bracket | Public School | Private School |
| 3 to 4 Year Olds | 23 (74.2%) | 8 (25.8%) |
| 5 to 9 Year Old | 430 (94.9%) | 23 (5.1%) |
| 10 to 14 Year Olds | 357 (79.9%) | 90 (20.1%) |
| 15 to 17 Year Olds | 266 (96.4%) | 10 (3.6%) |
| 18 to 19 Year Olds | 51 (96.2%) | 2 (3.8%) |
| 20 to 24 Year Olds | 58 (100.0%) | 0 (0.0%) |
| 25 to 34 Year Olds | 16 (100.0%) | 0 (0.0%) |
| 35 Years and over | 55 (100.0%) | 0 (0.0%) |
| Total | 1,256 (90.4%) | 133 (9.6%) |
Educational Attainment by Field of Study in Grant County
Education (350 | 24.0%), engineering (253 | 17.3%), bio, nature & agricultural (171 | 11.7%), business (122 | 8.4%), and psychology (121 | 8.3%) are the most common fields of study among 1,460 individuals in Grant County who have obtained a bachelor's degree or higher.
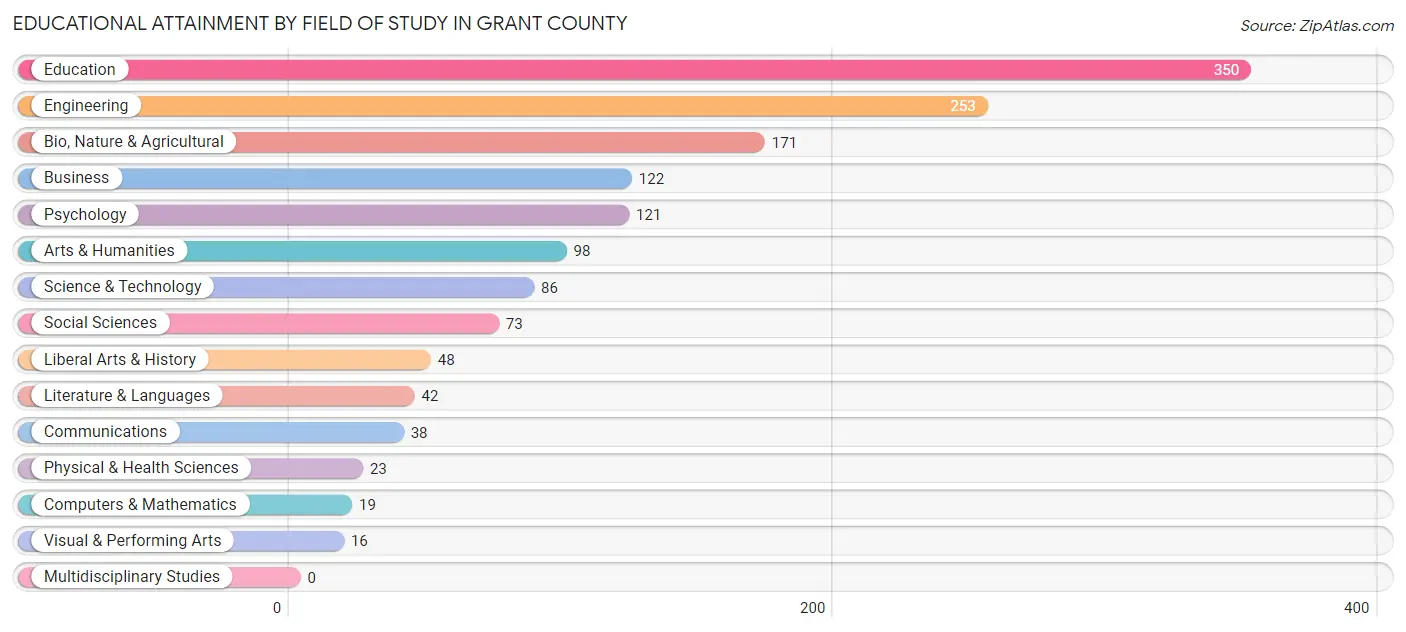
| Field of Study | # Graduates | % Graduates |
| Computers & Mathematics | 19 | 1.3% |
| Bio, Nature & Agricultural | 171 | 11.7% |
| Physical & Health Sciences | 23 | 1.6% |
| Psychology | 121 | 8.3% |
| Social Sciences | 73 | 5.0% |
| Engineering | 253 | 17.3% |
| Multidisciplinary Studies | 0 | 0.0% |
| Science & Technology | 86 | 5.9% |
| Business | 122 | 8.4% |
| Education | 350 | 24.0% |
| Literature & Languages | 42 | 2.9% |
| Liberal Arts & History | 48 | 3.3% |
| Visual & Performing Arts | 16 | 1.1% |
| Communications | 38 | 2.6% |
| Arts & Humanities | 98 | 6.7% |
| Total | 1,460 | 100.0% |
Transportation & Commute in Grant County
Vehicle Availability by Sex in Grant County
The most prevalent vehicle ownership categories in Grant County are males with 2 vehicles (728, accounting for 35.1%) and females with 2 vehicles (589, making up 46.2%).
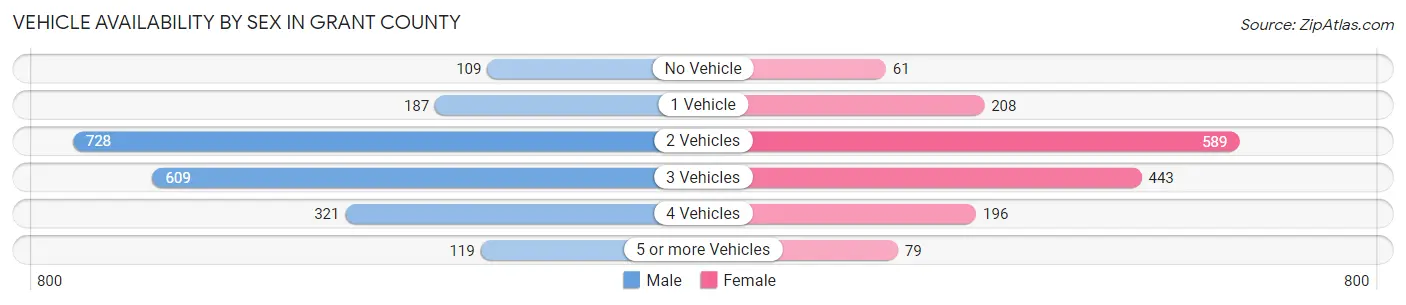
| Vehicles Available | Male | Female |
| No Vehicle | 109 (5.3%) | 61 (3.9%) |
| 1 Vehicle | 187 (9.0%) | 208 (13.2%) |
| 2 Vehicles | 728 (35.1%) | 589 (37.4%) |
| 3 Vehicles | 609 (29.4%) | 443 (28.1%) |
| 4 Vehicles | 321 (15.5%) | 196 (12.4%) |
| 5 or more Vehicles | 119 (5.7%) | 79 (5.0%) |
| Total | 2,073 (100.0%) | 1,576 (100.0%) |
Commute Time in Grant County
The most frequently occuring commute durations in Grant County are 5 to 9 minutes (1,050 commuters, 30.6%), 15 to 19 minutes (539 commuters, 15.7%), and 10 to 14 minutes (526 commuters, 15.3%).
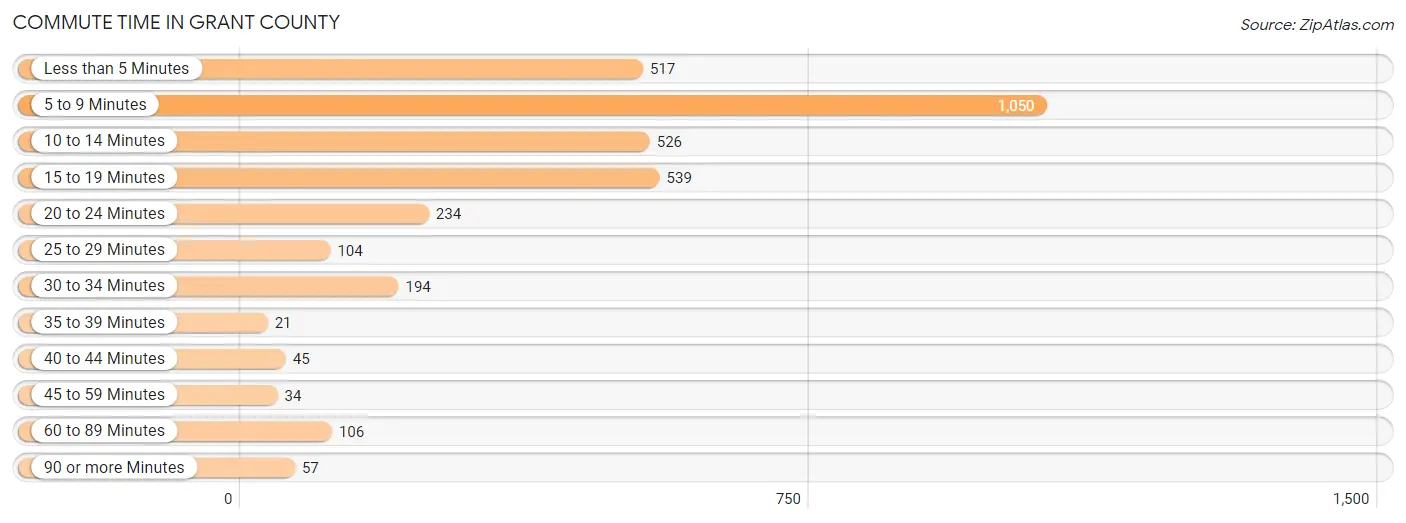
| Commute Time | # Commuters | % Commuters |
| Less than 5 Minutes | 517 | 15.1% |
| 5 to 9 Minutes | 1,050 | 30.6% |
| 10 to 14 Minutes | 526 | 15.3% |
| 15 to 19 Minutes | 539 | 15.7% |
| 20 to 24 Minutes | 234 | 6.8% |
| 25 to 29 Minutes | 104 | 3.0% |
| 30 to 34 Minutes | 194 | 5.7% |
| 35 to 39 Minutes | 21 | 0.6% |
| 40 to 44 Minutes | 45 | 1.3% |
| 45 to 59 Minutes | 34 | 1.0% |
| 60 to 89 Minutes | 106 | 3.1% |
| 90 or more Minutes | 57 | 1.7% |
Commute Time by Sex in Grant County
The most common commute times in Grant County are 5 to 9 minutes (656 commuters, 32.8%) for males and 5 to 9 minutes (394 commuters, 27.6%) for females.
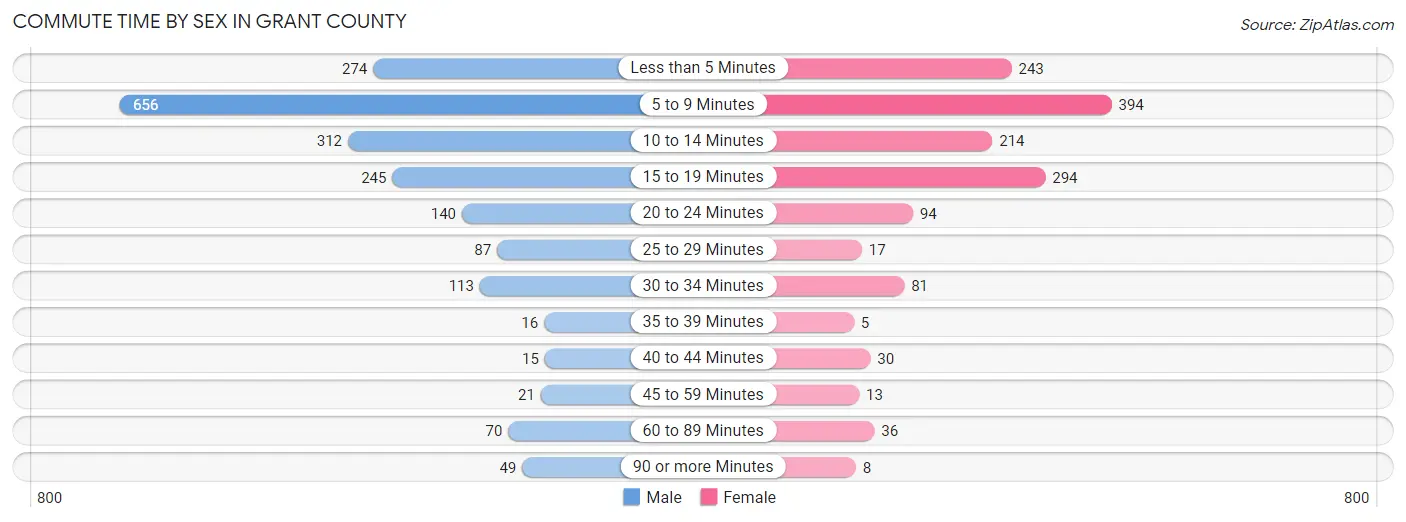
| Commute Time | Male | Female |
| Less than 5 Minutes | 274 (13.7%) | 243 (17.0%) |
| 5 to 9 Minutes | 656 (32.8%) | 394 (27.6%) |
| 10 to 14 Minutes | 312 (15.6%) | 214 (15.0%) |
| 15 to 19 Minutes | 245 (12.3%) | 294 (20.6%) |
| 20 to 24 Minutes | 140 (7.0%) | 94 (6.6%) |
| 25 to 29 Minutes | 87 (4.3%) | 17 (1.2%) |
| 30 to 34 Minutes | 113 (5.7%) | 81 (5.7%) |
| 35 to 39 Minutes | 16 (0.8%) | 5 (0.4%) |
| 40 to 44 Minutes | 15 (0.7%) | 30 (2.1%) |
| 45 to 59 Minutes | 21 (1.1%) | 13 (0.9%) |
| 60 to 89 Minutes | 70 (3.5%) | 36 (2.5%) |
| 90 or more Minutes | 49 (2.5%) | 8 (0.6%) |
Time of Departure to Work by Sex in Grant County
The most frequent times of departure to work in Grant County are 7:30 AM to 7:59 AM (379, 19.0%) for males and 7:30 AM to 7:59 AM (311, 21.8%) for females.
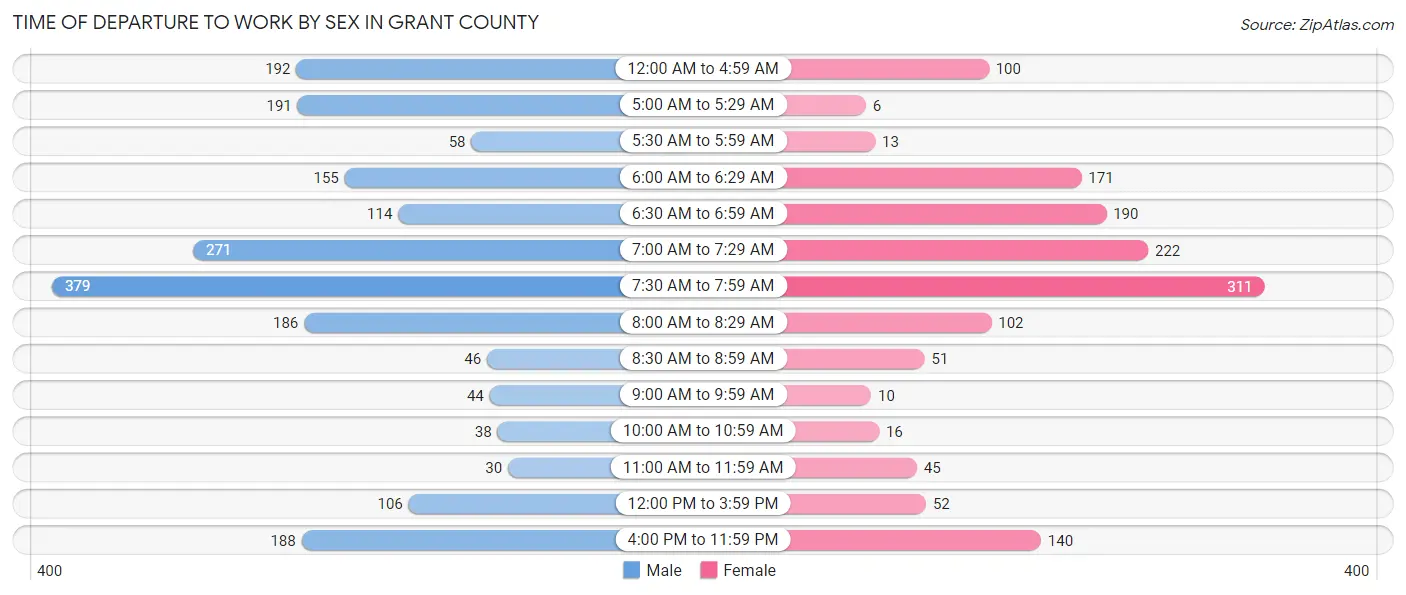
| Time of Departure | Male | Female |
| 12:00 AM to 4:59 AM | 192 (9.6%) | 100 (7.0%) |
| 5:00 AM to 5:29 AM | 191 (9.6%) | 6 (0.4%) |
| 5:30 AM to 5:59 AM | 58 (2.9%) | 13 (0.9%) |
| 6:00 AM to 6:29 AM | 155 (7.8%) | 171 (12.0%) |
| 6:30 AM to 6:59 AM | 114 (5.7%) | 190 (13.3%) |
| 7:00 AM to 7:29 AM | 271 (13.6%) | 222 (15.5%) |
| 7:30 AM to 7:59 AM | 379 (19.0%) | 311 (21.8%) |
| 8:00 AM to 8:29 AM | 186 (9.3%) | 102 (7.1%) |
| 8:30 AM to 8:59 AM | 46 (2.3%) | 51 (3.6%) |
| 9:00 AM to 9:59 AM | 44 (2.2%) | 10 (0.7%) |
| 10:00 AM to 10:59 AM | 38 (1.9%) | 16 (1.1%) |
| 11:00 AM to 11:59 AM | 30 (1.5%) | 45 (3.2%) |
| 12:00 PM to 3:59 PM | 106 (5.3%) | 52 (3.6%) |
| 4:00 PM to 11:59 PM | 188 (9.4%) | 140 (9.8%) |
| Total | 1,998 (100.0%) | 1,429 (100.0%) |
Housing Occupancy in Grant County
Occupancy by Ownership in Grant County
Of the total 3,031 dwellings in Grant County, owner-occupied units account for 2,469 (81.5%), while renter-occupied units make up 562 (18.5%).
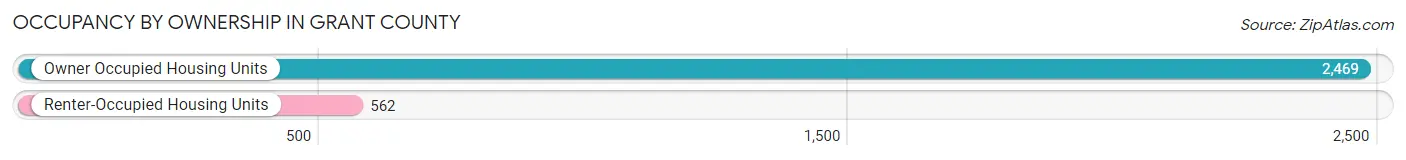
| Occupancy | # Housing Units | % Housing Units |
| Owner Occupied Housing Units | 2,469 | 81.5% |
| Renter-Occupied Housing Units | 562 | 18.5% |
| Total Occupied Housing Units | 3,031 | 100.0% |
Occupancy by Household Size in Grant County
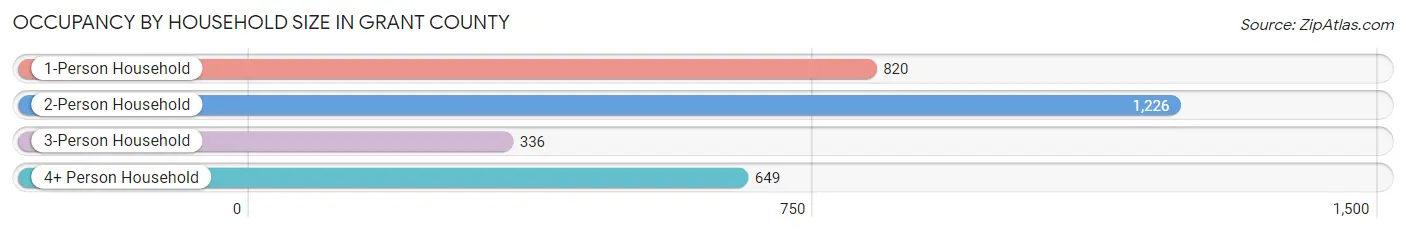
| Household Size | # Housing Units | % Housing Units |
| 1-Person Household | 820 | 27.1% |
| 2-Person Household | 1,226 | 40.5% |
| 3-Person Household | 336 | 11.1% |
| 4+ Person Household | 649 | 21.4% |
| Total Housing Units | 3,031 | 100.0% |
Occupancy by Ownership by Household Size in Grant County
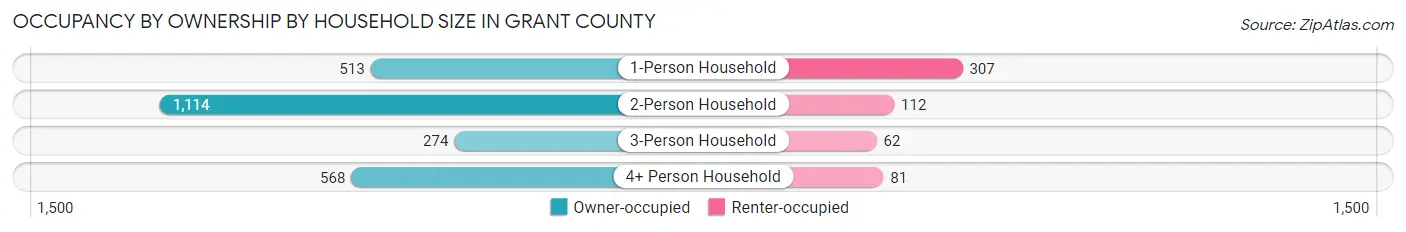
| Household Size | Owner-occupied | Renter-occupied |
| 1-Person Household | 513 (62.6%) | 307 (37.4%) |
| 2-Person Household | 1,114 (90.9%) | 112 (9.1%) |
| 3-Person Household | 274 (81.6%) | 62 (18.4%) |
| 4+ Person Household | 568 (87.5%) | 81 (12.5%) |
| Total Housing Units | 2,469 (81.5%) | 562 (18.5%) |
Occupancy by Educational Attainment in Grant County
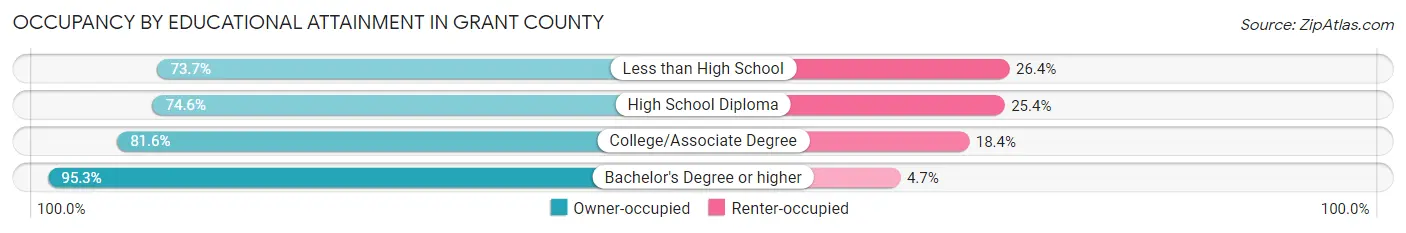
| Household Size | Owner-occupied | Renter-occupied |
| Less than High School | 204 (73.7%) | 73 (26.4%) |
| High School Diploma | 867 (74.6%) | 295 (25.4%) |
| College/Associate Degree | 711 (81.6%) | 160 (18.4%) |
| Bachelor's Degree or higher | 687 (95.3%) | 34 (4.7%) |
Occupancy by Age of Householder in Grant County
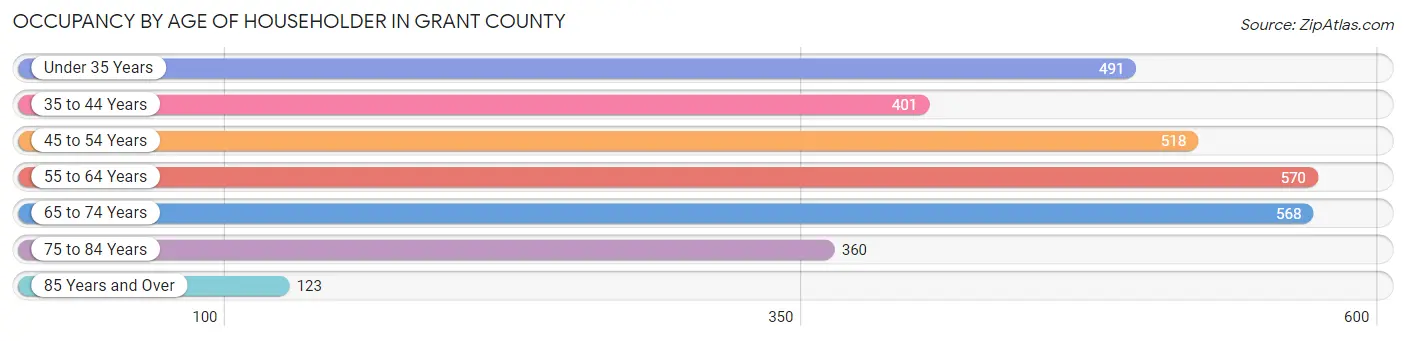
| Age Bracket | # Households | % Households |
| Under 35 Years | 491 | 16.2% |
| 35 to 44 Years | 401 | 13.2% |
| 45 to 54 Years | 518 | 17.1% |
| 55 to 64 Years | 570 | 18.8% |
| 65 to 74 Years | 568 | 18.7% |
| 75 to 84 Years | 360 | 11.9% |
| 85 Years and Over | 123 | 4.1% |
| Total | 3,031 | 100.0% |
Housing Finances in Grant County
Median Income by Occupancy in Grant County
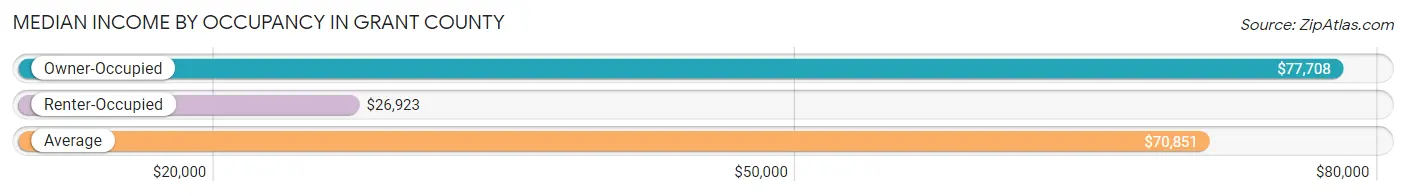
| Occupancy Type | # Households | Median Income |
| Owner-Occupied | 2,469 (81.5%) | $77,708 |
| Renter-Occupied | 562 (18.5%) | $26,923 |
| Average | 3,031 (100.0%) | $70,851 |
Occupancy by Householder Income Bracket in Grant County
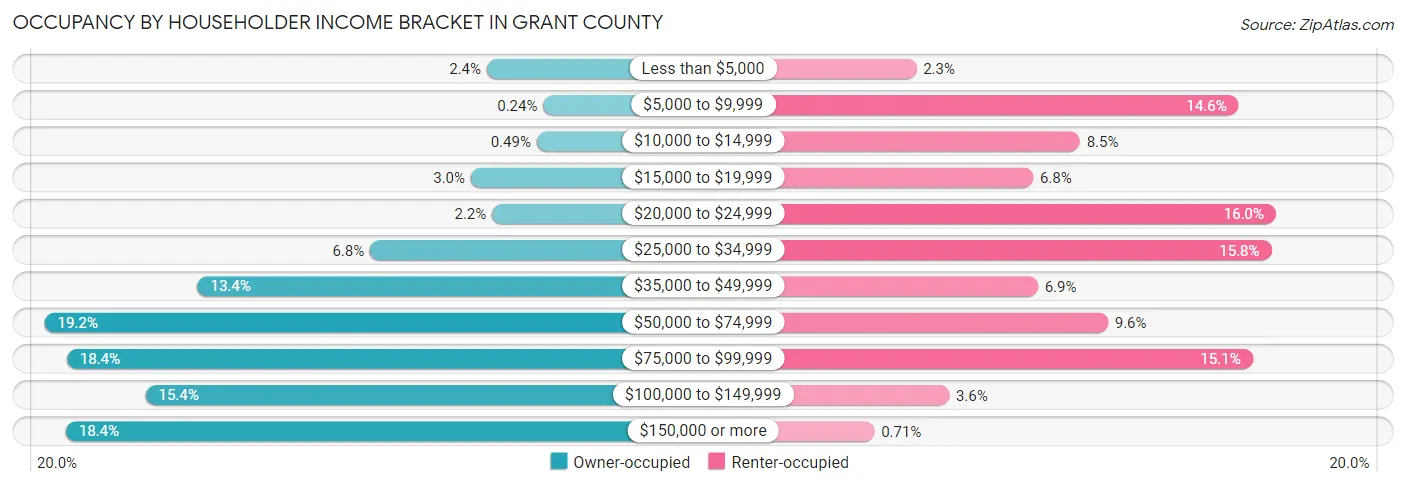
| Income Bracket | Owner-occupied | Renter-occupied |
| Less than $5,000 | 59 (2.4%) | 13 (2.3%) |
| $5,000 to $9,999 | 6 (0.2%) | 82 (14.6%) |
| $10,000 to $14,999 | 12 (0.5%) | 48 (8.5%) |
| $15,000 to $19,999 | 74 (3.0%) | 38 (6.8%) |
| $20,000 to $24,999 | 54 (2.2%) | 90 (16.0%) |
| $25,000 to $34,999 | 169 (6.8%) | 89 (15.8%) |
| $35,000 to $49,999 | 331 (13.4%) | 39 (6.9%) |
| $50,000 to $74,999 | 475 (19.2%) | 54 (9.6%) |
| $75,000 to $99,999 | 454 (18.4%) | 85 (15.1%) |
| $100,000 to $149,999 | 380 (15.4%) | 20 (3.6%) |
| $150,000 or more | 455 (18.4%) | 4 (0.7%) |
| Total | 2,469 (100.0%) | 562 (100.0%) |
Monthly Housing Cost Tiers in Grant County
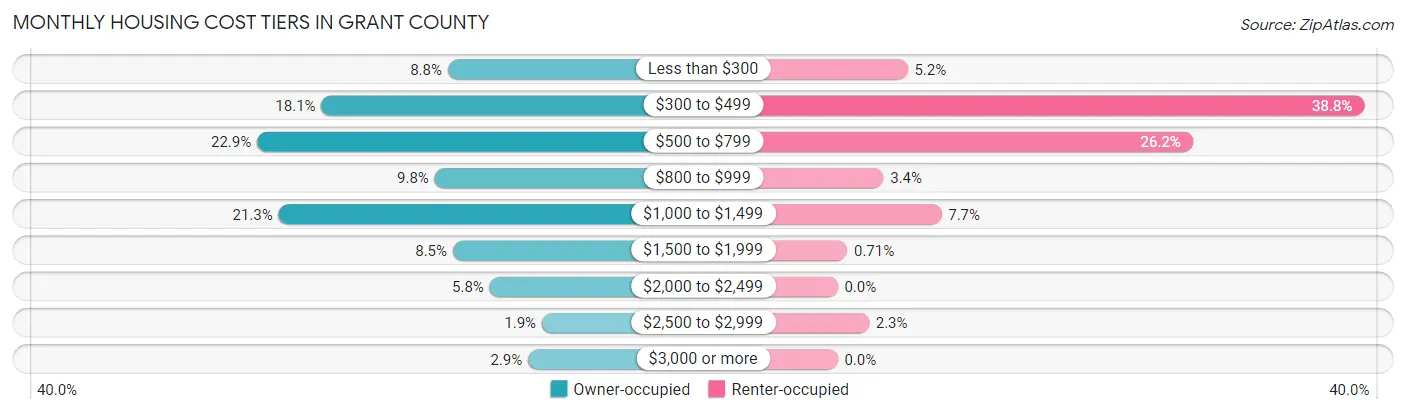
| Monthly Cost | Owner-occupied | Renter-occupied |
| Less than $300 | 218 (8.8%) | 29 (5.2%) |
| $300 to $499 | 448 (18.1%) | 218 (38.8%) |
| $500 to $799 | 565 (22.9%) | 147 (26.2%) |
| $800 to $999 | 242 (9.8%) | 19 (3.4%) |
| $1,000 to $1,499 | 526 (21.3%) | 43 (7.6%) |
| $1,500 to $1,999 | 209 (8.5%) | 4 (0.7%) |
| $2,000 to $2,499 | 142 (5.8%) | 0 (0.0%) |
| $2,500 to $2,999 | 47 (1.9%) | 13 (2.3%) |
| $3,000 or more | 72 (2.9%) | 0 (0.0%) |
| Total | 2,469 (100.0%) | 562 (100.0%) |
Physical Housing Characteristics in Grant County
Housing Structures in Grant County
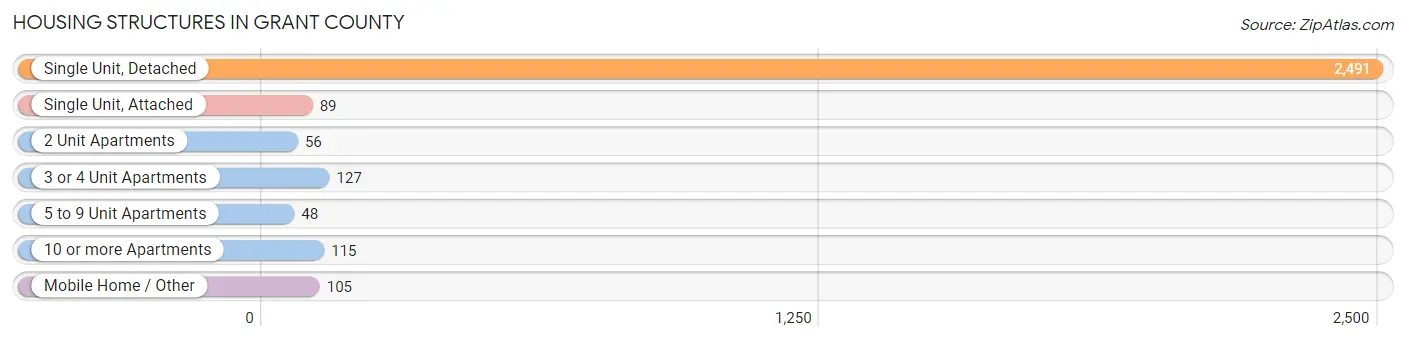
| Structure Type | # Housing Units | % Housing Units |
| Single Unit, Detached | 2,491 | 82.2% |
| Single Unit, Attached | 89 | 2.9% |
| 2 Unit Apartments | 56 | 1.8% |
| 3 or 4 Unit Apartments | 127 | 4.2% |
| 5 to 9 Unit Apartments | 48 | 1.6% |
| 10 or more Apartments | 115 | 3.8% |
| Mobile Home / Other | 105 | 3.5% |
| Total | 3,031 | 100.0% |
Housing Structures by Occupancy in Grant County
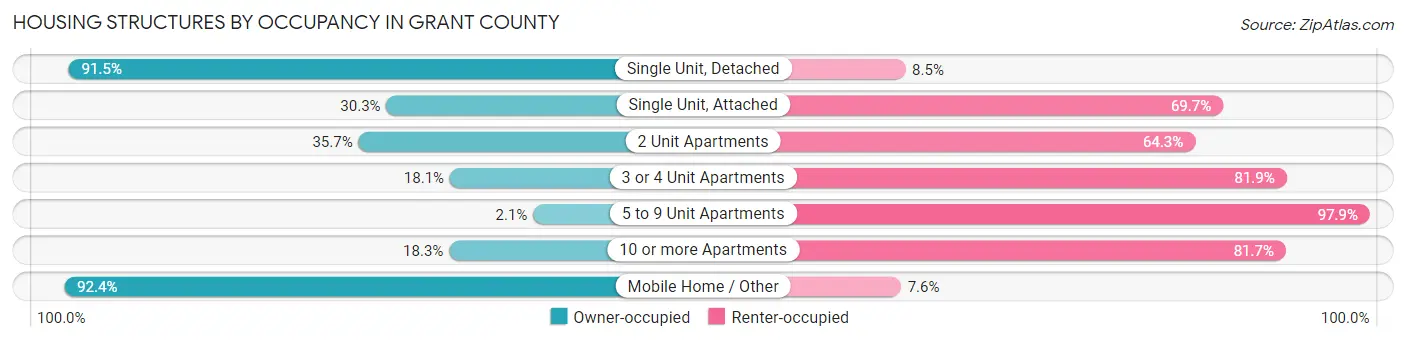
| Structure Type | Owner-occupied | Renter-occupied |
| Single Unit, Detached | 2,280 (91.5%) | 211 (8.5%) |
| Single Unit, Attached | 27 (30.3%) | 62 (69.7%) |
| 2 Unit Apartments | 20 (35.7%) | 36 (64.3%) |
| 3 or 4 Unit Apartments | 23 (18.1%) | 104 (81.9%) |
| 5 to 9 Unit Apartments | 1 (2.1%) | 47 (97.9%) |
| 10 or more Apartments | 21 (18.3%) | 94 (81.7%) |
| Mobile Home / Other | 97 (92.4%) | 8 (7.6%) |
| Total | 2,469 (81.5%) | 562 (18.5%) |
Housing Structures by Number of Rooms in Grant County
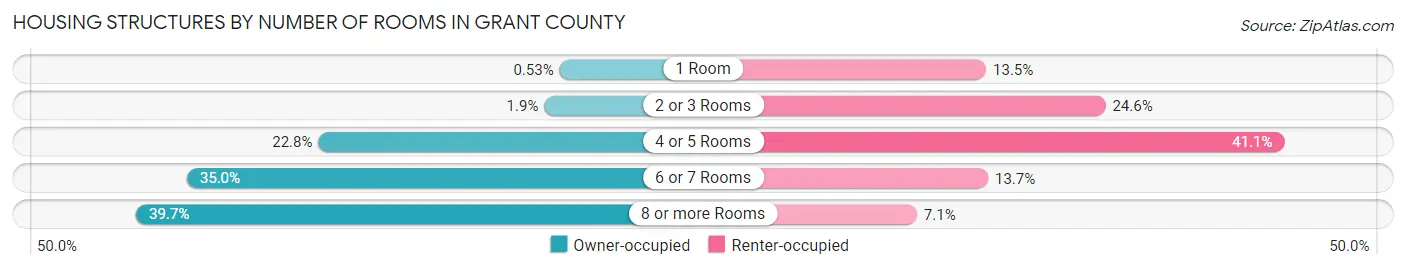
| Number of Rooms | Owner-occupied | Renter-occupied |
| 1 Room | 13 (0.5%) | 76 (13.5%) |
| 2 or 3 Rooms | 48 (1.9%) | 138 (24.6%) |
| 4 or 5 Rooms | 564 (22.8%) | 231 (41.1%) |
| 6 or 7 Rooms | 864 (35.0%) | 77 (13.7%) |
| 8 or more Rooms | 980 (39.7%) | 40 (7.1%) |
| Total | 2,469 (100.0%) | 562 (100.0%) |
Housing Structure by Heating Type in Grant County
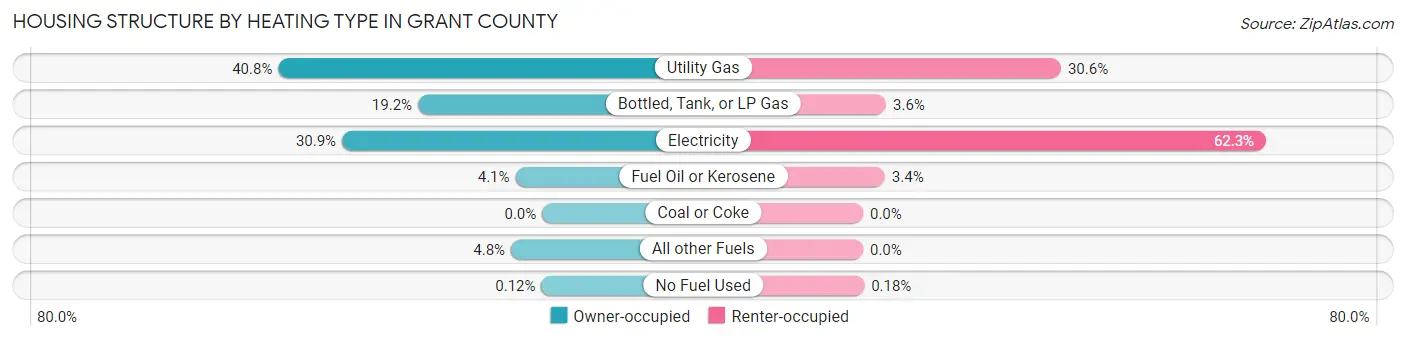
| Heating Type | Owner-occupied | Renter-occupied |
| Utility Gas | 1,007 (40.8%) | 172 (30.6%) |
| Bottled, Tank, or LP Gas | 474 (19.2%) | 20 (3.6%) |
| Electricity | 764 (30.9%) | 350 (62.3%) |
| Fuel Oil or Kerosene | 102 (4.1%) | 19 (3.4%) |
| Coal or Coke | 0 (0.0%) | 0 (0.0%) |
| All other Fuels | 119 (4.8%) | 0 (0.0%) |
| No Fuel Used | 3 (0.1%) | 1 (0.2%) |
| Total | 2,469 (100.0%) | 562 (100.0%) |
Household Vehicle Usage in Grant County
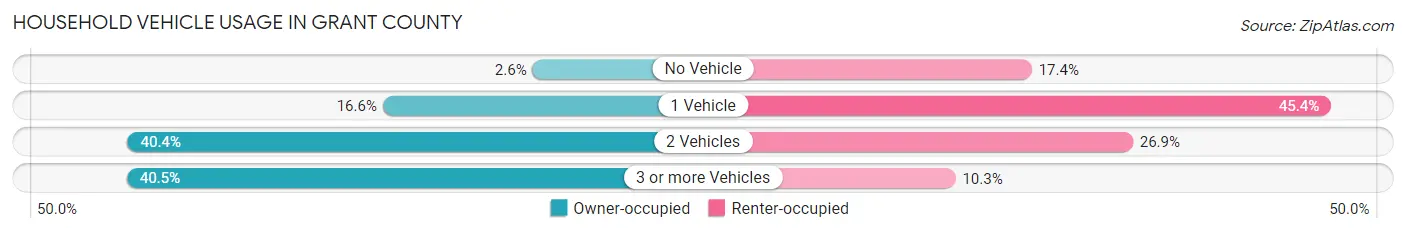
| Vehicles per Household | Owner-occupied | Renter-occupied |
| No Vehicle | 64 (2.6%) | 98 (17.4%) |
| 1 Vehicle | 409 (16.6%) | 255 (45.4%) |
| 2 Vehicles | 997 (40.4%) | 151 (26.9%) |
| 3 or more Vehicles | 999 (40.5%) | 58 (10.3%) |
| Total | 2,469 (100.0%) | 562 (100.0%) |
Real Estate & Mortgages in Grant County
Real Estate and Mortgage Overview in Grant County
| Characteristic | Without Mortgage | With Mortgage |
| Housing Units | 1,221 | 1,248 |
| Median Property Value | $155,900 | $185,000 |
| Median Household Income | $72,909 | $299 |
| Monthly Housing Costs | $495 | $61 |
| Real Estate Taxes | $1,522 | $4 |
Property Value by Mortgage Status in Grant County
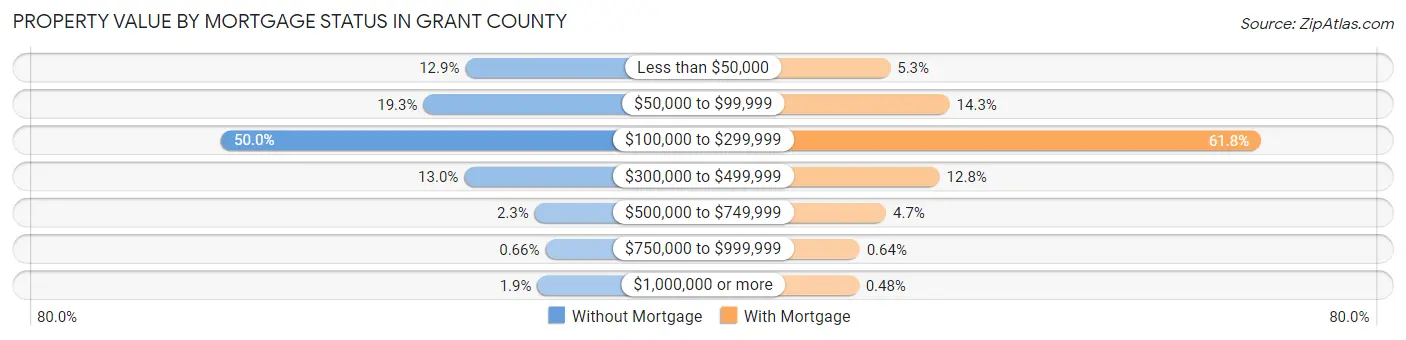
| Property Value | Without Mortgage | With Mortgage |
| Less than $50,000 | 157 (12.9%) | 66 (5.3%) |
| $50,000 to $99,999 | 235 (19.3%) | 179 (14.3%) |
| $100,000 to $299,999 | 611 (50.0%) | 771 (61.8%) |
| $300,000 to $499,999 | 159 (13.0%) | 160 (12.8%) |
| $500,000 to $749,999 | 28 (2.3%) | 58 (4.6%) |
| $750,000 to $999,999 | 8 (0.7%) | 8 (0.6%) |
| $1,000,000 or more | 23 (1.9%) | 6 (0.5%) |
| Total | 1,221 (100.0%) | 1,248 (100.0%) |
Household Income by Mortgage Status in Grant County
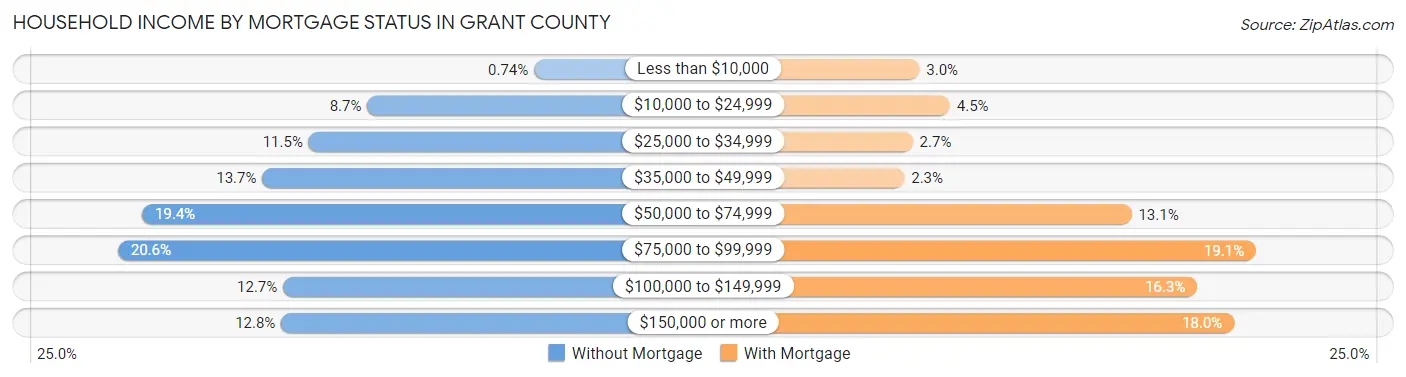
| Household Income | Without Mortgage | With Mortgage |
| Less than $10,000 | 9 (0.7%) | 38 (3.0%) |
| $10,000 to $24,999 | 106 (8.7%) | 56 (4.5%) |
| $25,000 to $34,999 | 140 (11.5%) | 34 (2.7%) |
| $35,000 to $49,999 | 167 (13.7%) | 29 (2.3%) |
| $50,000 to $74,999 | 237 (19.4%) | 164 (13.1%) |
| $75,000 to $99,999 | 251 (20.6%) | 238 (19.1%) |
| $100,000 to $149,999 | 155 (12.7%) | 203 (16.3%) |
| $150,000 or more | 156 (12.8%) | 225 (18.0%) |
| Total | 1,221 (100.0%) | 1,248 (100.0%) |
Property Value to Household Income Ratio in Grant County
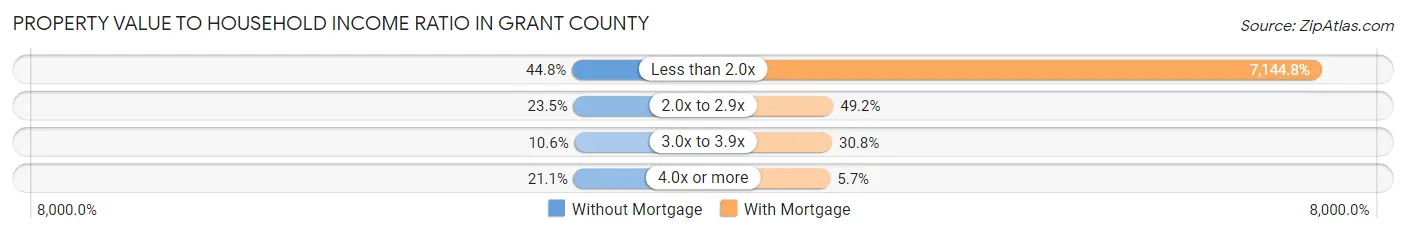
| Value-to-Income Ratio | Without Mortgage | With Mortgage |
| Less than 2.0x | 547 (44.8%) | 89,167 (7,144.8%) |
| 2.0x to 2.9x | 287 (23.5%) | 614 (49.2%) |
| 3.0x to 3.9x | 129 (10.6%) | 384 (30.8%) |
| 4.0x or more | 258 (21.1%) | 71 (5.7%) |
| Total | 1,221 (100.0%) | 1,248 (100.0%) |
Real Estate Taxes by Mortgage Status in Grant County
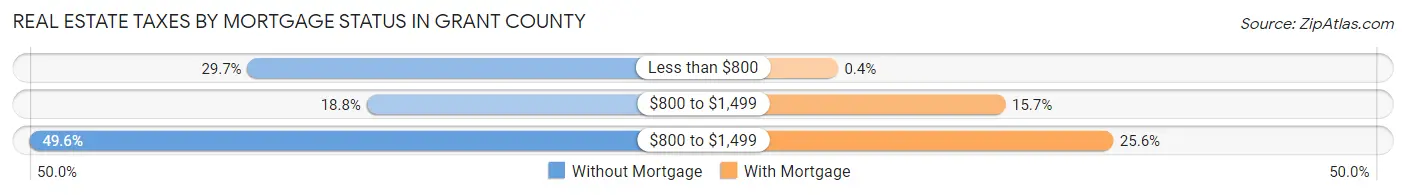
| Property Taxes | Without Mortgage | With Mortgage |
| Less than $800 | 362 (29.6%) | 5 (0.4%) |
| $800 to $1,499 | 229 (18.8%) | 196 (15.7%) |
| $800 to $1,499 | 605 (49.5%) | 319 (25.6%) |
| Total | 1,221 (100.0%) | 1,248 (100.0%) |
Health & Disability in Grant County
Health Insurance Coverage by Age in Grant County
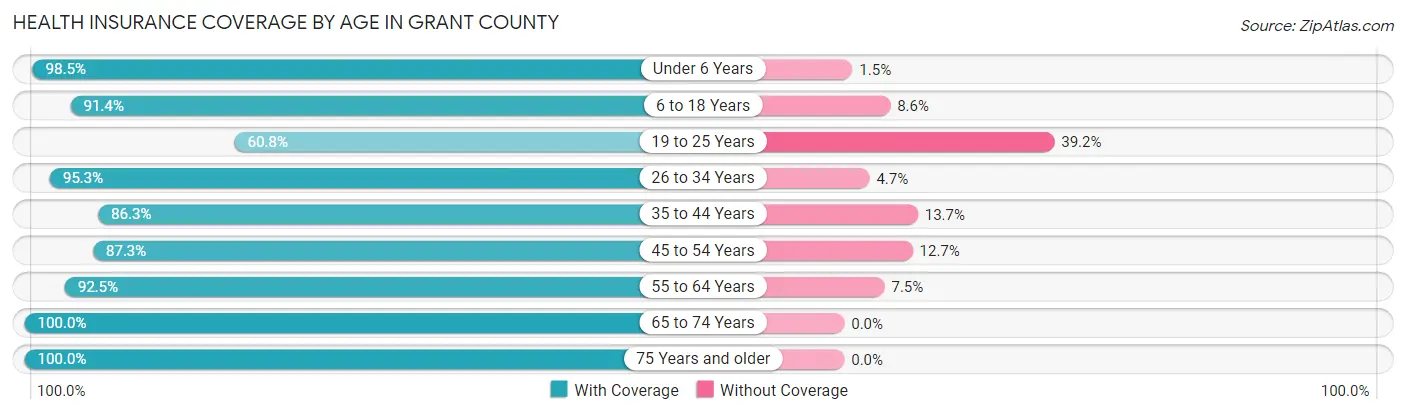
| Age Bracket | With Coverage | Without Coverage |
| Under 6 Years | 458 (98.5%) | 7 (1.5%) |
| 6 to 18 Years | 1,152 (91.4%) | 108 (8.6%) |
| 19 to 25 Years | 348 (60.8%) | 224 (39.2%) |
| 26 to 34 Years | 730 (95.3%) | 36 (4.7%) |
| 35 to 44 Years | 661 (86.3%) | 105 (13.7%) |
| 45 to 54 Years | 692 (87.3%) | 101 (12.7%) |
| 55 to 64 Years | 1,071 (92.5%) | 87 (7.5%) |
| 65 to 74 Years | 904 (100.0%) | 0 (0.0%) |
| 75 Years and older | 750 (100.0%) | 0 (0.0%) |
| Total | 6,766 (91.0%) | 668 (9.0%) |
Health Insurance Coverage by Citizenship Status in Grant County
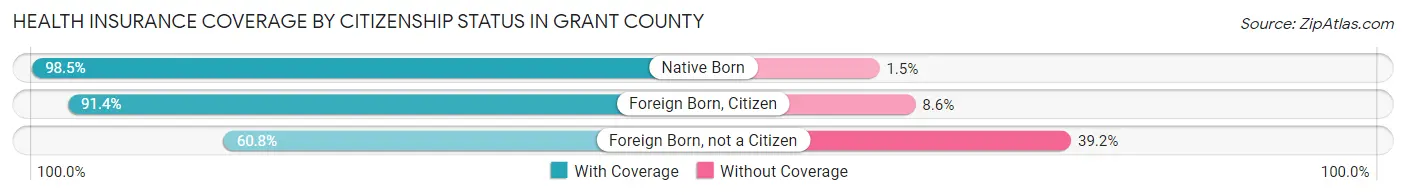
| Citizenship Status | With Coverage | Without Coverage |
| Native Born | 458 (98.5%) | 7 (1.5%) |
| Foreign Born, Citizen | 1,152 (91.4%) | 108 (8.6%) |
| Foreign Born, not a Citizen | 348 (60.8%) | 224 (39.2%) |
Health Insurance Coverage by Household Income in Grant County
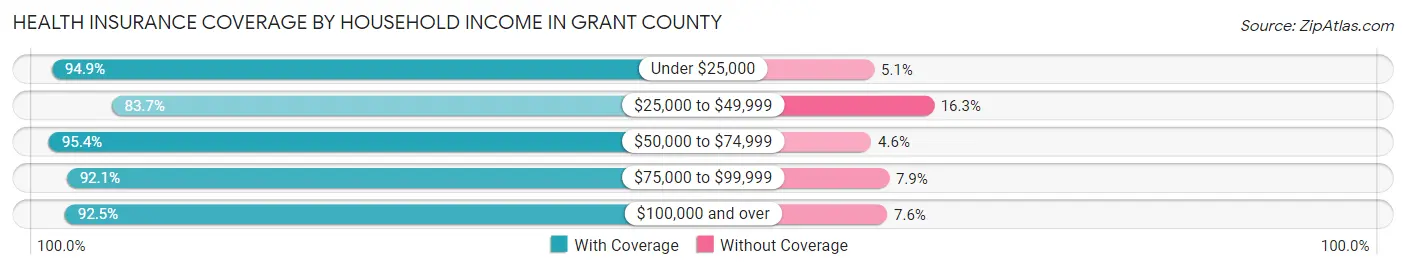
| Household Income | With Coverage | Without Coverage |
| Under $25,000 | 613 (94.9%) | 33 (5.1%) |
| $25,000 to $49,999 | 1,110 (83.7%) | 216 (16.3%) |
| $50,000 to $74,999 | 1,047 (95.4%) | 50 (4.6%) |
| $75,000 to $99,999 | 1,235 (92.1%) | 106 (7.9%) |
| $100,000 and over | 2,656 (92.4%) | 217 (7.5%) |
Public vs Private Health Insurance Coverage by Age in Grant County
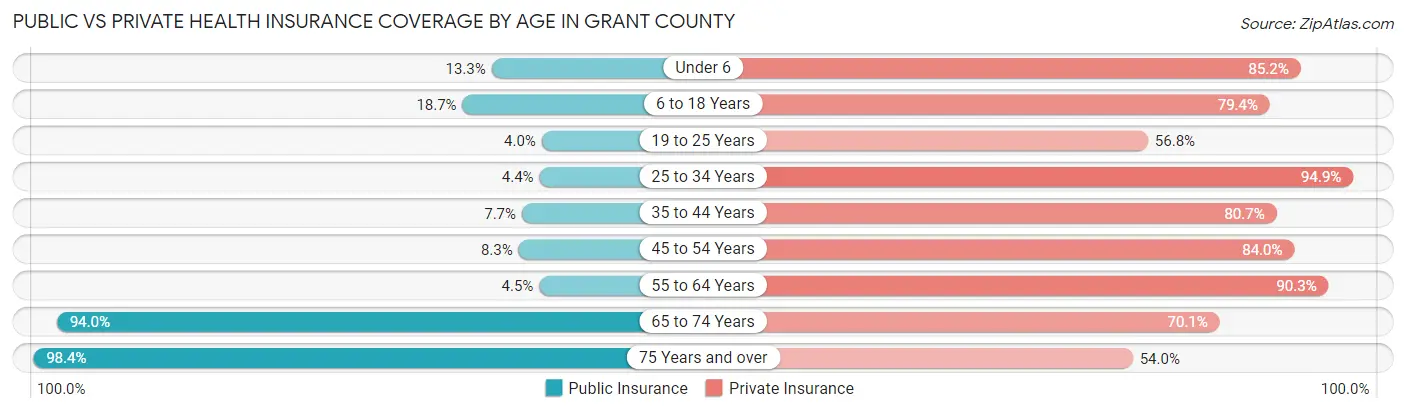
| Age Bracket | Public Insurance | Private Insurance |
| Under 6 | 62 (13.3%) | 396 (85.2%) |
| 6 to 18 Years | 236 (18.7%) | 1,001 (79.4%) |
| 19 to 25 Years | 23 (4.0%) | 325 (56.8%) |
| 25 to 34 Years | 34 (4.4%) | 727 (94.9%) |
| 35 to 44 Years | 59 (7.7%) | 618 (80.7%) |
| 45 to 54 Years | 66 (8.3%) | 666 (84.0%) |
| 55 to 64 Years | 52 (4.5%) | 1,046 (90.3%) |
| 65 to 74 Years | 850 (94.0%) | 634 (70.1%) |
| 75 Years and over | 738 (98.4%) | 405 (54.0%) |
| Total | 2,120 (28.5%) | 5,818 (78.3%) |
Disability Status by Sex by Age in Grant County
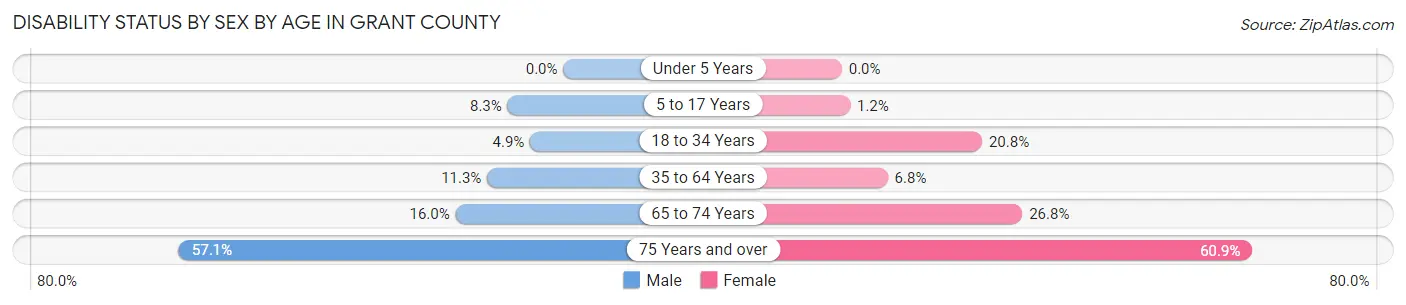
| Age Bracket | Male | Female |
| Under 5 Years | 0 (0.0%) | 0 (0.0%) |
| 5 to 17 Years | 54 (8.3%) | 7 (1.2%) |
| 18 to 34 Years | 40 (4.9%) | 127 (20.8%) |
| 35 to 64 Years | 161 (11.3%) | 88 (6.8%) |
| 65 to 74 Years | 73 (16.0%) | 120 (26.8%) |
| 75 Years and over | 149 (57.1%) | 298 (60.9%) |
Disability Class by Sex by Age in Grant County
Disability Class: Hearing Difficulty
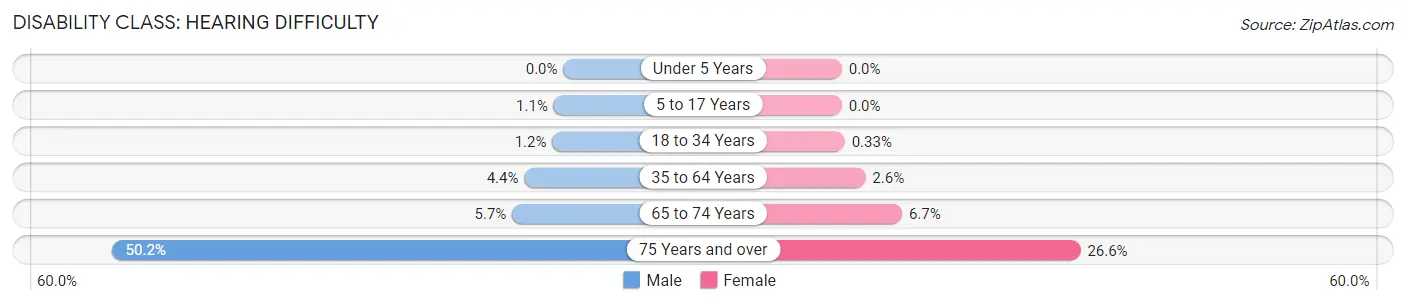
| Age Bracket | Male | Female |
| Under 5 Years | 0 (0.0%) | 0 (0.0%) |
| 5 to 17 Years | 7 (1.1%) | 0 (0.0%) |
| 18 to 34 Years | 10 (1.2%) | 2 (0.3%) |
| 35 to 64 Years | 62 (4.3%) | 34 (2.6%) |
| 65 to 74 Years | 26 (5.7%) | 30 (6.7%) |
| 75 Years and over | 131 (50.2%) | 130 (26.6%) |
Disability Class: Vision Difficulty
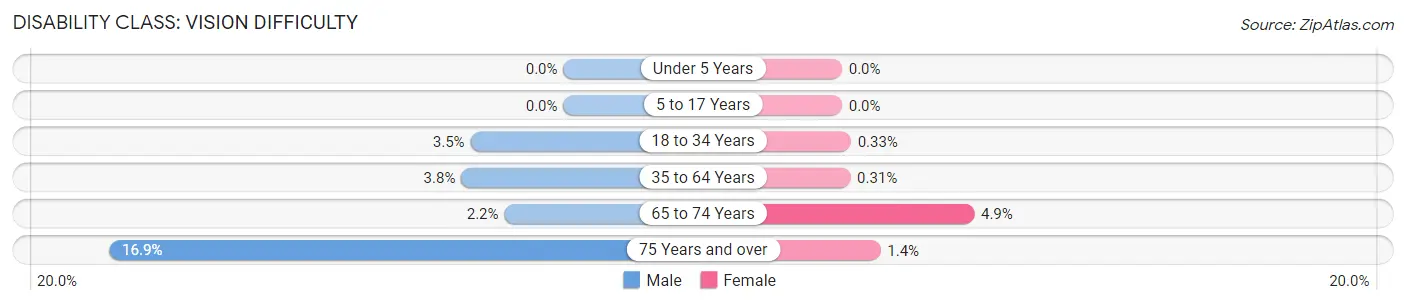
| Age Bracket | Male | Female |
| Under 5 Years | 0 (0.0%) | 0 (0.0%) |
| 5 to 17 Years | 0 (0.0%) | 0 (0.0%) |
| 18 to 34 Years | 28 (3.5%) | 2 (0.3%) |
| 35 to 64 Years | 54 (3.8%) | 4 (0.3%) |
| 65 to 74 Years | 10 (2.2%) | 22 (4.9%) |
| 75 Years and over | 44 (16.9%) | 7 (1.4%) |
Disability Class: Cognitive Difficulty
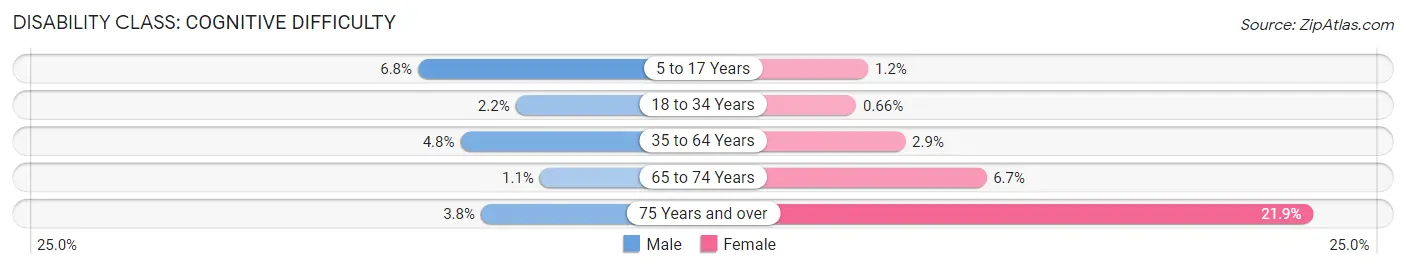
| Age Bracket | Male | Female |
| 5 to 17 Years | 44 (6.8%) | 7 (1.2%) |
| 18 to 34 Years | 18 (2.2%) | 4 (0.7%) |
| 35 to 64 Years | 68 (4.8%) | 38 (2.9%) |
| 65 to 74 Years | 5 (1.1%) | 30 (6.7%) |
| 75 Years and over | 10 (3.8%) | 107 (21.9%) |
Disability Class: Ambulatory Difficulty
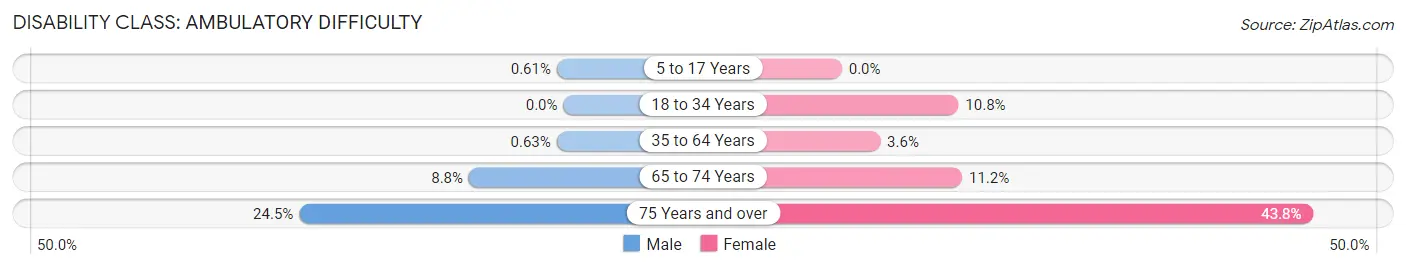
| Age Bracket | Male | Female |
| 5 to 17 Years | 4 (0.6%) | 0 (0.0%) |
| 18 to 34 Years | 0 (0.0%) | 66 (10.8%) |
| 35 to 64 Years | 9 (0.6%) | 46 (3.6%) |
| 65 to 74 Years | 40 (8.8%) | 50 (11.2%) |
| 75 Years and over | 64 (24.5%) | 214 (43.8%) |
Disability Class: Self-Care Difficulty
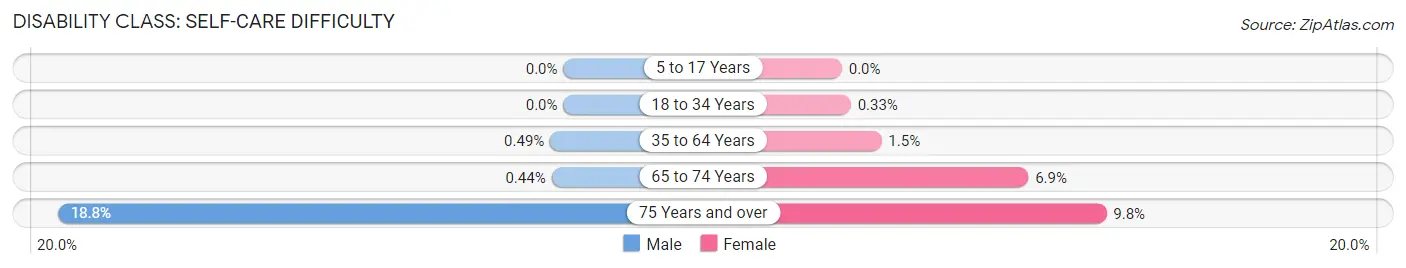
| Age Bracket | Male | Female |
| 5 to 17 Years | 0 (0.0%) | 0 (0.0%) |
| 18 to 34 Years | 0 (0.0%) | 2 (0.3%) |
| 35 to 64 Years | 7 (0.5%) | 19 (1.5%) |
| 65 to 74 Years | 2 (0.4%) | 31 (6.9%) |
| 75 Years and over | 49 (18.8%) | 48 (9.8%) |
Technology Access in Grant County
Computing Device Access in Grant County
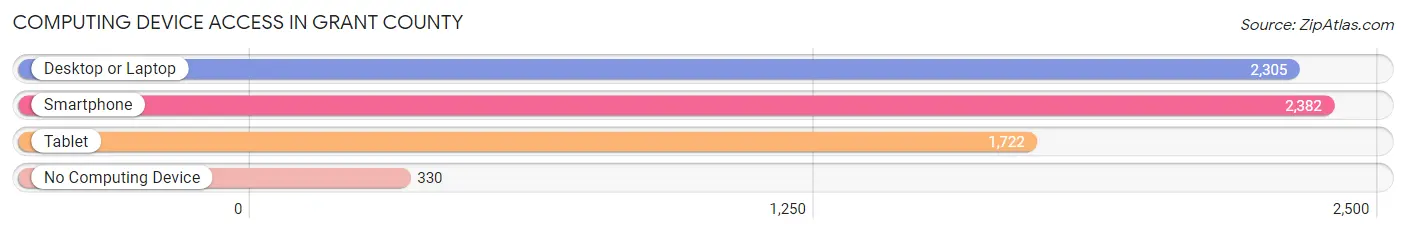
| Device Type | # Households | % Households |
| Desktop or Laptop | 2,305 | 76.0% |
| Smartphone | 2,382 | 78.6% |
| Tablet | 1,722 | 56.8% |
| No Computing Device | 330 | 10.9% |
| Total | 3,031 | 100.0% |
Internet Access in Grant County
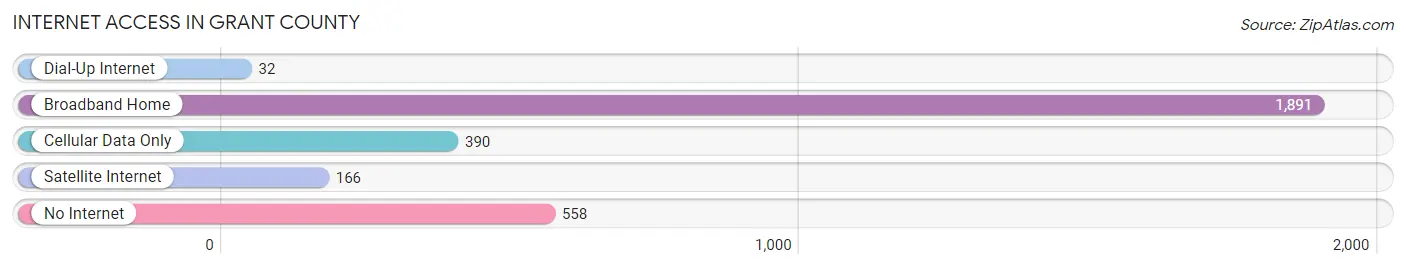
| Internet Type | # Households | % Households |
| Dial-Up Internet | 32 | 1.1% |
| Broadband Home | 1,891 | 62.4% |
| Cellular Data Only | 390 | 12.9% |
| Satellite Internet | 166 | 5.5% |
| No Internet | 558 | 18.4% |
| Total | 3,031 | 100.0% |
Grant County Summary
County History
Grant County, South Dakota is located in the northeast corner of the state and is bordered by Roberts County to the north, Deuel County to the east, Codington County to the south, and Brookings County to the west. The county was established in 1873 and was named after Ulysses S. Grant, the 18th President of the United States.
The first settlers in the area were mostly of German and Scandinavian descent. The first permanent settlement was established in 1879, and the county was officially organized in 1883. The county seat is located in Milbank, which was founded in 1881.
The county was primarily an agricultural area, with wheat, corn, and oats being the main crops. In the early 1900s, the county also had a thriving dairy industry.
The county experienced a population boom in the 1950s and 1960s, as many people moved to the area to take advantage of the booming economy. The population peaked in 1970 at 11,845, but has since declined to its current population of 8,845.
Geography
Grant County covers an area of 1,072 square miles and is located in the northeast corner of South Dakota. The county is bordered by Roberts County to the north, Deuel County to the east, Codington County to the south, and Brookings County to the west.
The terrain of the county is mostly flat, with some rolling hills in the western part of the county. The county is drained by the Big Sioux River, which flows through the county from north to south.
The county has a humid continental climate, with cold winters and hot summers. The average annual temperature is 48°F, and the average annual precipitation is 22 inches.
Economy
The economy of Grant County is largely based on agriculture. The county is home to a number of large farms, which produce wheat, corn, oats, soybeans, and other crops. The county also has a thriving dairy industry, with several large dairy farms located in the area.
In addition to agriculture, the county also has a number of manufacturing and service-based businesses. The county is home to several large manufacturing plants, including a paper mill, a plastics plant, and a food processing plant. The county also has a number of retail stores, restaurants, and other service-based businesses.
Demographics
As of the 2010 census, Grant County had a population of 8,845. The racial makeup of the county was 95.3% White, 0.7% African American, 0.4% Native American, 0.3% Asian, 0.1% Pacific Islander, 1.7% from other races, and 1.4% from two or more races. Hispanic or Latino of any race were 3.2% of the population.
The median income for a household in the county was $41,945, and the median income for a family was $50,945. The per capita income for the county was $20,945. About 11.2% of families and 14.2% of the population were below the poverty line, including 17.2% of those under age 18 and 10.2% of those age 65 or over.
Common Questions
What is the Total Population of Grant County?
Total Population of Grant County is 7,533.
What is the Total Male Population of Grant County?
Total Male Population of Grant County is 3,867.
What is the Total Female Population of Grant County?
Total Female Population of Grant County is 3,666.
What is the Ratio of Males per 100 Females in Grant County?
There are 105.48 Males per 100 Females in Grant County.
What is the Ratio of Females per 100 Males in Grant County?
There are 94.80 Females per 100 Males in Grant County.
What is the Median Population Age in Grant County?
Median Population Age in Grant County is 43.8 Years.
What is the Average Family Size in Grant County
Average Family Size in Grant County is 2.9 People.
What is the Average Household Size in Grant County
Average Household Size in Grant County is 2.4 People.
What is Per Capita Income in Grant County?
Per Capita income in Grant County is $38,787.
What is the Median Family Income in Grant County?
Median Family Income in Grant County is $87,722.
What is the Median Household income in Grant County?
Median Household Income in Grant County is $70,851.
What is Income or Wage Gap in Grant County?
Income or Wage Gap in Grant County is 31.9%.
Women in Grant County earn 68.1 cents for every dollar earned by a man.
What is Family Income Deficit in Grant County?
Family Income Deficit in Grant County is $10,876.
Families that are below poverty line in Grant County earn $10,876 less on average than the poverty threshold level.
What is Inequality or Gini Index in Grant County?
Inequality or Gini Index in Grant County is 0.46.
How Large is the Labor Force in Grant County?
There are 3,907 People in the Labor Forcein in Grant County.
What is the Percentage of People in the Labor Force in Grant County?
64.2% of People are in the Labor Force in Grant County.
What is the Unemployment Rate in Grant County?
Unemployment Rate in Grant County is 3.3%.