Faulk County, SD
Faulk County Map
Faulk County Overview
2,140
TOTAL POPULATION
1,034
MALE POPULATION
1,106
FEMALE POPULATION
93.49
MALES / 100 FEMALES
106.96
FEMALES / 100 MALES
45.8
MEDIAN AGE
3.5
AVG FAMILY SIZE
2.5
AVG HOUSEHOLD SIZE
$31,533
PER CAPITA INCOME
$90,288
AVG FAMILY INCOME
$56,734
AVG HOUSEHOLD INCOME
19.9%
WAGE / INCOME GAP [ % ]
80.1¢/ $1
WAGE / INCOME GAP [ $ ]
$13,954
FAMILY INCOME DEFICIT
0.45
INEQUALITY / GINI INDEX
984
LABOR FORCE [ PEOPLE ]
59.0%
PERCENT IN LABOR FORCE
3.7%
UNEMPLOYMENT RATE
Faulk County Area Codes
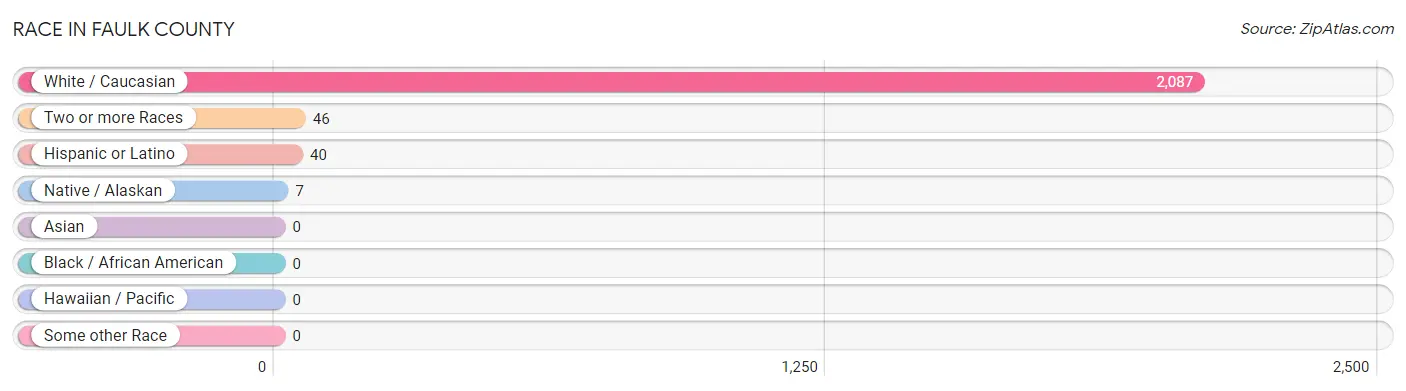
Race in Faulk County
The most populous races in Faulk County are White / Caucasian (2,087 | 97.5%), Two or more Races (46 | 2.1%), and Hispanic or Latino (40 | 1.9%).
| Race | # Population | % Population |
| Asian | 0 | 0.0% |
| Black / African American | 0 | 0.0% |
| Hawaiian / Pacific | 0 | 0.0% |
| Hispanic or Latino | 40 | 1.9% |
| Native / Alaskan | 7 | 0.3% |
| White / Caucasian | 2,087 | 97.5% |
| Two or more Races | 46 | 2.1% |
| Some other Race | 0 | 0.0% |
| Total | 2,140 | 100.0% |
Ancestry in Faulk County
The most populous ancestries reported in Faulk County are German (1,202 | 56.2%), Irish (293 | 13.7%), Norwegian (229 | 10.7%), English (98 | 4.6%), and American (86 | 4.0%), together accounting for 89.2% of all Faulk County residents.

| Ancestry | # Population | % Population |
| American | 86 | 4.0% |
| Arab | 55 | 2.6% |
| Austrian | 45 | 2.1% |
| Cherokee | 2 | 0.1% |
| Croatian | 6 | 0.3% |
| Czech | 63 | 2.9% |
| Czechoslovakian | 7 | 0.3% |
| Danish | 54 | 2.5% |
| Dutch | 13 | 0.6% |
| English | 98 | 4.6% |
| European | 8 | 0.4% |
| French | 25 | 1.2% |
| French Canadian | 4 | 0.2% |
| German | 1,202 | 56.2% |
| German Russian | 4 | 0.2% |
| Hungarian | 8 | 0.4% |
| Irish | 293 | 13.7% |
| Luxembourger | 5 | 0.2% |
| Mexican | 40 | 1.9% |
| Norwegian | 229 | 10.7% |
| Polish | 3 | 0.1% |
| Russian | 10 | 0.5% |
| Scandinavian | 11 | 0.5% |
| Scotch-Irish | 1 | 0.1% |
| Scottish | 7 | 0.3% |
| Sioux | 34 | 1.6% |
| Swedish | 31 | 1.5% |
| Swiss | 44 | 2.1% |
| Syrian | 55 | 2.6% |
| Ukrainian | 33 | 1.5% |
| Welsh | 31 | 1.5% | View All 31 Rows |
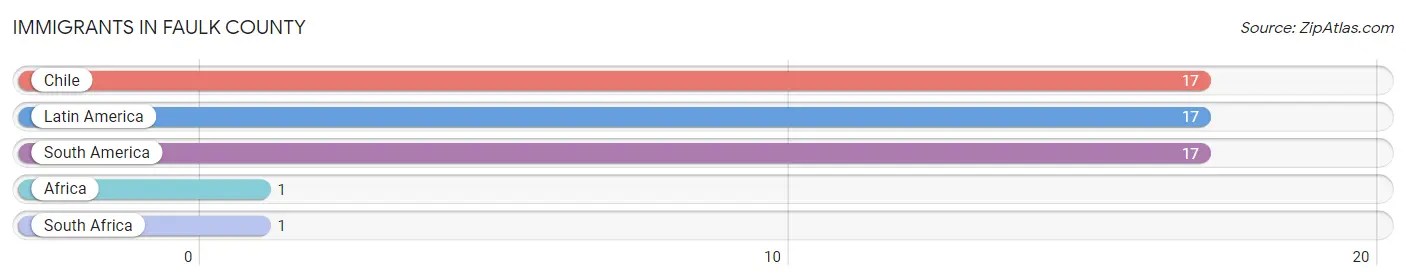
Immigrants in Faulk County
The most numerous immigrant groups reported in Faulk County came from Chile (17 | 0.8%), Latin America (17 | 0.8%), South America (17 | 0.8%), Africa (1 | 0.1%), and South Africa (1 | 0.1%), together accounting for 2.5% of all Faulk County residents.
| Immigration Origin | # Population | % Population |
| Africa | 1 | 0.1% |
| Chile | 17 | 0.8% |
| Latin America | 17 | 0.8% |
| South Africa | 1 | 0.1% |
| South America | 17 | 0.8% | View All 5 Rows |
Sex and Age in Faulk County
Sex and Age in Faulk County
The most populous age groups in Faulk County are 60 to 64 Years (102 | 9.9%) for men and 85 Years and over (126 | 11.4%) for women.

| Age Bracket | Male | Female |
| Under 5 Years | 41 (4.0%) | 82 (7.4%) |
| 5 to 9 Years | 50 (4.8%) | 74 (6.7%) |
| 10 to 14 Years | 81 (7.8%) | 110 (10.0%) |
| 15 to 19 Years | 65 (6.3%) | 77 (7.0%) |
| 20 to 24 Years | 72 (7.0%) | 48 (4.3%) |
| 25 to 29 Years | 40 (3.9%) | 29 (2.6%) |
| 30 to 34 Years | 68 (6.6%) | 53 (4.8%) |
| 35 to 39 Years | 40 (3.9%) | 36 (3.3%) |
| 40 to 44 Years | 65 (6.3%) | 28 (2.5%) |
| 45 to 49 Years | 63 (6.1%) | 90 (8.1%) |
| 50 to 54 Years | 44 (4.3%) | 32 (2.9%) |
| 55 to 59 Years | 57 (5.5%) | 36 (3.3%) |
| 60 to 64 Years | 102 (9.9%) | 90 (8.1%) |
| 65 to 69 Years | 76 (7.3%) | 58 (5.2%) |
| 70 to 74 Years | 47 (4.5%) | 51 (4.6%) |
| 75 to 79 Years | 48 (4.6%) | 51 (4.6%) |
| 80 to 84 Years | 31 (3.0%) | 35 (3.2%) |
| 85 Years and over | 44 (4.3%) | 126 (11.4%) |
| Total | 1,034 (100.0%) | 1,106 (100.0%) |
Families and Households in Faulk County
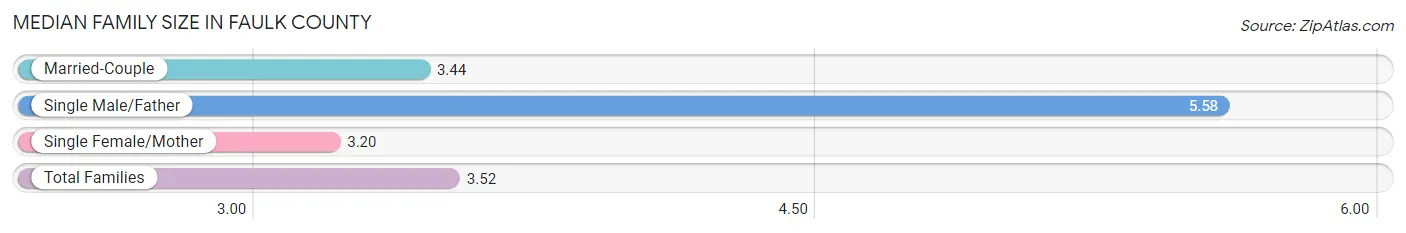
Median Family Size in Faulk County
The median family size in Faulk County is 3.52 persons per family, with single male/father families (19 | 4.2%) accounting for the largest median family size of 5.58 persons per family. On the other hand, single female/mother families (15 | 3.3%) represent the smallest median family size with 3.20 persons per family.
| Family Type | # Families | Family Size |
| Married-Couple | 421 (92.5%) | 3.44 |
| Single Male/Father | 19 (4.2%) | 5.58 |
| Single Female/Mother | 15 (3.3%) | 3.20 |
| Total Families | 455 (100.0%) | 3.52 |
Median Household Size in Faulk County
The median household size in Faulk County is 2.53 persons per household, with single male/father households (19 | 2.5%) accounting for the largest median household size of 5.95 persons per household. non-family households (310 | 40.5%) represent the smallest median household size with 1.04 persons per household.
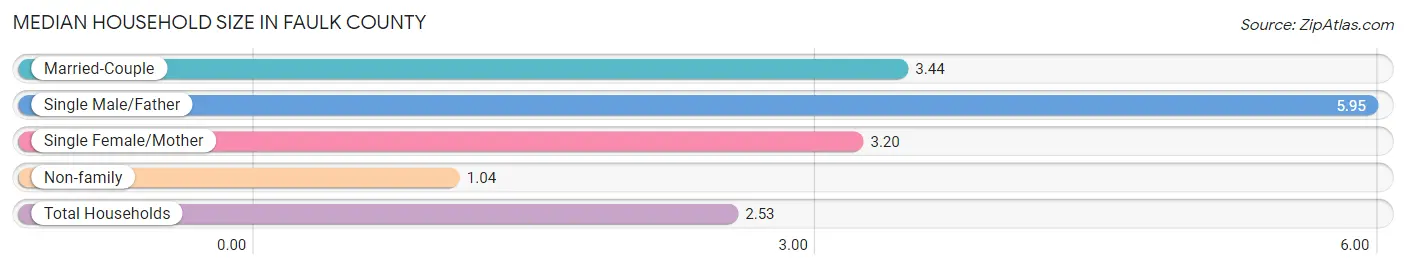
| Household Type | # Households | Household Size |
| Married-Couple | 421 (55.0%) | 3.44 |
| Single Male/Father | 19 (2.5%) | 5.95 |
| Single Female/Mother | 15 (2.0%) | 3.20 |
| Non-family | 310 (40.5%) | 1.04 |
| Total Households | 765 (100.0%) | 2.53 |
Household Size by Marriage Status in Faulk County
Out of a total of 765 households in Faulk County, 455 (59.5%) are family households, while 310 (40.5%) are nonfamily households. The most numerous type of family households are 2-person households, comprising 244, and the most common type of nonfamily households are 1-person households, comprising 296.

| Household Size | Family Households | Nonfamily Households |
| 1-Person Households | - | 296 (38.7%) |
| 2-Person Households | 244 (31.9%) | 14 (1.8%) |
| 3-Person Households | 77 (10.1%) | 0 (0.0%) |
| 4-Person Households | 48 (6.3%) | 0 (0.0%) |
| 5-Person Households | 40 (5.2%) | 0 (0.0%) |
| 6-Person Households | 9 (1.2%) | 0 (0.0%) |
| 7+ Person Households | 37 (4.8%) | 0 (0.0%) |
| Total | 455 (59.5%) | 310 (40.5%) |
Female Fertility in Faulk County
Fertility by Age in Faulk County
Average fertility rate in Faulk County is 28.0 births per 1,000 women. Women in the age bracket of 20 to 34 years have the highest fertility rate with 46.0 births per 1,000 women. Women in the age bracket of 20 to 34 years acount for 60.0% of all women with births.
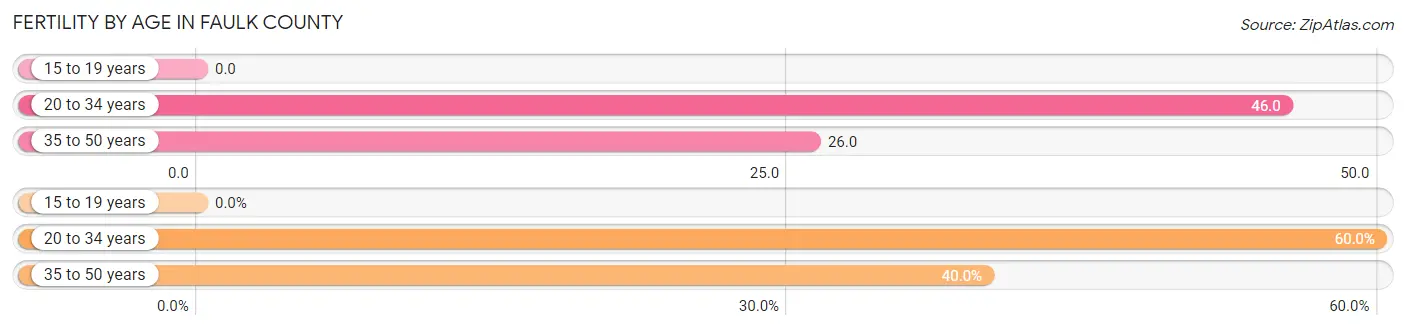
| Age Bracket | Women with Births | Births / 1,000 Women |
| 15 to 19 years | 0 (0.0%) | 0.0 |
| 20 to 34 years | 6 (60.0%) | 46.0 |
| 35 to 50 years | 4 (40.0%) | 26.0 |
| Total | 10 (100.0%) | 28.0 |
Fertility by Age by Marriage Status in Faulk County
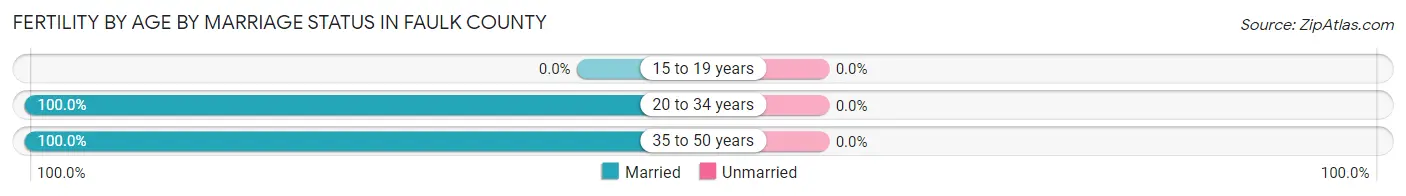
| Age Bracket | Married | Unmarried |
| 15 to 19 years | 0 (0.0%) | 0 (0.0%) |
| 20 to 34 years | 6 (100.0%) | 0 (0.0%) |
| 35 to 50 years | 4 (100.0%) | 0 (0.0%) |
| Total | 10 (100.0%) | 0 (0.0%) |
Fertility by Education in Faulk County
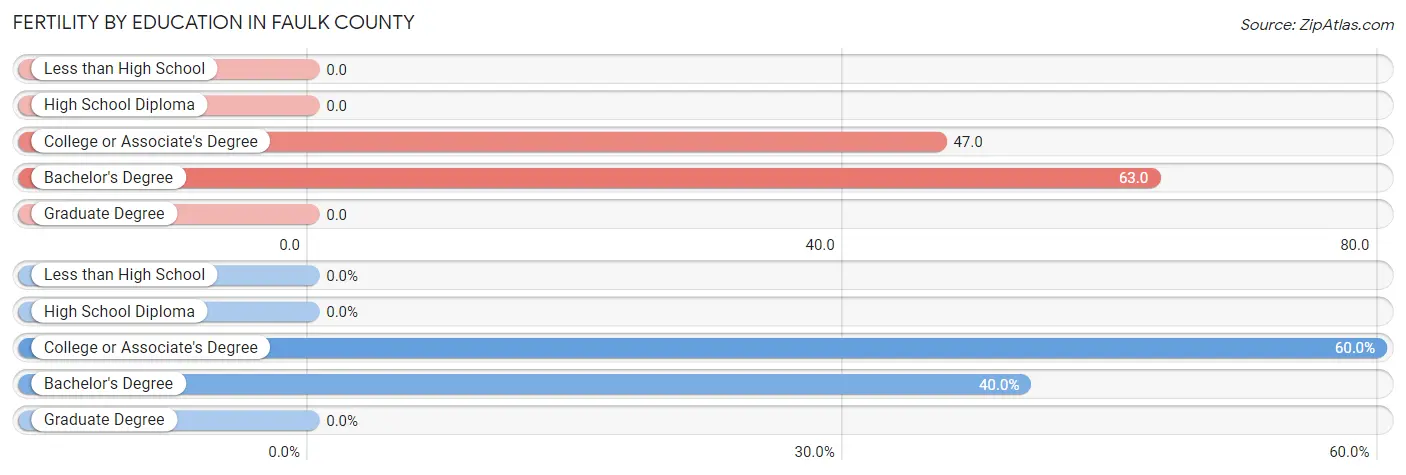
| Educational Attainment | Women with Births | Births / 1,000 Women |
| Less than High School | 0 (0.0%) | 0.0 |
| High School Diploma | 0 (0.0%) | 0.0 |
| College or Associate's Degree | 6 (60.0%) | 47.0 |
| Bachelor's Degree | 4 (40.0%) | 63.0 |
| Graduate Degree | 0 (0.0%) | 0.0 |
| Total | 10 (100.0%) | 28.0 |
Fertility by Education by Marriage Status in Faulk County
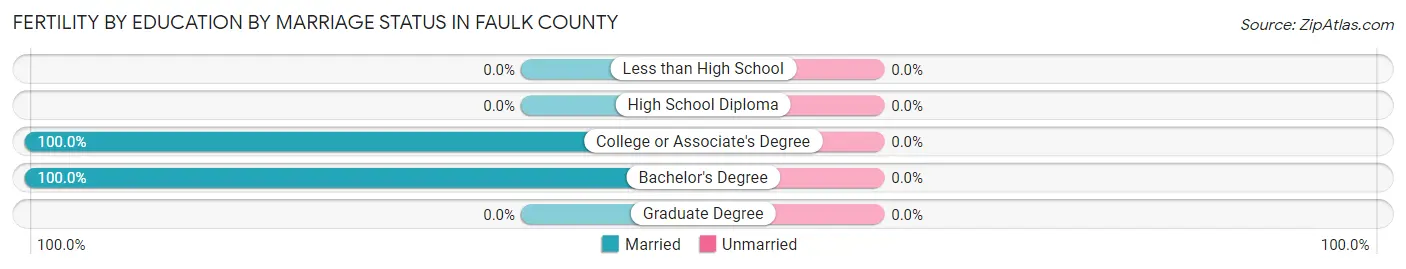
| Educational Attainment | Married | Unmarried |
| Less than High School | 0 (0.0%) | 0 (0.0%) |
| High School Diploma | 0 (0.0%) | 0 (0.0%) |
| College or Associate's Degree | 6 (100.0%) | 0 (0.0%) |
| Bachelor's Degree | 4 (100.0%) | 0 (0.0%) |
| Graduate Degree | 0 (0.0%) | 0 (0.0%) |
| Total | 10 (100.0%) | 0 (0.0%) |
Income in Faulk County
Income Overview in Faulk County
Per Capita Income in Faulk County is $31,533, while median incomes of families and households are $90,288 and $56,734 respectively.
| Characteristic | Number | Measure |
| Per Capita Income | 2,140 | $31,533 |
| Median Family Income | 455 | $90,288 |
| Mean Family Income | 455 | $107,096 |
| Median Household Income | 765 | $56,734 |
| Mean Household Income | 765 | $78,630 |
| Income Deficit | 455 | $13,954 |
| Wage / Income Gap (%) | 2,140 | 19.92% |
| Wage / Income Gap ($) | 2,140 | 80.08¢ per $1 |
| Gini / Inequality Index | 2,140 | 0.45 |
Earnings by Sex in Faulk County
Average Earnings in Faulk County are $34,138, $39,323 for men and $31,488 for women, a difference of 19.9%.
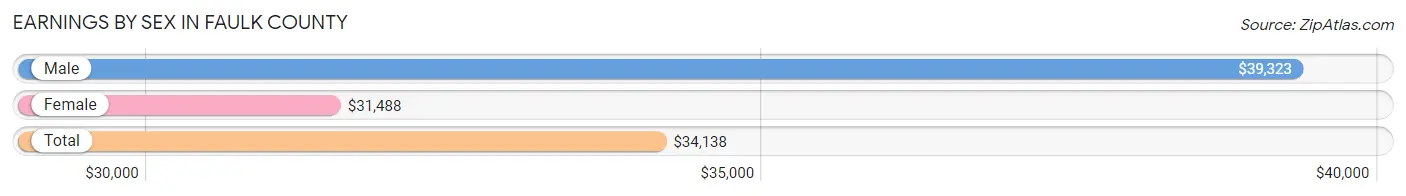
| Sex | Number | Average Earnings |
| Male | 649 (62.8%) | $39,323 |
| Female | 385 (37.2%) | $31,488 |
| Total | 1,034 (100.0%) | $34,138 |
Earnings by Sex by Income Bracket in Faulk County
The most common earnings brackets in Faulk County are $100,000+ for men (72 | 11.1%) and $30,000 to $34,999 for women (49 | 12.7%).
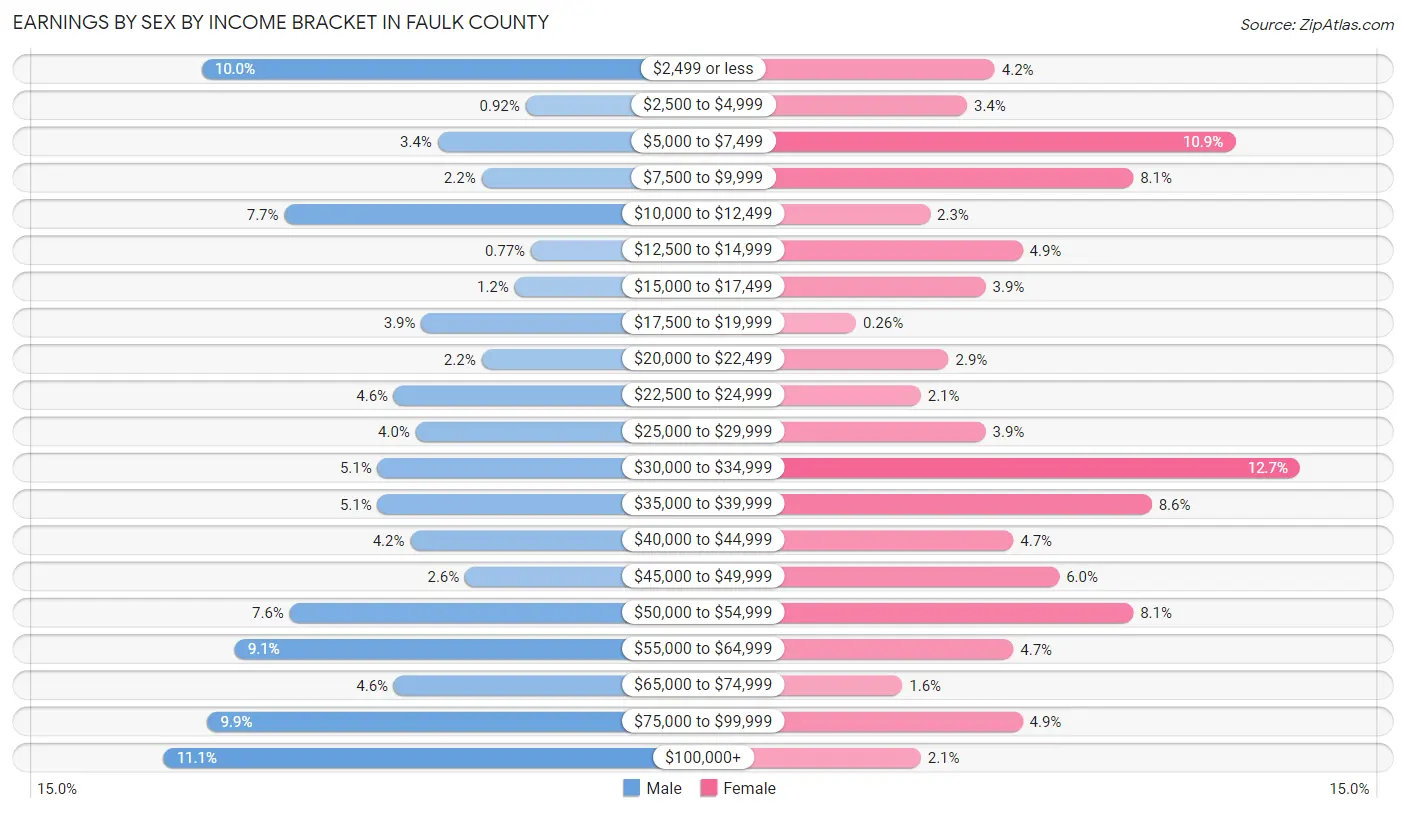
| Income | Male | Female |
| $2,499 or less | 65 (10.0%) | 16 (4.2%) |
| $2,500 to $4,999 | 6 (0.9%) | 13 (3.4%) |
| $5,000 to $7,499 | 22 (3.4%) | 42 (10.9%) |
| $7,500 to $9,999 | 14 (2.2%) | 31 (8.1%) |
| $10,000 to $12,499 | 50 (7.7%) | 9 (2.3%) |
| $12,500 to $14,999 | 5 (0.8%) | 19 (4.9%) |
| $15,000 to $17,499 | 8 (1.2%) | 15 (3.9%) |
| $17,500 to $19,999 | 25 (3.8%) | 1 (0.3%) |
| $20,000 to $22,499 | 14 (2.2%) | 11 (2.9%) |
| $22,500 to $24,999 | 30 (4.6%) | 8 (2.1%) |
| $25,000 to $29,999 | 26 (4.0%) | 15 (3.9%) |
| $30,000 to $34,999 | 33 (5.1%) | 49 (12.7%) |
| $35,000 to $39,999 | 33 (5.1%) | 33 (8.6%) |
| $40,000 to $44,999 | 27 (4.2%) | 18 (4.7%) |
| $45,000 to $49,999 | 17 (2.6%) | 23 (6.0%) |
| $50,000 to $54,999 | 49 (7.5%) | 31 (8.1%) |
| $55,000 to $64,999 | 59 (9.1%) | 18 (4.7%) |
| $65,000 to $74,999 | 30 (4.6%) | 6 (1.6%) |
| $75,000 to $99,999 | 64 (9.9%) | 19 (4.9%) |
| $100,000+ | 72 (11.1%) | 8 (2.1%) |
| Total | 649 (100.0%) | 385 (100.0%) |
Earnings by Sex by Educational Attainment in Faulk County
Average earnings in Faulk County are $50,563 for men and $33,795 for women, a difference of 33.2%. Men with an educational attainment of bachelor's degree enjoy the highest average annual earnings of $68,125, while those with less than high school education earn the least with $11,875. Women with an educational attainment of graduate degree earn the most with the average annual earnings of $57,857, while those with high school diploma education have the smallest earnings of $21,875.
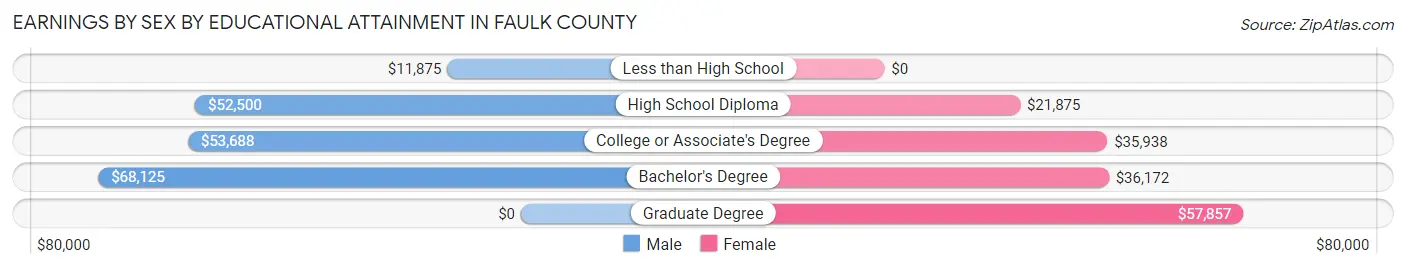
| Educational Attainment | Male Income | Female Income |
| Less than High School | $11,875 | $0 |
| High School Diploma | $52,500 | $21,875 |
| College or Associate's Degree | $53,688 | $35,938 |
| Bachelor's Degree | $68,125 | $36,172 |
| Graduate Degree | - | - |
| Total | $50,563 | $33,795 |
Family Income in Faulk County
Family Income Brackets in Faulk County
According to the Faulk County family income data, there are 112 families falling into the $100,000 to $149,999 income range, which is the most common income bracket and makes up 24.6% of all families.
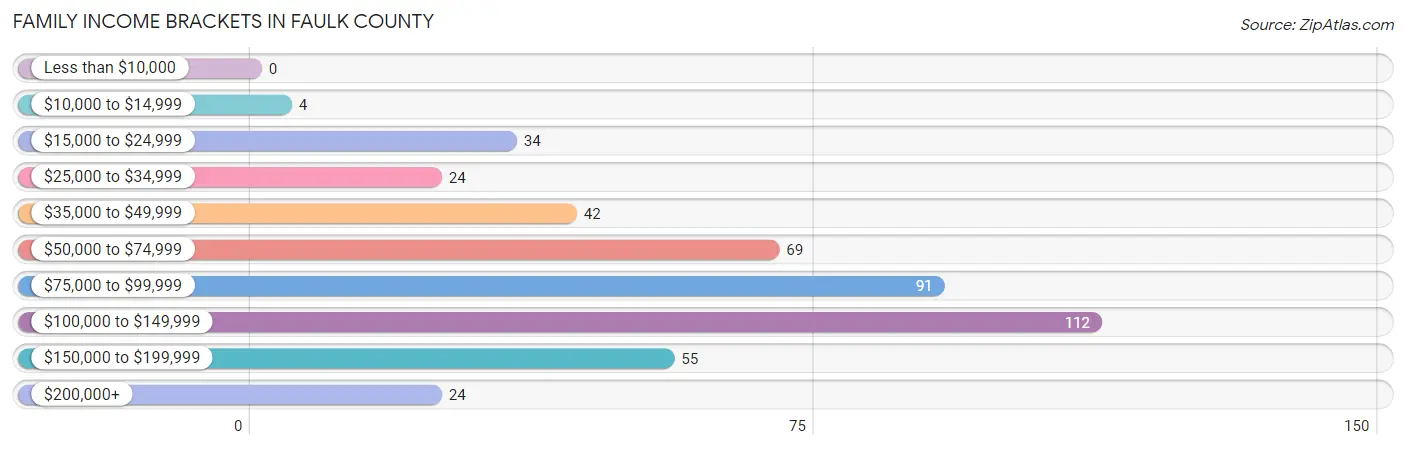
| Income Bracket | # Families | % Families |
| Less than $10,000 | 0 | 0.0% |
| $10,000 to $14,999 | 4 | 0.9% |
| $15,000 to $24,999 | 34 | 7.5% |
| $25,000 to $34,999 | 24 | 5.3% |
| $35,000 to $49,999 | 42 | 9.2% |
| $50,000 to $74,999 | 69 | 15.2% |
| $75,000 to $99,999 | 91 | 20.0% |
| $100,000 to $149,999 | 112 | 24.6% |
| $150,000 to $199,999 | 55 | 12.1% |
| $200,000+ | 24 | 5.3% |
Family Income by Famaliy Size in Faulk County
3-person families (74 | 16.3%) account for the highest median family income in Faulk County with $120,000 per family, while 2-person families (247 | 54.3%) have the highest median income of $43,656 per family member.
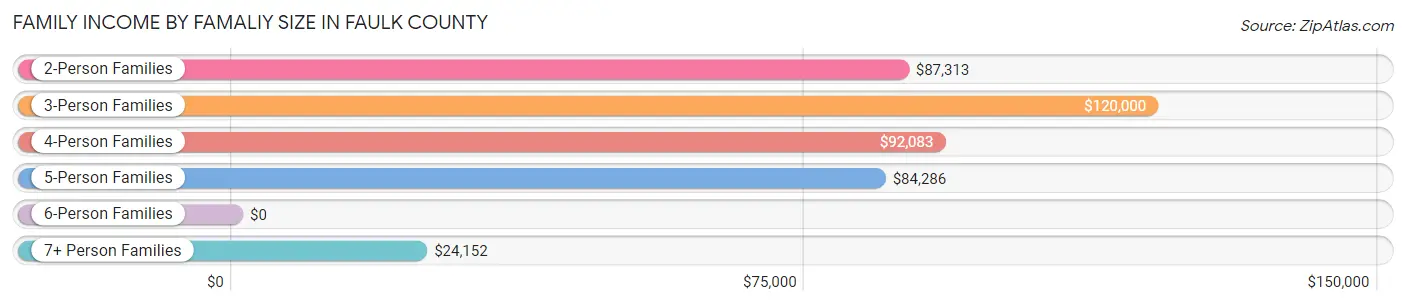
| Income Bracket | # Families | Median Income |
| 2-Person Families | 247 (54.3%) | $87,313 |
| 3-Person Families | 74 (16.3%) | $120,000 |
| 4-Person Families | 50 (11.0%) | $92,083 |
| 5-Person Families | 38 (8.4%) | $84,286 |
| 6-Person Families | 9 (2.0%) | $0 |
| 7+ Person Families | 37 (8.1%) | $24,152 |
| Total | 455 (100.0%) | $90,288 |
Family Income by Number of Earners in Faulk County
The median family income in Faulk County is $90,288, with families comprising 3+ earners (35) having the highest median family income of $126,458, while families with no earners (61) have the lowest median family income of $49,107, accounting for 7.7% and 13.4% of families, respectively.

| Number of Earners | # Families | Median Income |
| No Earners | 61 (13.4%) | $49,107 |
| 1 Earner | 130 (28.6%) | $83,750 |
| 2 Earners | 229 (50.3%) | $95,694 |
| 3+ Earners | 35 (7.7%) | $126,458 |
| Total | 455 (100.0%) | $90,288 |
Household Income in Faulk County
Household Income Brackets in Faulk County
With 121 households falling in the category, the $100,000 to $149,999 income range is the most frequent in Faulk County, accounting for 15.8% of all households. In contrast, only 19 households (2.5%) fall into the less than $10,000 income bracket, making it the least populous group.
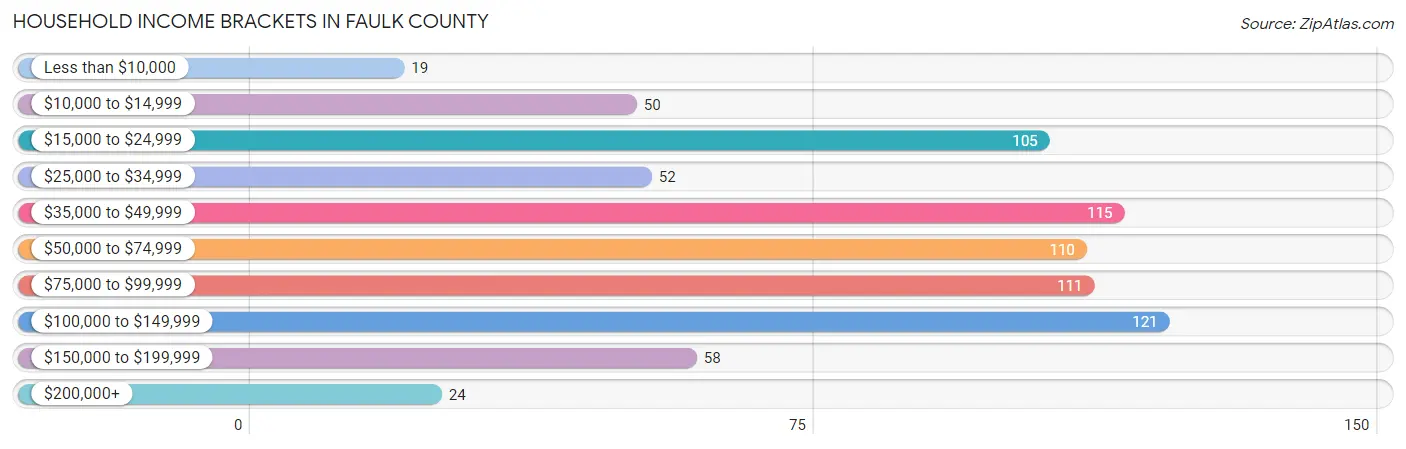
| Income Bracket | # Households | % Households |
| Less than $10,000 | 19 | 2.5% |
| $10,000 to $14,999 | 50 | 6.5% |
| $15,000 to $24,999 | 105 | 13.7% |
| $25,000 to $34,999 | 52 | 6.8% |
| $35,000 to $49,999 | 115 | 15.0% |
| $50,000 to $74,999 | 110 | 14.4% |
| $75,000 to $99,999 | 111 | 14.5% |
| $100,000 to $149,999 | 121 | 15.8% |
| $150,000 to $199,999 | 58 | 7.6% |
| $200,000+ | 24 | 3.1% |
Household Income by Householder Age in Faulk County
The median household income in Faulk County is $56,734, with the highest median household income of $74,250 found in the 25 to 44 years age bracket for the primary householder. A total of 217 households (28.4%) fall into this category. Meanwhile, the 15 to 24 years age bracket for the primary householder has the lowest median household income of $41,250, with 6 households (0.8%) in this group.
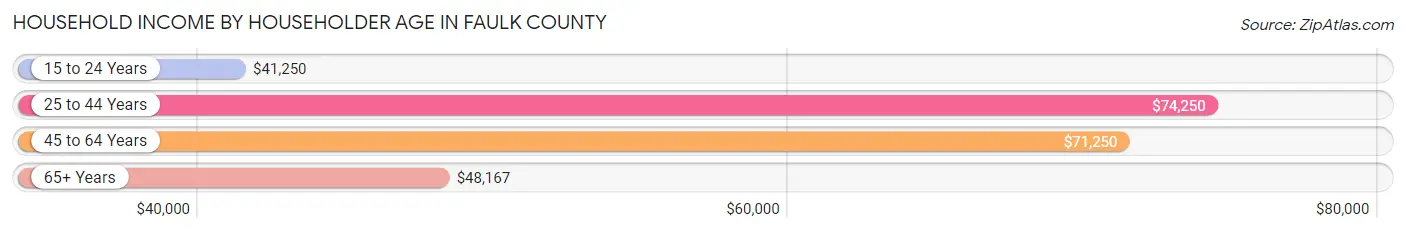
| Income Bracket | # Households | Median Income |
| 15 to 24 Years | 6 (0.8%) | $41,250 |
| 25 to 44 Years | 217 (28.4%) | $74,250 |
| 45 to 64 Years | 254 (33.2%) | $71,250 |
| 65+ Years | 288 (37.7%) | $48,167 |
| Total | 765 (100.0%) | $56,734 |
Poverty in Faulk County
Income Below Poverty by Sex and Age in Faulk County
With 18.7% poverty level for males and 28.7% for females among the residents of Faulk County, 6 to 11 year old males and 12 to 14 year old females are the most vulnerable to poverty, with 19 males (44.2%) and 54 females (83.1%) in their respective age groups living below the poverty level.
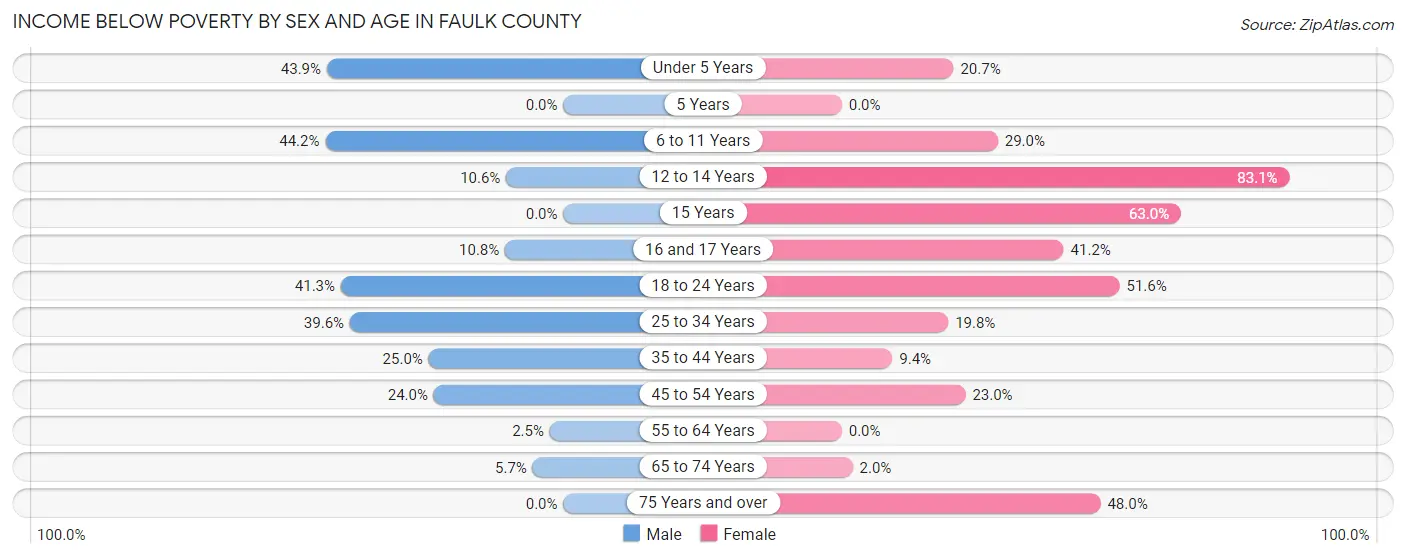
| Age Bracket | Male | Female |
| Under 5 Years | 18 (43.9%) | 17 (20.7%) |
| 5 Years | 0 (0.0%) | 0 (0.0%) |
| 6 to 11 Years | 19 (44.2%) | 33 (28.9%) |
| 12 to 14 Years | 7 (10.6%) | 54 (83.1%) |
| 15 Years | 0 (0.0%) | 17 (63.0%) |
| 16 and 17 Years | 4 (10.8%) | 14 (41.2%) |
| 18 to 24 Years | 38 (41.3%) | 33 (51.6%) |
| 25 to 34 Years | 42 (39.6%) | 16 (19.8%) |
| 35 to 44 Years | 25 (25.0%) | 6 (9.4%) |
| 45 to 54 Years | 25 (24.0%) | 28 (23.0%) |
| 55 to 64 Years | 4 (2.5%) | 0 (0.0%) |
| 65 to 74 Years | 7 (5.7%) | 2 (2.0%) |
| 75 Years and over | 0 (0.0%) | 85 (48.0%) |
| Total | 189 (18.7%) | 305 (28.7%) |
Income Above Poverty by Sex and Age in Faulk County
According to the poverty statistics in Faulk County, males aged 5 years and females aged 5 years are the age groups that are most secure financially, with 100.0% of males and 100.0% of females in these age groups living above the poverty line.
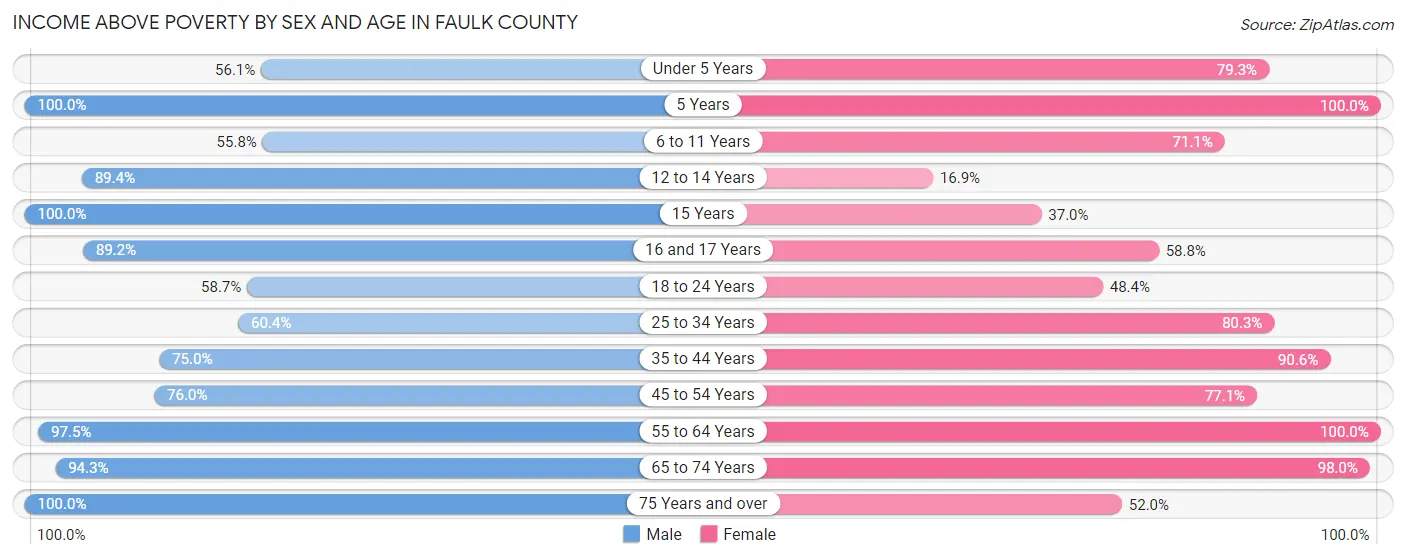
| Age Bracket | Male | Female |
| Under 5 Years | 23 (56.1%) | 65 (79.3%) |
| 5 Years | 22 (100.0%) | 5 (100.0%) |
| 6 to 11 Years | 24 (55.8%) | 81 (71.1%) |
| 12 to 14 Years | 59 (89.4%) | 11 (16.9%) |
| 15 Years | 8 (100.0%) | 10 (37.0%) |
| 16 and 17 Years | 33 (89.2%) | 20 (58.8%) |
| 18 to 24 Years | 54 (58.7%) | 31 (48.4%) |
| 25 to 34 Years | 64 (60.4%) | 65 (80.2%) |
| 35 to 44 Years | 75 (75.0%) | 58 (90.6%) |
| 45 to 54 Years | 79 (76.0%) | 94 (77.0%) |
| 55 to 64 Years | 155 (97.5%) | 126 (100.0%) |
| 65 to 74 Years | 116 (94.3%) | 98 (98.0%) |
| 75 Years and over | 111 (100.0%) | 92 (52.0%) |
| Total | 823 (81.3%) | 756 (71.3%) |
Income Below Poverty Among Married-Couple Families in Faulk County
The poverty statistics for married-couple families in Faulk County show that 12.3% or 52 of the total 421 families live below the poverty line. Families with 5 or more children have the highest poverty rate of 94.6%, comprising of 35 families. On the other hand, families with no children have the lowest poverty rate of 0.4%, which includes 1 families.
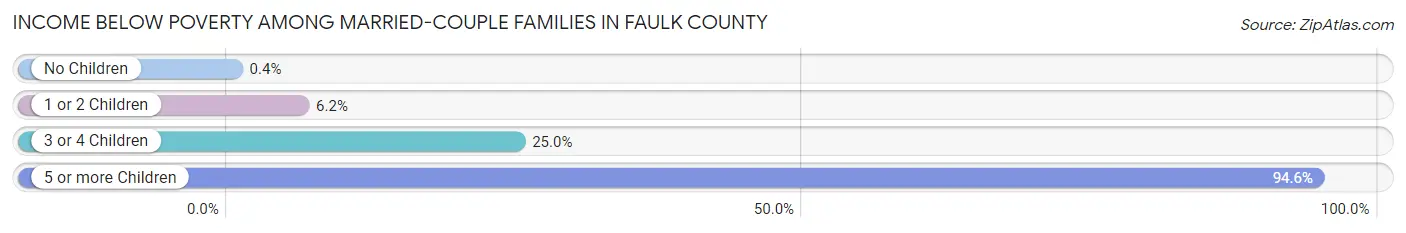
| Children | Above Poverty | Below Poverty |
| No Children | 246 (99.6%) | 1 (0.4%) |
| 1 or 2 Children | 91 (93.8%) | 6 (6.2%) |
| 3 or 4 Children | 30 (75.0%) | 10 (25.0%) |
| 5 or more Children | 2 (5.4%) | 35 (94.6%) |
| Total | 369 (87.6%) | 52 (12.3%) |
Income Below Poverty Among Single-Parent Households in Faulk County
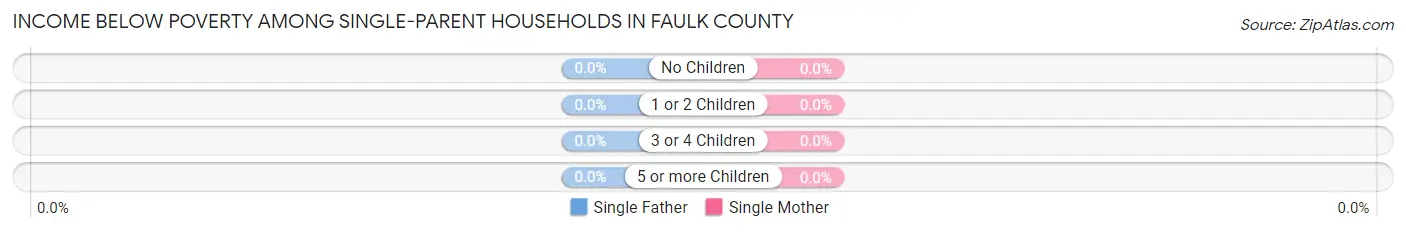
| Children | Single Father | Single Mother |
| No Children | 0 (0.0%) | 0 (0.0%) |
| 1 or 2 Children | 0 (0.0%) | 0 (0.0%) |
| 3 or 4 Children | 0 (0.0%) | 0 (0.0%) |
| 5 or more Children | 0 (0.0%) | 0 (0.0%) |
| Total | 0 (0.0%) | 0 (0.0%) |
Income Below Poverty Among Married-Couple vs Single-Parent Households in Faulk County
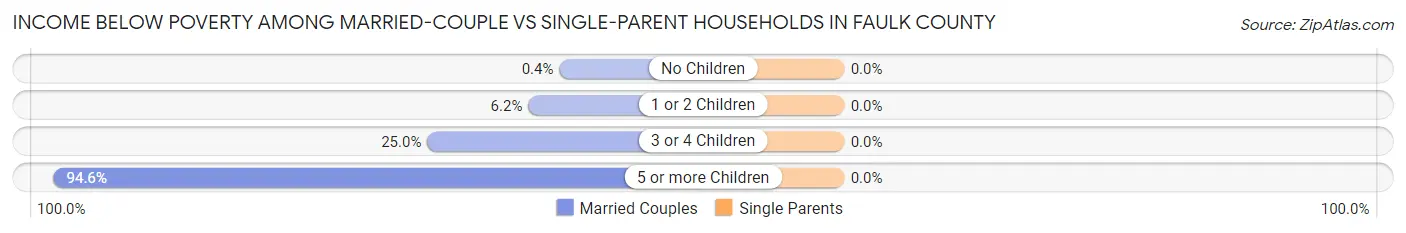
| Children | Married-Couple Families | Single-Parent Households |
| No Children | 1 (0.4%) | 0 (0.0%) |
| 1 or 2 Children | 6 (6.2%) | 0 (0.0%) |
| 3 or 4 Children | 10 (25.0%) | 0 (0.0%) |
| 5 or more Children | 35 (94.6%) | 0 (0.0%) |
| Total | 52 (12.3%) | 0 (0.0%) |
Employment Characteristics in Faulk County
Employment by Class of Employer in Faulk County
Among the 947 employed individuals in Faulk County, private company employees (469 | 49.5%), self-employed (not incorporated) (231 | 24.4%), and local government employees (128 | 13.5%) make up the most common classes of employment.
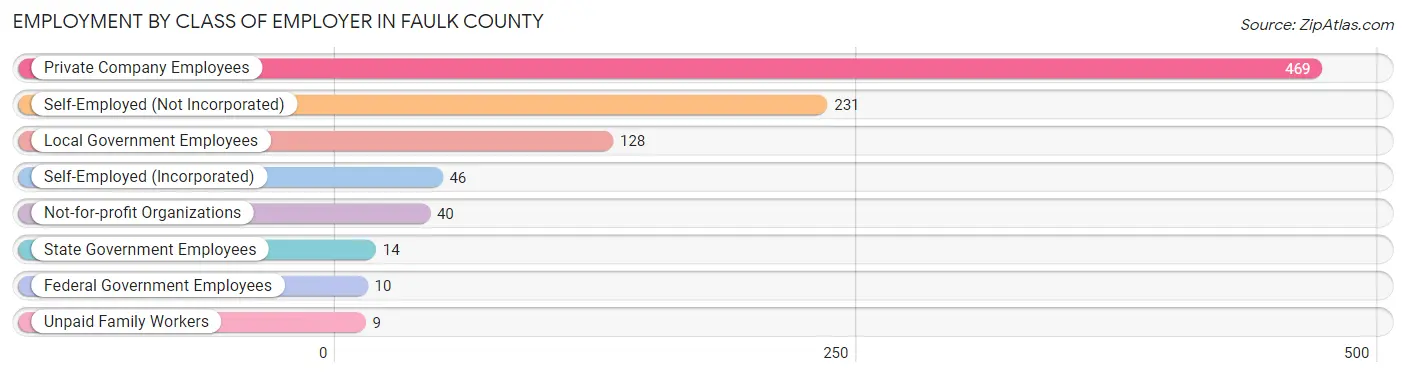
| Employer Class | # Employees | % Employees |
| Private Company Employees | 469 | 49.5% |
| Self-Employed (Incorporated) | 46 | 4.9% |
| Self-Employed (Not Incorporated) | 231 | 24.4% |
| Not-for-profit Organizations | 40 | 4.2% |
| Local Government Employees | 128 | 13.5% |
| State Government Employees | 14 | 1.5% |
| Federal Government Employees | 10 | 1.1% |
| Unpaid Family Workers | 9 | 0.9% |
| Total | 947 | 100.0% |
Employment Status by Age in Faulk County
According to the labor force statistics for Faulk County, out of the total population over 16 years of age (1,667), 59.0% or 984 individuals are in the labor force, with 3.7% or 36 of them unemployed. The age group with the highest labor force participation rate is 55 to 59 years, with 95.7% or 89 individuals in the labor force. Within the labor force, the 30 to 34 years age range has the highest percentage of unemployed individuals, with 32.4% or 34 of them being unemployed.
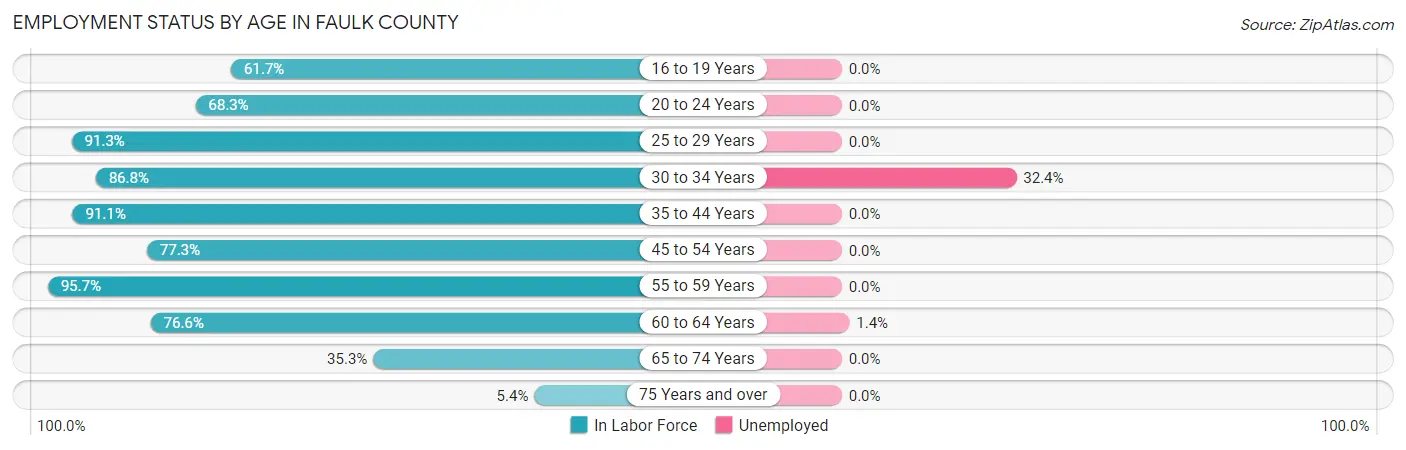
| Age Bracket | In Labor Force | Unemployed |
| 16 to 19 Years | 66 (61.7%) | 0 (0.0%) |
| 20 to 24 Years | 82 (68.3%) | 0 (0.0%) |
| 25 to 29 Years | 63 (91.3%) | 0 (0.0%) |
| 30 to 34 Years | 105 (86.8%) | 34 (32.4%) |
| 35 to 44 Years | 154 (91.1%) | 0 (0.0%) |
| 45 to 54 Years | 177 (77.3%) | 0 (0.0%) |
| 55 to 59 Years | 89 (95.7%) | 0 (0.0%) |
| 60 to 64 Years | 147 (76.6%) | 2 (1.4%) |
| 65 to 74 Years | 82 (35.3%) | 0 (0.0%) |
| 75 Years and over | 18 (5.4%) | 0 (0.0%) |
| Total | 984 (59.0%) | 36 (3.7%) |
Employment Status by Educational Attainment in Faulk County
According to labor force statistics for Faulk County, 84.2% of individuals (735) out of the total population between 25 and 64 years of age (873) are in the labor force, with 4.9% or 36 of them being unemployed. The group with the highest labor force participation rate are those with the educational attainment of high school diploma, with 94.5% or 224 individuals in the labor force. Within the labor force, individuals with less than high school education have the highest percentage of unemployment, with 79.1% or 34 of them being unemployed.
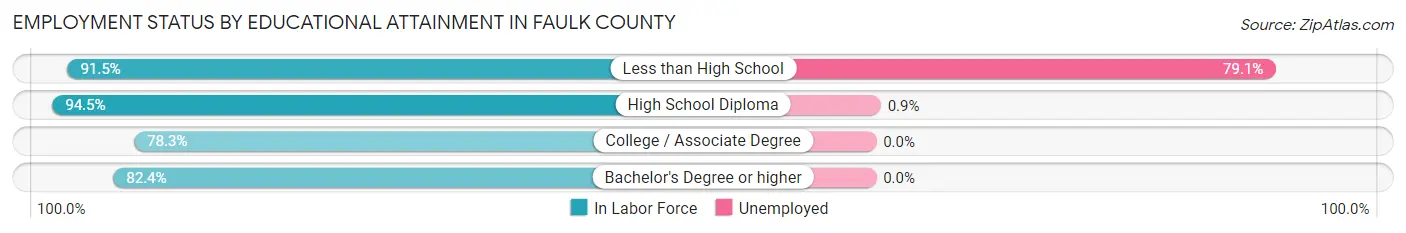
| Educational Attainment | In Labor Force | Unemployed |
| Less than High School | 43 (91.5%) | 37 (79.1%) |
| High School Diploma | 224 (94.5%) | 2 (0.9%) |
| College / Associate Degree | 332 (78.3%) | 0 (0.0%) |
| Bachelor's Degree or higher | 136 (82.4%) | 0 (0.0%) |
| Total | 735 (84.2%) | 43 (4.9%) |
Employment Occupations by Sex in Faulk County
Management, Business, Science and Arts Occupations
The most common Management, Business, Science and Arts occupations in Faulk County are Management (252 | 26.6%), Community & Social Service (67 | 7.1%), Education Instruction & Library (45 | 4.8%), Computers, Engineering & Science (43 | 4.5%), and Health Diagnosing & Treating (40 | 4.2%).
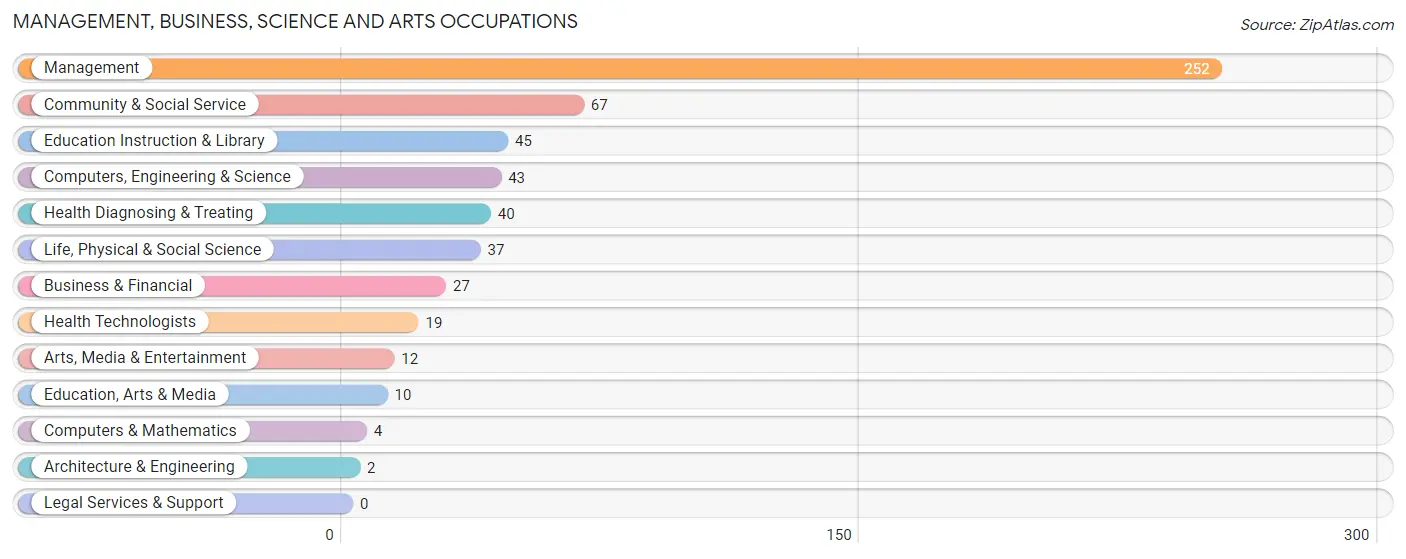
Management, Business, Science and Arts Occupations by Sex
Within the Management, Business, Science and Arts occupations in Faulk County, the most male-oriented occupations are Architecture & Engineering (100.0%), Education, Arts & Media (100.0%), and Business & Financial (96.3%), while the most female-oriented occupations are Computers & Mathematics (100.0%), Health Diagnosing & Treating (100.0%), and Health Technologists (100.0%).

| Occupation | Male | Female |
| Management | 225 (89.3%) | 27 (10.7%) |
| Business & Financial | 26 (96.3%) | 1 (3.7%) |
| Computers, Engineering & Science | 31 (72.1%) | 12 (27.9%) |
| Computers & Mathematics | 0 (0.0%) | 4 (100.0%) |
| Architecture & Engineering | 2 (100.0%) | 0 (0.0%) |
| Life, Physical & Social Science | 29 (78.4%) | 8 (21.6%) |
| Community & Social Service | 20 (29.8%) | 47 (70.2%) |
| Education, Arts & Media | 10 (100.0%) | 0 (0.0%) |
| Legal Services & Support | 0 (0.0%) | 0 (0.0%) |
| Education Instruction & Library | 8 (17.8%) | 37 (82.2%) |
| Arts, Media & Entertainment | 2 (16.7%) | 10 (83.3%) |
| Health Diagnosing & Treating | 0 (0.0%) | 40 (100.0%) |
| Health Technologists | 0 (0.0%) | 19 (100.0%) |
| Total (Category) | 302 (70.4%) | 127 (29.6%) |
| Total (Overall) | 582 (61.5%) | 365 (38.5%) |
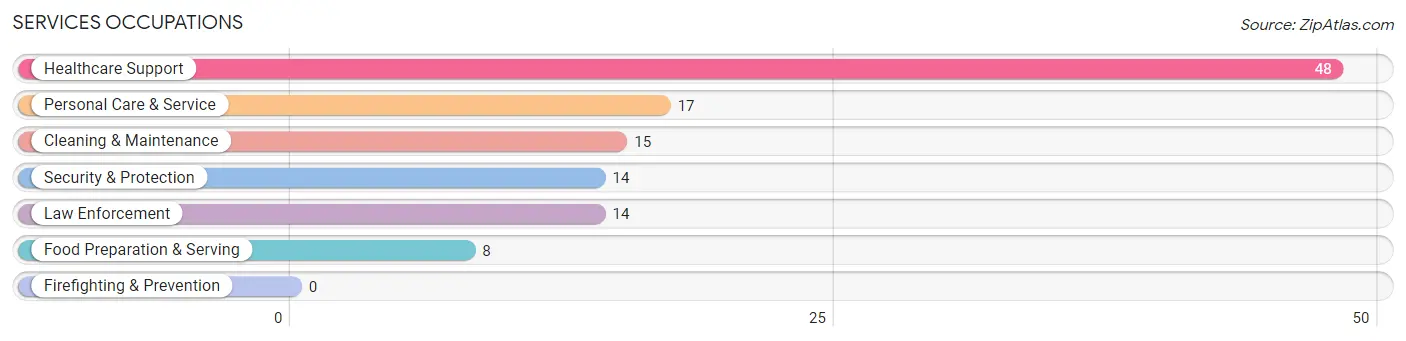
Services Occupations
The most common Services occupations in Faulk County are Healthcare Support (48 | 5.1%), Personal Care & Service (17 | 1.8%), Cleaning & Maintenance (15 | 1.6%), Security & Protection (14 | 1.5%), and Law Enforcement (14 | 1.5%).
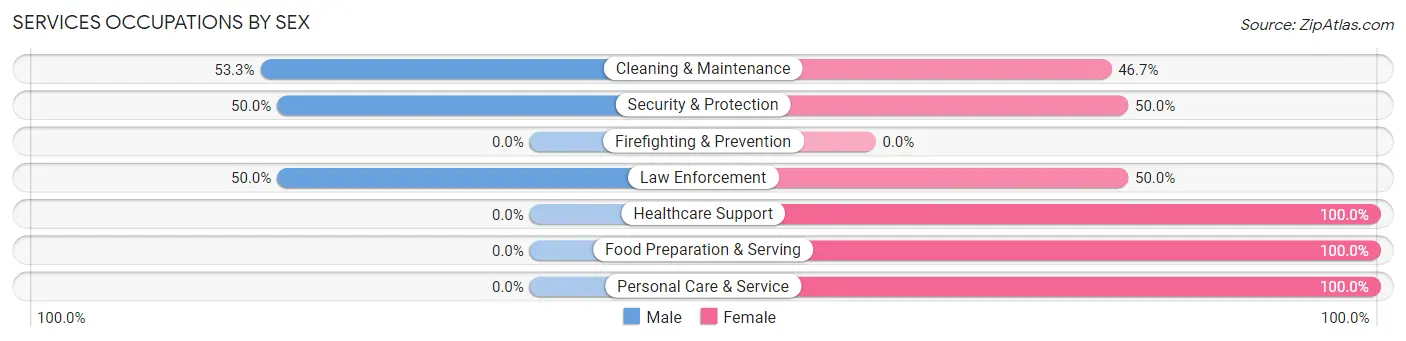
Services Occupations by Sex
Within the Services occupations in Faulk County, the most male-oriented occupations are Cleaning & Maintenance (53.3%), Security & Protection (50.0%), and Law Enforcement (50.0%), while the most female-oriented occupations are Healthcare Support (100.0%), Food Preparation & Serving (100.0%), and Personal Care & Service (100.0%).
| Occupation | Male | Female |
| Healthcare Support | 0 (0.0%) | 48 (100.0%) |
| Security & Protection | 7 (50.0%) | 7 (50.0%) |
| Firefighting & Prevention | 0 (0.0%) | 0 (0.0%) |
| Law Enforcement | 7 (50.0%) | 7 (50.0%) |
| Food Preparation & Serving | 0 (0.0%) | 8 (100.0%) |
| Cleaning & Maintenance | 8 (53.3%) | 7 (46.7%) |
| Personal Care & Service | 0 (0.0%) | 17 (100.0%) |
| Total (Category) | 15 (14.7%) | 87 (85.3%) |
| Total (Overall) | 582 (61.5%) | 365 (38.5%) |
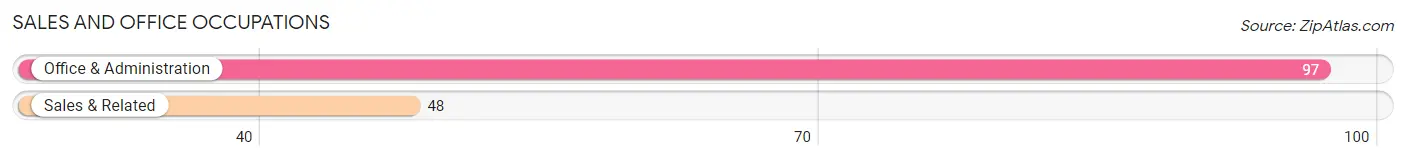
Sales and Office Occupations
The most common Sales and Office occupations in Faulk County are Office & Administration (97 | 10.2%), and Sales & Related (48 | 5.1%).
Sales and Office Occupations by Sex
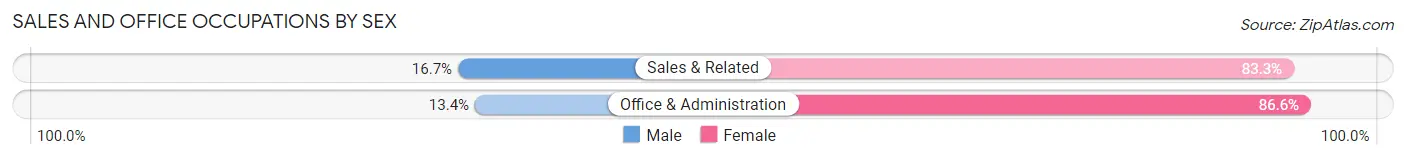
| Occupation | Male | Female |
| Sales & Related | 8 (16.7%) | 40 (83.3%) |
| Office & Administration | 13 (13.4%) | 84 (86.6%) |
| Total (Category) | 21 (14.5%) | 124 (85.5%) |
| Total (Overall) | 582 (61.5%) | 365 (38.5%) |
Natural Resources, Construction and Maintenance Occupations
The most common Natural Resources, Construction and Maintenance occupations in Faulk County are Construction & Extraction (80 | 8.5%), Farming, Fishing & Forestry (75 | 7.9%), and Installation, Maintenance & Repair (16 | 1.7%).

Natural Resources, Construction and Maintenance Occupations by Sex
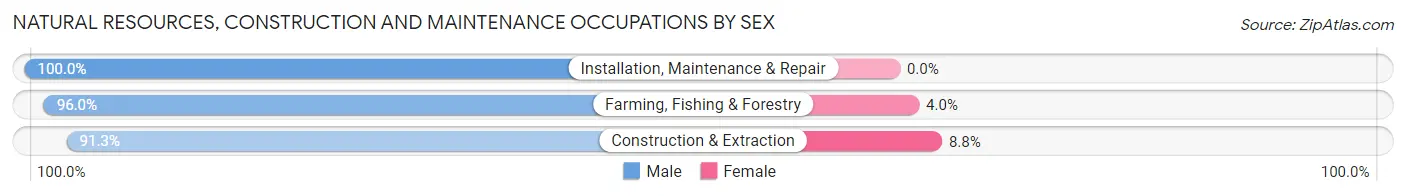
| Occupation | Male | Female |
| Farming, Fishing & Forestry | 72 (96.0%) | 3 (4.0%) |
| Construction & Extraction | 73 (91.2%) | 7 (8.7%) |
| Installation, Maintenance & Repair | 16 (100.0%) | 0 (0.0%) |
| Total (Category) | 161 (94.2%) | 10 (5.9%) |
| Total (Overall) | 582 (61.5%) | 365 (38.5%) |
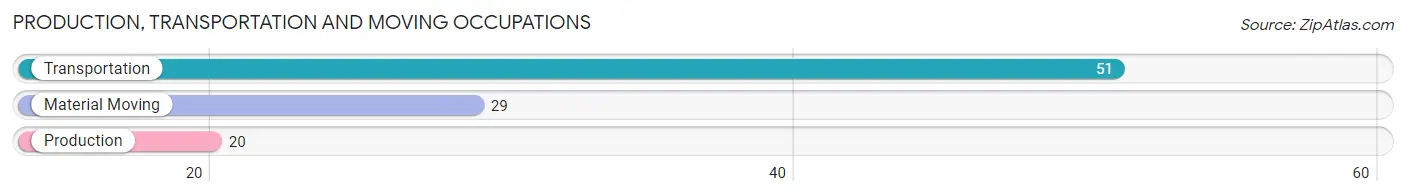
Production, Transportation and Moving Occupations
The most common Production, Transportation and Moving occupations in Faulk County are Transportation (51 | 5.4%), Material Moving (29 | 3.1%), and Production (20 | 2.1%).
Production, Transportation and Moving Occupations by Sex
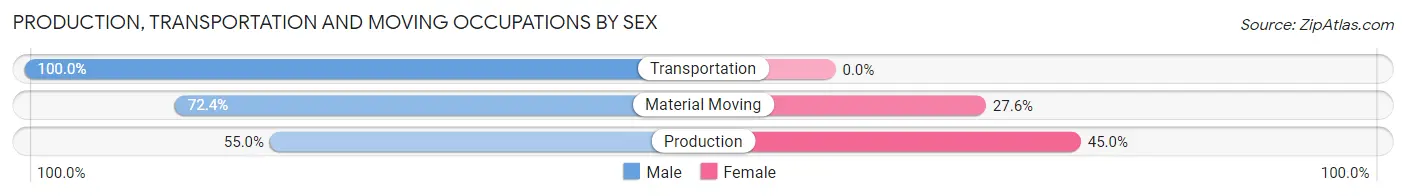
| Occupation | Male | Female |
| Production | 11 (55.0%) | 9 (45.0%) |
| Transportation | 51 (100.0%) | 0 (0.0%) |
| Material Moving | 21 (72.4%) | 8 (27.6%) |
| Total (Category) | 83 (83.0%) | 17 (17.0%) |
| Total (Overall) | 582 (61.5%) | 365 (38.5%) |
Employment Industries by Sex in Faulk County
Employment Industries in Faulk County
The major employment industries in Faulk County include Agriculture, Fishing & Hunting (299 | 31.6%), Retail Trade (92 | 9.7%), Health Care & Social Assistance (92 | 9.7%), Construction (85 | 9.0%), and Educational Services (74 | 7.8%).

Employment Industries by Sex in Faulk County
The Faulk County industries that see more men than women are Arts, Entertainment & Recreation (100.0%), Agriculture, Fishing & Hunting (92.6%), and Wholesale Trade (90.9%), whereas the industries that tend to have a higher number of women are Enterprise Management (100.0%), Accommodation & Food Services (100.0%), and Health Care & Social Assistance (95.7%).
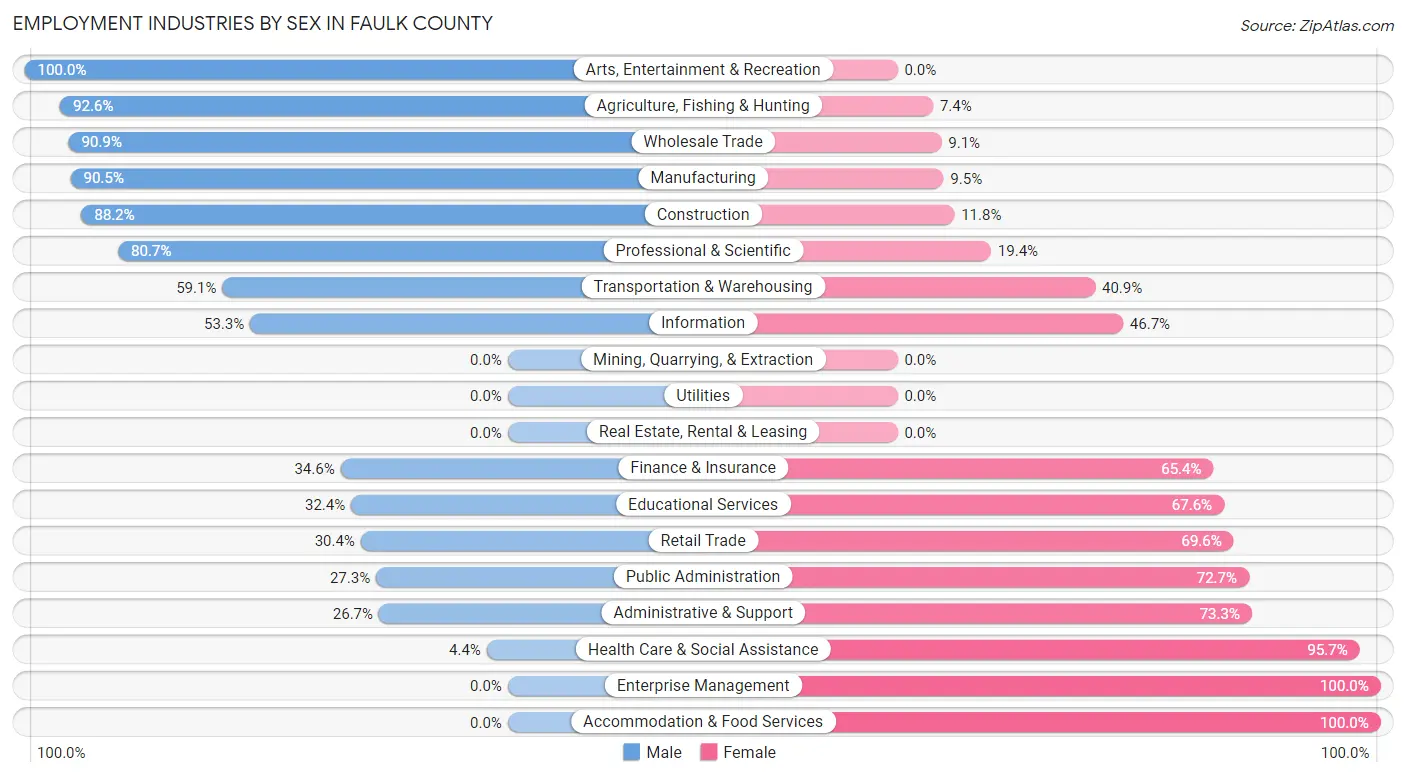
| Industry | Male | Female |
| Agriculture, Fishing & Hunting | 277 (92.6%) | 22 (7.4%) |
| Mining, Quarrying, & Extraction | 0 (0.0%) | 0 (0.0%) |
| Construction | 75 (88.2%) | 10 (11.8%) |
| Manufacturing | 19 (90.5%) | 2 (9.5%) |
| Wholesale Trade | 10 (90.9%) | 1 (9.1%) |
| Retail Trade | 28 (30.4%) | 64 (69.6%) |
| Transportation & Warehousing | 26 (59.1%) | 18 (40.9%) |
| Utilities | 0 (0.0%) | 0 (0.0%) |
| Information | 16 (53.3%) | 14 (46.7%) |
| Finance & Insurance | 9 (34.6%) | 17 (65.4%) |
| Real Estate, Rental & Leasing | 0 (0.0%) | 0 (0.0%) |
| Professional & Scientific | 50 (80.6%) | 12 (19.4%) |
| Enterprise Management | 0 (0.0%) | 6 (100.0%) |
| Administrative & Support | 4 (26.7%) | 11 (73.3%) |
| Educational Services | 24 (32.4%) | 50 (67.6%) |
| Health Care & Social Assistance | 4 (4.3%) | 88 (95.7%) |
| Arts, Entertainment & Recreation | 4 (100.0%) | 0 (0.0%) |
| Accommodation & Food Services | 0 (0.0%) | 12 (100.0%) |
| Public Administration | 12 (27.3%) | 32 (72.7%) |
| Total | 582 (61.5%) | 365 (38.5%) |
Education in Faulk County
School Enrollment in Faulk County
The most common levels of schooling among the 423 students in Faulk County are high school (125 | 29.5%), middle school (124 | 29.3%), and elementary school (81 | 19.2%).
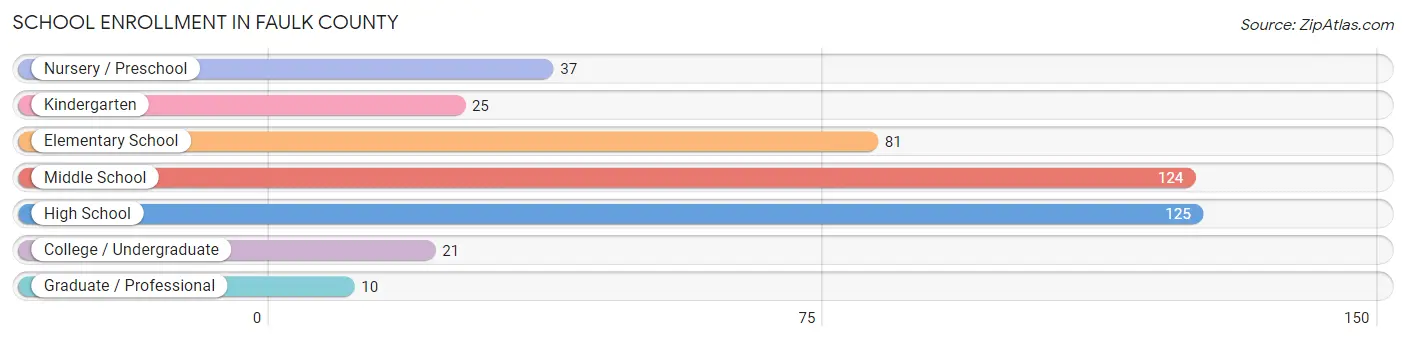
| School Level | # Students | % Students |
| Nursery / Preschool | 37 | 8.7% |
| Kindergarten | 25 | 5.9% |
| Elementary School | 81 | 19.2% |
| Middle School | 124 | 29.3% |
| High School | 125 | 29.5% |
| College / Undergraduate | 21 | 5.0% |
| Graduate / Professional | 10 | 2.4% |
| Total | 423 | 100.0% |
School Enrollment by Age by Funding Source in Faulk County
Out of a total of 423 students who are enrolled in schools in Faulk County, 10 (2.4%) attend a private institution, while the remaining 413 (97.6%) are enrolled in public schools. The age group of 10 to 14 year olds has the highest likelihood of being enrolled in private schools, with 10 (6.6% in the age bracket) enrolled. Conversely, the age group of 3 to 4 year olds has the lowest likelihood of being enrolled in a private school, with 20 (100.0% in the age bracket) attending a public institution.
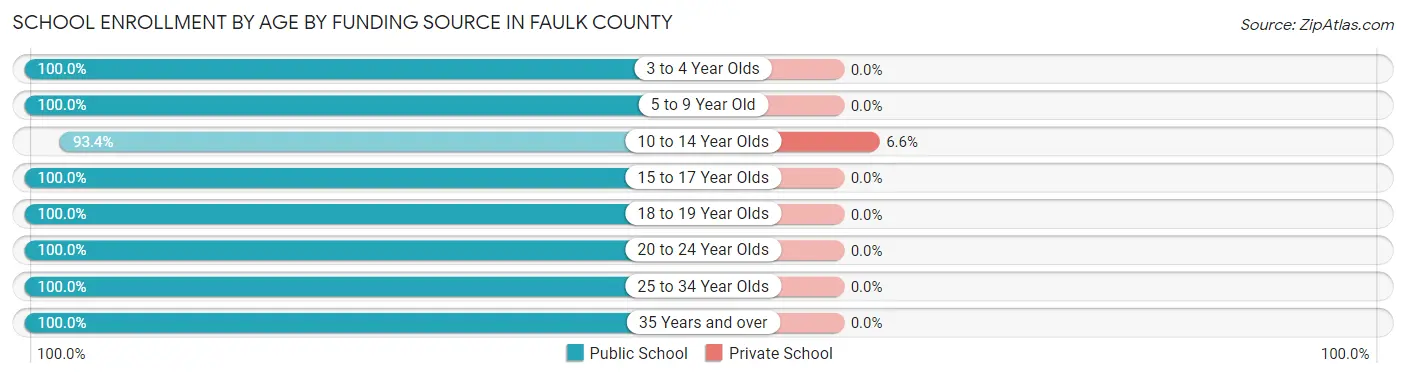
| Age Bracket | Public School | Private School |
| 3 to 4 Year Olds | 20 (100.0%) | 0 (0.0%) |
| 5 to 9 Year Old | 99 (100.0%) | 0 (0.0%) |
| 10 to 14 Year Olds | 141 (93.4%) | 10 (6.6%) |
| 15 to 17 Year Olds | 106 (100.0%) | 0 (0.0%) |
| 18 to 19 Year Olds | 20 (100.0%) | 0 (0.0%) |
| 20 to 24 Year Olds | 15 (100.0%) | 0 (0.0%) |
| 25 to 34 Year Olds | 5 (100.0%) | 0 (0.0%) |
| 35 Years and over | 7 (100.0%) | 0 (0.0%) |
| Total | 413 (97.6%) | 10 (2.4%) |
Educational Attainment by Field of Study in Faulk County
Education (135 | 40.4%), business (46 | 13.8%), bio, nature & agricultural (35 | 10.5%), science & technology (34 | 10.2%), and visual & performing arts (27 | 8.1%) are the most common fields of study among 334 individuals in Faulk County who have obtained a bachelor's degree or higher.

| Field of Study | # Graduates | % Graduates |
| Computers & Mathematics | 4 | 1.2% |
| Bio, Nature & Agricultural | 35 | 10.5% |
| Physical & Health Sciences | 4 | 1.2% |
| Psychology | 5 | 1.5% |
| Social Sciences | 14 | 4.2% |
| Engineering | 7 | 2.1% |
| Multidisciplinary Studies | 0 | 0.0% |
| Science & Technology | 34 | 10.2% |
| Business | 46 | 13.8% |
| Education | 135 | 40.4% |
| Literature & Languages | 0 | 0.0% |
| Liberal Arts & History | 2 | 0.6% |
| Visual & Performing Arts | 27 | 8.1% |
| Communications | 2 | 0.6% |
| Arts & Humanities | 19 | 5.7% |
| Total | 334 | 100.0% |
Transportation & Commute in Faulk County
Vehicle Availability by Sex in Faulk County
The most prevalent vehicle ownership categories in Faulk County are males with 3 vehicles (157, accounting for 28.6%) and females with 3 vehicles (136, making up 43.0%).
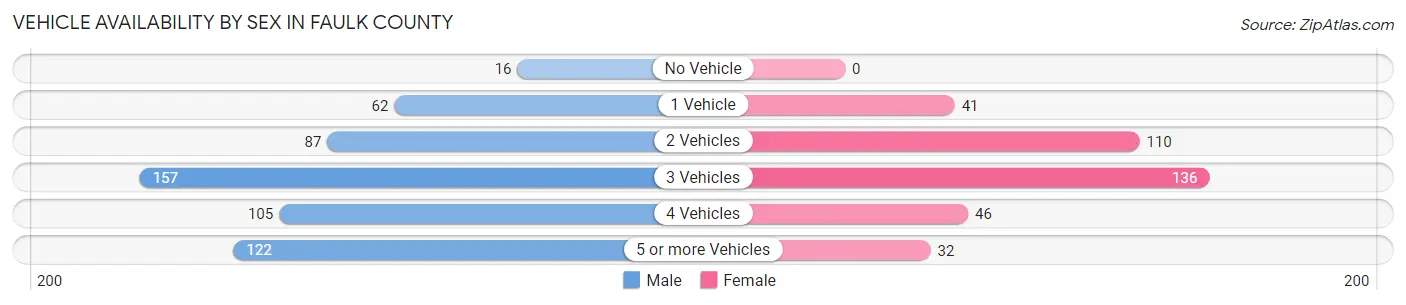
| Vehicles Available | Male | Female |
| No Vehicle | 16 (2.9%) | 0 (0.0%) |
| 1 Vehicle | 62 (11.3%) | 41 (11.2%) |
| 2 Vehicles | 87 (15.9%) | 110 (30.1%) |
| 3 Vehicles | 157 (28.6%) | 136 (37.3%) |
| 4 Vehicles | 105 (19.1%) | 46 (12.6%) |
| 5 or more Vehicles | 122 (22.2%) | 32 (8.8%) |
| Total | 549 (100.0%) | 365 (100.0%) |
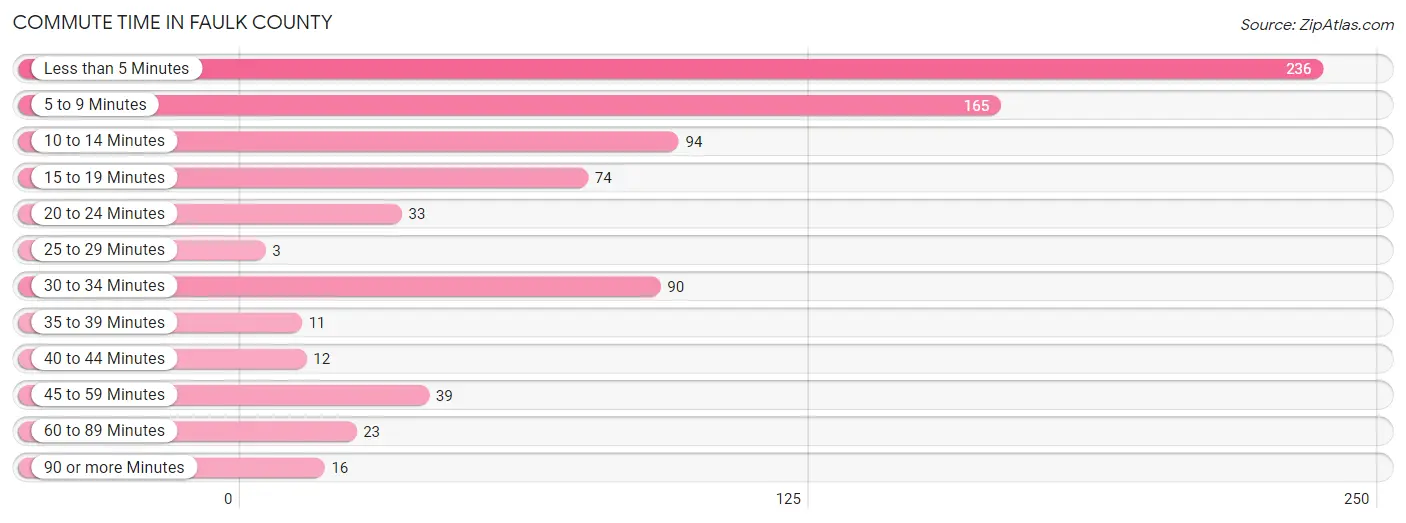
Commute Time in Faulk County
The most frequently occuring commute durations in Faulk County are less than 5 minutes (236 commuters, 29.6%), 5 to 9 minutes (165 commuters, 20.7%), and 10 to 14 minutes (94 commuters, 11.8%).
| Commute Time | # Commuters | % Commuters |
| Less than 5 Minutes | 236 | 29.6% |
| 5 to 9 Minutes | 165 | 20.7% |
| 10 to 14 Minutes | 94 | 11.8% |
| 15 to 19 Minutes | 74 | 9.3% |
| 20 to 24 Minutes | 33 | 4.2% |
| 25 to 29 Minutes | 3 | 0.4% |
| 30 to 34 Minutes | 90 | 11.3% |
| 35 to 39 Minutes | 11 | 1.4% |
| 40 to 44 Minutes | 12 | 1.5% |
| 45 to 59 Minutes | 39 | 4.9% |
| 60 to 89 Minutes | 23 | 2.9% |
| 90 or more Minutes | 16 | 2.0% |
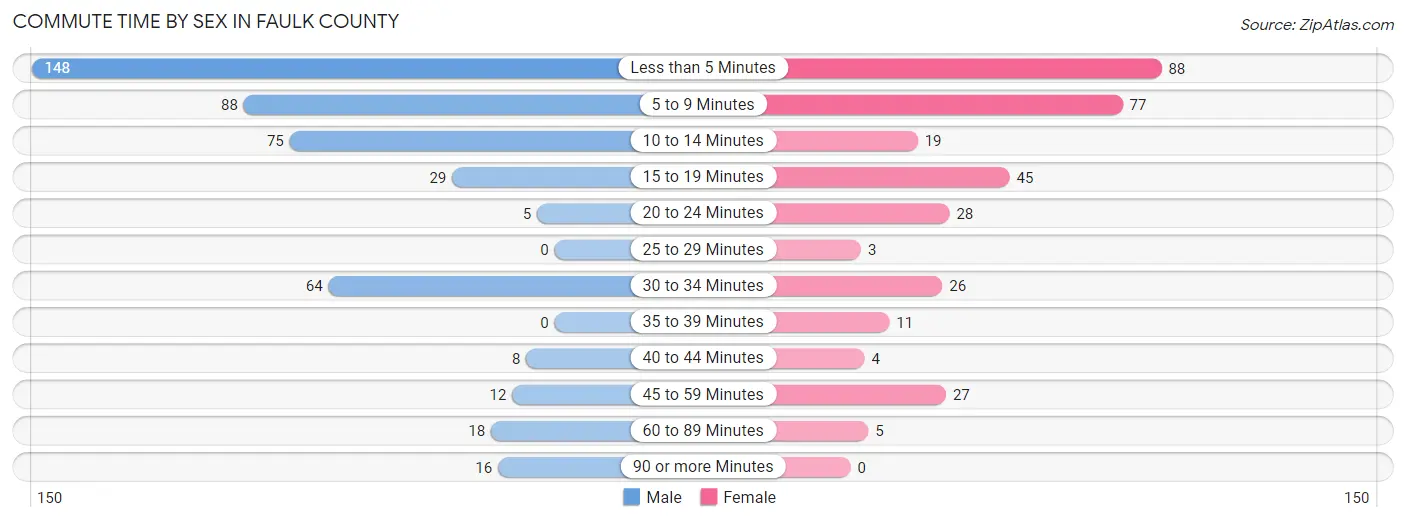
Commute Time by Sex in Faulk County
The most common commute times in Faulk County are less than 5 minutes (148 commuters, 32.0%) for males and less than 5 minutes (88 commuters, 26.4%) for females.
| Commute Time | Male | Female |
| Less than 5 Minutes | 148 (32.0%) | 88 (26.4%) |
| 5 to 9 Minutes | 88 (19.0%) | 77 (23.1%) |
| 10 to 14 Minutes | 75 (16.2%) | 19 (5.7%) |
| 15 to 19 Minutes | 29 (6.3%) | 45 (13.5%) |
| 20 to 24 Minutes | 5 (1.1%) | 28 (8.4%) |
| 25 to 29 Minutes | 0 (0.0%) | 3 (0.9%) |
| 30 to 34 Minutes | 64 (13.8%) | 26 (7.8%) |
| 35 to 39 Minutes | 0 (0.0%) | 11 (3.3%) |
| 40 to 44 Minutes | 8 (1.7%) | 4 (1.2%) |
| 45 to 59 Minutes | 12 (2.6%) | 27 (8.1%) |
| 60 to 89 Minutes | 18 (3.9%) | 5 (1.5%) |
| 90 or more Minutes | 16 (3.5%) | 0 (0.0%) |
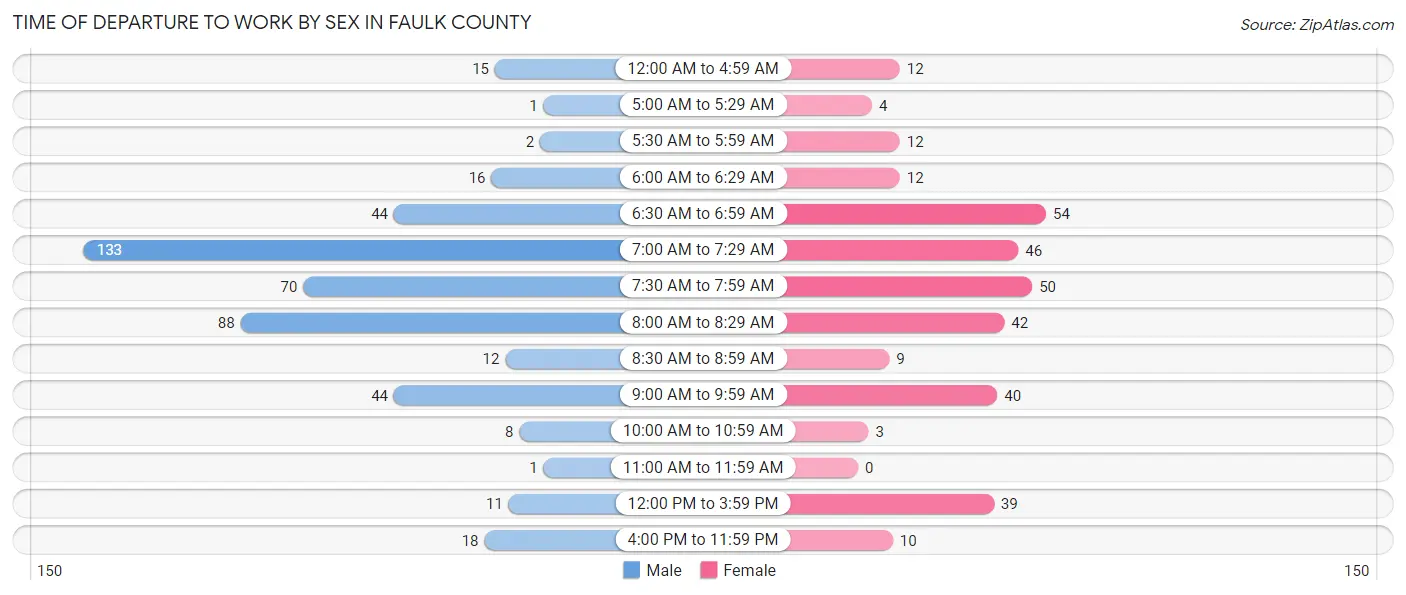
Time of Departure to Work by Sex in Faulk County
The most frequent times of departure to work in Faulk County are 7:00 AM to 7:29 AM (133, 28.7%) for males and 6:30 AM to 6:59 AM (54, 16.2%) for females.
| Time of Departure | Male | Female |
| 12:00 AM to 4:59 AM | 15 (3.2%) | 12 (3.6%) |
| 5:00 AM to 5:29 AM | 1 (0.2%) | 4 (1.2%) |
| 5:30 AM to 5:59 AM | 2 (0.4%) | 12 (3.6%) |
| 6:00 AM to 6:29 AM | 16 (3.5%) | 12 (3.6%) |
| 6:30 AM to 6:59 AM | 44 (9.5%) | 54 (16.2%) |
| 7:00 AM to 7:29 AM | 133 (28.7%) | 46 (13.8%) |
| 7:30 AM to 7:59 AM | 70 (15.1%) | 50 (15.0%) |
| 8:00 AM to 8:29 AM | 88 (19.0%) | 42 (12.6%) |
| 8:30 AM to 8:59 AM | 12 (2.6%) | 9 (2.7%) |
| 9:00 AM to 9:59 AM | 44 (9.5%) | 40 (12.0%) |
| 10:00 AM to 10:59 AM | 8 (1.7%) | 3 (0.9%) |
| 11:00 AM to 11:59 AM | 1 (0.2%) | 0 (0.0%) |
| 12:00 PM to 3:59 PM | 11 (2.4%) | 39 (11.7%) |
| 4:00 PM to 11:59 PM | 18 (3.9%) | 10 (3.0%) |
| Total | 463 (100.0%) | 333 (100.0%) |
Housing Occupancy in Faulk County
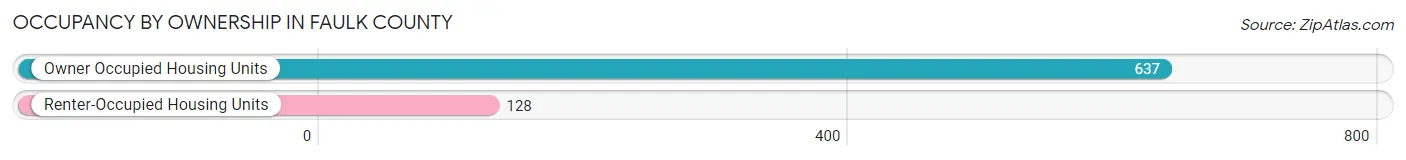
Occupancy by Ownership in Faulk County
Of the total 765 dwellings in Faulk County, owner-occupied units account for 637 (83.3%), while renter-occupied units make up 128 (16.7%).
| Occupancy | # Housing Units | % Housing Units |
| Owner Occupied Housing Units | 637 | 83.3% |
| Renter-Occupied Housing Units | 128 | 16.7% |
| Total Occupied Housing Units | 765 | 100.0% |
Occupancy by Household Size in Faulk County

| Household Size | # Housing Units | % Housing Units |
| 1-Person Household | 296 | 38.7% |
| 2-Person Household | 258 | 33.7% |
| 3-Person Household | 77 | 10.1% |
| 4+ Person Household | 134 | 17.5% |
| Total Housing Units | 765 | 100.0% |
Occupancy by Ownership by Household Size in Faulk County
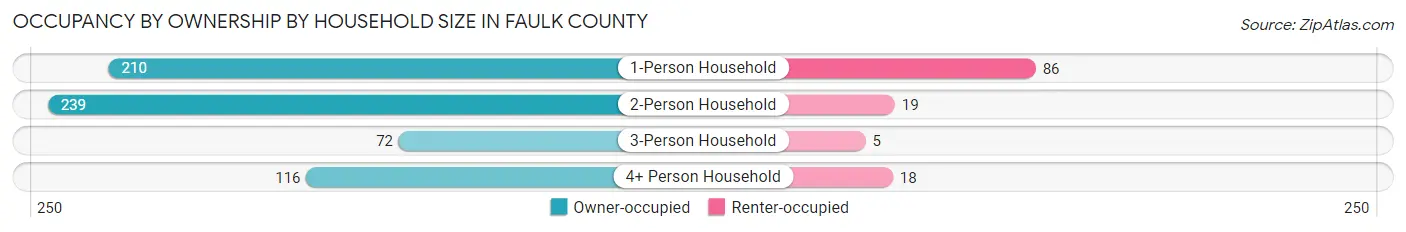
| Household Size | Owner-occupied | Renter-occupied |
| 1-Person Household | 210 (71.0%) | 86 (29.0%) |
| 2-Person Household | 239 (92.6%) | 19 (7.4%) |
| 3-Person Household | 72 (93.5%) | 5 (6.5%) |
| 4+ Person Household | 116 (86.6%) | 18 (13.4%) |
| Total Housing Units | 637 (83.3%) | 128 (16.7%) |
Occupancy by Educational Attainment in Faulk County
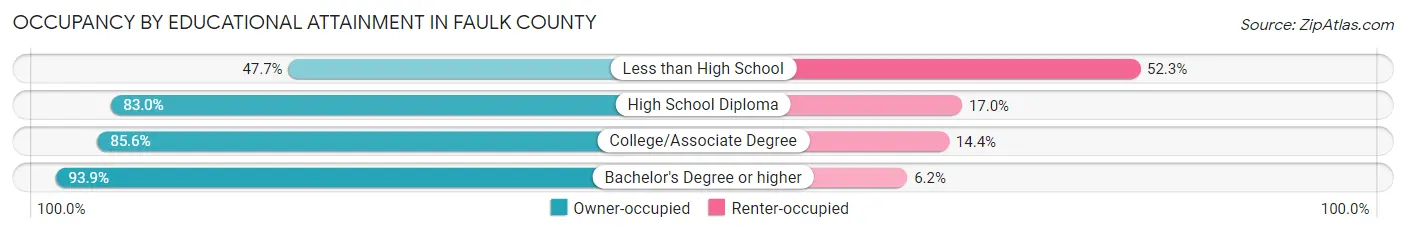
| Household Size | Owner-occupied | Renter-occupied |
| Less than High School | 31 (47.7%) | 34 (52.3%) |
| High School Diploma | 122 (83.0%) | 25 (17.0%) |
| College/Associate Degree | 362 (85.6%) | 61 (14.4%) |
| Bachelor's Degree or higher | 122 (93.9%) | 8 (6.1%) |
Occupancy by Age of Householder in Faulk County
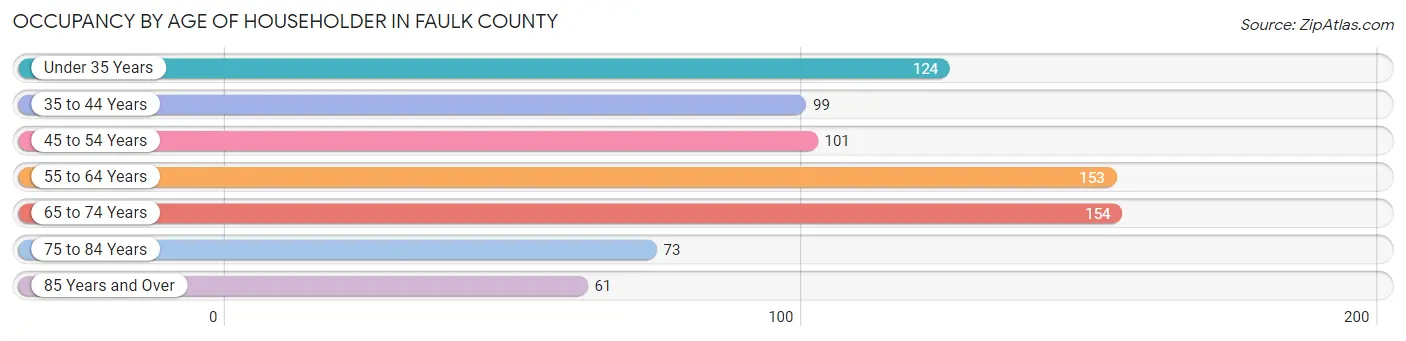
| Age Bracket | # Households | % Households |
| Under 35 Years | 124 | 16.2% |
| 35 to 44 Years | 99 | 12.9% |
| 45 to 54 Years | 101 | 13.2% |
| 55 to 64 Years | 153 | 20.0% |
| 65 to 74 Years | 154 | 20.1% |
| 75 to 84 Years | 73 | 9.5% |
| 85 Years and Over | 61 | 8.0% |
| Total | 765 | 100.0% |
Housing Finances in Faulk County
Median Income by Occupancy in Faulk County
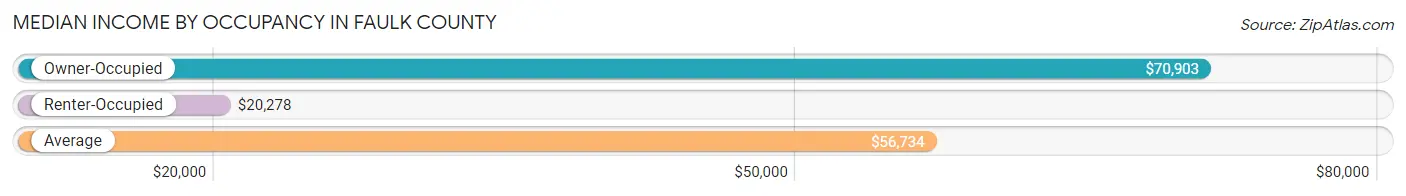
| Occupancy Type | # Households | Median Income |
| Owner-Occupied | 637 (83.3%) | $70,903 |
| Renter-Occupied | 128 (16.7%) | $20,278 |
| Average | 765 (100.0%) | $56,734 |
Occupancy by Householder Income Bracket in Faulk County
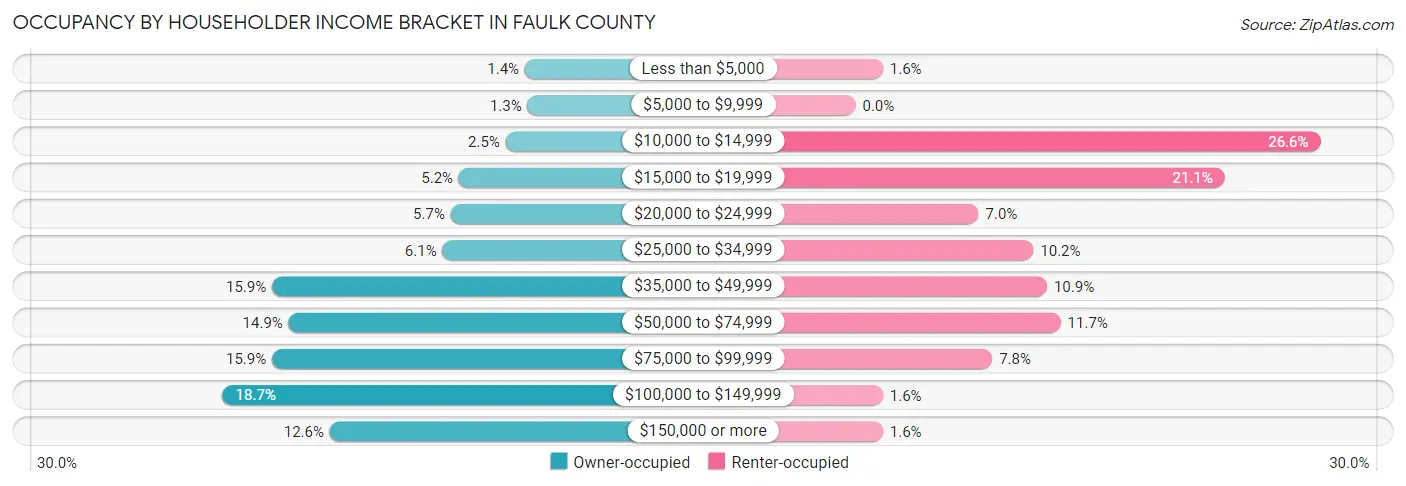
| Income Bracket | Owner-occupied | Renter-occupied |
| Less than $5,000 | 9 (1.4%) | 2 (1.6%) |
| $5,000 to $9,999 | 8 (1.3%) | 0 (0.0%) |
| $10,000 to $14,999 | 16 (2.5%) | 34 (26.6%) |
| $15,000 to $19,999 | 33 (5.2%) | 27 (21.1%) |
| $20,000 to $24,999 | 36 (5.7%) | 9 (7.0%) |
| $25,000 to $34,999 | 39 (6.1%) | 13 (10.2%) |
| $35,000 to $49,999 | 101 (15.9%) | 14 (10.9%) |
| $50,000 to $74,999 | 95 (14.9%) | 15 (11.7%) |
| $75,000 to $99,999 | 101 (15.9%) | 10 (7.8%) |
| $100,000 to $149,999 | 119 (18.7%) | 2 (1.6%) |
| $150,000 or more | 80 (12.6%) | 2 (1.6%) |
| Total | 637 (100.0%) | 128 (100.0%) |
Monthly Housing Cost Tiers in Faulk County

| Monthly Cost | Owner-occupied | Renter-occupied |
| Less than $300 | 59 (9.3%) | 4 (3.1%) |
| $300 to $499 | 147 (23.1%) | 2 (1.6%) |
| $500 to $799 | 216 (33.9%) | 16 (12.5%) |
| $800 to $999 | 45 (7.1%) | 10 (7.8%) |
| $1,000 to $1,499 | 96 (15.1%) | 5 (3.9%) |
| $1,500 to $1,999 | 48 (7.5%) | 0 (0.0%) |
| $2,000 to $2,499 | 14 (2.2%) | 0 (0.0%) |
| $2,500 to $2,999 | 0 (0.0%) | 0 (0.0%) |
| $3,000 or more | 12 (1.9%) | 7 (5.5%) |
| Total | 637 (100.0%) | 128 (100.0%) |
Physical Housing Characteristics in Faulk County
Housing Structures in Faulk County
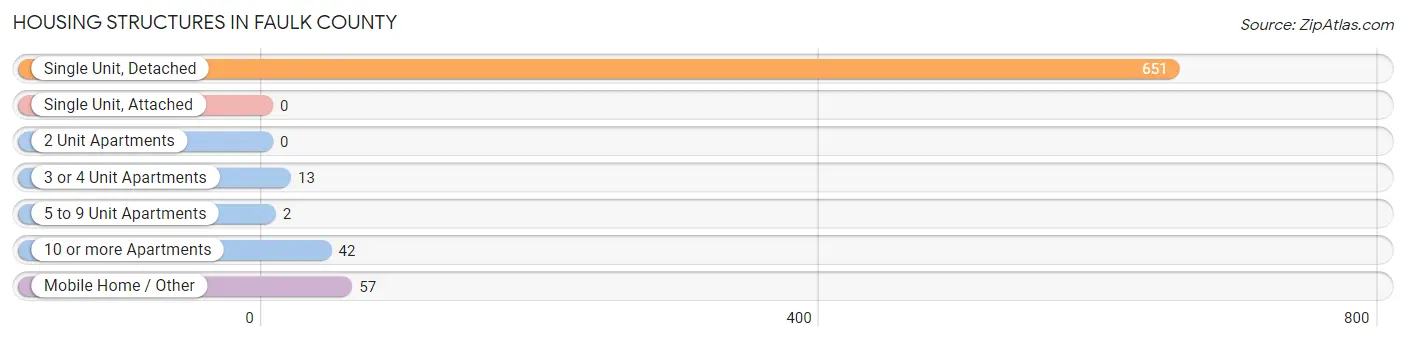
| Structure Type | # Housing Units | % Housing Units |
| Single Unit, Detached | 651 | 85.1% |
| Single Unit, Attached | 0 | 0.0% |
| 2 Unit Apartments | 0 | 0.0% |
| 3 or 4 Unit Apartments | 13 | 1.7% |
| 5 to 9 Unit Apartments | 2 | 0.3% |
| 10 or more Apartments | 42 | 5.5% |
| Mobile Home / Other | 57 | 7.4% |
| Total | 765 | 100.0% |
Housing Structures by Occupancy in Faulk County
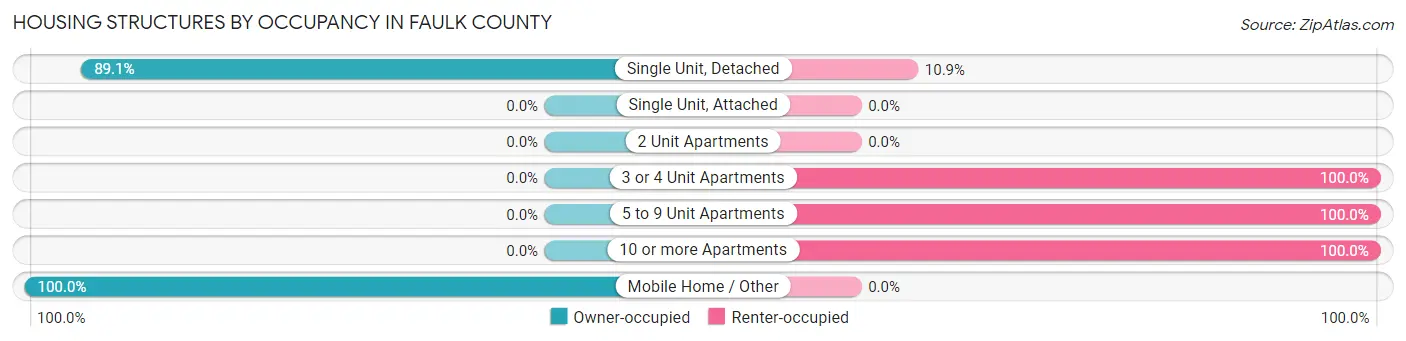
| Structure Type | Owner-occupied | Renter-occupied |
| Single Unit, Detached | 580 (89.1%) | 71 (10.9%) |
| Single Unit, Attached | 0 (0.0%) | 0 (0.0%) |
| 2 Unit Apartments | 0 (0.0%) | 0 (0.0%) |
| 3 or 4 Unit Apartments | 0 (0.0%) | 13 (100.0%) |
| 5 to 9 Unit Apartments | 0 (0.0%) | 2 (100.0%) |
| 10 or more Apartments | 0 (0.0%) | 42 (100.0%) |
| Mobile Home / Other | 57 (100.0%) | 0 (0.0%) |
| Total | 637 (83.3%) | 128 (16.7%) |
Housing Structures by Number of Rooms in Faulk County

| Number of Rooms | Owner-occupied | Renter-occupied |
| 1 Room | 2 (0.3%) | 0 (0.0%) |
| 2 or 3 Rooms | 12 (1.9%) | 42 (32.8%) |
| 4 or 5 Rooms | 164 (25.8%) | 41 (32.0%) |
| 6 or 7 Rooms | 211 (33.1%) | 18 (14.1%) |
| 8 or more Rooms | 248 (38.9%) | 27 (21.1%) |
| Total | 637 (100.0%) | 128 (100.0%) |
Housing Structure by Heating Type in Faulk County
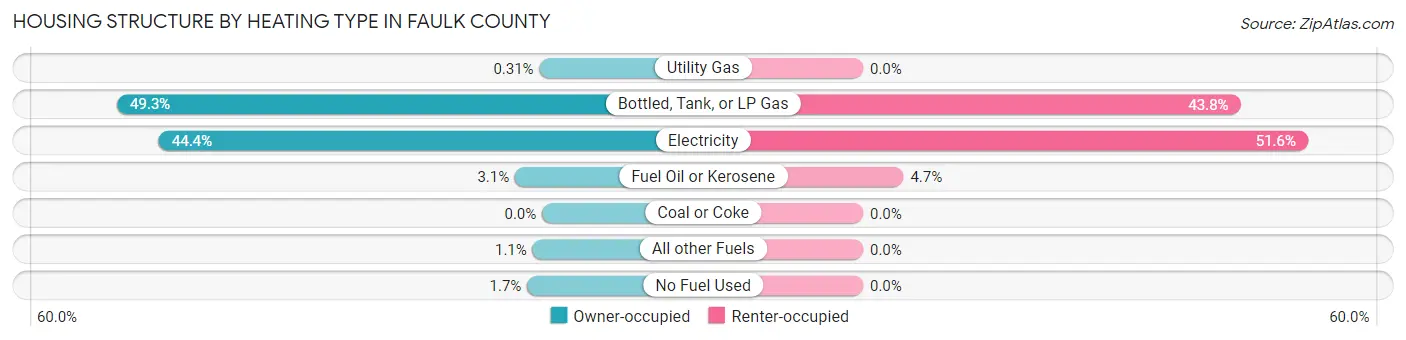
| Heating Type | Owner-occupied | Renter-occupied |
| Utility Gas | 2 (0.3%) | 0 (0.0%) |
| Bottled, Tank, or LP Gas | 314 (49.3%) | 56 (43.8%) |
| Electricity | 283 (44.4%) | 66 (51.6%) |
| Fuel Oil or Kerosene | 20 (3.1%) | 6 (4.7%) |
| Coal or Coke | 0 (0.0%) | 0 (0.0%) |
| All other Fuels | 7 (1.1%) | 0 (0.0%) |
| No Fuel Used | 11 (1.7%) | 0 (0.0%) |
| Total | 637 (100.0%) | 128 (100.0%) |
Household Vehicle Usage in Faulk County
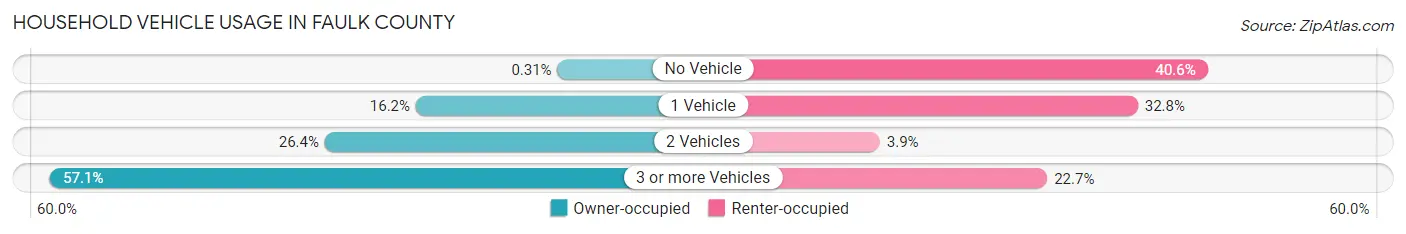
| Vehicles per Household | Owner-occupied | Renter-occupied |
| No Vehicle | 2 (0.3%) | 52 (40.6%) |
| 1 Vehicle | 103 (16.2%) | 42 (32.8%) |
| 2 Vehicles | 168 (26.4%) | 5 (3.9%) |
| 3 or more Vehicles | 364 (57.1%) | 29 (22.7%) |
| Total | 637 (100.0%) | 128 (100.0%) |
Real Estate & Mortgages in Faulk County
Real Estate and Mortgage Overview in Faulk County
| Characteristic | Without Mortgage | With Mortgage |
| Housing Units | 442 | 195 |
| Median Property Value | $98,100 | $154,900 |
| Median Household Income | $55,735 | $24 |
| Monthly Housing Costs | $522 | $12 |
| Real Estate Taxes | $891 | $2 |
Property Value by Mortgage Status in Faulk County

| Property Value | Without Mortgage | With Mortgage |
| Less than $50,000 | 137 (31.0%) | 28 (14.4%) |
| $50,000 to $99,999 | 89 (20.1%) | 26 (13.3%) |
| $100,000 to $299,999 | 146 (33.0%) | 120 (61.5%) |
| $300,000 to $499,999 | 42 (9.5%) | 19 (9.7%) |
| $500,000 to $749,999 | 18 (4.1%) | 2 (1.0%) |
| $750,000 to $999,999 | 10 (2.3%) | 0 (0.0%) |
| $1,000,000 or more | 0 (0.0%) | 0 (0.0%) |
| Total | 442 (100.0%) | 195 (100.0%) |
Household Income by Mortgage Status in Faulk County

| Household Income | Without Mortgage | With Mortgage |
| Less than $10,000 | 15 (3.4%) | 0 (0.0%) |
| $10,000 to $24,999 | 57 (12.9%) | 2 (1.0%) |
| $25,000 to $34,999 | 35 (7.9%) | 28 (14.4%) |
| $35,000 to $49,999 | 96 (21.7%) | 4 (2.1%) |
| $50,000 to $74,999 | 63 (14.2%) | 5 (2.6%) |
| $75,000 to $99,999 | 47 (10.6%) | 32 (16.4%) |
| $100,000 to $149,999 | 73 (16.5%) | 54 (27.7%) |
| $150,000 or more | 56 (12.7%) | 46 (23.6%) |
| Total | 442 (100.0%) | 195 (100.0%) |
Property Value to Household Income Ratio in Faulk County
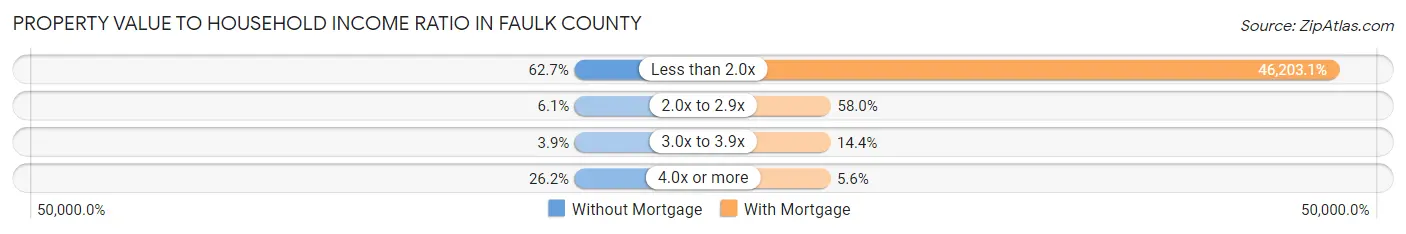
| Value-to-Income Ratio | Without Mortgage | With Mortgage |
| Less than 2.0x | 277 (62.7%) | 90,096 (46,203.1%) |
| 2.0x to 2.9x | 27 (6.1%) | 113 (58.0%) |
| 3.0x to 3.9x | 17 (3.8%) | 28 (14.4%) |
| 4.0x or more | 116 (26.2%) | 11 (5.6%) |
| Total | 442 (100.0%) | 195 (100.0%) |
Real Estate Taxes by Mortgage Status in Faulk County
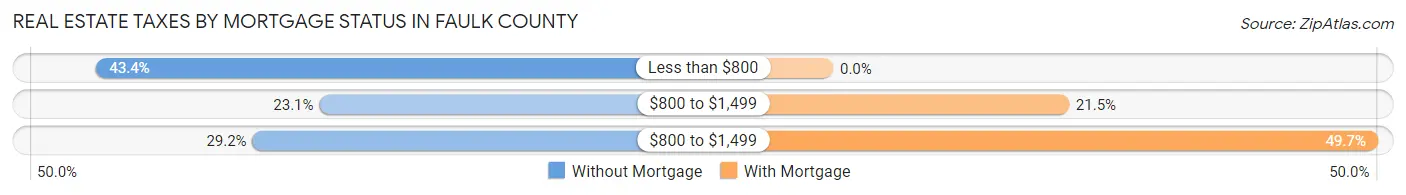
| Property Taxes | Without Mortgage | With Mortgage |
| Less than $800 | 192 (43.4%) | 0 (0.0%) |
| $800 to $1,499 | 102 (23.1%) | 42 (21.5%) |
| $800 to $1,499 | 129 (29.2%) | 97 (49.7%) |
| Total | 442 (100.0%) | 195 (100.0%) |
Health & Disability in Faulk County
Health Insurance Coverage by Age in Faulk County
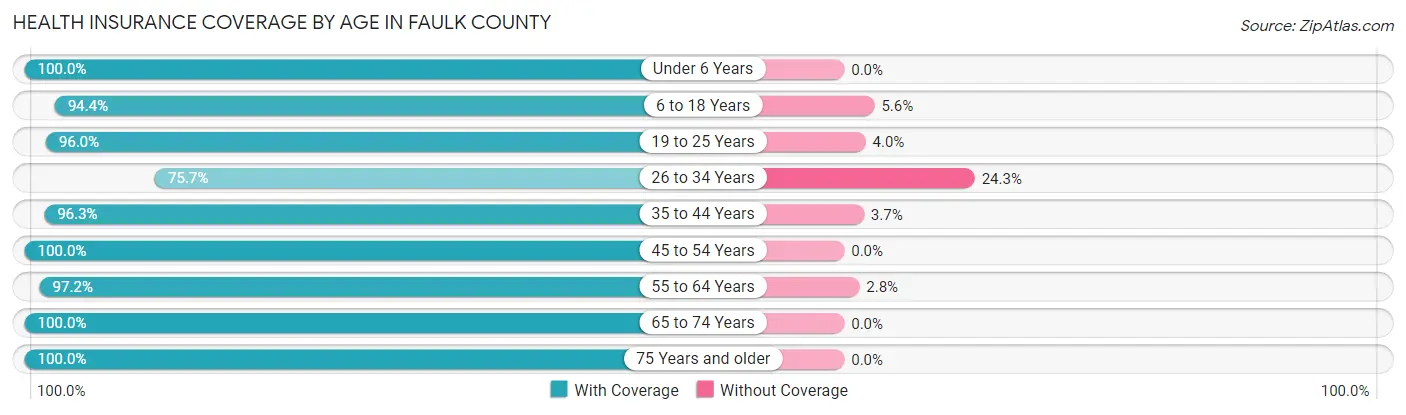
| Age Bracket | With Coverage | Without Coverage |
| Under 6 Years | 150 (100.0%) | 0 (0.0%) |
| 6 to 18 Years | 402 (94.4%) | 24 (5.6%) |
| 19 to 25 Years | 121 (96.0%) | 5 (4.0%) |
| 26 to 34 Years | 140 (75.7%) | 45 (24.3%) |
| 35 to 44 Years | 158 (96.3%) | 6 (3.7%) |
| 45 to 54 Years | 226 (100.0%) | 0 (0.0%) |
| 55 to 64 Years | 277 (97.2%) | 8 (2.8%) |
| 65 to 74 Years | 223 (100.0%) | 0 (0.0%) |
| 75 Years and older | 288 (100.0%) | 0 (0.0%) |
| Total | 1,985 (95.8%) | 88 (4.3%) |
Health Insurance Coverage by Citizenship Status in Faulk County

| Citizenship Status | With Coverage | Without Coverage |
| Native Born | 150 (100.0%) | 0 (0.0%) |
| Foreign Born, Citizen | 402 (94.4%) | 24 (5.6%) |
| Foreign Born, not a Citizen | 121 (96.0%) | 5 (4.0%) |
Health Insurance Coverage by Household Income in Faulk County
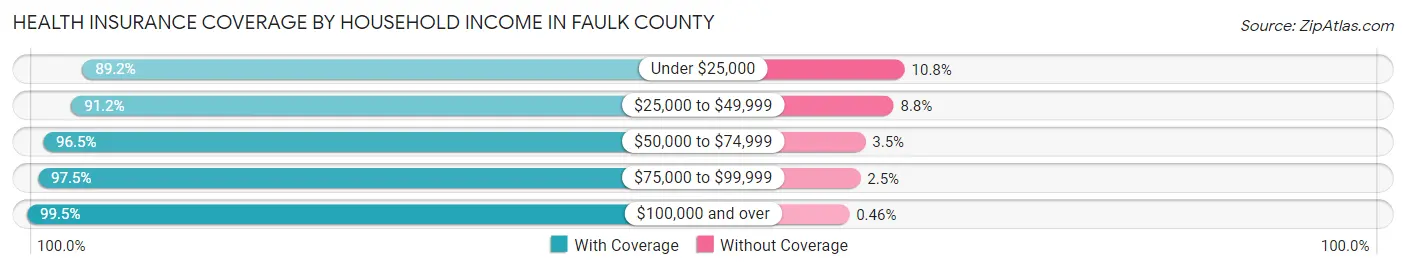
| Household Income | With Coverage | Without Coverage |
| Under $25,000 | 280 (89.2%) | 34 (10.8%) |
| $25,000 to $49,999 | 354 (91.2%) | 34 (8.8%) |
| $50,000 to $74,999 | 222 (96.5%) | 8 (3.5%) |
| $75,000 to $99,999 | 345 (97.5%) | 9 (2.5%) |
| $100,000 and over | 644 (99.5%) | 3 (0.5%) |
Public vs Private Health Insurance Coverage by Age in Faulk County

| Age Bracket | Public Insurance | Private Insurance |
| Under 6 | 25 (16.7%) | 138 (92.0%) |
| 6 to 18 Years | 49 (11.5%) | 400 (93.9%) |
| 19 to 25 Years | 2 (1.6%) | 121 (96.0%) |
| 25 to 34 Years | 0 (0.0%) | 140 (75.7%) |
| 35 to 44 Years | 15 (9.1%) | 145 (88.4%) |
| 45 to 54 Years | 9 (4.0%) | 223 (98.7%) |
| 55 to 64 Years | 39 (13.7%) | 250 (87.7%) |
| 65 to 74 Years | 223 (100.0%) | 136 (61.0%) |
| 75 Years and over | 288 (100.0%) | 105 (36.5%) |
| Total | 650 (31.4%) | 1,658 (80.0%) |
Disability Status by Sex by Age in Faulk County

| Age Bracket | Male | Female |
| Under 5 Years | 0 (0.0%) | 0 (0.0%) |
| 5 to 17 Years | 2 (1.1%) | 2 (0.8%) |
| 18 to 34 Years | 8 (4.0%) | 2 (1.4%) |
| 35 to 64 Years | 51 (14.1%) | 30 (9.6%) |
| 65 to 74 Years | 15 (12.2%) | 10 (10.0%) |
| 75 Years and over | 50 (45.1%) | 115 (65.0%) |
Disability Class by Sex by Age in Faulk County
Disability Class: Hearing Difficulty

| Age Bracket | Male | Female |
| Under 5 Years | 0 (0.0%) | 0 (0.0%) |
| 5 to 17 Years | 0 (0.0%) | 0 (0.0%) |
| 18 to 34 Years | 0 (0.0%) | 0 (0.0%) |
| 35 to 64 Years | 38 (10.5%) | 7 (2.2%) |
| 65 to 74 Years | 4 (3.3%) | 6 (6.0%) |
| 75 Years and over | 25 (22.5%) | 35 (19.8%) |
Disability Class: Vision Difficulty
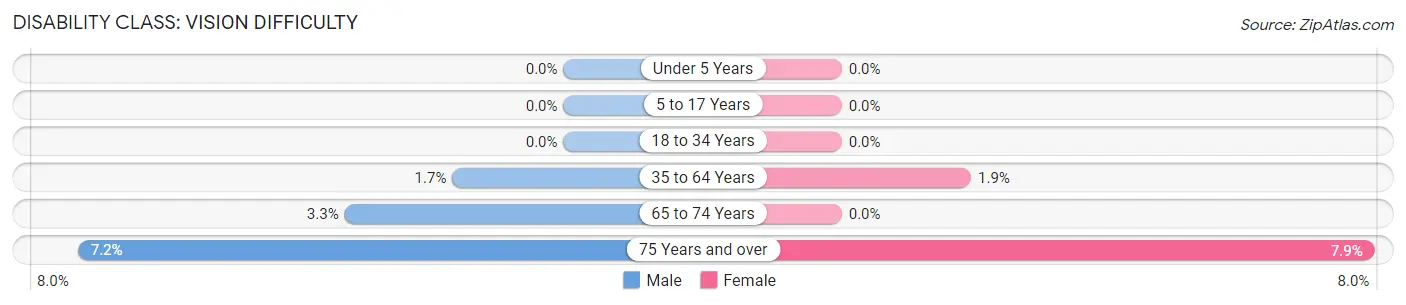
| Age Bracket | Male | Female |
| Under 5 Years | 0 (0.0%) | 0 (0.0%) |
| 5 to 17 Years | 0 (0.0%) | 0 (0.0%) |
| 18 to 34 Years | 0 (0.0%) | 0 (0.0%) |
| 35 to 64 Years | 6 (1.7%) | 6 (1.9%) |
| 65 to 74 Years | 4 (3.3%) | 0 (0.0%) |
| 75 Years and over | 8 (7.2%) | 14 (7.9%) |
Disability Class: Cognitive Difficulty
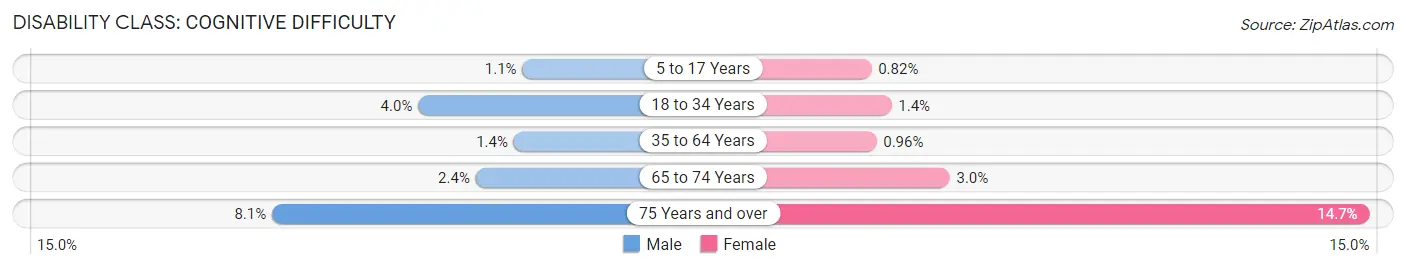
| Age Bracket | Male | Female |
| 5 to 17 Years | 2 (1.1%) | 2 (0.8%) |
| 18 to 34 Years | 8 (4.0%) | 2 (1.4%) |
| 35 to 64 Years | 5 (1.4%) | 3 (1.0%) |
| 65 to 74 Years | 3 (2.4%) | 3 (3.0%) |
| 75 Years and over | 9 (8.1%) | 26 (14.7%) |
Disability Class: Ambulatory Difficulty

| Age Bracket | Male | Female |
| 5 to 17 Years | 0 (0.0%) | 0 (0.0%) |
| 18 to 34 Years | 0 (0.0%) | 2 (1.4%) |
| 35 to 64 Years | 10 (2.8%) | 23 (7.4%) |
| 65 to 74 Years | 11 (8.9%) | 3 (3.0%) |
| 75 Years and over | 11 (9.9%) | 82 (46.3%) |
Disability Class: Self-Care Difficulty
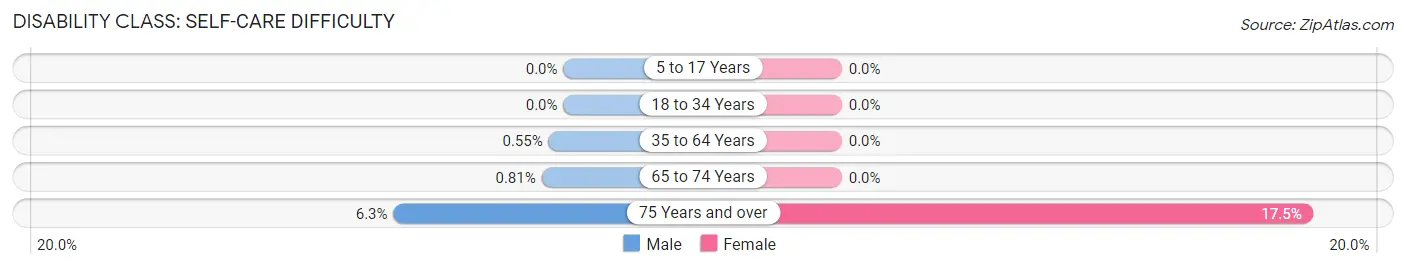
| Age Bracket | Male | Female |
| 5 to 17 Years | 0 (0.0%) | 0 (0.0%) |
| 18 to 34 Years | 0 (0.0%) | 0 (0.0%) |
| 35 to 64 Years | 2 (0.5%) | 0 (0.0%) |
| 65 to 74 Years | 1 (0.8%) | 0 (0.0%) |
| 75 Years and over | 7 (6.3%) | 31 (17.5%) |
Technology Access in Faulk County
Computing Device Access in Faulk County
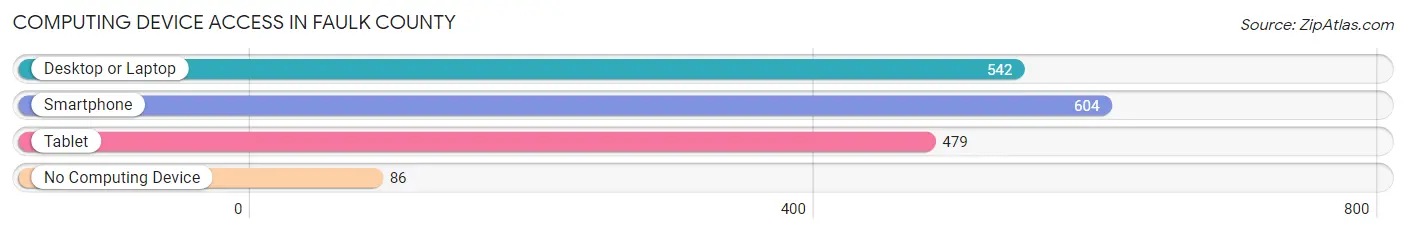
| Device Type | # Households | % Households |
| Desktop or Laptop | 542 | 70.9% |
| Smartphone | 604 | 78.9% |
| Tablet | 479 | 62.6% |
| No Computing Device | 86 | 11.2% |
| Total | 765 | 100.0% |
Internet Access in Faulk County
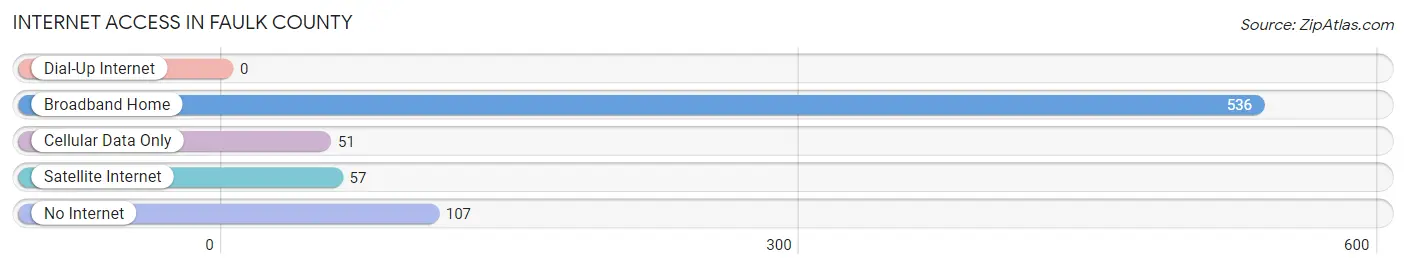
| Internet Type | # Households | % Households |
| Dial-Up Internet | 0 | 0.0% |
| Broadband Home | 536 | 70.1% |
| Cellular Data Only | 51 | 6.7% |
| Satellite Internet | 57 | 7.4% |
| No Internet | 107 | 14.0% |
| Total | 765 | 100.0% |
Faulk County Summary
Faulk County, South Dakota is located in the north-central part of the state and is bordered by Edmunds County to the north, Spink County to the east, Hand County to the south, and Potter County to the west. The county seat is Faulkton, and the county has a total area of 845 square miles. As of the 2010 census, the population was 2,541, making it the second least populous county in South Dakota.
Geography
Faulk County is located in the northern part of the state, and is mostly rural. The terrain is mostly flat, with rolling hills in the east and south. The county is drained by the Redwater River, which flows through the county from east to west. The county is also home to several small lakes, including Lake Faulkton, Lake Traverse, and Lake Oahe.
Climate
Faulk County has a semi-arid climate, with hot summers and cold winters. The average annual temperature is 48°F, and the average annual precipitation is 17.5 inches.
History
Faulk County was established in 1873, and was named after William Faulk, a prominent early settler. The county seat, Faulkton, was established in 1881. The county was largely agricultural, and the main crops were wheat, corn, and oats.
In the early 20th century, the county experienced a population boom, as many people moved to the area to take advantage of the fertile soil and abundant natural resources. The county also experienced a boom in oil and gas production, and the county seat became a major center for oil and gas exploration.
Economy
Faulk County is largely agricultural, and the main crops are wheat, corn, and oats. The county is also home to several large cattle ranches, and the county is a major producer of beef and dairy products.
The county is also home to several oil and gas fields, and the county seat is a major center for oil and gas exploration. The county is also home to several manufacturing companies, including a furniture factory and a plastics factory.
Demographics
As of the 2010 census, the population of Faulk County was 2,541, with a population density of 3 people per square mile. The racial makeup of the county was 97.3% White, 0.2% African American, 0.3% Native American, 0.2% Asian, 0.1% Pacific Islander, 0.7% from other races, and 1.3% from two or more races. Hispanic or Latino of any race were 1.7% of the population.
The median income for a household in the county was $41,944, and the median income for a family was $50,000. The per capita income for the county was $20,845. About 11.2% of families and 14.2% of the population were below the poverty line, including 17.2% of those under age 18 and 11.2% of those age 65 or over.
Common Questions
What is the Total Population of Faulk County?
Total Population of Faulk County is 2,140.
What is the Total Male Population of Faulk County?
Total Male Population of Faulk County is 1,034.
What is the Total Female Population of Faulk County?
Total Female Population of Faulk County is 1,106.
What is the Ratio of Males per 100 Females in Faulk County?
There are 93.49 Males per 100 Females in Faulk County.
What is the Ratio of Females per 100 Males in Faulk County?
There are 106.96 Females per 100 Males in Faulk County.
What is the Median Population Age in Faulk County?
Median Population Age in Faulk County is 45.8 Years.
What is the Average Family Size in Faulk County
Average Family Size in Faulk County is 3.5 People.
What is the Average Household Size in Faulk County
Average Household Size in Faulk County is 2.5 People.
What is Per Capita Income in Faulk County?
Per Capita income in Faulk County is $31,533.
What is the Median Family Income in Faulk County?
Median Family Income in Faulk County is $90,288.
What is the Median Household income in Faulk County?
Median Household Income in Faulk County is $56,734.
What is Income or Wage Gap in Faulk County?
Income or Wage Gap in Faulk County is 19.9%.
Women in Faulk County earn 80.1 cents for every dollar earned by a man.
What is Family Income Deficit in Faulk County?
Family Income Deficit in Faulk County is $13,954.
Families that are below poverty line in Faulk County earn $13,954 less on average than the poverty threshold level.
What is Inequality or Gini Index in Faulk County?
Inequality or Gini Index in Faulk County is 0.45.
How Large is the Labor Force in Faulk County?
There are 984 People in the Labor Forcein in Faulk County.
What is the Percentage of People in the Labor Force in Faulk County?
59.0% of People are in the Labor Force in Faulk County.
What is the Unemployment Rate in Faulk County?
Unemployment Rate in Faulk County is 3.7%.