Fall River County, SD
Fall River County Map
Fall River County Overview
7,079
TOTAL POPULATION
3,599
MALE POPULATION
3,480
FEMALE POPULATION
103.42
MALES / 100 FEMALES
96.69
FEMALES / 100 MALES
54.7
MEDIAN AGE
2.8
AVG FAMILY SIZE
2.1
AVG HOUSEHOLD SIZE
$33,745
PER CAPITA INCOME
$70,156
AVG FAMILY INCOME
$54,886
AVG HOUSEHOLD INCOME
33.7%
WAGE / INCOME GAP [ % ]
66.3¢/ $1
WAGE / INCOME GAP [ $ ]
$7,865
FAMILY INCOME DEFICIT
0.44
INEQUALITY / GINI INDEX
3,055
LABOR FORCE [ PEOPLE ]
50.3%
PERCENT IN LABOR FORCE
2.7%
UNEMPLOYMENT RATE
Fall River County Area Codes
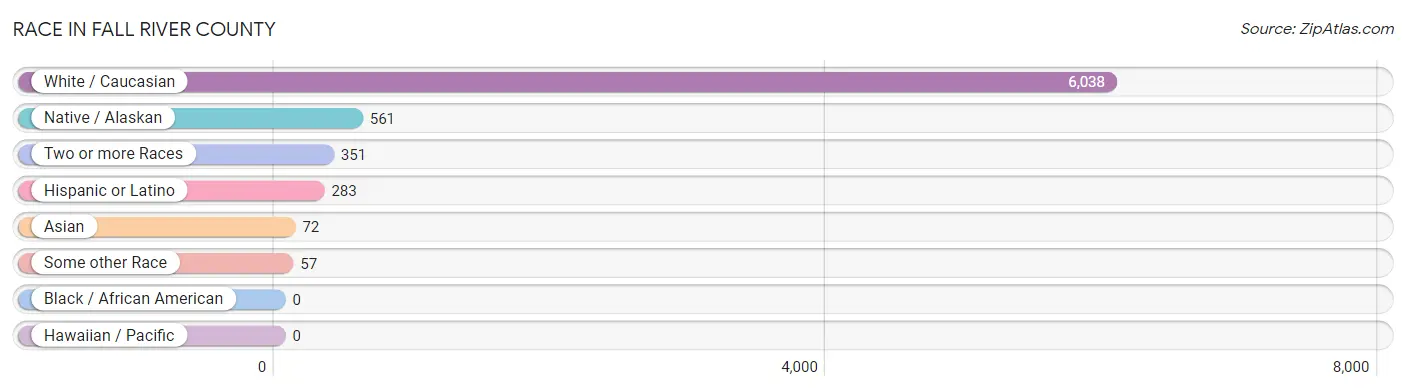
Race in Fall River County
The most populous races in Fall River County are White / Caucasian (6,038 | 85.3%), Native / Alaskan (561 | 7.9%), and Two or more Races (351 | 5.0%).
| Race | # Population | % Population |
| Asian | 72 | 1.0% |
| Black / African American | 0 | 0.0% |
| Hawaiian / Pacific | 0 | 0.0% |
| Hispanic or Latino | 283 | 4.0% |
| Native / Alaskan | 561 | 7.9% |
| White / Caucasian | 6,038 | 85.3% |
| Two or more Races | 351 | 5.0% |
| Some other Race | 57 | 0.8% |
| Total | 7,079 | 100.0% |
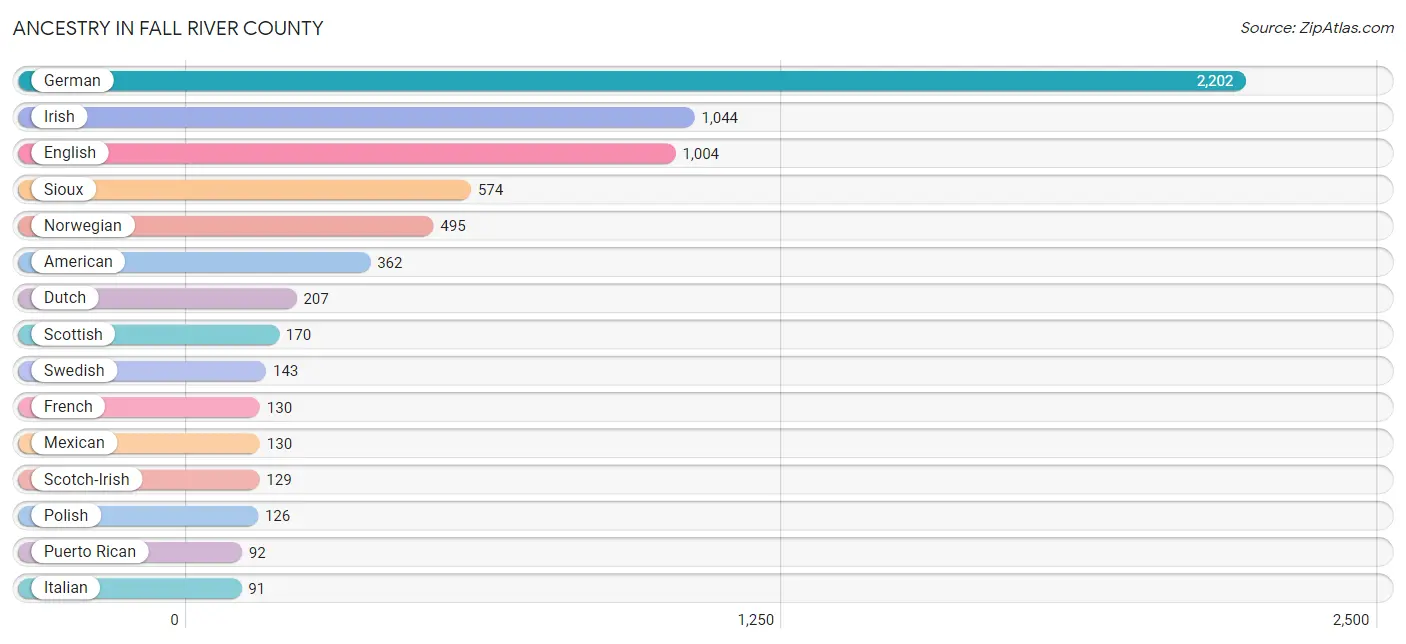
Ancestry in Fall River County
The most populous ancestries reported in Fall River County are German (2,202 | 31.1%), Irish (1,044 | 14.7%), English (1,004 | 14.2%), Sioux (574 | 8.1%), and Norwegian (495 | 7.0%), together accounting for 75.1% of all Fall River County residents.
| Ancestry | # Population | % Population |
| American | 362 | 5.1% |
| Austrian | 34 | 0.5% |
| Belgian | 11 | 0.2% |
| Bhutanese | 46 | 0.6% |
| British | 19 | 0.3% |
| Cherokee | 4 | 0.1% |
| Chippewa | 4 | 0.1% |
| Czech | 63 | 0.9% |
| Czechoslovakian | 19 | 0.3% |
| Danish | 62 | 0.9% |
| Dutch | 207 | 2.9% |
| English | 1,004 | 14.2% |
| European | 30 | 0.4% |
| French | 130 | 1.8% |
| French Canadian | 21 | 0.3% |
| German | 2,202 | 31.1% |
| Greek | 6 | 0.1% |
| Indian (Asian) | 46 | 0.6% |
| Irish | 1,044 | 14.7% |
| Italian | 91 | 1.3% |
| Kiowa | 4 | 0.1% |
| Mexican | 130 | 1.8% |
| Mexican American Indian | 30 | 0.4% |
| Navajo | 1 | 0.0% |
| Northern European | 14 | 0.2% |
| Norwegian | 495 | 7.0% |
| Pennsylvania German | 34 | 0.5% |
| Polish | 126 | 1.8% |
| Portuguese | 19 | 0.3% |
| Puerto Rican | 92 | 1.3% |
| Russian | 84 | 1.2% |
| Scandinavian | 30 | 0.4% |
| Scotch-Irish | 129 | 1.8% |
| Scottish | 170 | 2.4% |
| Sioux | 574 | 8.1% |
| Spanish | 61 | 0.9% |
| Sri Lankan | 1 | 0.0% |
| Swedish | 143 | 2.0% |
| Swiss | 29 | 0.4% |
| Thai | 8 | 0.1% |
| Welsh | 65 | 0.9% | View All 41 Rows |
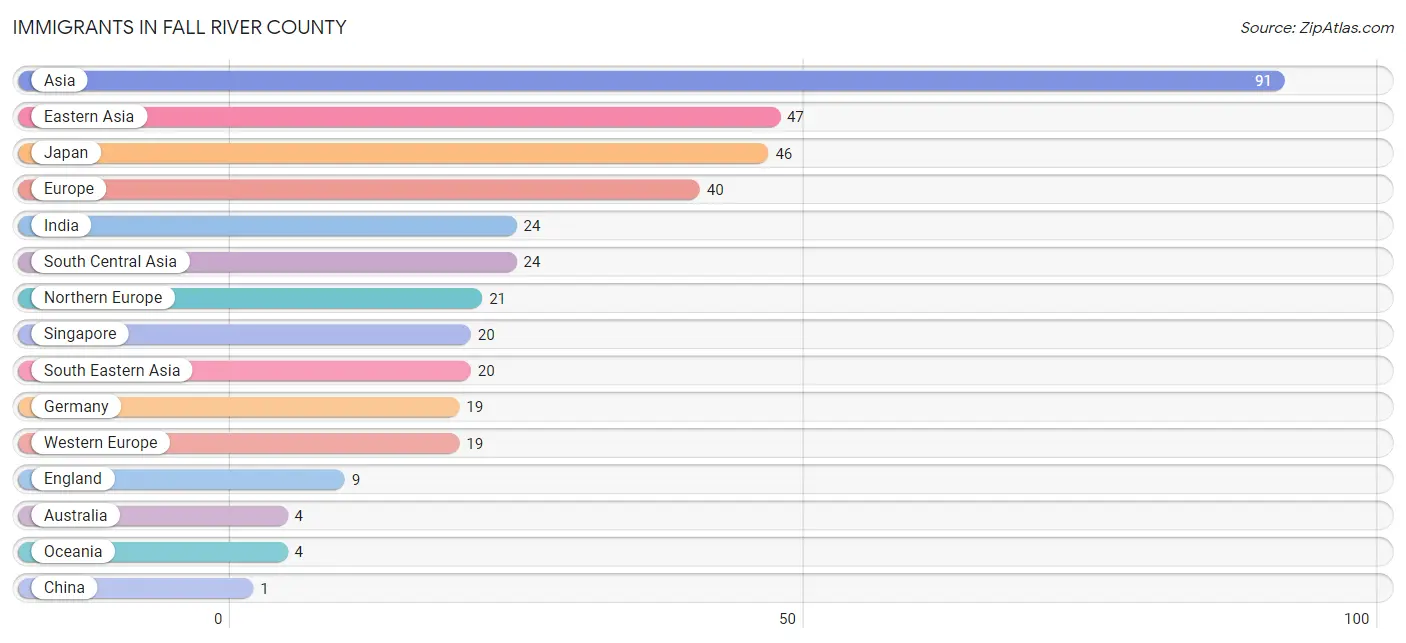
Immigrants in Fall River County
The most numerous immigrant groups reported in Fall River County came from Asia (91 | 1.3%), Eastern Asia (47 | 0.7%), Japan (46 | 0.6%), Europe (40 | 0.6%), and India (24 | 0.3%), together accounting for 3.5% of all Fall River County residents.
| Immigration Origin | # Population | % Population |
| Asia | 91 | 1.3% |
| Australia | 4 | 0.1% |
| China | 1 | 0.0% |
| Eastern Asia | 47 | 0.7% |
| England | 9 | 0.1% |
| Europe | 40 | 0.6% |
| Germany | 19 | 0.3% |
| India | 24 | 0.3% |
| Japan | 46 | 0.6% |
| Northern Europe | 21 | 0.3% |
| Oceania | 4 | 0.1% |
| Singapore | 20 | 0.3% |
| South Central Asia | 24 | 0.3% |
| South Eastern Asia | 20 | 0.3% |
| Western Europe | 19 | 0.3% | View All 15 Rows |
Sex and Age in Fall River County
Sex and Age in Fall River County
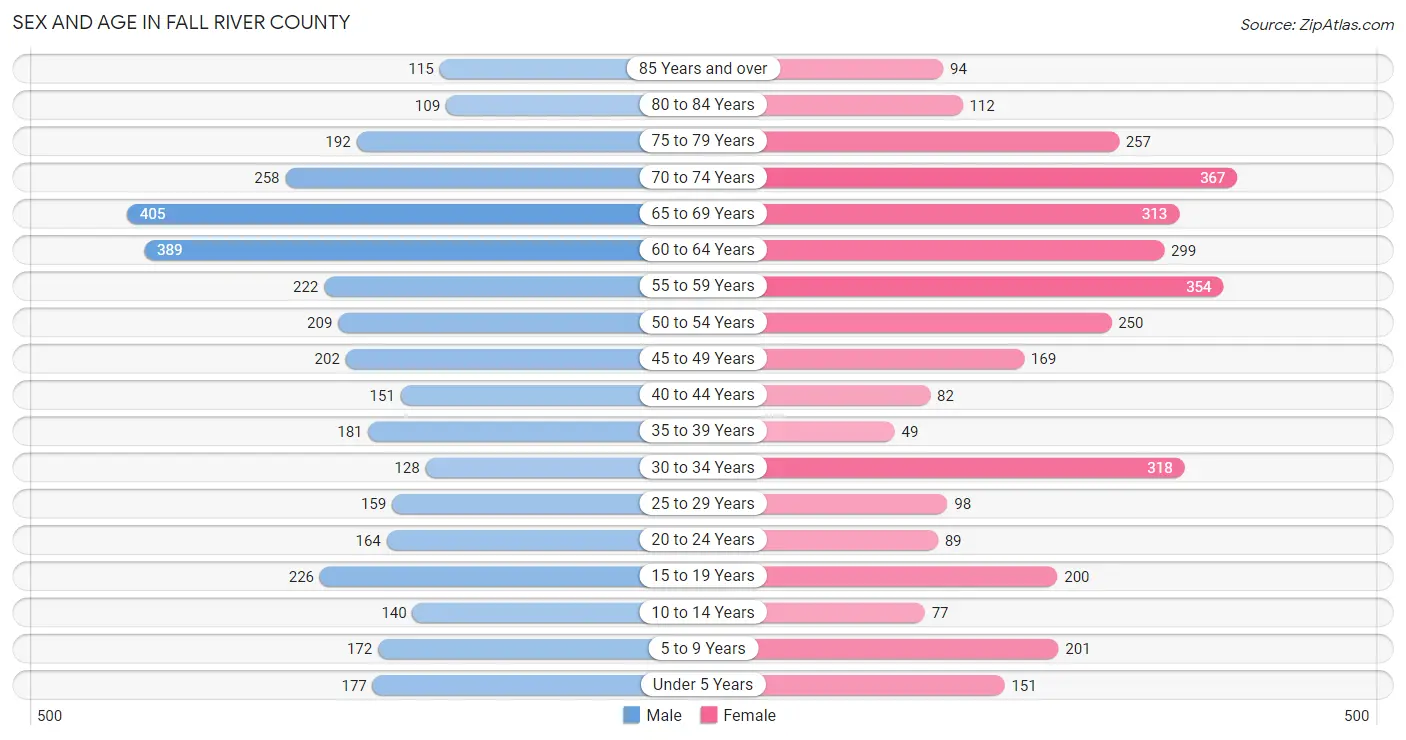
The most populous age groups in Fall River County are 65 to 69 Years (405 | 11.3%) for men and 70 to 74 Years (367 | 10.5%) for women.
| Age Bracket | Male | Female |
| Under 5 Years | 177 (4.9%) | 151 (4.3%) |
| 5 to 9 Years | 172 (4.8%) | 201 (5.8%) |
| 10 to 14 Years | 140 (3.9%) | 77 (2.2%) |
| 15 to 19 Years | 226 (6.3%) | 200 (5.8%) |
| 20 to 24 Years | 164 (4.6%) | 89 (2.6%) |
| 25 to 29 Years | 159 (4.4%) | 98 (2.8%) |
| 30 to 34 Years | 128 (3.6%) | 318 (9.1%) |
| 35 to 39 Years | 181 (5.0%) | 49 (1.4%) |
| 40 to 44 Years | 151 (4.2%) | 82 (2.4%) |
| 45 to 49 Years | 202 (5.6%) | 169 (4.9%) |
| 50 to 54 Years | 209 (5.8%) | 250 (7.2%) |
| 55 to 59 Years | 222 (6.2%) | 354 (10.2%) |
| 60 to 64 Years | 389 (10.8%) | 299 (8.6%) |
| 65 to 69 Years | 405 (11.3%) | 313 (9.0%) |
| 70 to 74 Years | 258 (7.2%) | 367 (10.5%) |
| 75 to 79 Years | 192 (5.3%) | 257 (7.4%) |
| 80 to 84 Years | 109 (3.0%) | 112 (3.2%) |
| 85 Years and over | 115 (3.2%) | 94 (2.7%) |
| Total | 3,599 (100.0%) | 3,480 (100.0%) |
Families and Households in Fall River County
Median Family Size in Fall River County
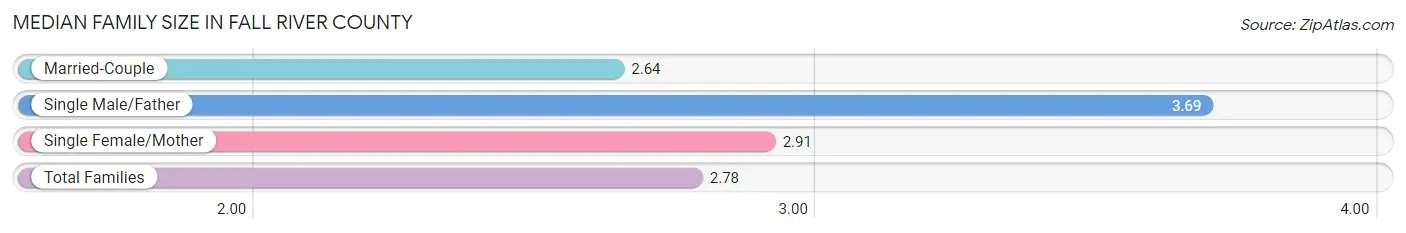
The median family size in Fall River County is 2.78 persons per family, with single male/father families (154 | 8.5%) accounting for the largest median family size of 3.69 persons per family. On the other hand, married-couple families (1,307 | 71.7%) represent the smallest median family size with 2.64 persons per family.
| Family Type | # Families | Family Size |
| Married-Couple | 1,307 (71.7%) | 2.64 |
| Single Male/Father | 154 (8.5%) | 3.69 |
| Single Female/Mother | 361 (19.8%) | 2.91 |
| Total Families | 1,822 (100.0%) | 2.78 |
Median Household Size in Fall River County
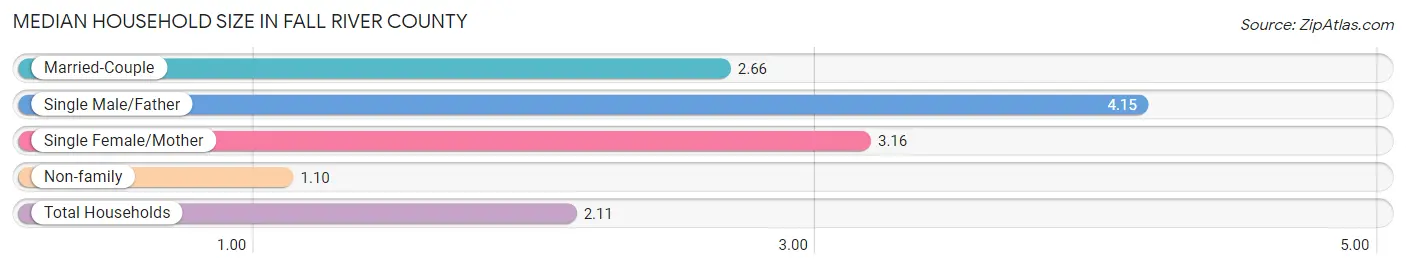
The median household size in Fall River County is 2.11 persons per household, with single male/father households (154 | 4.8%) accounting for the largest median household size of 4.15 persons per household. non-family households (1,399 | 43.4%) represent the smallest median household size with 1.10 persons per household.
| Household Type | # Households | Household Size |
| Married-Couple | 1,307 (40.6%) | 2.66 |
| Single Male/Father | 154 (4.8%) | 4.15 |
| Single Female/Mother | 361 (11.2%) | 3.16 |
| Non-family | 1,399 (43.4%) | 1.10 |
| Total Households | 3,221 (100.0%) | 2.11 |
Household Size by Marriage Status in Fall River County
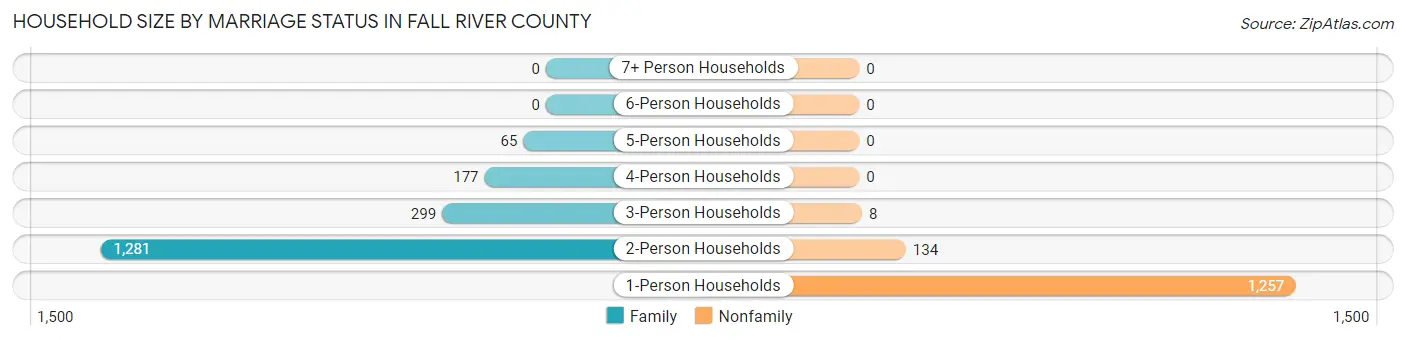
Out of a total of 3,221 households in Fall River County, 1,822 (56.6%) are family households, while 1,399 (43.4%) are nonfamily households. The most numerous type of family households are 2-person households, comprising 1,281, and the most common type of nonfamily households are 1-person households, comprising 1,257.
| Household Size | Family Households | Nonfamily Households |
| 1-Person Households | - | 1,257 (39.0%) |
| 2-Person Households | 1,281 (39.8%) | 134 (4.2%) |
| 3-Person Households | 299 (9.3%) | 8 (0.3%) |
| 4-Person Households | 177 (5.5%) | 0 (0.0%) |
| 5-Person Households | 65 (2.0%) | 0 (0.0%) |
| 6-Person Households | 0 (0.0%) | 0 (0.0%) |
| 7+ Person Households | 0 (0.0%) | 0 (0.0%) |
| Total | 1,822 (56.6%) | 1,399 (43.4%) |
Female Fertility in Fall River County
Fertility by Age in Fall River County
Average fertility rate in Fall River County is 38.0 births per 1,000 women. Women in the age bracket of 20 to 34 years have the highest fertility rate with 77.0 births per 1,000 women. Women in the age bracket of 20 to 34 years acount for 100.0% of all women with births.
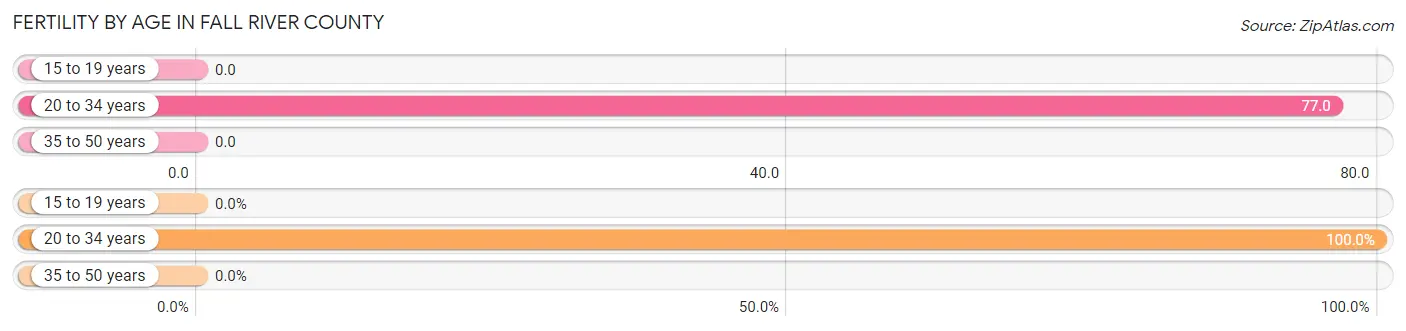
| Age Bracket | Women with Births | Births / 1,000 Women |
| 15 to 19 years | 0 (0.0%) | 0.0 |
| 20 to 34 years | 39 (100.0%) | 77.0 |
| 35 to 50 years | 0 (0.0%) | 0.0 |
| Total | 39 (100.0%) | 38.0 |
Fertility by Age by Marriage Status in Fall River County
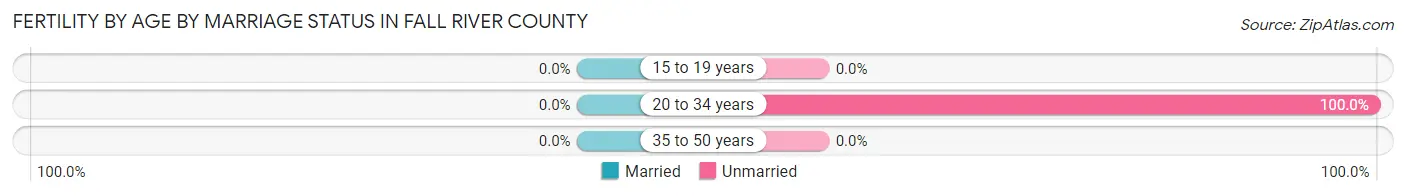
| Age Bracket | Married | Unmarried |
| 15 to 19 years | 0 (0.0%) | 0 (0.0%) |
| 20 to 34 years | 0 (0.0%) | 39 (100.0%) |
| 35 to 50 years | 0 (0.0%) | 0 (0.0%) |
| Total | 0 (0.0%) | 39 (100.0%) |
Fertility by Education in Fall River County
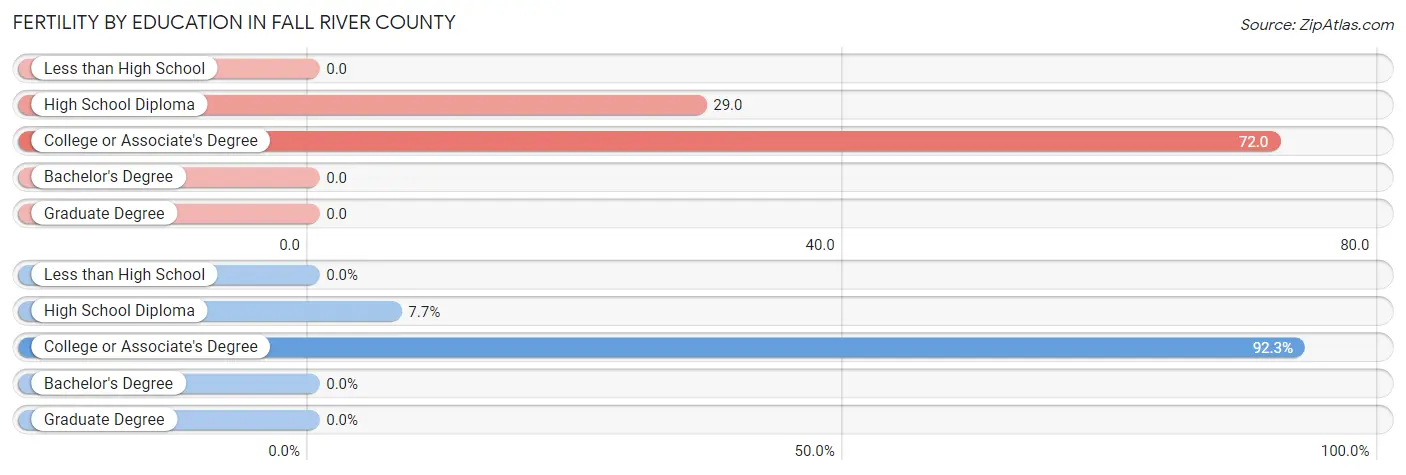
| Educational Attainment | Women with Births | Births / 1,000 Women |
| Less than High School | 0 (0.0%) | 0.0 |
| High School Diploma | 3 (7.7%) | 29.0 |
| College or Associate's Degree | 36 (92.3%) | 72.0 |
| Bachelor's Degree | 0 (0.0%) | 0.0 |
| Graduate Degree | 0 (0.0%) | 0.0 |
| Total | 39 (100.0%) | 38.0 |
Fertility by Education by Marriage Status in Fall River County
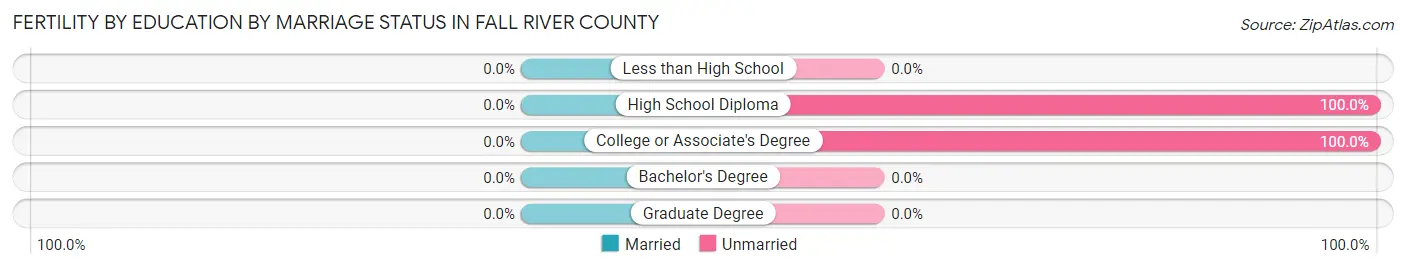
| Educational Attainment | Married | Unmarried |
| Less than High School | 0 (0.0%) | 0 (0.0%) |
| High School Diploma | 0 (0.0%) | 3 (100.0%) |
| College or Associate's Degree | 0 (0.0%) | 36 (100.0%) |
| Bachelor's Degree | 0 (0.0%) | 0 (0.0%) |
| Graduate Degree | 0 (0.0%) | 0 (0.0%) |
| Total | 0 (0.0%) | 39 (100.0%) |
Income in Fall River County
Income Overview in Fall River County
Per Capita Income in Fall River County is $33,745, while median incomes of families and households are $70,156 and $54,886 respectively.
| Characteristic | Number | Measure |
| Per Capita Income | 7,079 | $33,745 |
| Median Family Income | 1,822 | $70,156 |
| Mean Family Income | 1,822 | $78,170 |
| Median Household Income | 3,221 | $54,886 |
| Mean Household Income | 3,221 | $69,946 |
| Income Deficit | 1,822 | $7,865 |
| Wage / Income Gap (%) | 7,079 | 33.69% |
| Wage / Income Gap ($) | 7,079 | 66.31¢ per $1 |
| Gini / Inequality Index | 7,079 | 0.44 |
Earnings by Sex in Fall River County
Average Earnings in Fall River County are $30,347, $36,583 for men and $24,259 for women, a difference of 33.7%.
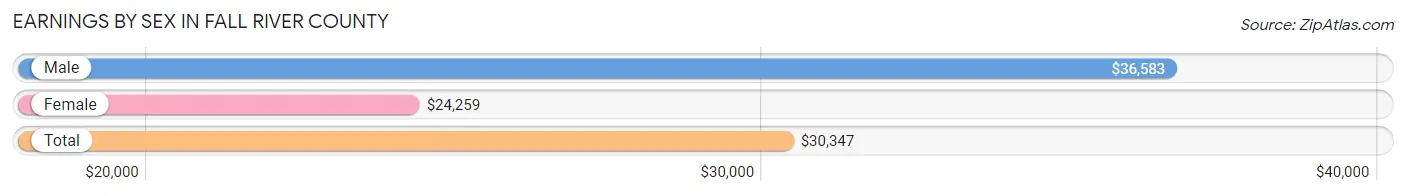
| Sex | Number | Average Earnings |
| Male | 1,669 (48.8%) | $36,583 |
| Female | 1,748 (51.2%) | $24,259 |
| Total | 3,417 (100.0%) | $30,347 |
Earnings by Sex by Income Bracket in Fall River County
The most common earnings brackets in Fall River County are $55,000 to $64,999 for men (193 | 11.6%) and $75,000 to $99,999 for women (233 | 13.3%).
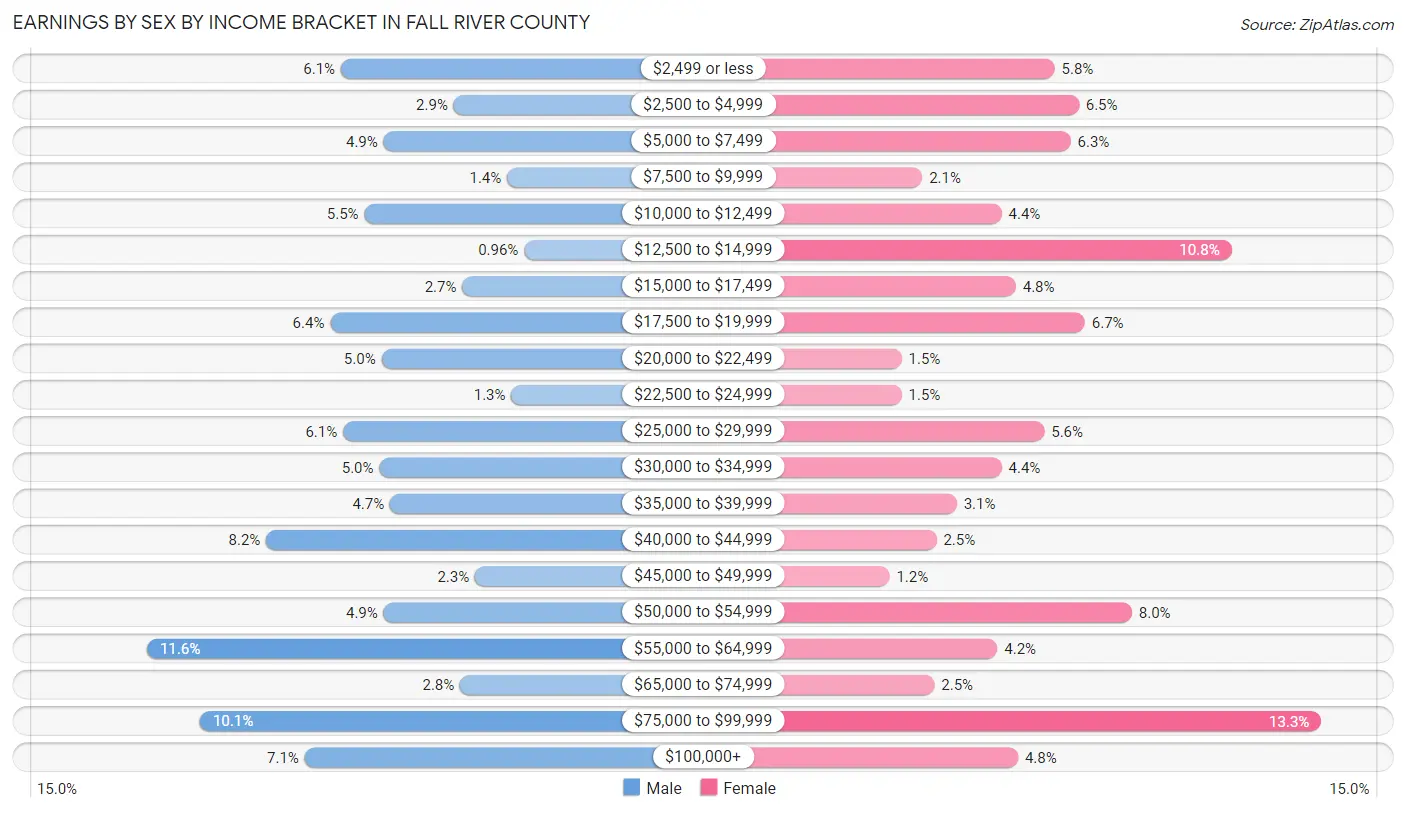
| Income | Male | Female |
| $2,499 or less | 102 (6.1%) | 102 (5.8%) |
| $2,500 to $4,999 | 49 (2.9%) | 114 (6.5%) |
| $5,000 to $7,499 | 82 (4.9%) | 110 (6.3%) |
| $7,500 to $9,999 | 24 (1.4%) | 37 (2.1%) |
| $10,000 to $12,499 | 91 (5.4%) | 76 (4.3%) |
| $12,500 to $14,999 | 16 (1.0%) | 189 (10.8%) |
| $15,000 to $17,499 | 45 (2.7%) | 83 (4.8%) |
| $17,500 to $19,999 | 107 (6.4%) | 117 (6.7%) |
| $20,000 to $22,499 | 83 (5.0%) | 27 (1.5%) |
| $22,500 to $24,999 | 22 (1.3%) | 27 (1.5%) |
| $25,000 to $29,999 | 101 (6.0%) | 97 (5.6%) |
| $30,000 to $34,999 | 84 (5.0%) | 76 (4.3%) |
| $35,000 to $39,999 | 79 (4.7%) | 54 (3.1%) |
| $40,000 to $44,999 | 137 (8.2%) | 44 (2.5%) |
| $45,000 to $49,999 | 39 (2.3%) | 21 (1.2%) |
| $50,000 to $54,999 | 82 (4.9%) | 140 (8.0%) |
| $55,000 to $64,999 | 193 (11.6%) | 74 (4.2%) |
| $65,000 to $74,999 | 46 (2.8%) | 43 (2.5%) |
| $75,000 to $99,999 | 168 (10.1%) | 233 (13.3%) |
| $100,000+ | 119 (7.1%) | 84 (4.8%) |
| Total | 1,669 (100.0%) | 1,748 (100.0%) |
Earnings by Sex by Educational Attainment in Fall River County
Average earnings in Fall River County are $42,141 for men and $29,072 for women, a difference of 31.0%. Men with an educational attainment of bachelor's degree enjoy the highest average annual earnings of $60,455, while those with less than high school education earn the least with $34,632. Women with an educational attainment of graduate degree earn the most with the average annual earnings of $83,571, while those with less than high school education have the smallest earnings of $13,355.
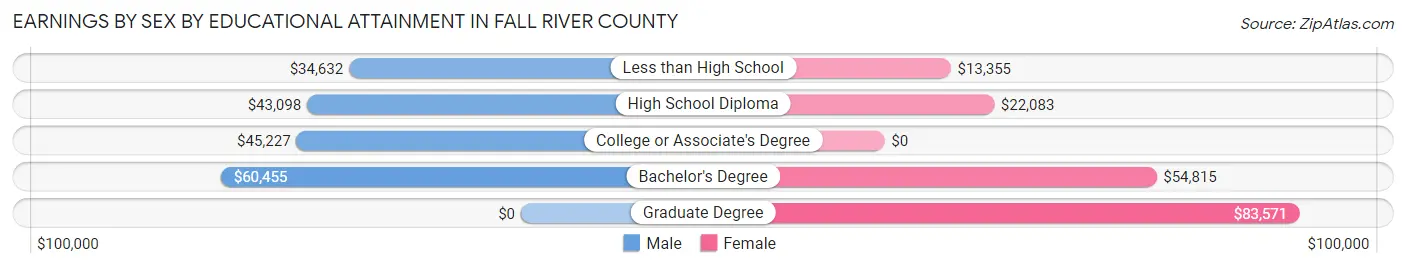
| Educational Attainment | Male Income | Female Income |
| Less than High School | $34,632 | $13,355 |
| High School Diploma | $43,098 | $22,083 |
| College or Associate's Degree | $45,227 | $0 |
| Bachelor's Degree | $60,455 | $54,815 |
| Graduate Degree | - | - |
| Total | $42,141 | $29,072 |
Family Income in Fall River County
Family Income Brackets in Fall River County
According to the Fall River County family income data, there are 363 families falling into the $100,000 to $149,999 income range, which is the most common income bracket and makes up 19.9% of all families. Conversely, the $200,000+ income bracket is the least frequent group with only 15 families (0.8%) belonging to this category.
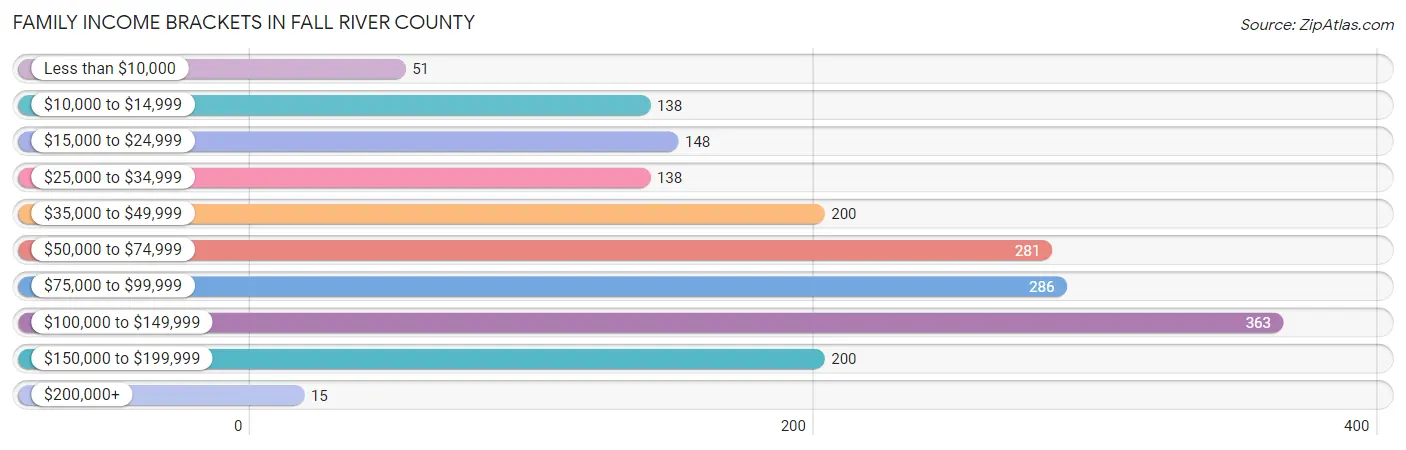
| Income Bracket | # Families | % Families |
| Less than $10,000 | 51 | 2.8% |
| $10,000 to $14,999 | 138 | 7.6% |
| $15,000 to $24,999 | 148 | 8.1% |
| $25,000 to $34,999 | 138 | 7.6% |
| $35,000 to $49,999 | 200 | 11.0% |
| $50,000 to $74,999 | 281 | 15.4% |
| $75,000 to $99,999 | 286 | 15.7% |
| $100,000 to $149,999 | 363 | 19.9% |
| $150,000 to $199,999 | 200 | 11.0% |
| $200,000+ | 15 | 0.8% |
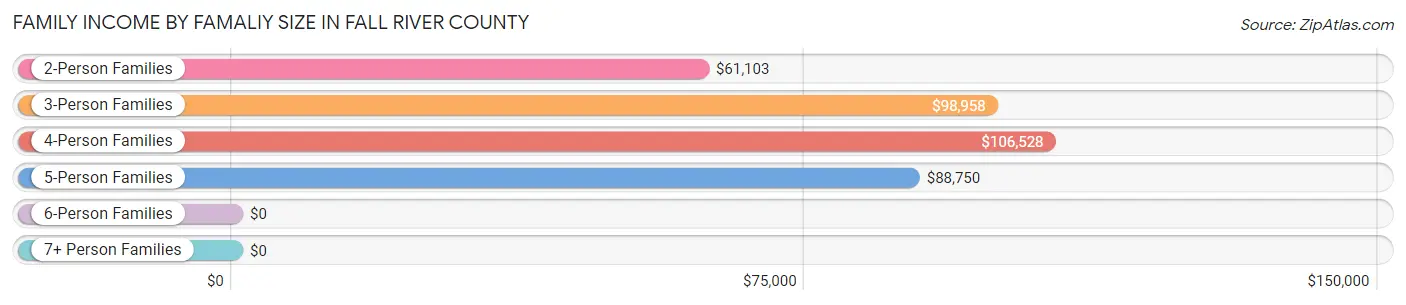
Family Income by Famaliy Size in Fall River County
4-person families (161 | 8.8%) account for the highest median family income in Fall River County with $106,528 per family, while 3-person families (239 | 13.1%) have the highest median income of $32,986 per family member.
| Income Bracket | # Families | Median Income |
| 2-Person Families | 1,364 (74.9%) | $61,103 |
| 3-Person Families | 239 (13.1%) | $98,958 |
| 4-Person Families | 161 (8.8%) | $106,528 |
| 5-Person Families | 58 (3.2%) | $88,750 |
| 6-Person Families | 0 (0.0%) | $0 |
| 7+ Person Families | 0 (0.0%) | $0 |
| Total | 1,822 (100.0%) | $70,156 |
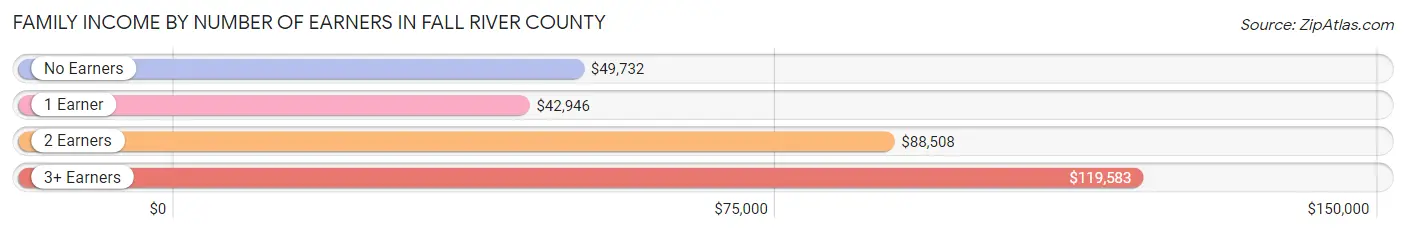
Family Income by Number of Earners in Fall River County
The median family income in Fall River County is $70,156, with families comprising 3+ earners (164) having the highest median family income of $119,583, while families with 1 earner (576) have the lowest median family income of $42,946, accounting for 9.0% and 31.6% of families, respectively.
| Number of Earners | # Families | Median Income |
| No Earners | 459 (25.2%) | $49,732 |
| 1 Earner | 576 (31.6%) | $42,946 |
| 2 Earners | 623 (34.2%) | $88,508 |
| 3+ Earners | 164 (9.0%) | $119,583 |
| Total | 1,822 (100.0%) | $70,156 |
Household Income in Fall River County
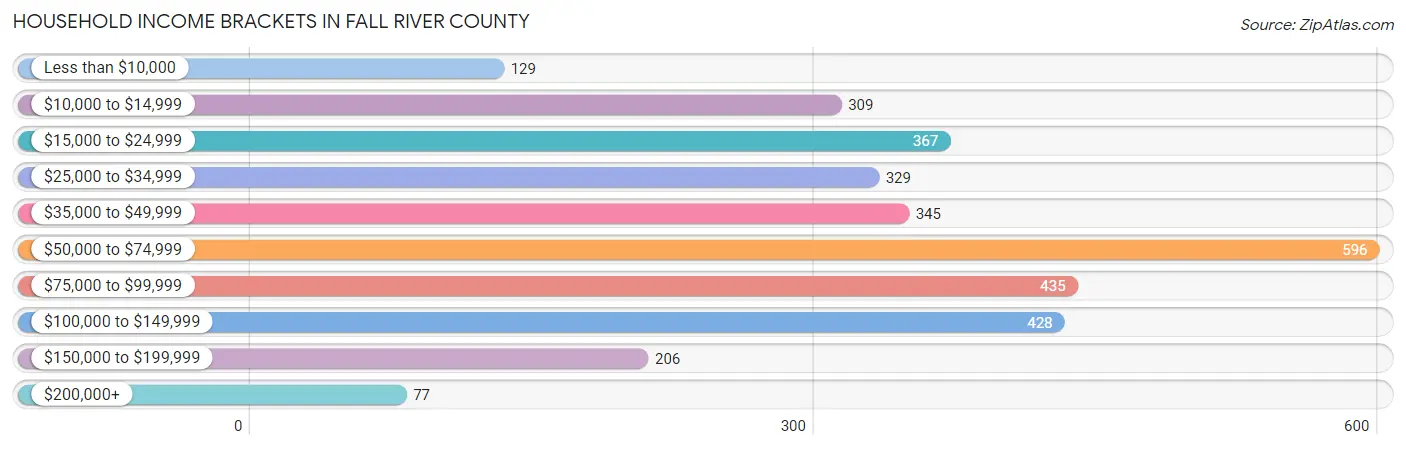
Household Income Brackets in Fall River County
With 596 households falling in the category, the $50,000 to $74,999 income range is the most frequent in Fall River County, accounting for 18.5% of all households. In contrast, only 77 households (2.4%) fall into the $200,000+ income bracket, making it the least populous group.
| Income Bracket | # Households | % Households |
| Less than $10,000 | 129 | 4.0% |
| $10,000 to $14,999 | 309 | 9.6% |
| $15,000 to $24,999 | 367 | 11.4% |
| $25,000 to $34,999 | 329 | 10.2% |
| $35,000 to $49,999 | 345 | 10.7% |
| $50,000 to $74,999 | 596 | 18.5% |
| $75,000 to $99,999 | 435 | 13.5% |
| $100,000 to $149,999 | 428 | 13.3% |
| $150,000 to $199,999 | 206 | 6.4% |
| $200,000+ | 77 | 2.4% |
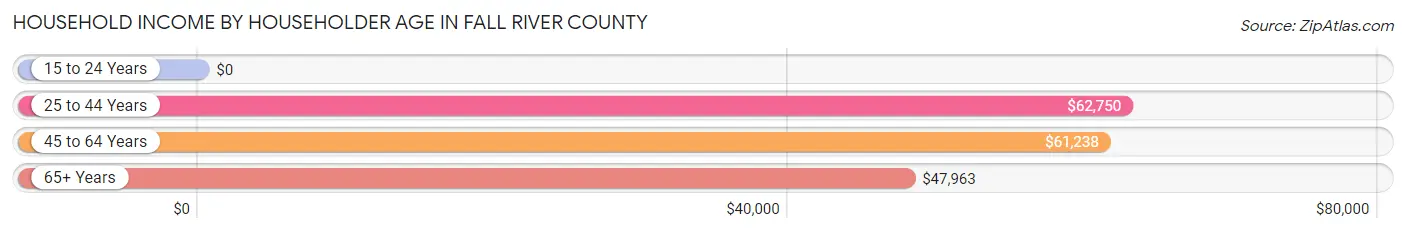
Household Income by Householder Age in Fall River County
The median household income in Fall River County is $54,886, with the highest median household income of $62,750 found in the 25 to 44 years age bracket for the primary householder. A total of 471 households (14.6%) fall into this category. Meanwhile, the 15 to 24 years age bracket for the primary householder has the lowest median household income of $0, with 82 households (2.5%) in this group.
| Income Bracket | # Households | Median Income |
| 15 to 24 Years | 82 (2.5%) | $0 |
| 25 to 44 Years | 471 (14.6%) | $62,750 |
| 45 to 64 Years | 1,400 (43.5%) | $61,238 |
| 65+ Years | 1,268 (39.4%) | $47,963 |
| Total | 3,221 (100.0%) | $54,886 |
Poverty in Fall River County
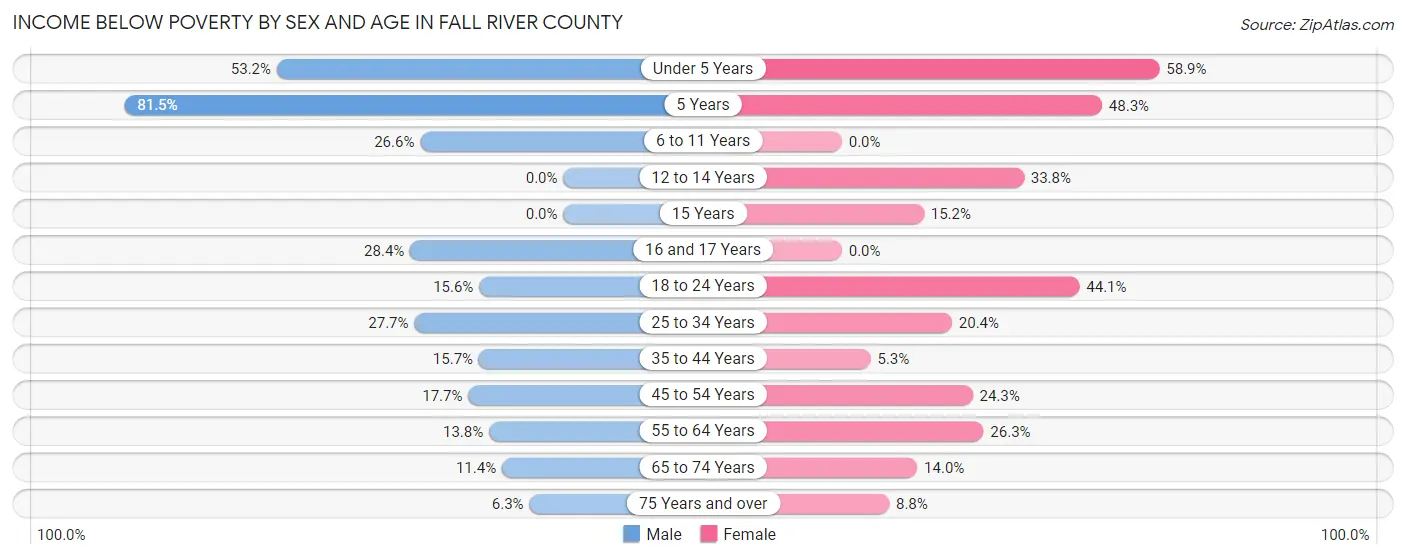
Income Below Poverty by Sex and Age in Fall River County
With 18.0% poverty level for males and 20.6% for females among the residents of Fall River County, 5 year old males and under 5 year old females are the most vulnerable to poverty, with 22 males (81.5%) and 89 females (58.9%) in their respective age groups living below the poverty level.
| Age Bracket | Male | Female |
| Under 5 Years | 92 (53.2%) | 89 (58.9%) |
| 5 Years | 22 (81.5%) | 14 (48.3%) |
| 6 to 11 Years | 64 (26.6%) | 0 (0.0%) |
| 12 to 14 Years | 0 (0.0%) | 25 (33.8%) |
| 15 Years | 0 (0.0%) | 7 (15.2%) |
| 16 and 17 Years | 31 (28.4%) | 0 (0.0%) |
| 18 to 24 Years | 35 (15.6%) | 71 (44.1%) |
| 25 to 34 Years | 78 (27.7%) | 85 (20.4%) |
| 35 to 44 Years | 50 (15.7%) | 7 (5.3%) |
| 45 to 54 Years | 72 (17.6%) | 101 (24.3%) |
| 55 to 64 Years | 84 (13.8%) | 170 (26.3%) |
| 65 to 74 Years | 72 (11.4%) | 87 (14.0%) |
| 75 Years and over | 22 (6.3%) | 37 (8.8%) |
| Total | 622 (18.0%) | 693 (20.6%) |
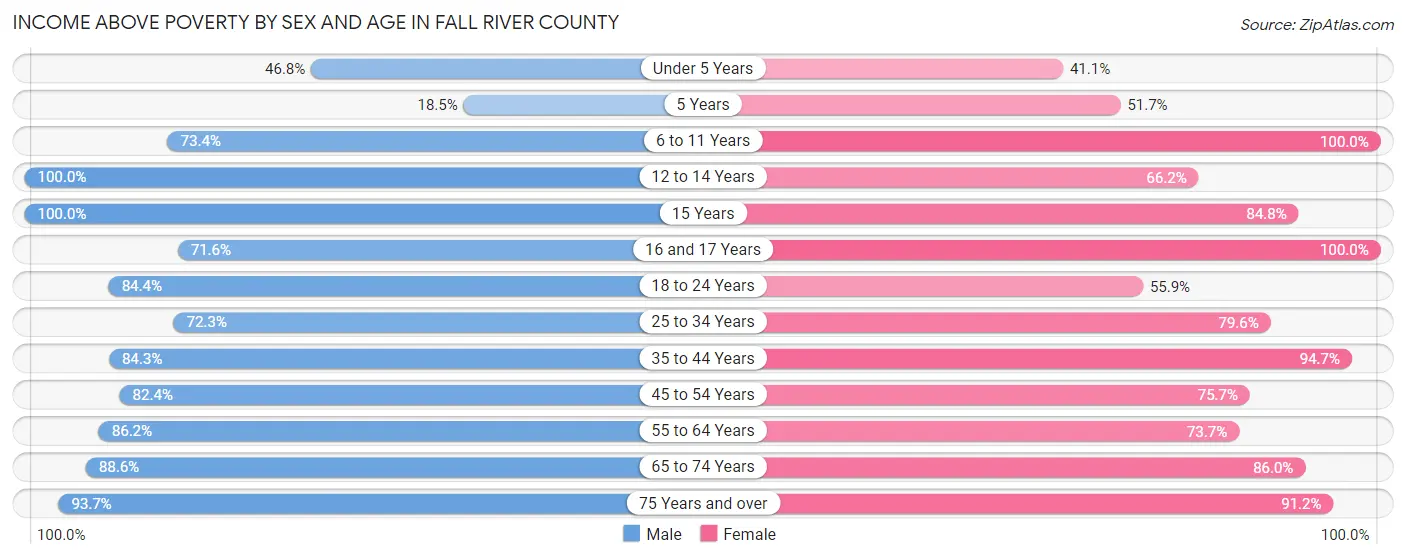
Income Above Poverty by Sex and Age in Fall River County
According to the poverty statistics in Fall River County, males aged 12 to 14 years and females aged 6 to 11 years are the age groups that are most secure financially, with 100.0% of males and 100.0% of females in these age groups living above the poverty line.
| Age Bracket | Male | Female |
| Under 5 Years | 81 (46.8%) | 62 (41.1%) |
| 5 Years | 5 (18.5%) | 15 (51.7%) |
| 6 to 11 Years | 177 (73.4%) | 175 (100.0%) |
| 12 to 14 Years | 44 (100.0%) | 49 (66.2%) |
| 15 Years | 42 (100.0%) | 39 (84.8%) |
| 16 and 17 Years | 78 (71.6%) | 67 (100.0%) |
| 18 to 24 Years | 189 (84.4%) | 90 (55.9%) |
| 25 to 34 Years | 204 (72.3%) | 331 (79.6%) |
| 35 to 44 Years | 269 (84.3%) | 124 (94.7%) |
| 45 to 54 Years | 336 (82.4%) | 315 (75.7%) |
| 55 to 64 Years | 525 (86.2%) | 477 (73.7%) |
| 65 to 74 Years | 560 (88.6%) | 535 (86.0%) |
| 75 Years and over | 328 (93.7%) | 385 (91.2%) |
| Total | 2,838 (82.0%) | 2,664 (79.4%) |
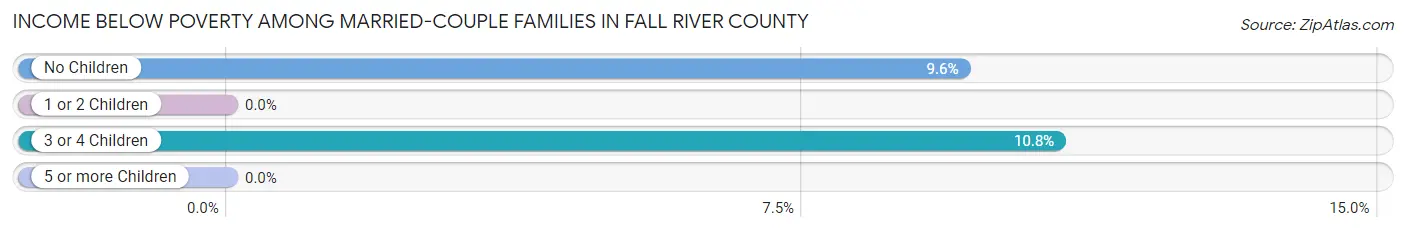
Income Below Poverty Among Married-Couple Families in Fall River County
The poverty statistics for married-couple families in Fall River County show that 8.3% or 109 of the total 1,307 families live below the poverty line. Families with 3 or 4 children have the highest poverty rate of 10.8%, comprising of 4 families. On the other hand, families with 1 or 2 children have the lowest poverty rate of 0.0%, which includes 0 families.
| Children | Above Poverty | Below Poverty |
| No Children | 993 (90.4%) | 105 (9.6%) |
| 1 or 2 Children | 172 (100.0%) | 0 (0.0%) |
| 3 or 4 Children | 33 (89.2%) | 4 (10.8%) |
| 5 or more Children | 0 (0.0%) | 0 (0.0%) |
| Total | 1,198 (91.7%) | 109 (8.3%) |
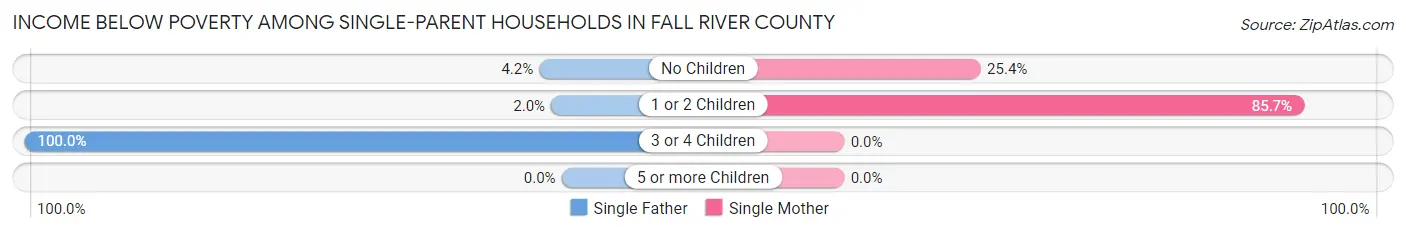
Income Below Poverty Among Single-Parent Households in Fall River County
According to the poverty data in Fall River County, 7.8% or 12 single-father households and 44.9% or 162 single-mother households are living below the poverty line. Among single-father households, those with 3 or 4 children have the highest poverty rate, with 7 households (100.0%) experiencing poverty. Likewise, among single-mother households, those with 1 or 2 children have the highest poverty rate, with 102 households (85.7%) falling below the poverty line.
| Children | Single Father | Single Mother |
| No Children | 4 (4.2%) | 60 (25.4%) |
| 1 or 2 Children | 1 (2.0%) | 102 (85.7%) |
| 3 or 4 Children | 7 (100.0%) | 0 (0.0%) |
| 5 or more Children | 0 (0.0%) | 0 (0.0%) |
| Total | 12 (7.8%) | 162 (44.9%) |
Income Below Poverty Among Married-Couple vs Single-Parent Households in Fall River County
The poverty data for Fall River County shows that 109 of the married-couple family households (8.3%) and 174 of the single-parent households (33.8%) are living below the poverty level. Within the married-couple family households, those with 3 or 4 children have the highest poverty rate, with 4 households (10.8%) falling below the poverty line. Among the single-parent households, those with 1 or 2 children have the highest poverty rate, with 103 household (60.6%) living below poverty.
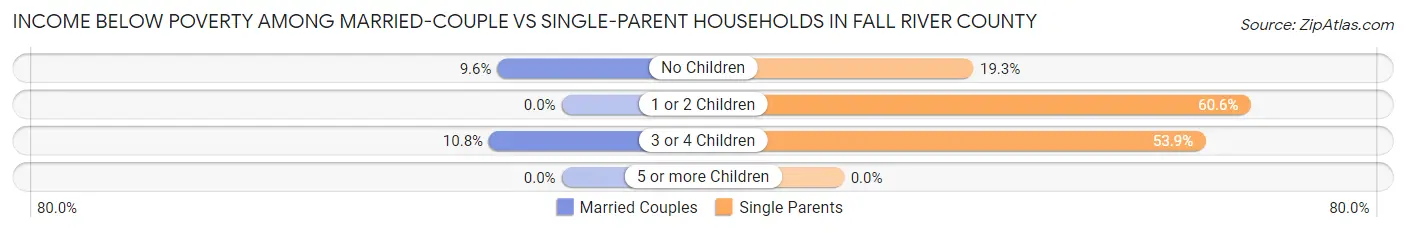
| Children | Married-Couple Families | Single-Parent Households |
| No Children | 105 (9.6%) | 64 (19.3%) |
| 1 or 2 Children | 0 (0.0%) | 103 (60.6%) |
| 3 or 4 Children | 4 (10.8%) | 7 (53.8%) |
| 5 or more Children | 0 (0.0%) | 0 (0.0%) |
| Total | 109 (8.3%) | 174 (33.8%) |
Employment Characteristics in Fall River County
Employment by Class of Employer in Fall River County
Among the 2,858 employed individuals in Fall River County, private company employees (1,309 | 45.8%), federal government employees (434 | 15.2%), and self-employed (not incorporated) (400 | 14.0%) make up the most common classes of employment.
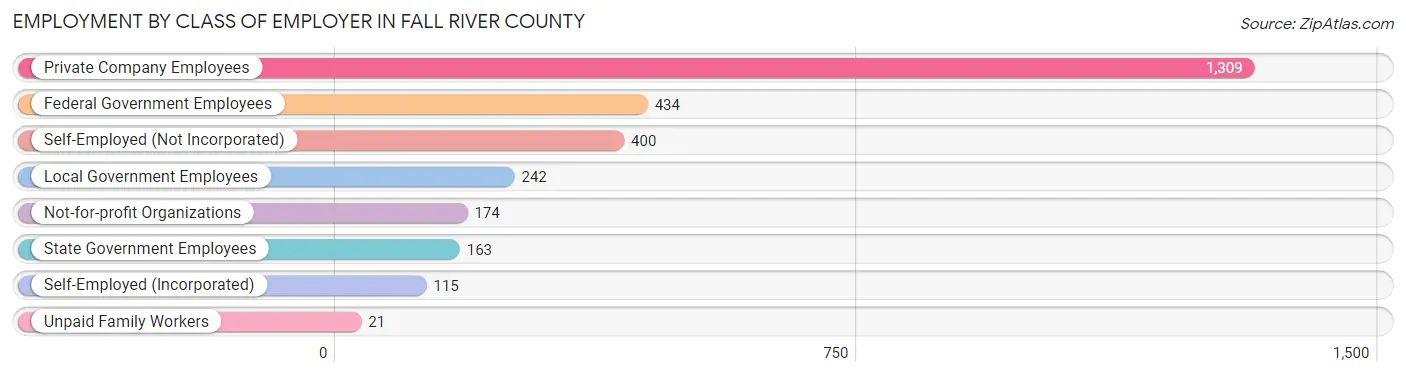
| Employer Class | # Employees | % Employees |
| Private Company Employees | 1,309 | 45.8% |
| Self-Employed (Incorporated) | 115 | 4.0% |
| Self-Employed (Not Incorporated) | 400 | 14.0% |
| Not-for-profit Organizations | 174 | 6.1% |
| Local Government Employees | 242 | 8.5% |
| State Government Employees | 163 | 5.7% |
| Federal Government Employees | 434 | 15.2% |
| Unpaid Family Workers | 21 | 0.7% |
| Total | 2,858 | 100.0% |
Employment Status by Age in Fall River County
According to the labor force statistics for Fall River County, out of the total population over 16 years of age (6,073), 50.3% or 3,055 individuals are in the labor force, with 2.7% or 82 of them unemployed. The age group with the highest labor force participation rate is 35 to 44 years, with 86.6% or 401 individuals in the labor force. Within the labor force, the 16 to 19 years age range has the highest percentage of unemployed individuals, with 29.4% or 40 of them being unemployed.
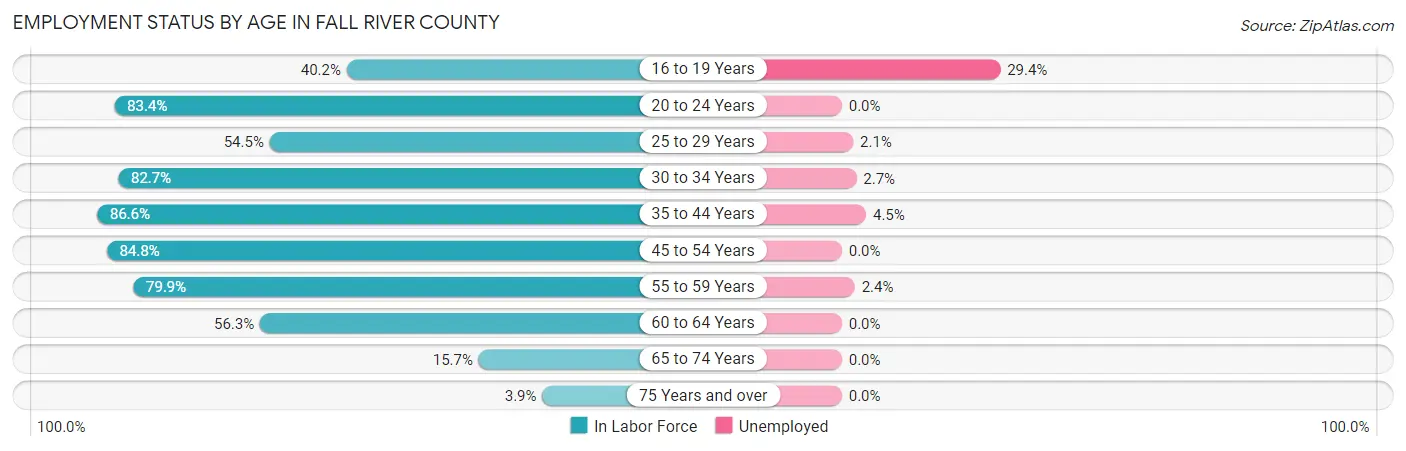
| Age Bracket | In Labor Force | Unemployed |
| 16 to 19 Years | 136 (40.2%) | 40 (29.4%) |
| 20 to 24 Years | 211 (83.4%) | 0 (0.0%) |
| 25 to 29 Years | 140 (54.5%) | 3 (2.1%) |
| 30 to 34 Years | 369 (82.7%) | 10 (2.7%) |
| 35 to 44 Years | 401 (86.6%) | 18 (4.5%) |
| 45 to 54 Years | 704 (84.8%) | 0 (0.0%) |
| 55 to 59 Years | 460 (79.9%) | 11 (2.4%) |
| 60 to 64 Years | 387 (56.3%) | 0 (0.0%) |
| 65 to 74 Years | 211 (15.7%) | 0 (0.0%) |
| 75 Years and over | 34 (3.9%) | 0 (0.0%) |
| Total | 3,055 (50.3%) | 82 (2.7%) |
Employment Status by Educational Attainment in Fall River County
According to labor force statistics for Fall River County, 75.5% of individuals (2,461) out of the total population between 25 and 64 years of age (3,260) are in the labor force, with 1.7% or 42 of them being unemployed. The group with the highest labor force participation rate are those with the educational attainment of bachelor's degree or higher, with 89.7% or 513 individuals in the labor force. Within the labor force, individuals with high school diploma education have the highest percentage of unemployment, with 4.1% or 23 of them being unemployed.
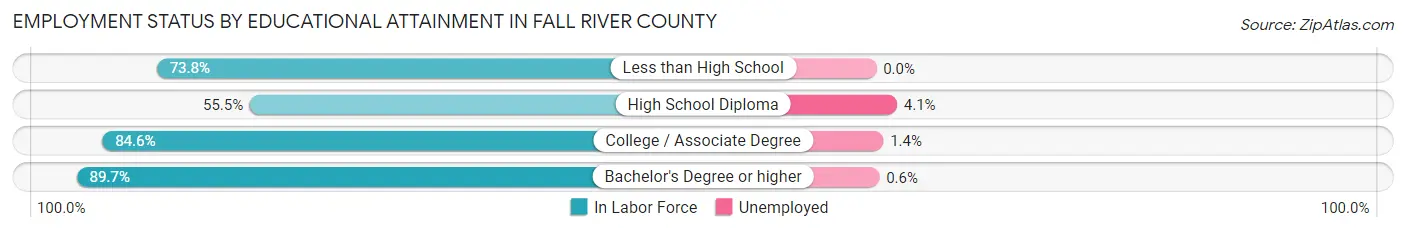
| Educational Attainment | In Labor Force | Unemployed |
| Less than High School | 223 (73.8%) | 0 (0.0%) |
| High School Diploma | 559 (55.5%) | 41 (4.1%) |
| College / Associate Degree | 1,167 (84.6%) | 19 (1.4%) |
| Bachelor's Degree or higher | 513 (89.7%) | 3 (0.6%) |
| Total | 2,461 (75.5%) | 55 (1.7%) |
Employment Occupations by Sex in Fall River County
Management, Business, Science and Arts Occupations
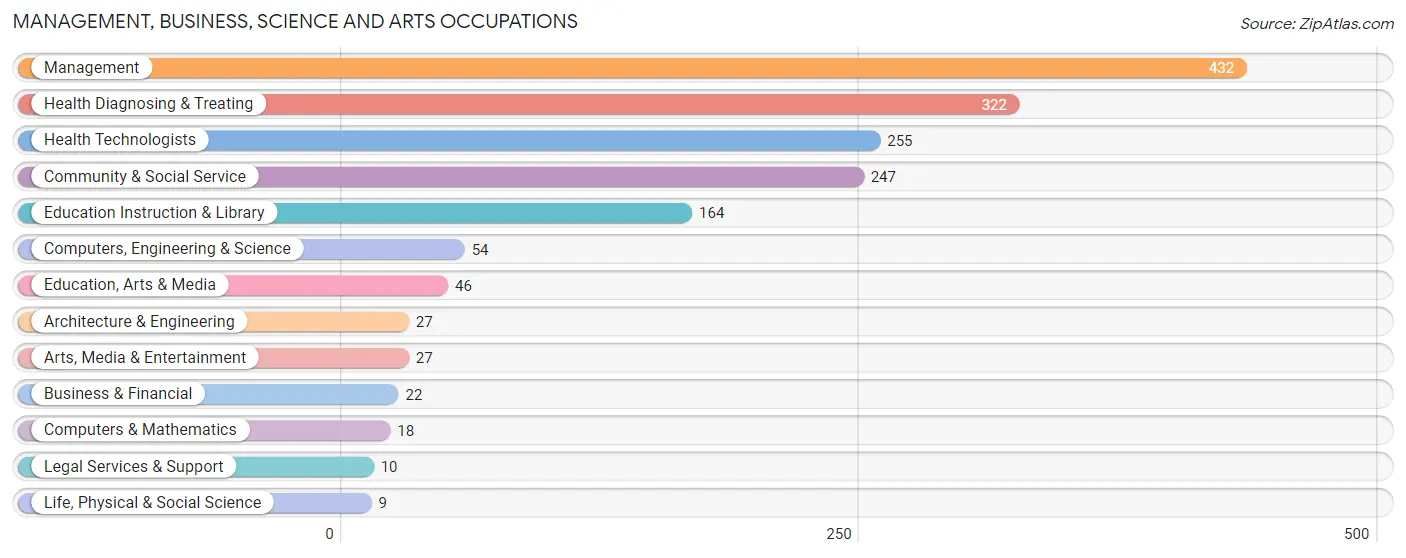
The most common Management, Business, Science and Arts occupations in Fall River County are Management (432 | 14.5%), Health Diagnosing & Treating (322 | 10.8%), Health Technologists (255 | 8.6%), Community & Social Service (247 | 8.3%), and Education Instruction & Library (164 | 5.5%).
Management, Business, Science and Arts Occupations by Sex
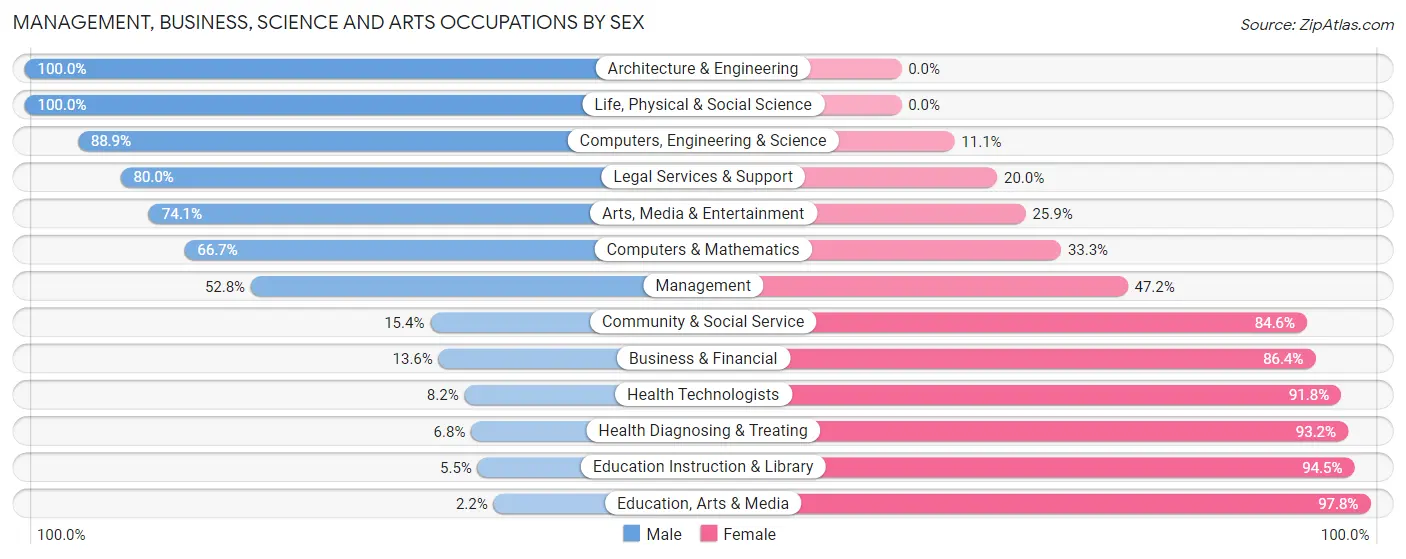
Within the Management, Business, Science and Arts occupations in Fall River County, the most male-oriented occupations are Architecture & Engineering (100.0%), Life, Physical & Social Science (100.0%), and Computers, Engineering & Science (88.9%), while the most female-oriented occupations are Education, Arts & Media (97.8%), Education Instruction & Library (94.5%), and Health Diagnosing & Treating (93.2%).
| Occupation | Male | Female |
| Management | 228 (52.8%) | 204 (47.2%) |
| Business & Financial | 3 (13.6%) | 19 (86.4%) |
| Computers, Engineering & Science | 48 (88.9%) | 6 (11.1%) |
| Computers & Mathematics | 12 (66.7%) | 6 (33.3%) |
| Architecture & Engineering | 27 (100.0%) | 0 (0.0%) |
| Life, Physical & Social Science | 9 (100.0%) | 0 (0.0%) |
| Community & Social Service | 38 (15.4%) | 209 (84.6%) |
| Education, Arts & Media | 1 (2.2%) | 45 (97.8%) |
| Legal Services & Support | 8 (80.0%) | 2 (20.0%) |
| Education Instruction & Library | 9 (5.5%) | 155 (94.5%) |
| Arts, Media & Entertainment | 20 (74.1%) | 7 (25.9%) |
| Health Diagnosing & Treating | 22 (6.8%) | 300 (93.2%) |
| Health Technologists | 21 (8.2%) | 234 (91.8%) |
| Total (Category) | 339 (31.5%) | 738 (68.5%) |
| Total (Overall) | 1,523 (51.3%) | 1,448 (48.7%) |
Services Occupations
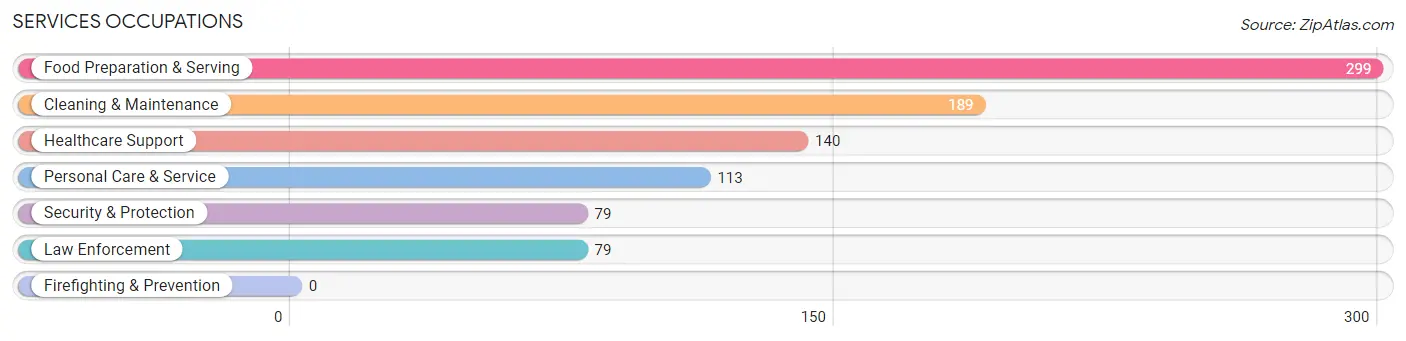
The most common Services occupations in Fall River County are Food Preparation & Serving (299 | 10.1%), Cleaning & Maintenance (189 | 6.4%), Healthcare Support (140 | 4.7%), Personal Care & Service (113 | 3.8%), and Security & Protection (79 | 2.7%).
Services Occupations by Sex
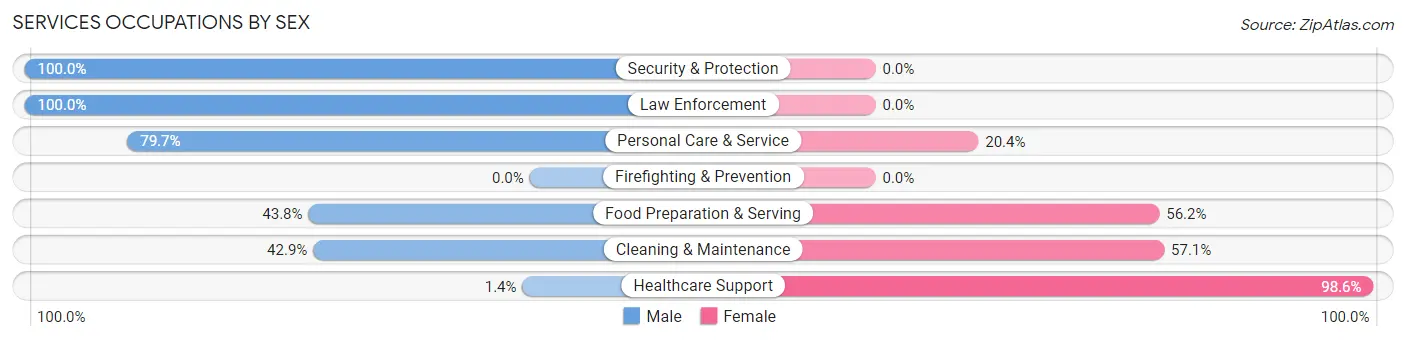
Within the Services occupations in Fall River County, the most male-oriented occupations are Security & Protection (100.0%), Law Enforcement (100.0%), and Personal Care & Service (79.6%), while the most female-oriented occupations are Healthcare Support (98.6%), Cleaning & Maintenance (57.1%), and Food Preparation & Serving (56.2%).
| Occupation | Male | Female |
| Healthcare Support | 2 (1.4%) | 138 (98.6%) |
| Security & Protection | 79 (100.0%) | 0 (0.0%) |
| Firefighting & Prevention | 0 (0.0%) | 0 (0.0%) |
| Law Enforcement | 79 (100.0%) | 0 (0.0%) |
| Food Preparation & Serving | 131 (43.8%) | 168 (56.2%) |
| Cleaning & Maintenance | 81 (42.9%) | 108 (57.1%) |
| Personal Care & Service | 90 (79.6%) | 23 (20.3%) |
| Total (Category) | 383 (46.7%) | 437 (53.3%) |
| Total (Overall) | 1,523 (51.3%) | 1,448 (48.7%) |
Sales and Office Occupations
The most common Sales and Office occupations in Fall River County are Sales & Related (173 | 5.8%), and Office & Administration (158 | 5.3%).
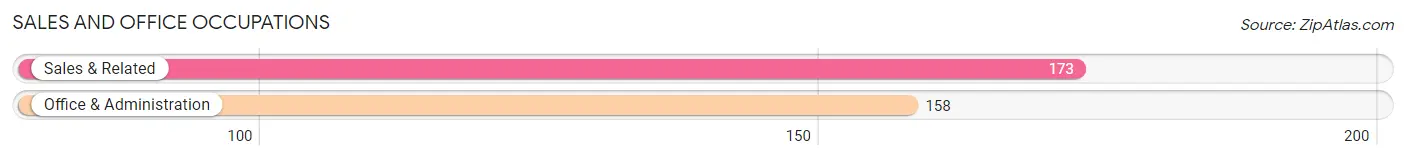
Sales and Office Occupations by Sex

| Occupation | Male | Female |
| Sales & Related | 77 (44.5%) | 96 (55.5%) |
| Office & Administration | 31 (19.6%) | 127 (80.4%) |
| Total (Category) | 108 (32.6%) | 223 (67.4%) |
| Total (Overall) | 1,523 (51.3%) | 1,448 (48.7%) |
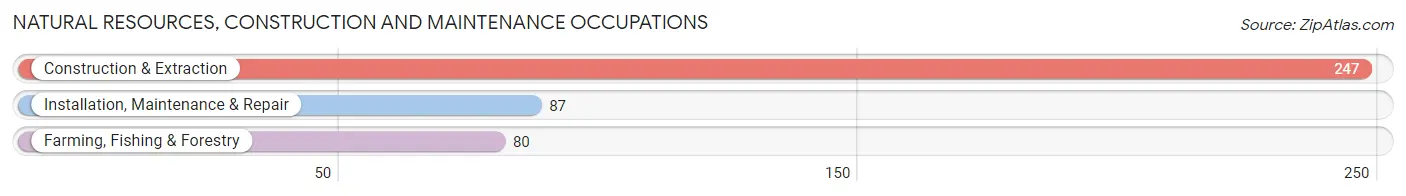
Natural Resources, Construction and Maintenance Occupations
The most common Natural Resources, Construction and Maintenance occupations in Fall River County are Construction & Extraction (247 | 8.3%), Installation, Maintenance & Repair (87 | 2.9%), and Farming, Fishing & Forestry (80 | 2.7%).
Natural Resources, Construction and Maintenance Occupations by Sex
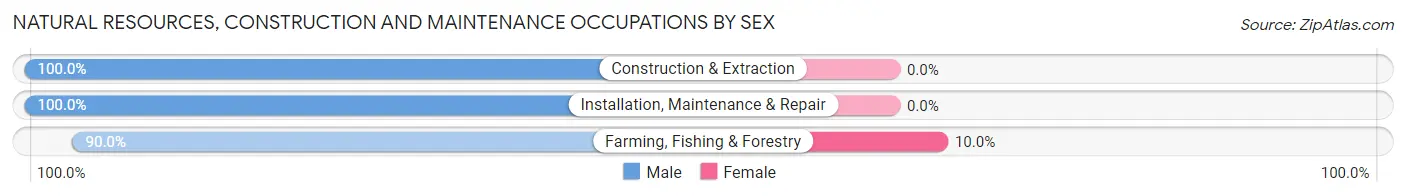
| Occupation | Male | Female |
| Farming, Fishing & Forestry | 72 (90.0%) | 8 (10.0%) |
| Construction & Extraction | 247 (100.0%) | 0 (0.0%) |
| Installation, Maintenance & Repair | 87 (100.0%) | 0 (0.0%) |
| Total (Category) | 406 (98.1%) | 8 (1.9%) |
| Total (Overall) | 1,523 (51.3%) | 1,448 (48.7%) |
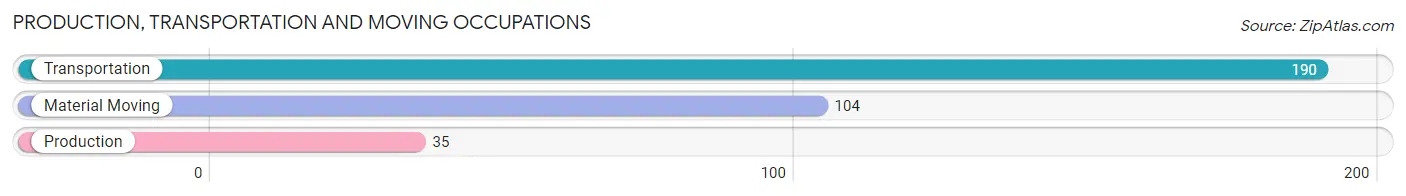
Production, Transportation and Moving Occupations
The most common Production, Transportation and Moving occupations in Fall River County are Transportation (190 | 6.4%), Material Moving (104 | 3.5%), and Production (35 | 1.2%).
Production, Transportation and Moving Occupations by Sex
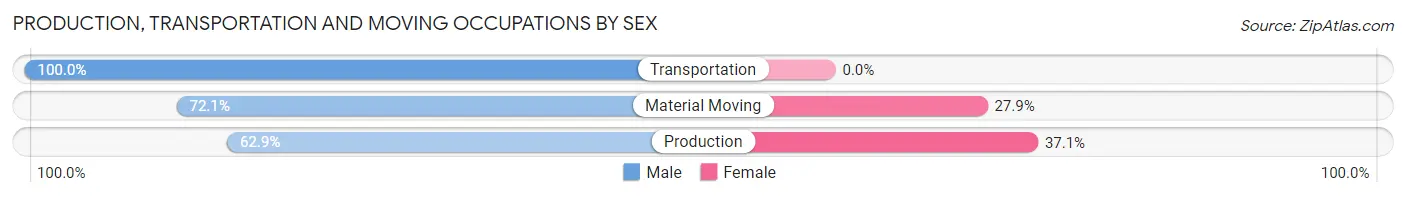
| Occupation | Male | Female |
| Production | 22 (62.9%) | 13 (37.1%) |
| Transportation | 190 (100.0%) | 0 (0.0%) |
| Material Moving | 75 (72.1%) | 29 (27.9%) |
| Total (Category) | 287 (87.2%) | 42 (12.8%) |
| Total (Overall) | 1,523 (51.3%) | 1,448 (48.7%) |
Employment Industries by Sex in Fall River County
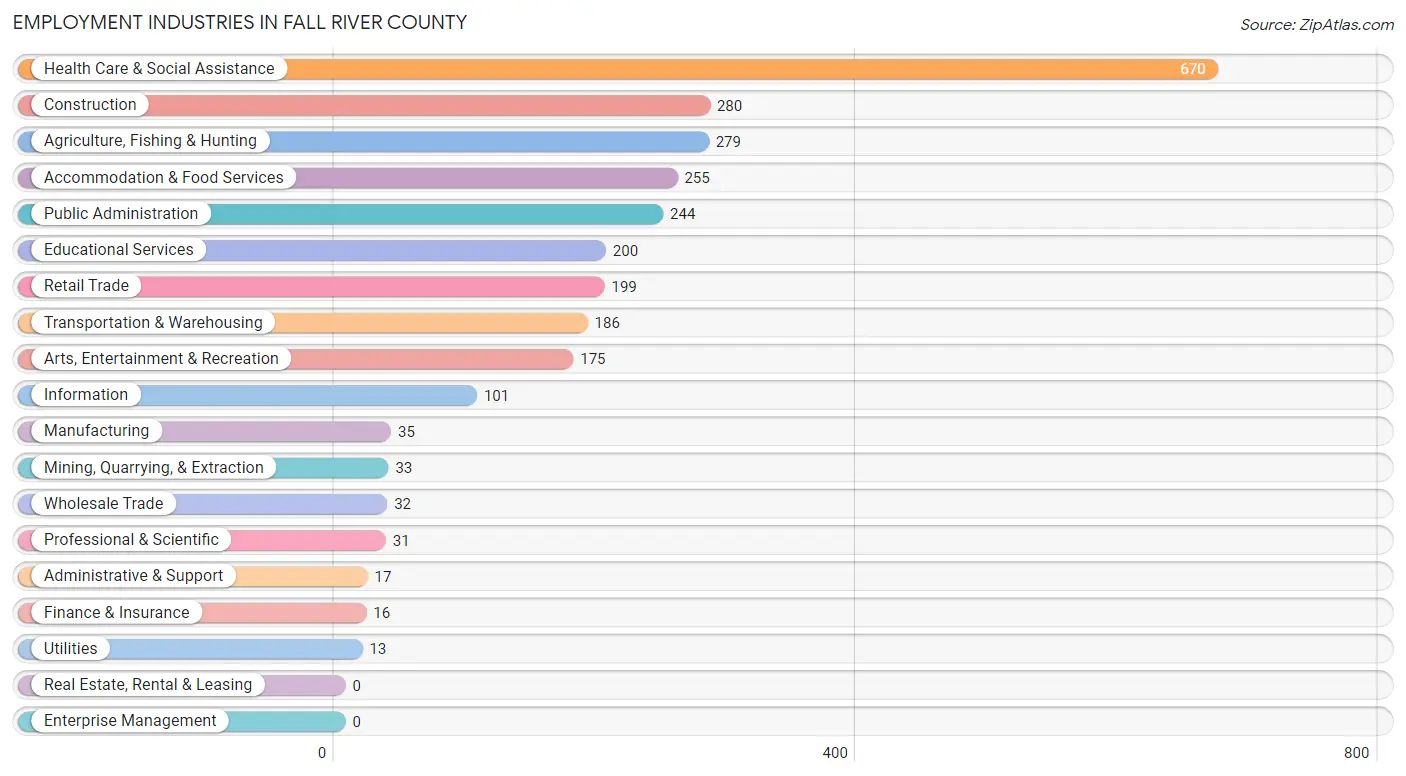
Employment Industries in Fall River County
The major employment industries in Fall River County include Health Care & Social Assistance (670 | 22.6%), Construction (280 | 9.4%), Agriculture, Fishing & Hunting (279 | 9.4%), Accommodation & Food Services (255 | 8.6%), and Public Administration (244 | 8.2%).
Employment Industries by Sex in Fall River County
The Fall River County industries that see more men than women are Mining, Quarrying, & Extraction (100.0%), Construction (100.0%), and Wholesale Trade (100.0%), whereas the industries that tend to have a higher number of women are Health Care & Social Assistance (90.7%), Finance & Insurance (81.2%), and Information (80.2%).
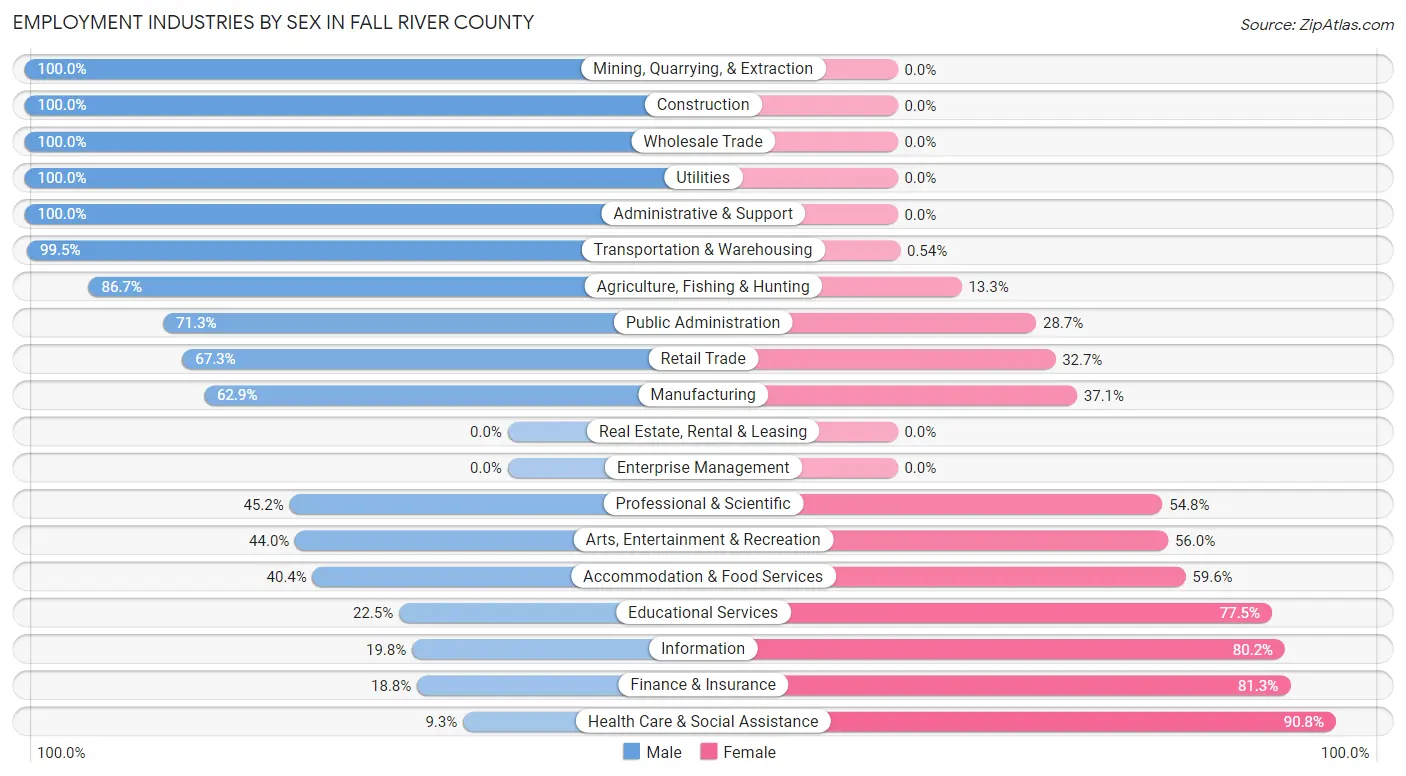
| Industry | Male | Female |
| Agriculture, Fishing & Hunting | 242 (86.7%) | 37 (13.3%) |
| Mining, Quarrying, & Extraction | 33 (100.0%) | 0 (0.0%) |
| Construction | 280 (100.0%) | 0 (0.0%) |
| Manufacturing | 22 (62.9%) | 13 (37.1%) |
| Wholesale Trade | 32 (100.0%) | 0 (0.0%) |
| Retail Trade | 134 (67.3%) | 65 (32.7%) |
| Transportation & Warehousing | 185 (99.5%) | 1 (0.5%) |
| Utilities | 13 (100.0%) | 0 (0.0%) |
| Information | 20 (19.8%) | 81 (80.2%) |
| Finance & Insurance | 3 (18.8%) | 13 (81.2%) |
| Real Estate, Rental & Leasing | 0 (0.0%) | 0 (0.0%) |
| Professional & Scientific | 14 (45.2%) | 17 (54.8%) |
| Enterprise Management | 0 (0.0%) | 0 (0.0%) |
| Administrative & Support | 17 (100.0%) | 0 (0.0%) |
| Educational Services | 45 (22.5%) | 155 (77.5%) |
| Health Care & Social Assistance | 62 (9.2%) | 608 (90.7%) |
| Arts, Entertainment & Recreation | 77 (44.0%) | 98 (56.0%) |
| Accommodation & Food Services | 103 (40.4%) | 152 (59.6%) |
| Public Administration | 174 (71.3%) | 70 (28.7%) |
| Total | 1,523 (51.3%) | 1,448 (48.7%) |
Education in Fall River County
School Enrollment in Fall River County
The most common levels of schooling among the 1,171 students in Fall River County are high school (336 | 28.7%), elementary school (290 | 24.8%), and middle school (182 | 15.5%).
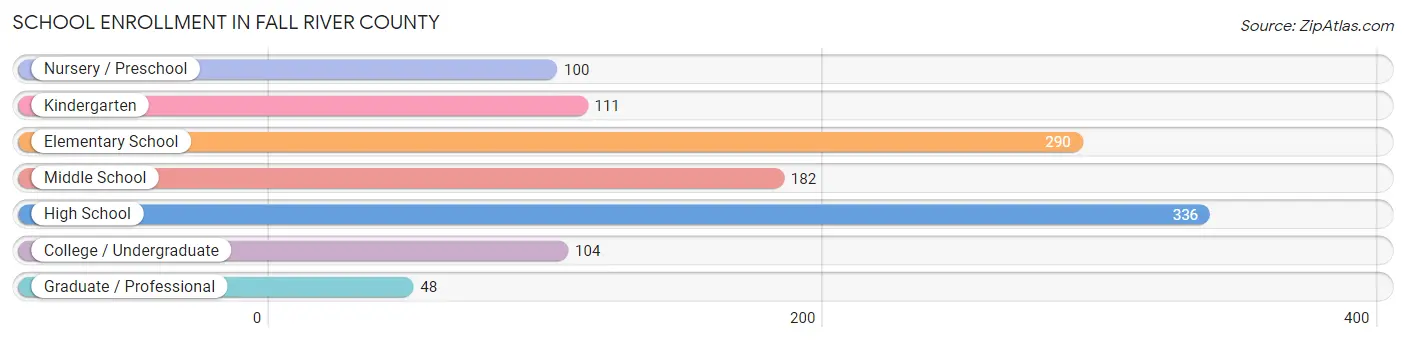
| School Level | # Students | % Students |
| Nursery / Preschool | 100 | 8.5% |
| Kindergarten | 111 | 9.5% |
| Elementary School | 290 | 24.8% |
| Middle School | 182 | 15.5% |
| High School | 336 | 28.7% |
| College / Undergraduate | 104 | 8.9% |
| Graduate / Professional | 48 | 4.1% |
| Total | 1,171 | 100.0% |
School Enrollment by Age by Funding Source in Fall River County
Out of a total of 1,171 students who are enrolled in schools in Fall River County, 146 (12.5%) attend a private institution, while the remaining 1,025 (87.5%) are enrolled in public schools. The age group of 35 years and over has the highest likelihood of being enrolled in private schools, with 36 (76.6% in the age bracket) enrolled. Conversely, the age group of 3 to 4 year olds has the lowest likelihood of being enrolled in a private school, with 100 (100.0% in the age bracket) attending a public institution.
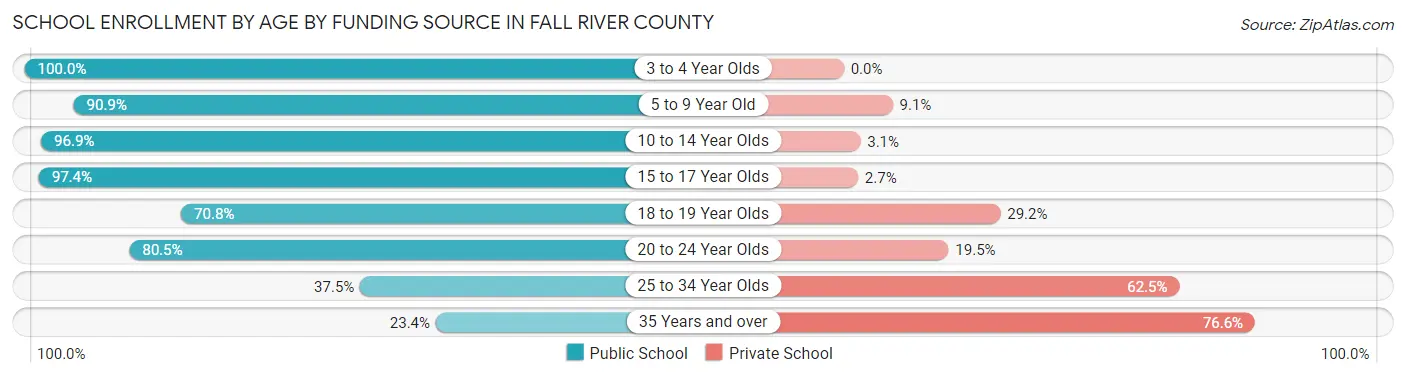
| Age Bracket | Public School | Private School |
| 3 to 4 Year Olds | 100 (100.0%) | 0 (0.0%) |
| 5 to 9 Year Old | 339 (90.9%) | 34 (9.1%) |
| 10 to 14 Year Olds | 188 (96.9%) | 6 (3.1%) |
| 15 to 17 Year Olds | 257 (97.4%) | 7 (2.6%) |
| 18 to 19 Year Olds | 85 (70.8%) | 35 (29.2%) |
| 20 to 24 Year Olds | 33 (80.5%) | 8 (19.5%) |
| 25 to 34 Year Olds | 12 (37.5%) | 20 (62.5%) |
| 35 Years and over | 11 (23.4%) | 36 (76.6%) |
| Total | 1,025 (87.5%) | 146 (12.5%) |
Educational Attainment by Field of Study in Fall River County
Education (295 | 24.5%), business (206 | 17.1%), science & technology (203 | 16.8%), bio, nature & agricultural (107 | 8.9%), and arts & humanities (93 | 7.7%) are the most common fields of study among 1,206 individuals in Fall River County who have obtained a bachelor's degree or higher.
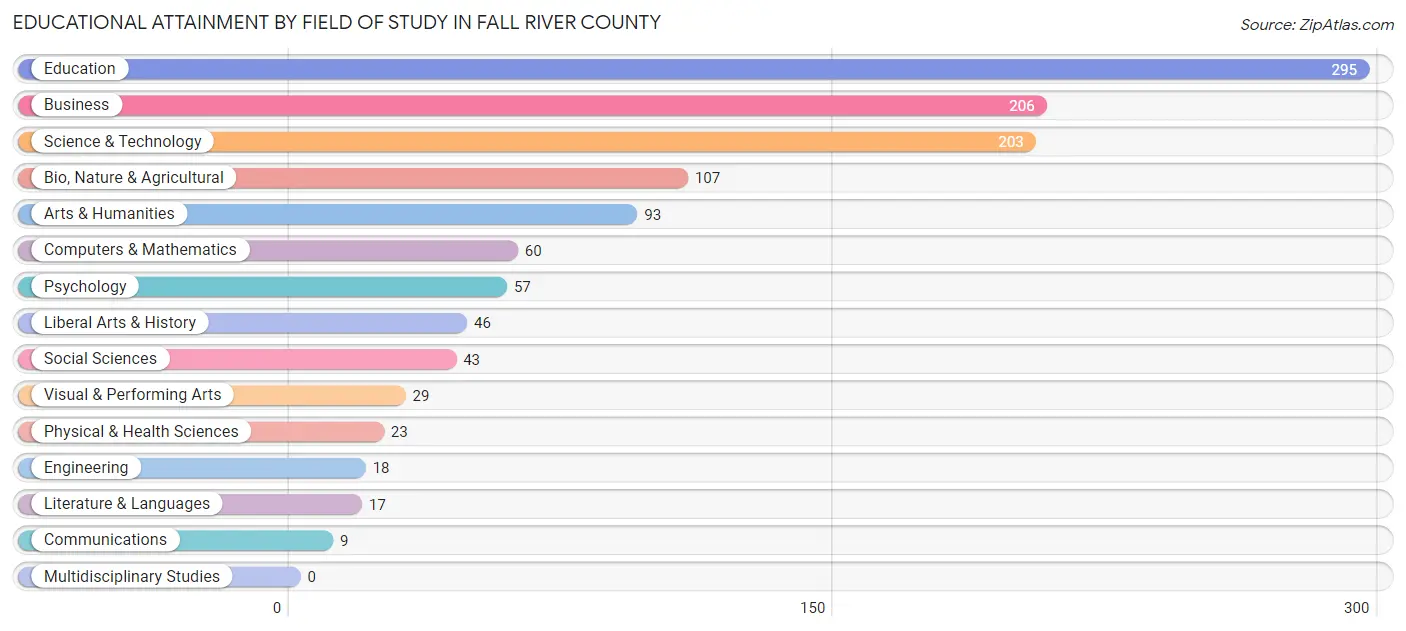
| Field of Study | # Graduates | % Graduates |
| Computers & Mathematics | 60 | 5.0% |
| Bio, Nature & Agricultural | 107 | 8.9% |
| Physical & Health Sciences | 23 | 1.9% |
| Psychology | 57 | 4.7% |
| Social Sciences | 43 | 3.6% |
| Engineering | 18 | 1.5% |
| Multidisciplinary Studies | 0 | 0.0% |
| Science & Technology | 203 | 16.8% |
| Business | 206 | 17.1% |
| Education | 295 | 24.5% |
| Literature & Languages | 17 | 1.4% |
| Liberal Arts & History | 46 | 3.8% |
| Visual & Performing Arts | 29 | 2.4% |
| Communications | 9 | 0.7% |
| Arts & Humanities | 93 | 7.7% |
| Total | 1,206 | 100.0% |
Transportation & Commute in Fall River County
Vehicle Availability by Sex in Fall River County
The most prevalent vehicle ownership categories in Fall River County are males with 2 vehicles (458, accounting for 30.5%) and females with 2 vehicles (496, making up 34.6%).
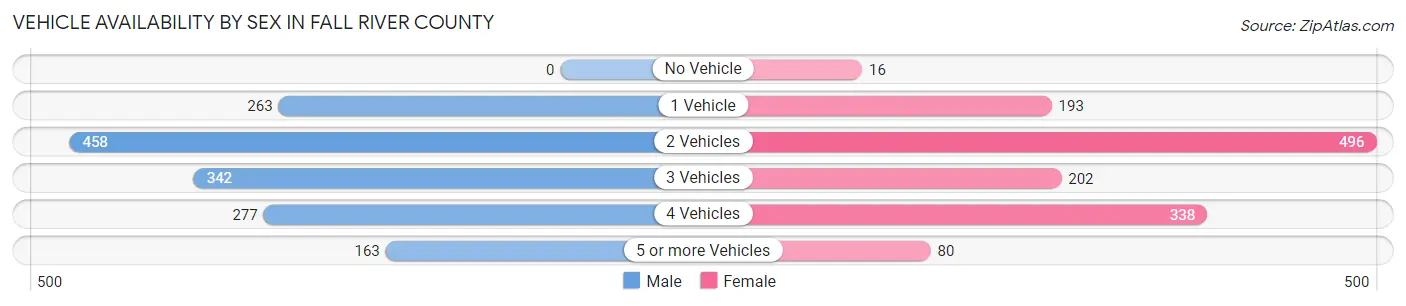
| Vehicles Available | Male | Female |
| No Vehicle | 0 (0.0%) | 16 (1.2%) |
| 1 Vehicle | 263 (17.5%) | 193 (14.6%) |
| 2 Vehicles | 458 (30.5%) | 496 (37.4%) |
| 3 Vehicles | 342 (22.8%) | 202 (15.2%) |
| 4 Vehicles | 277 (18.4%) | 338 (25.5%) |
| 5 or more Vehicles | 163 (10.8%) | 80 (6.0%) |
| Total | 1,503 (100.0%) | 1,325 (100.0%) |
Commute Time in Fall River County
The most frequently occuring commute durations in Fall River County are 5 to 9 minutes (660 commuters, 26.0%), less than 5 minutes (500 commuters, 19.7%), and 10 to 14 minutes (366 commuters, 14.4%).
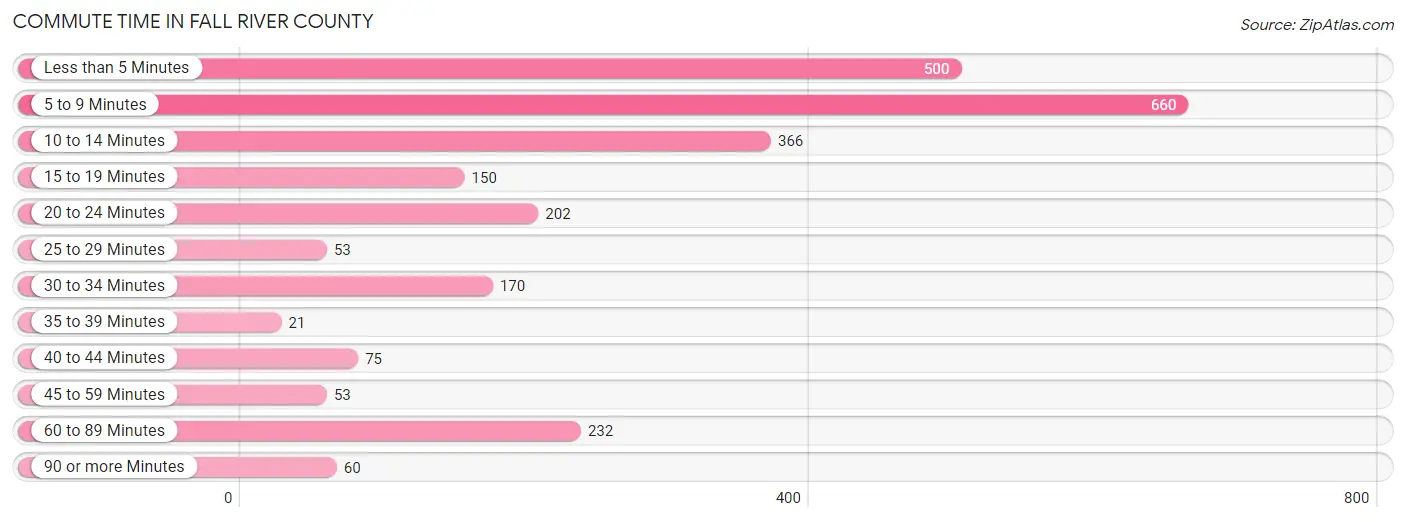
| Commute Time | # Commuters | % Commuters |
| Less than 5 Minutes | 500 | 19.7% |
| 5 to 9 Minutes | 660 | 26.0% |
| 10 to 14 Minutes | 366 | 14.4% |
| 15 to 19 Minutes | 150 | 5.9% |
| 20 to 24 Minutes | 202 | 8.0% |
| 25 to 29 Minutes | 53 | 2.1% |
| 30 to 34 Minutes | 170 | 6.7% |
| 35 to 39 Minutes | 21 | 0.8% |
| 40 to 44 Minutes | 75 | 2.9% |
| 45 to 59 Minutes | 53 | 2.1% |
| 60 to 89 Minutes | 232 | 9.1% |
| 90 or more Minutes | 60 | 2.4% |
Commute Time by Sex in Fall River County
The most common commute times in Fall River County are 5 to 9 minutes (316 commuters, 24.0%) for males and 5 to 9 minutes (344 commuters, 28.1%) for females.
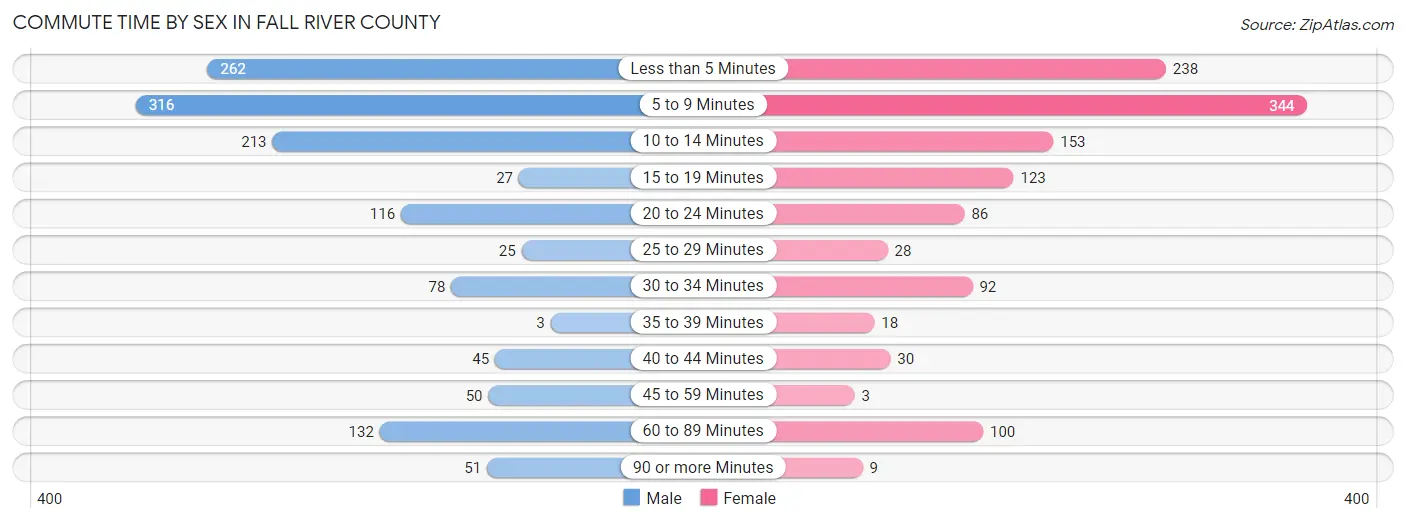
| Commute Time | Male | Female |
| Less than 5 Minutes | 262 (19.9%) | 238 (19.4%) |
| 5 to 9 Minutes | 316 (24.0%) | 344 (28.1%) |
| 10 to 14 Minutes | 213 (16.2%) | 153 (12.5%) |
| 15 to 19 Minutes | 27 (2.1%) | 123 (10.1%) |
| 20 to 24 Minutes | 116 (8.8%) | 86 (7.0%) |
| 25 to 29 Minutes | 25 (1.9%) | 28 (2.3%) |
| 30 to 34 Minutes | 78 (5.9%) | 92 (7.5%) |
| 35 to 39 Minutes | 3 (0.2%) | 18 (1.5%) |
| 40 to 44 Minutes | 45 (3.4%) | 30 (2.5%) |
| 45 to 59 Minutes | 50 (3.8%) | 3 (0.3%) |
| 60 to 89 Minutes | 132 (10.0%) | 100 (8.2%) |
| 90 or more Minutes | 51 (3.9%) | 9 (0.7%) |
Time of Departure to Work by Sex in Fall River County
The most frequent times of departure to work in Fall River County are 7:00 AM to 7:29 AM (253, 19.2%) for males and 7:00 AM to 7:29 AM (285, 23.3%) for females.
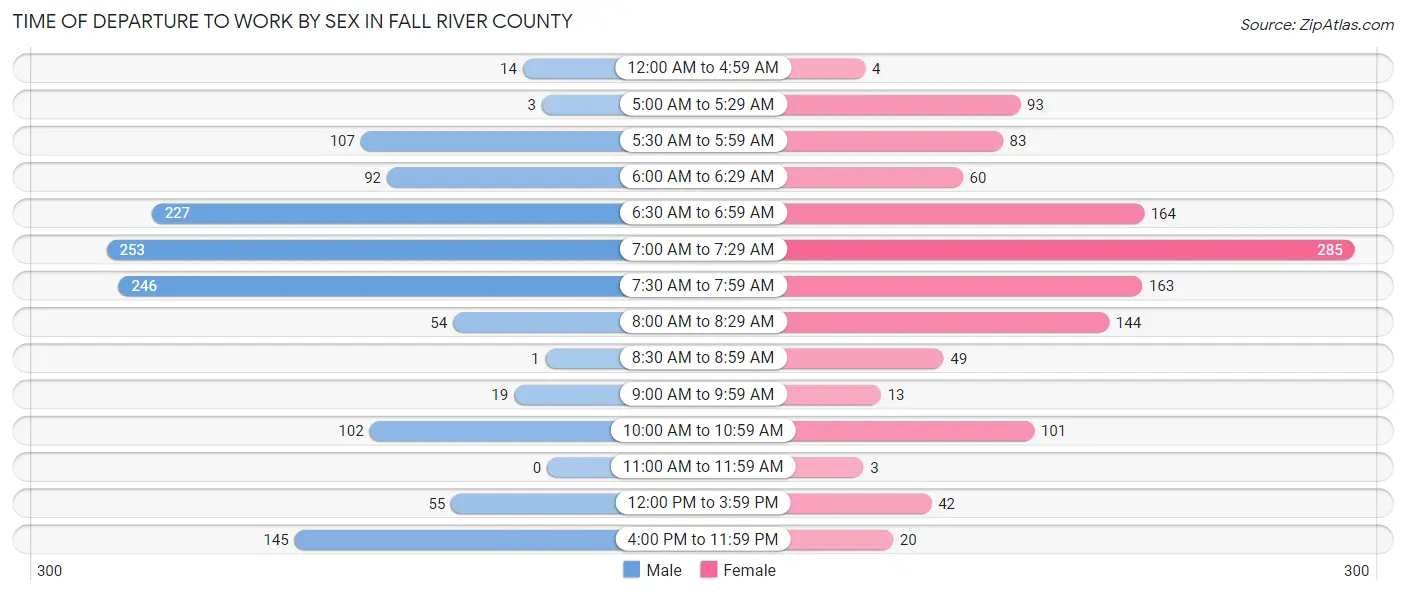
| Time of Departure | Male | Female |
| 12:00 AM to 4:59 AM | 14 (1.1%) | 4 (0.3%) |
| 5:00 AM to 5:29 AM | 3 (0.2%) | 93 (7.6%) |
| 5:30 AM to 5:59 AM | 107 (8.1%) | 83 (6.8%) |
| 6:00 AM to 6:29 AM | 92 (7.0%) | 60 (4.9%) |
| 6:30 AM to 6:59 AM | 227 (17.2%) | 164 (13.4%) |
| 7:00 AM to 7:29 AM | 253 (19.2%) | 285 (23.3%) |
| 7:30 AM to 7:59 AM | 246 (18.7%) | 163 (13.3%) |
| 8:00 AM to 8:29 AM | 54 (4.1%) | 144 (11.8%) |
| 8:30 AM to 8:59 AM | 1 (0.1%) | 49 (4.0%) |
| 9:00 AM to 9:59 AM | 19 (1.4%) | 13 (1.1%) |
| 10:00 AM to 10:59 AM | 102 (7.7%) | 101 (8.3%) |
| 11:00 AM to 11:59 AM | 0 (0.0%) | 3 (0.3%) |
| 12:00 PM to 3:59 PM | 55 (4.2%) | 42 (3.4%) |
| 4:00 PM to 11:59 PM | 145 (11.0%) | 20 (1.6%) |
| Total | 1,318 (100.0%) | 1,224 (100.0%) |
Housing Occupancy in Fall River County
Occupancy by Ownership in Fall River County
Of the total 3,221 dwellings in Fall River County, owner-occupied units account for 2,440 (75.7%), while renter-occupied units make up 781 (24.2%).
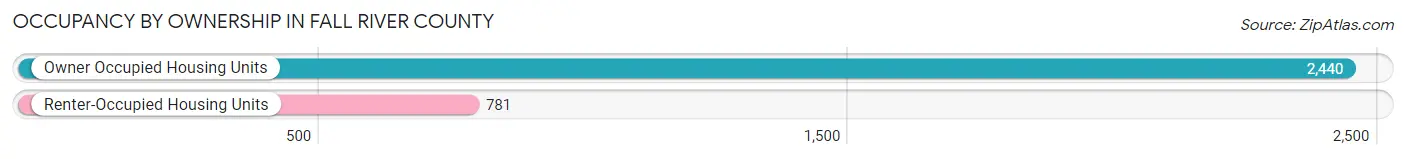
| Occupancy | # Housing Units | % Housing Units |
| Owner Occupied Housing Units | 2,440 | 75.7% |
| Renter-Occupied Housing Units | 781 | 24.2% |
| Total Occupied Housing Units | 3,221 | 100.0% |
Occupancy by Household Size in Fall River County
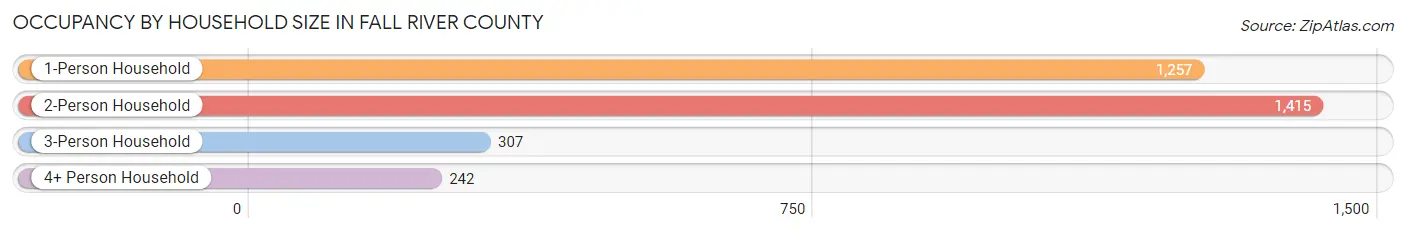
| Household Size | # Housing Units | % Housing Units |
| 1-Person Household | 1,257 | 39.0% |
| 2-Person Household | 1,415 | 43.9% |
| 3-Person Household | 307 | 9.5% |
| 4+ Person Household | 242 | 7.5% |
| Total Housing Units | 3,221 | 100.0% |
Occupancy by Ownership by Household Size in Fall River County
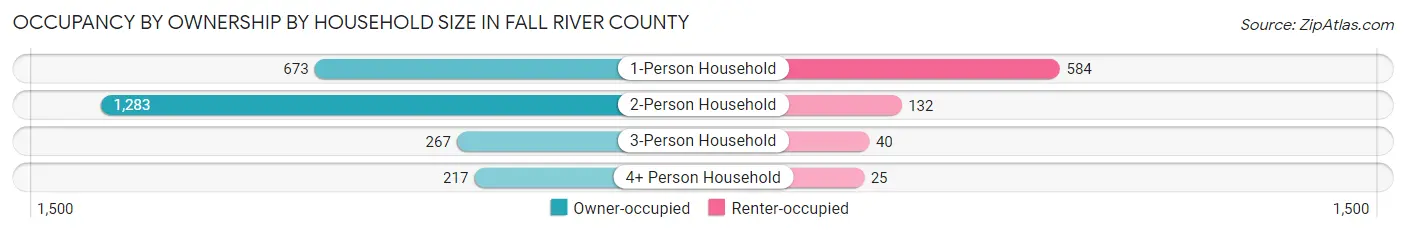
| Household Size | Owner-occupied | Renter-occupied |
| 1-Person Household | 673 (53.5%) | 584 (46.5%) |
| 2-Person Household | 1,283 (90.7%) | 132 (9.3%) |
| 3-Person Household | 267 (87.0%) | 40 (13.0%) |
| 4+ Person Household | 217 (89.7%) | 25 (10.3%) |
| Total Housing Units | 2,440 (75.7%) | 781 (24.2%) |
Occupancy by Educational Attainment in Fall River County
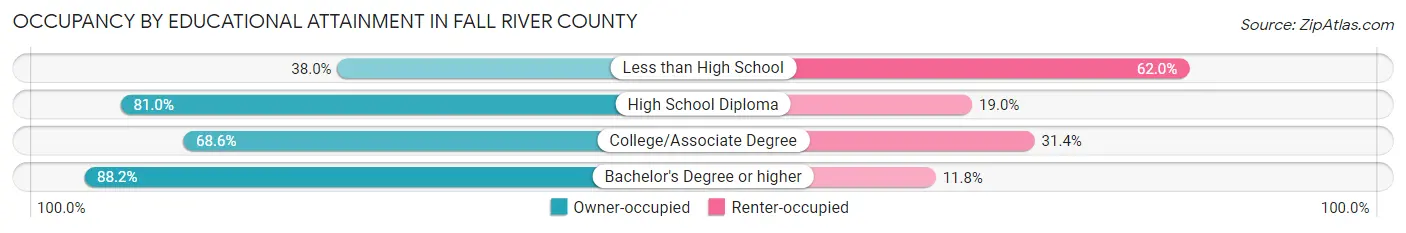
| Household Size | Owner-occupied | Renter-occupied |
| Less than High School | 79 (38.0%) | 129 (62.0%) |
| High School Diploma | 872 (81.0%) | 205 (19.0%) |
| College/Associate Degree | 764 (68.6%) | 350 (31.4%) |
| Bachelor's Degree or higher | 725 (88.2%) | 97 (11.8%) |
Occupancy by Age of Householder in Fall River County
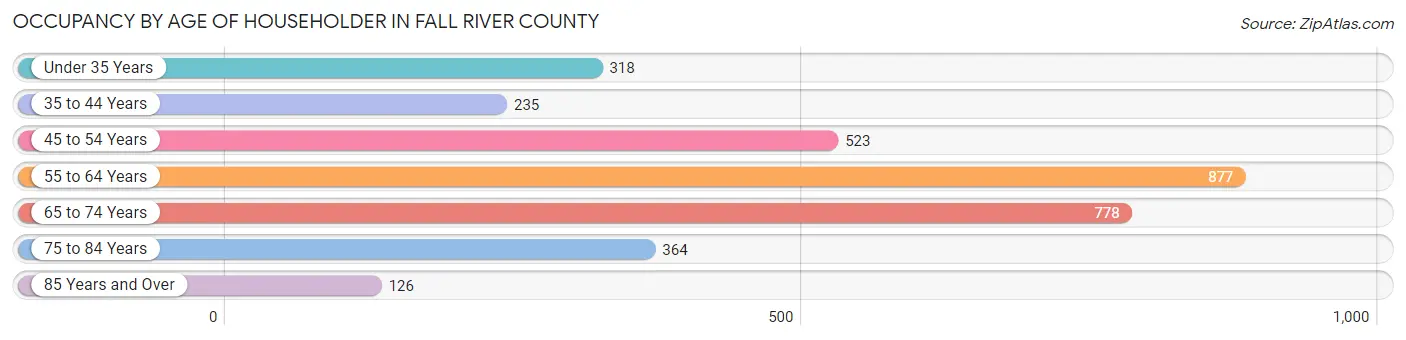
| Age Bracket | # Households | % Households |
| Under 35 Years | 318 | 9.9% |
| 35 to 44 Years | 235 | 7.3% |
| 45 to 54 Years | 523 | 16.2% |
| 55 to 64 Years | 877 | 27.2% |
| 65 to 74 Years | 778 | 24.1% |
| 75 to 84 Years | 364 | 11.3% |
| 85 Years and Over | 126 | 3.9% |
| Total | 3,221 | 100.0% |
Housing Finances in Fall River County
Median Income by Occupancy in Fall River County
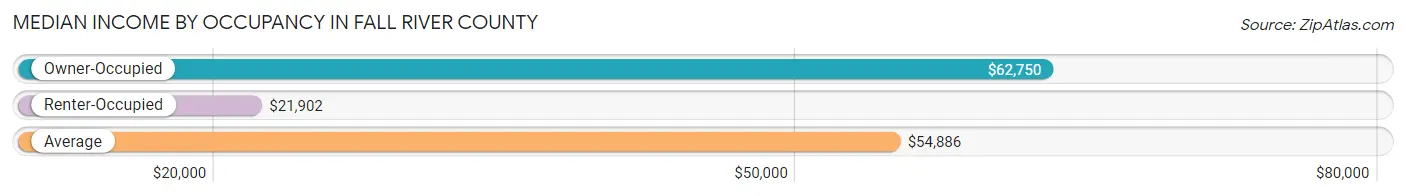
| Occupancy Type | # Households | Median Income |
| Owner-Occupied | 2,440 (75.7%) | $62,750 |
| Renter-Occupied | 781 (24.2%) | $21,902 |
| Average | 3,221 (100.0%) | $54,886 |
Occupancy by Householder Income Bracket in Fall River County
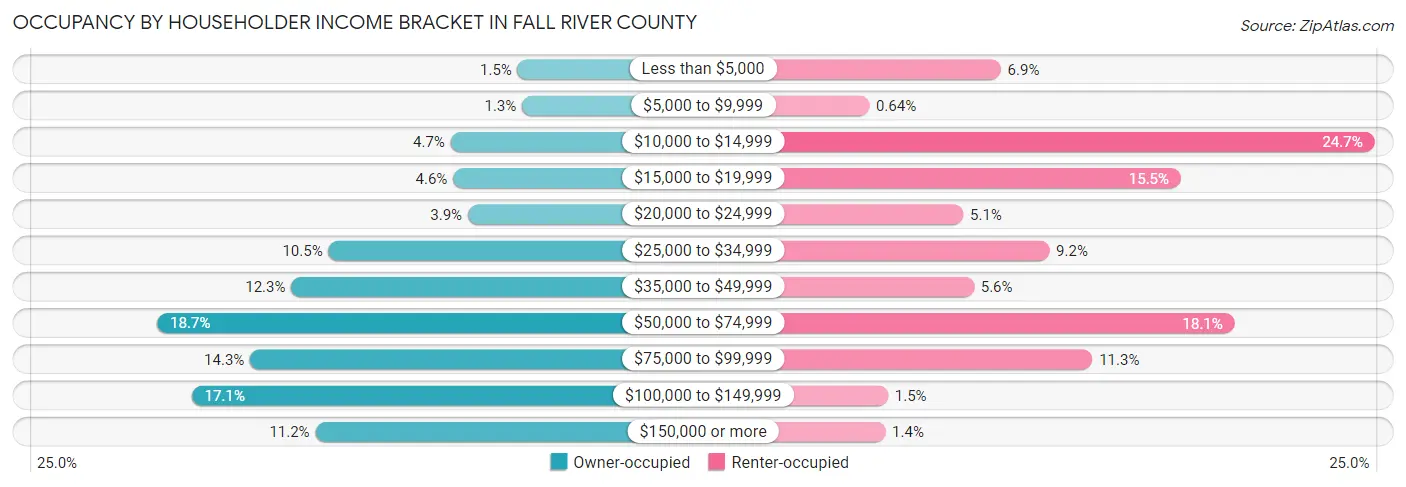
| Income Bracket | Owner-occupied | Renter-occupied |
| Less than $5,000 | 37 (1.5%) | 54 (6.9%) |
| $5,000 to $9,999 | 32 (1.3%) | 5 (0.6%) |
| $10,000 to $14,999 | 115 (4.7%) | 193 (24.7%) |
| $15,000 to $19,999 | 112 (4.6%) | 121 (15.5%) |
| $20,000 to $24,999 | 95 (3.9%) | 40 (5.1%) |
| $25,000 to $34,999 | 257 (10.5%) | 72 (9.2%) |
| $35,000 to $49,999 | 300 (12.3%) | 44 (5.6%) |
| $50,000 to $74,999 | 456 (18.7%) | 141 (18.0%) |
| $75,000 to $99,999 | 348 (14.3%) | 88 (11.3%) |
| $100,000 to $149,999 | 416 (17.1%) | 12 (1.5%) |
| $150,000 or more | 272 (11.2%) | 11 (1.4%) |
| Total | 2,440 (100.0%) | 781 (100.0%) |
Monthly Housing Cost Tiers in Fall River County
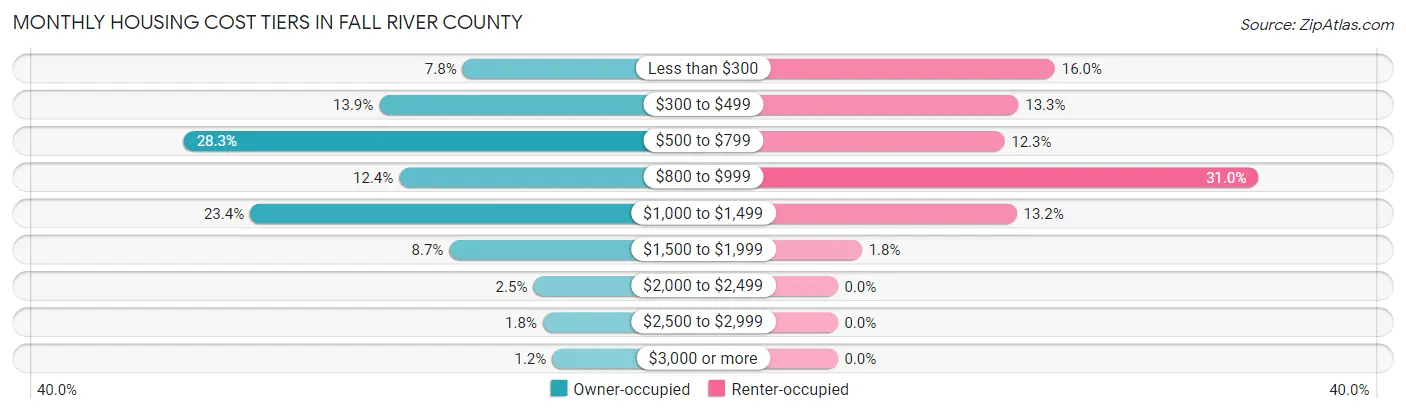
| Monthly Cost | Owner-occupied | Renter-occupied |
| Less than $300 | 189 (7.7%) | 125 (16.0%) |
| $300 to $499 | 339 (13.9%) | 104 (13.3%) |
| $500 to $799 | 690 (28.3%) | 96 (12.3%) |
| $800 to $999 | 303 (12.4%) | 242 (31.0%) |
| $1,000 to $1,499 | 571 (23.4%) | 103 (13.2%) |
| $1,500 to $1,999 | 213 (8.7%) | 14 (1.8%) |
| $2,000 to $2,499 | 62 (2.5%) | 0 (0.0%) |
| $2,500 to $2,999 | 45 (1.8%) | 0 (0.0%) |
| $3,000 or more | 28 (1.1%) | 0 (0.0%) |
| Total | 2,440 (100.0%) | 781 (100.0%) |
Physical Housing Characteristics in Fall River County
Housing Structures in Fall River County
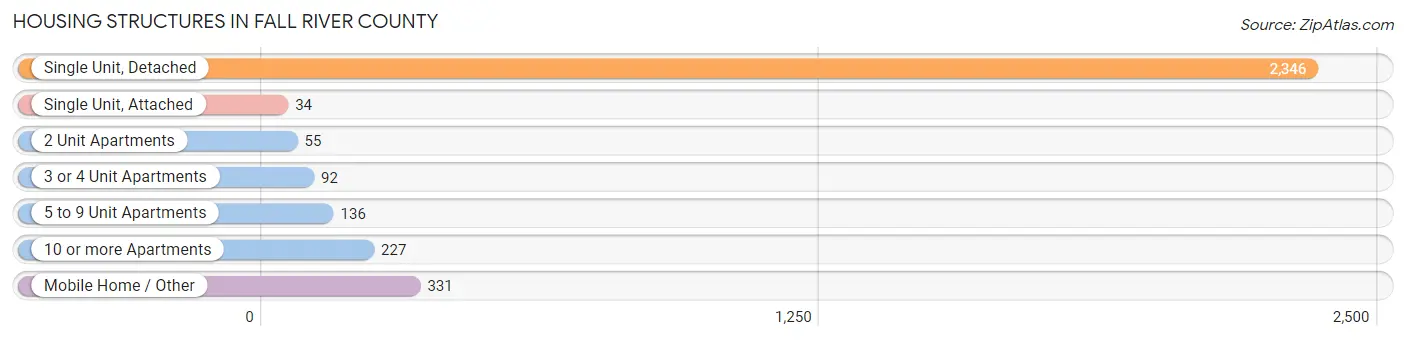
| Structure Type | # Housing Units | % Housing Units |
| Single Unit, Detached | 2,346 | 72.8% |
| Single Unit, Attached | 34 | 1.1% |
| 2 Unit Apartments | 55 | 1.7% |
| 3 or 4 Unit Apartments | 92 | 2.9% |
| 5 to 9 Unit Apartments | 136 | 4.2% |
| 10 or more Apartments | 227 | 7.0% |
| Mobile Home / Other | 331 | 10.3% |
| Total | 3,221 | 100.0% |
Housing Structures by Occupancy in Fall River County
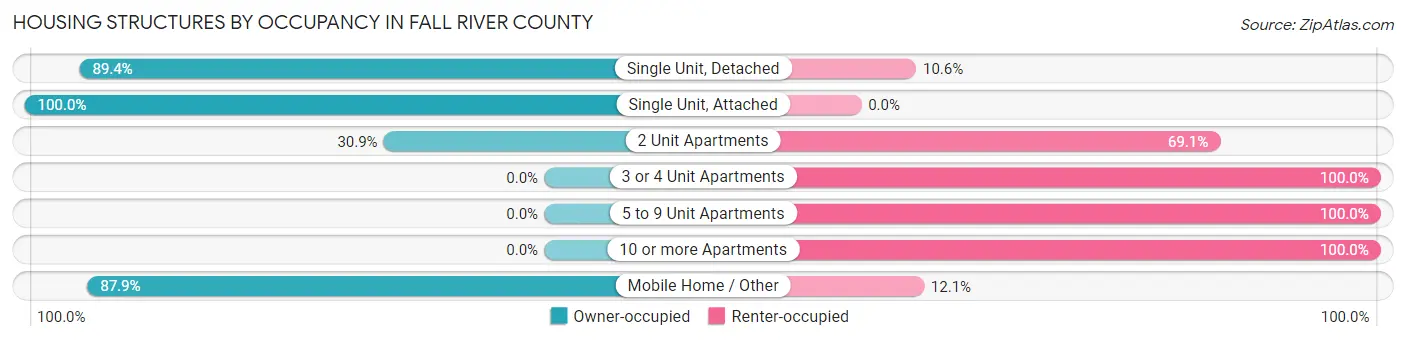
| Structure Type | Owner-occupied | Renter-occupied |
| Single Unit, Detached | 2,098 (89.4%) | 248 (10.6%) |
| Single Unit, Attached | 34 (100.0%) | 0 (0.0%) |
| 2 Unit Apartments | 17 (30.9%) | 38 (69.1%) |
| 3 or 4 Unit Apartments | 0 (0.0%) | 92 (100.0%) |
| 5 to 9 Unit Apartments | 0 (0.0%) | 136 (100.0%) |
| 10 or more Apartments | 0 (0.0%) | 227 (100.0%) |
| Mobile Home / Other | 291 (87.9%) | 40 (12.1%) |
| Total | 2,440 (75.7%) | 781 (24.2%) |
Housing Structures by Number of Rooms in Fall River County
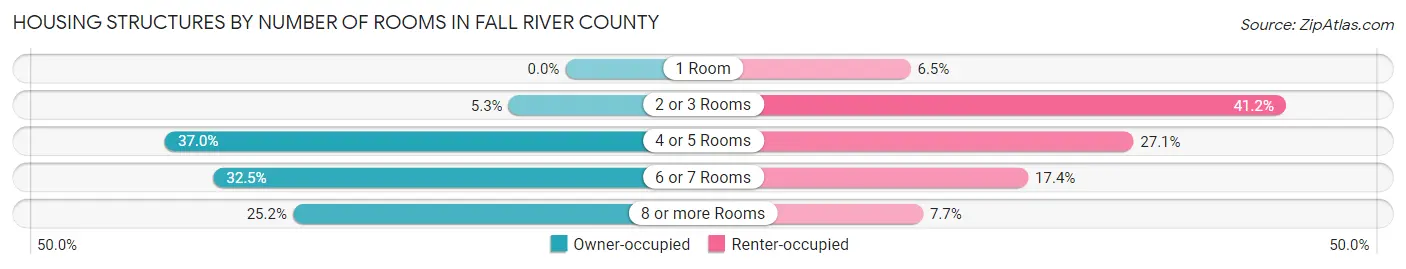
| Number of Rooms | Owner-occupied | Renter-occupied |
| 1 Room | 0 (0.0%) | 51 (6.5%) |
| 2 or 3 Rooms | 128 (5.2%) | 322 (41.2%) |
| 4 or 5 Rooms | 903 (37.0%) | 212 (27.1%) |
| 6 or 7 Rooms | 794 (32.5%) | 136 (17.4%) |
| 8 or more Rooms | 615 (25.2%) | 60 (7.7%) |
| Total | 2,440 (100.0%) | 781 (100.0%) |
Housing Structure by Heating Type in Fall River County
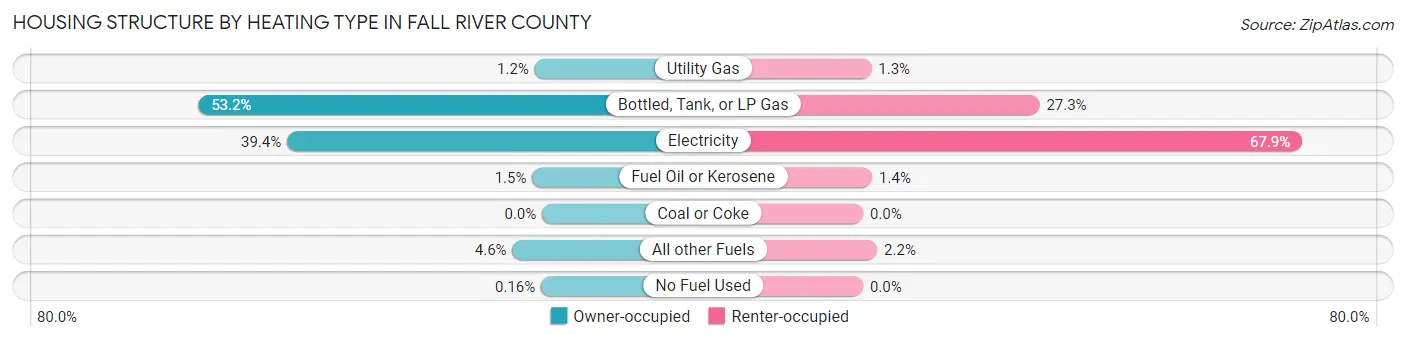
| Heating Type | Owner-occupied | Renter-occupied |
| Utility Gas | 28 (1.1%) | 10 (1.3%) |
| Bottled, Tank, or LP Gas | 1,297 (53.2%) | 213 (27.3%) |
| Electricity | 962 (39.4%) | 530 (67.9%) |
| Fuel Oil or Kerosene | 37 (1.5%) | 11 (1.4%) |
| Coal or Coke | 0 (0.0%) | 0 (0.0%) |
| All other Fuels | 112 (4.6%) | 17 (2.2%) |
| No Fuel Used | 4 (0.2%) | 0 (0.0%) |
| Total | 2,440 (100.0%) | 781 (100.0%) |
Household Vehicle Usage in Fall River County
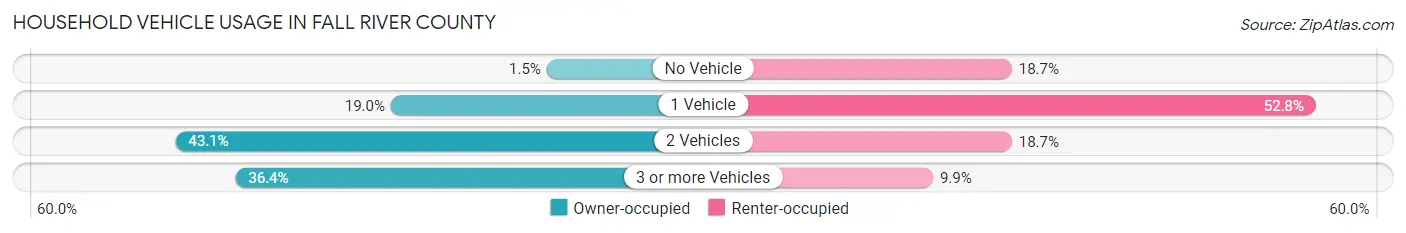
| Vehicles per Household | Owner-occupied | Renter-occupied |
| No Vehicle | 37 (1.5%) | 146 (18.7%) |
| 1 Vehicle | 463 (19.0%) | 412 (52.7%) |
| 2 Vehicles | 1,052 (43.1%) | 146 (18.7%) |
| 3 or more Vehicles | 888 (36.4%) | 77 (9.9%) |
| Total | 2,440 (100.0%) | 781 (100.0%) |
Real Estate & Mortgages in Fall River County
Real Estate and Mortgage Overview in Fall River County
| Characteristic | Without Mortgage | With Mortgage |
| Housing Units | 1,262 | 1,178 |
| Median Property Value | $153,000 | $167,200 |
| Median Household Income | $59,034 | $198 |
| Monthly Housing Costs | $552 | $28 |
| Real Estate Taxes | $1,717 | $7 |
Property Value by Mortgage Status in Fall River County
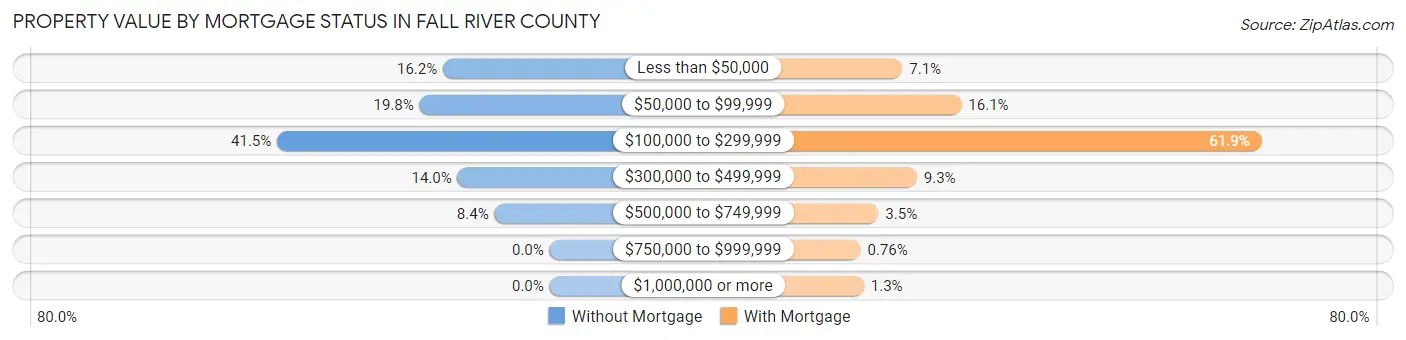
| Property Value | Without Mortgage | With Mortgage |
| Less than $50,000 | 205 (16.2%) | 84 (7.1%) |
| $50,000 to $99,999 | 250 (19.8%) | 190 (16.1%) |
| $100,000 to $299,999 | 524 (41.5%) | 729 (61.9%) |
| $300,000 to $499,999 | 177 (14.0%) | 110 (9.3%) |
| $500,000 to $749,999 | 106 (8.4%) | 41 (3.5%) |
| $750,000 to $999,999 | 0 (0.0%) | 9 (0.8%) |
| $1,000,000 or more | 0 (0.0%) | 15 (1.3%) |
| Total | 1,262 (100.0%) | 1,178 (100.0%) |
Household Income by Mortgage Status in Fall River County
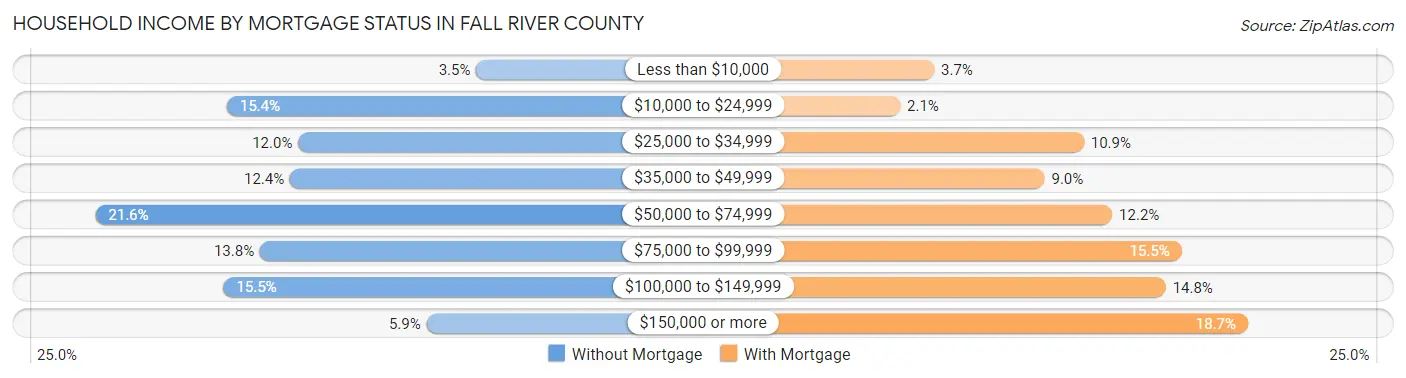
| Household Income | Without Mortgage | With Mortgage |
| Less than $10,000 | 44 (3.5%) | 44 (3.7%) |
| $10,000 to $24,999 | 194 (15.4%) | 25 (2.1%) |
| $25,000 to $34,999 | 151 (12.0%) | 128 (10.9%) |
| $35,000 to $49,999 | 156 (12.4%) | 106 (9.0%) |
| $50,000 to $74,999 | 273 (21.6%) | 144 (12.2%) |
| $75,000 to $99,999 | 174 (13.8%) | 183 (15.5%) |
| $100,000 to $149,999 | 196 (15.5%) | 174 (14.8%) |
| $150,000 or more | 74 (5.9%) | 220 (18.7%) |
| Total | 1,262 (100.0%) | 1,178 (100.0%) |
Property Value to Household Income Ratio in Fall River County
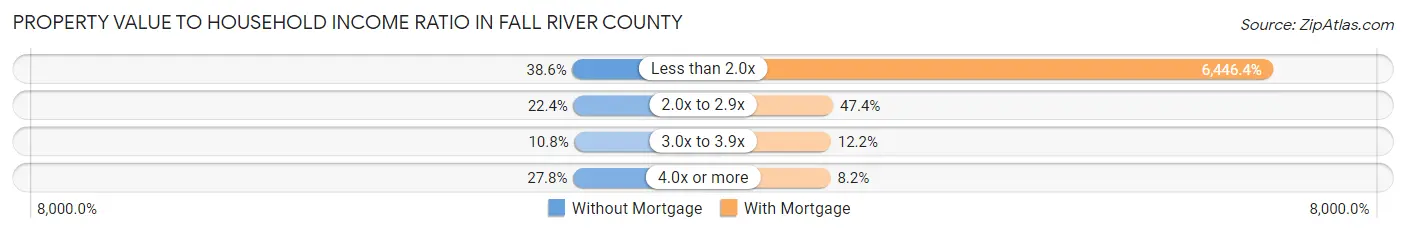
| Value-to-Income Ratio | Without Mortgage | With Mortgage |
| Less than 2.0x | 487 (38.6%) | 75,938 (6,446.3%) |
| 2.0x to 2.9x | 282 (22.4%) | 558 (47.4%) |
| 3.0x to 3.9x | 136 (10.8%) | 144 (12.2%) |
| 4.0x or more | 351 (27.8%) | 97 (8.2%) |
| Total | 1,262 (100.0%) | 1,178 (100.0%) |
Real Estate Taxes by Mortgage Status in Fall River County

| Property Taxes | Without Mortgage | With Mortgage |
| Less than $800 | 212 (16.8%) | 0 (0.0%) |
| $800 to $1,499 | 287 (22.7%) | 45 (3.8%) |
| $800 to $1,499 | 726 (57.5%) | 349 (29.6%) |
| Total | 1,262 (100.0%) | 1,178 (100.0%) |
Health & Disability in Fall River County
Health Insurance Coverage by Age in Fall River County
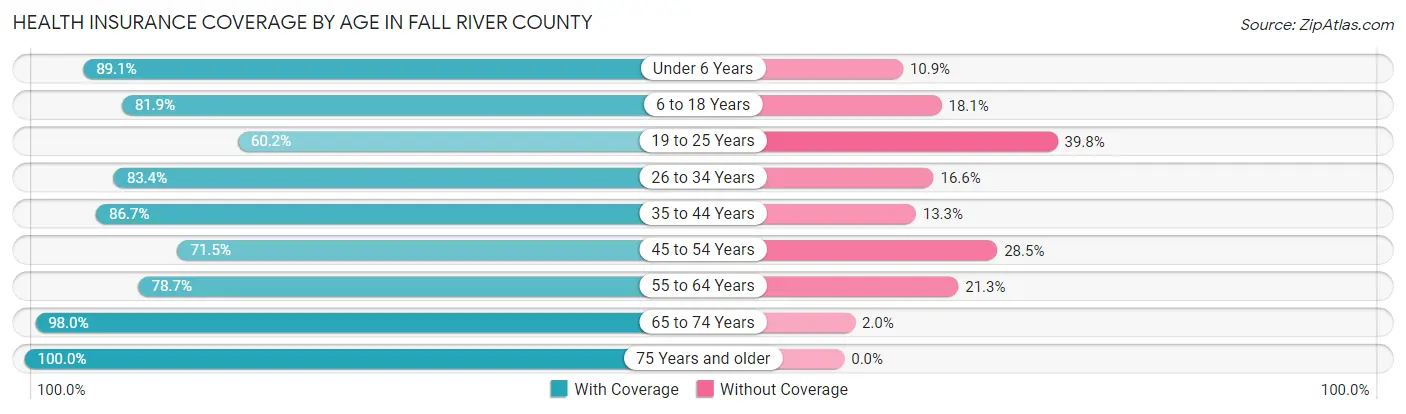
| Age Bracket | With Coverage | Without Coverage |
| Under 6 Years | 342 (89.1%) | 42 (10.9%) |
| 6 to 18 Years | 736 (81.9%) | 163 (18.1%) |
| 19 to 25 Years | 209 (60.2%) | 138 (39.8%) |
| 26 to 34 Years | 546 (83.4%) | 109 (16.6%) |
| 35 to 44 Years | 390 (86.7%) | 60 (13.3%) |
| 45 to 54 Years | 589 (71.5%) | 235 (28.5%) |
| 55 to 64 Years | 989 (78.7%) | 267 (21.3%) |
| 65 to 74 Years | 1,229 (98.0%) | 25 (2.0%) |
| 75 Years and older | 772 (100.0%) | 0 (0.0%) |
| Total | 5,802 (84.8%) | 1,039 (15.2%) |
Health Insurance Coverage by Citizenship Status in Fall River County
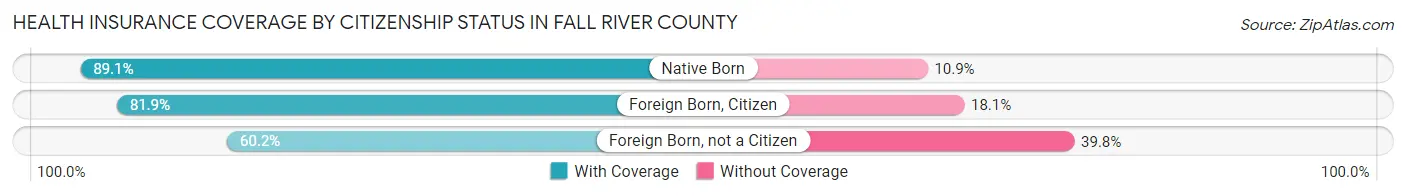
| Citizenship Status | With Coverage | Without Coverage |
| Native Born | 342 (89.1%) | 42 (10.9%) |
| Foreign Born, Citizen | 736 (81.9%) | 163 (18.1%) |
| Foreign Born, not a Citizen | 209 (60.2%) | 138 (39.8%) |
Health Insurance Coverage by Household Income in Fall River County
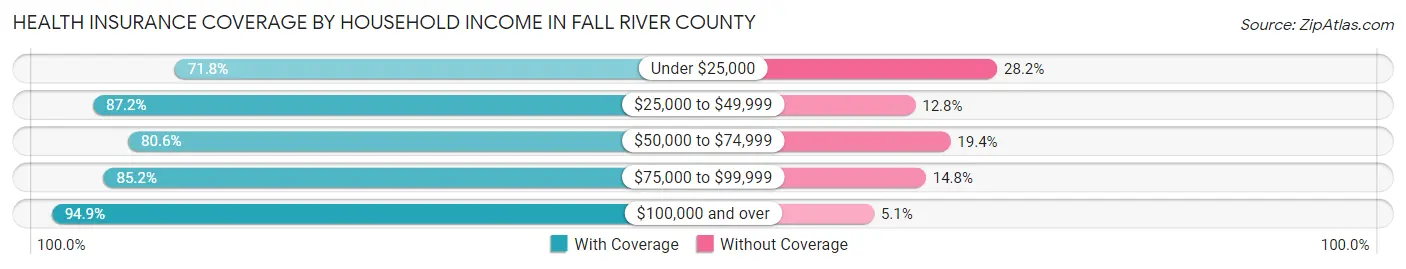
| Household Income | With Coverage | Without Coverage |
| Under $25,000 | 995 (71.8%) | 390 (28.2%) |
| $25,000 to $49,999 | 1,155 (87.2%) | 170 (12.8%) |
| $50,000 to $74,999 | 959 (80.6%) | 231 (19.4%) |
| $75,000 to $99,999 | 858 (85.2%) | 149 (14.8%) |
| $100,000 and over | 1,790 (94.9%) | 96 (5.1%) |
Public vs Private Health Insurance Coverage by Age in Fall River County
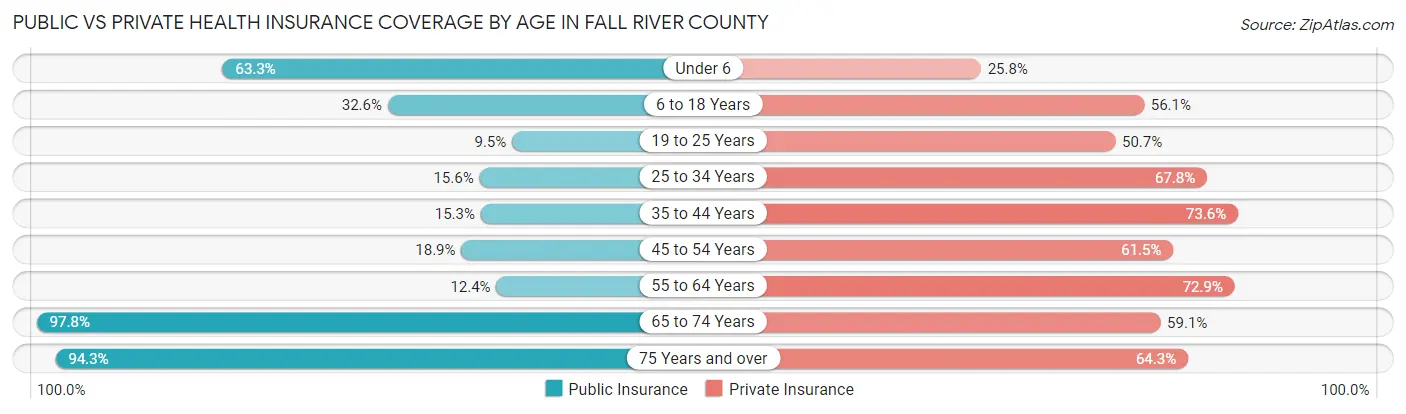
| Age Bracket | Public Insurance | Private Insurance |
| Under 6 | 243 (63.3%) | 99 (25.8%) |
| 6 to 18 Years | 293 (32.6%) | 504 (56.1%) |
| 19 to 25 Years | 33 (9.5%) | 176 (50.7%) |
| 25 to 34 Years | 102 (15.6%) | 444 (67.8%) |
| 35 to 44 Years | 69 (15.3%) | 331 (73.6%) |
| 45 to 54 Years | 156 (18.9%) | 507 (61.5%) |
| 55 to 64 Years | 156 (12.4%) | 916 (72.9%) |
| 65 to 74 Years | 1,226 (97.8%) | 741 (59.1%) |
| 75 Years and over | 728 (94.3%) | 496 (64.2%) |
| Total | 3,006 (43.9%) | 4,214 (61.6%) |
Disability Status by Sex by Age in Fall River County
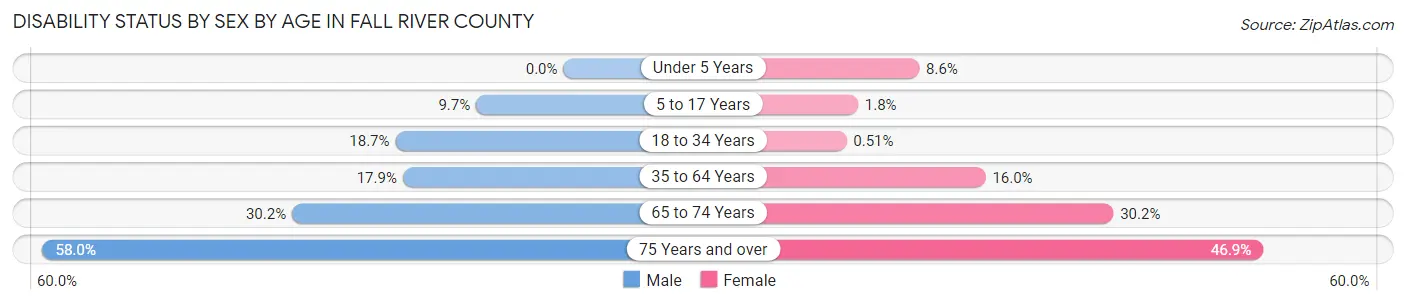
| Age Bracket | Male | Female |
| Under 5 Years | 0 (0.0%) | 13 (8.6%) |
| 5 to 17 Years | 45 (9.7%) | 7 (1.8%) |
| 18 to 34 Years | 96 (18.7%) | 3 (0.5%) |
| 35 to 64 Years | 239 (17.9%) | 191 (16.0%) |
| 65 to 74 Years | 191 (30.2%) | 188 (30.2%) |
| 75 Years and over | 203 (58.0%) | 198 (46.9%) |
Disability Class by Sex by Age in Fall River County
Disability Class: Hearing Difficulty
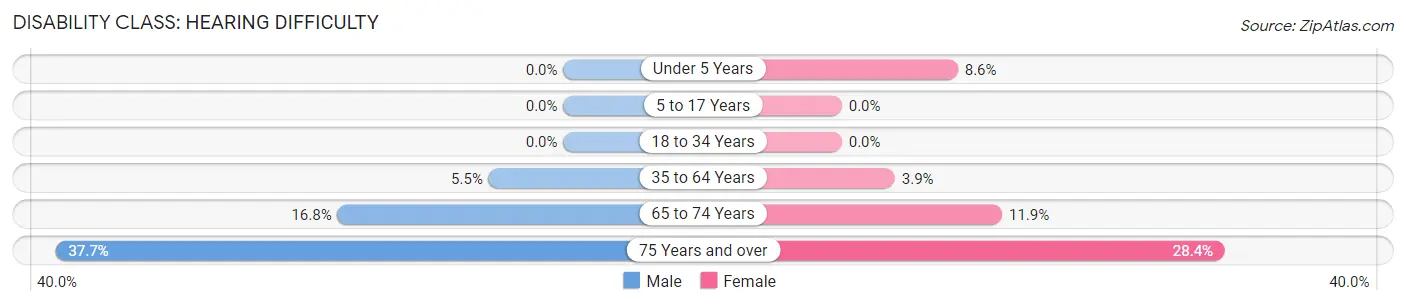
| Age Bracket | Male | Female |
| Under 5 Years | 0 (0.0%) | 13 (8.6%) |
| 5 to 17 Years | 0 (0.0%) | 0 (0.0%) |
| 18 to 34 Years | 0 (0.0%) | 0 (0.0%) |
| 35 to 64 Years | 74 (5.5%) | 47 (3.9%) |
| 65 to 74 Years | 106 (16.8%) | 74 (11.9%) |
| 75 Years and over | 132 (37.7%) | 120 (28.4%) |
Disability Class: Vision Difficulty
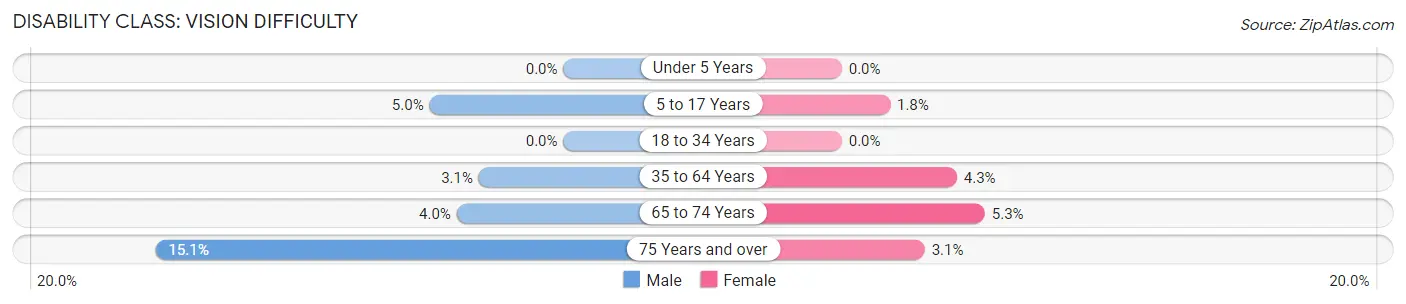
| Age Bracket | Male | Female |
| Under 5 Years | 0 (0.0%) | 0 (0.0%) |
| 5 to 17 Years | 23 (5.0%) | 7 (1.8%) |
| 18 to 34 Years | 0 (0.0%) | 0 (0.0%) |
| 35 to 64 Years | 42 (3.1%) | 51 (4.3%) |
| 65 to 74 Years | 25 (4.0%) | 33 (5.3%) |
| 75 Years and over | 53 (15.1%) | 13 (3.1%) |
Disability Class: Cognitive Difficulty
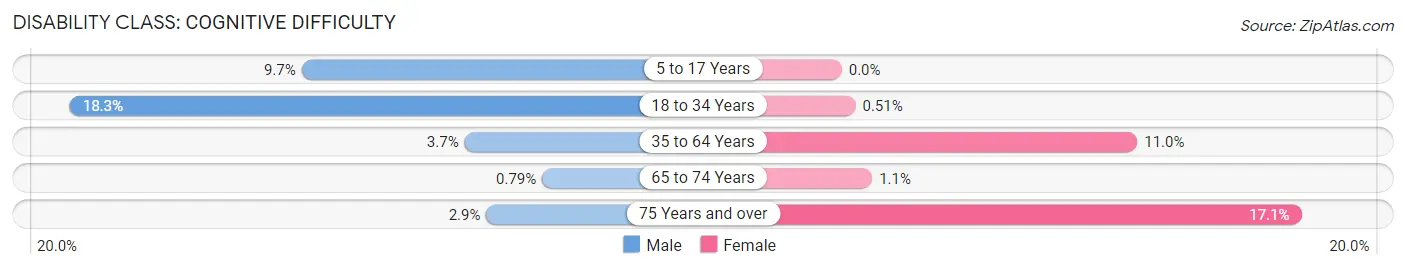
| Age Bracket | Male | Female |
| 5 to 17 Years | 45 (9.7%) | 0 (0.0%) |
| 18 to 34 Years | 94 (18.3%) | 3 (0.5%) |
| 35 to 64 Years | 49 (3.7%) | 131 (11.0%) |
| 65 to 74 Years | 5 (0.8%) | 7 (1.1%) |
| 75 Years and over | 10 (2.9%) | 72 (17.1%) |
Disability Class: Ambulatory Difficulty
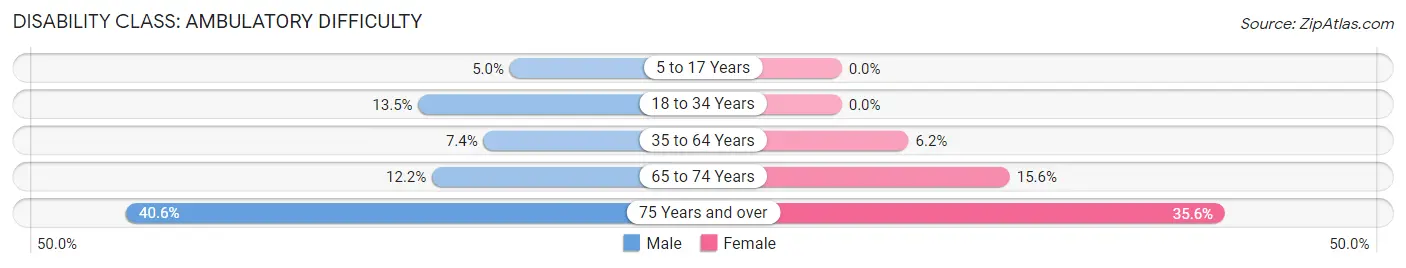
| Age Bracket | Male | Female |
| 5 to 17 Years | 23 (5.0%) | 0 (0.0%) |
| 18 to 34 Years | 69 (13.5%) | 0 (0.0%) |
| 35 to 64 Years | 99 (7.4%) | 74 (6.2%) |
| 65 to 74 Years | 77 (12.2%) | 97 (15.6%) |
| 75 Years and over | 142 (40.6%) | 150 (35.5%) |
Disability Class: Self-Care Difficulty
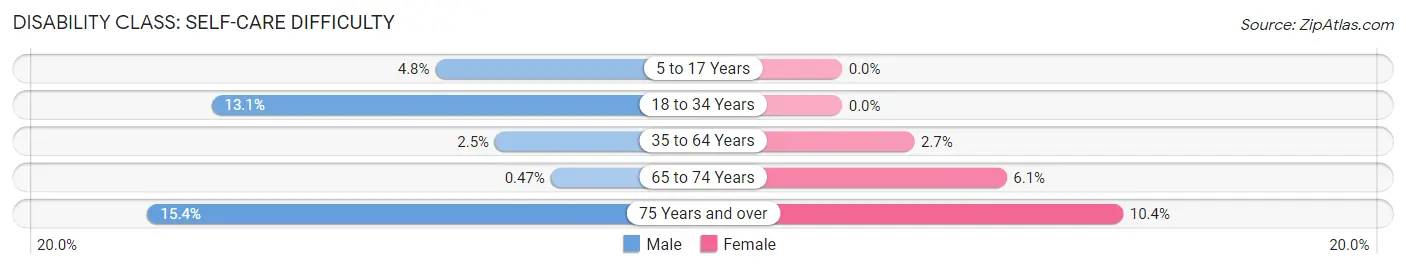
| Age Bracket | Male | Female |
| 5 to 17 Years | 22 (4.8%) | 0 (0.0%) |
| 18 to 34 Years | 67 (13.1%) | 0 (0.0%) |
| 35 to 64 Years | 34 (2.5%) | 32 (2.7%) |
| 65 to 74 Years | 3 (0.5%) | 38 (6.1%) |
| 75 Years and over | 54 (15.4%) | 44 (10.4%) |
Technology Access in Fall River County
Computing Device Access in Fall River County
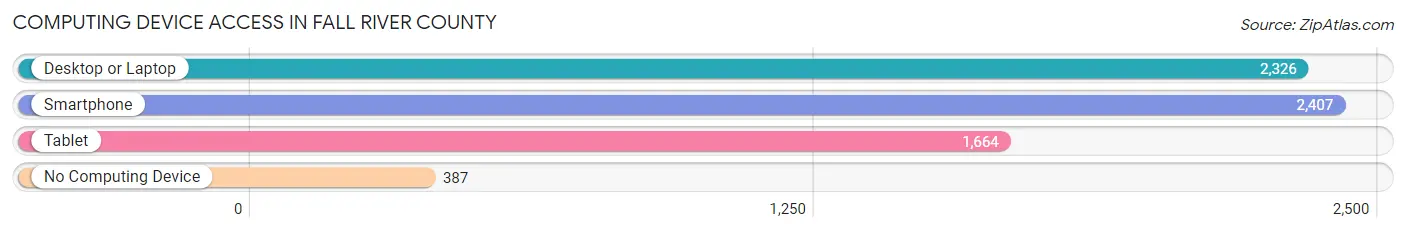
| Device Type | # Households | % Households |
| Desktop or Laptop | 2,326 | 72.2% |
| Smartphone | 2,407 | 74.7% |
| Tablet | 1,664 | 51.7% |
| No Computing Device | 387 | 12.0% |
| Total | 3,221 | 100.0% |
Internet Access in Fall River County
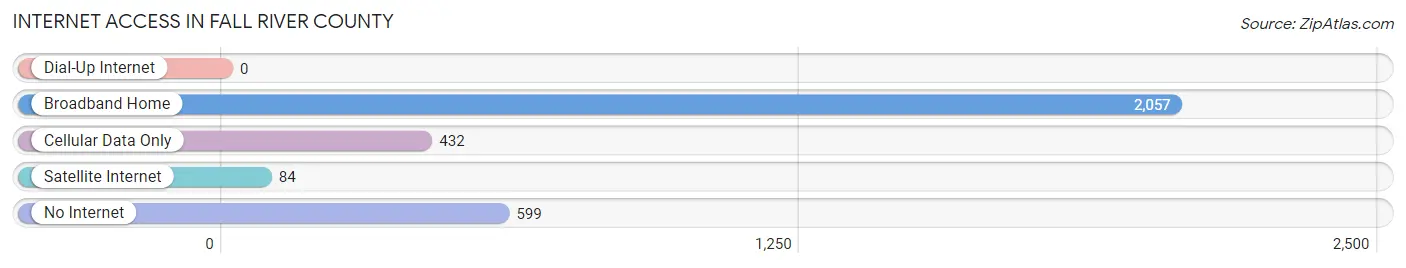
| Internet Type | # Households | % Households |
| Dial-Up Internet | 0 | 0.0% |
| Broadband Home | 2,057 | 63.9% |
| Cellular Data Only | 432 | 13.4% |
| Satellite Internet | 84 | 2.6% |
| No Internet | 599 | 18.6% |
| Total | 3,221 | 100.0% |
Fall River County Summary
Introduction
Fall River County is located in the southwestern corner of South Dakota, and is bordered by Wyoming to the west and Nebraska to the south. The county was established in 1883 and is named after the Fall River, which flows through the county. The county seat is Hot Springs, and the county has a population of 7,094 as of the 2020 census.
Geography
Fall River County is located in the Black Hills region of South Dakota, and is bordered by Wyoming to the west and Nebraska to the south. The county covers an area of 1,845 square miles, and is the fourth largest county in the state. The county is mostly mountainous, with the highest point being Harney Peak at 7,242 feet. The county is home to several lakes, including Angostura Reservoir, Pactola Reservoir, and Sheridan Lake. The county is also home to several state parks, including Angostura Recreation Area, Custer State Park, and Wind Cave National Park.
Climate
Fall River County has a semi-arid climate, with hot summers and cold winters. The average annual temperature is 48°F, and the average annual precipitation is 17.5 inches. The county is prone to severe weather, including thunderstorms, hail, and tornadoes.
Demographics
As of the 2020 census, Fall River County had a population of 7,094. The population is spread out, with 49.3% male and 50.7% female. The median age is 44.7 years, and the median household income is $45,945. The largest racial group is White (93.2%), followed by Native American (3.2%), Asian (1.2%), and Hispanic (1.1%).
Economy
Fall River County has a diverse economy, with the largest industries being tourism, agriculture, and manufacturing. Tourism is the largest industry in the county, with the county being home to several state parks, including Angostura Recreation Area, Custer State Park, and Wind Cave National Park. Agriculture is also a major industry in the county, with the county being home to several farms and ranches. Manufacturing is also a major industry in the county, with the county being home to several manufacturing companies.
Conclusion
Fall River County is located in the southwestern corner of South Dakota, and is bordered by Wyoming to the west and Nebraska to the south. The county has a population of 7,094 as of the 2020 census, and has a semi-arid climate. The county has a diverse economy, with the largest industries being tourism, agriculture, and manufacturing. Fall River County is a great place to live, work, and visit, and is a great place to call home.
Common Questions
What is the Total Population of Fall River County?
Total Population of Fall River County is 7,079.
What is the Total Male Population of Fall River County?
Total Male Population of Fall River County is 3,599.
What is the Total Female Population of Fall River County?
Total Female Population of Fall River County is 3,480.
What is the Ratio of Males per 100 Females in Fall River County?
There are 103.42 Males per 100 Females in Fall River County.
What is the Ratio of Females per 100 Males in Fall River County?
There are 96.69 Females per 100 Males in Fall River County.
What is the Median Population Age in Fall River County?
Median Population Age in Fall River County is 54.7 Years.
What is the Average Family Size in Fall River County
Average Family Size in Fall River County is 2.8 People.
What is the Average Household Size in Fall River County
Average Household Size in Fall River County is 2.1 People.
What is Per Capita Income in Fall River County?
Per Capita income in Fall River County is $33,745.
What is the Median Family Income in Fall River County?
Median Family Income in Fall River County is $70,156.
What is the Median Household income in Fall River County?
Median Household Income in Fall River County is $54,886.
What is Income or Wage Gap in Fall River County?
Income or Wage Gap in Fall River County is 33.7%.
Women in Fall River County earn 66.3 cents for every dollar earned by a man.
What is Family Income Deficit in Fall River County?
Family Income Deficit in Fall River County is $7,865.
Families that are below poverty line in Fall River County earn $7,865 less on average than the poverty threshold level.
What is Inequality or Gini Index in Fall River County?
Inequality or Gini Index in Fall River County is 0.44.
How Large is the Labor Force in Fall River County?
There are 3,055 People in the Labor Forcein in Fall River County.
What is the Percentage of People in the Labor Force in Fall River County?
50.3% of People are in the Labor Force in Fall River County.
What is the Unemployment Rate in Fall River County?
Unemployment Rate in Fall River County is 2.7%.