Day County, SD
Day County Map
Day County Overview
5,485
TOTAL POPULATION
2,821
MALE POPULATION
2,664
FEMALE POPULATION
105.89
MALES / 100 FEMALES
94.43
FEMALES / 100 MALES
47.2
MEDIAN AGE
3.0
AVG FAMILY SIZE
2.3
AVG HOUSEHOLD SIZE
$34,210
PER CAPITA INCOME
$76,583
AVG FAMILY INCOME
$57,558
AVG HOUSEHOLD INCOME
42.9%
WAGE / INCOME GAP [ % ]
57.1¢/ $1
WAGE / INCOME GAP [ $ ]
$11,275
FAMILY INCOME DEFICIT
0.44
INEQUALITY / GINI INDEX
2,552
LABOR FORCE [ PEOPLE ]
57.2%
PERCENT IN LABOR FORCE
2.6%
UNEMPLOYMENT RATE
Day County Area Codes
Race in Day County
The most populous races in Day County are White / Caucasian (4,733 | 86.3%), Native / Alaskan (542 | 9.9%), and Two or more Races (158 | 2.9%).

| Race | # Population | % Population |
| Asian | 4 | 0.1% |
| Black / African American | 7 | 0.1% |
| Hawaiian / Pacific | 0 | 0.0% |
| Hispanic or Latino | 135 | 2.5% |
| Native / Alaskan | 542 | 9.9% |
| White / Caucasian | 4,733 | 86.3% |
| Two or more Races | 158 | 2.9% |
| Some other Race | 41 | 0.7% |
| Total | 5,485 | 100.0% |
Ancestry in Day County
The most populous ancestries reported in Day County are German (2,148 | 39.2%), Norwegian (1,465 | 26.7%), Polish (728 | 13.3%), Irish (230 | 4.2%), and English (227 | 4.1%), together accounting for 87.5% of all Day County residents.

| Ancestry | # Population | % Population |
| African | 33 | 0.6% |
| American | 190 | 3.5% |
| Austrian | 11 | 0.2% |
| British | 21 | 0.4% |
| Central American | 18 | 0.3% |
| Central American Indian | 11 | 0.2% |
| Chippewa | 4 | 0.1% |
| Croatian | 1 | 0.0% |
| Czech | 56 | 1.0% |
| Czechoslovakian | 8 | 0.2% |
| Danish | 52 | 0.9% |
| Dutch | 125 | 2.3% |
| Eastern European | 18 | 0.3% |
| English | 227 | 4.1% |
| European | 22 | 0.4% |
| Finnish | 20 | 0.4% |
| French | 81 | 1.5% |
| French Canadian | 49 | 0.9% |
| German | 2,148 | 39.2% |
| Greek | 21 | 0.4% |
| Guatemalan | 18 | 0.3% |
| Hungarian | 4 | 0.1% |
| Indonesian | 1 | 0.0% |
| Irish | 230 | 4.2% |
| Iroquois | 9 | 0.2% |
| Italian | 13 | 0.2% |
| Menominee | 22 | 0.4% |
| Mexican | 44 | 0.8% |
| Native Hawaiian | 2 | 0.0% |
| Norwegian | 1,465 | 26.7% |
| Pennsylvania German | 7 | 0.1% |
| Polish | 728 | 13.3% |
| Portuguese | 6 | 0.1% |
| Puerto Rican | 73 | 1.3% |
| Puget Sound Salish | 5 | 0.1% |
| Romanian | 20 | 0.4% |
| Russian | 142 | 2.6% |
| Scandinavian | 77 | 1.4% |
| Scotch-Irish | 18 | 0.3% |
| Scottish | 26 | 0.5% |
| Sioux | 210 | 3.8% |
| South African | 19 | 0.4% |
| Subsaharan African | 52 | 0.9% |
| Swedish | 103 | 1.9% |
| Welsh | 18 | 0.3% |
| Yugoslavian | 3 | 0.1% |
| Yuman | 19 | 0.4% | View All 47 Rows |
Immigrants in Day County
The most numerous immigrant groups reported in Day County came from Central America (20 | 0.4%), Latin America (20 | 0.4%), Mexico (20 | 0.4%), Africa (19 | 0.4%), and South Africa (19 | 0.4%), together accounting for 1.8% of all Day County residents.

| Immigration Origin | # Population | % Population |
| Africa | 19 | 0.4% |
| Asia | 1 | 0.0% |
| Central America | 20 | 0.4% |
| Europe | 2 | 0.0% |
| Germany | 2 | 0.0% |
| Latin America | 20 | 0.4% |
| Mexico | 20 | 0.4% |
| South Africa | 19 | 0.4% |
| South Eastern Asia | 1 | 0.0% |
| Thailand | 1 | 0.0% |
| Western Europe | 2 | 0.0% | View All 11 Rows |
Sex and Age in Day County
Sex and Age in Day County
The most populous age groups in Day County are 65 to 69 Years (250 | 8.9%) for men and 55 to 59 Years (225 | 8.5%) for women.

| Age Bracket | Male | Female |
| Under 5 Years | 173 (6.1%) | 150 (5.6%) |
| 5 to 9 Years | 106 (3.8%) | 171 (6.4%) |
| 10 to 14 Years | 225 (8.0%) | 142 (5.3%) |
| 15 to 19 Years | 186 (6.6%) | 210 (7.9%) |
| 20 to 24 Years | 128 (4.5%) | 85 (3.2%) |
| 25 to 29 Years | 131 (4.6%) | 111 (4.2%) |
| 30 to 34 Years | 145 (5.1%) | 143 (5.4%) |
| 35 to 39 Years | 143 (5.1%) | 107 (4.0%) |
| 40 to 44 Years | 168 (6.0%) | 152 (5.7%) |
| 45 to 49 Years | 134 (4.8%) | 97 (3.6%) |
| 50 to 54 Years | 135 (4.8%) | 154 (5.8%) |
| 55 to 59 Years | 221 (7.8%) | 225 (8.5%) |
| 60 to 64 Years | 242 (8.6%) | 171 (6.4%) |
| 65 to 69 Years | 250 (8.9%) | 194 (7.3%) |
| 70 to 74 Years | 162 (5.7%) | 191 (7.2%) |
| 75 to 79 Years | 88 (3.1%) | 120 (4.5%) |
| 80 to 84 Years | 90 (3.2%) | 100 (3.7%) |
| 85 Years and over | 94 (3.3%) | 141 (5.3%) |
| Total | 2,821 (100.0%) | 2,664 (100.0%) |
Families and Households in Day County
Median Family Size in Day County
The median family size in Day County is 2.97 persons per family, with single female/mother families (172 | 12.3%) accounting for the largest median family size of 3.35 persons per family. On the other hand, married-couple families (1,061 | 76.1%) represent the smallest median family size with 2.89 persons per family.

| Family Type | # Families | Family Size |
| Married-Couple | 1,061 (76.1%) | 2.89 |
| Single Male/Father | 161 (11.6%) | 3.03 |
| Single Female/Mother | 172 (12.3%) | 3.35 |
| Total Families | 1,394 (100.0%) | 2.97 |
Median Household Size in Day County
The median household size in Day County is 2.28 persons per household, with single male/father households (161 | 6.9%) accounting for the largest median household size of 3.65 persons per household. non-family households (954 | 40.6%) represent the smallest median household size with 1.13 persons per household.

| Household Type | # Households | Household Size |
| Married-Couple | 1,061 (45.2%) | 2.90 |
| Single Male/Father | 161 (6.9%) | 3.65 |
| Single Female/Mother | 172 (7.3%) | 3.63 |
| Non-family | 954 (40.6%) | 1.13 |
| Total Households | 2,348 (100.0%) | 2.28 |
Household Size by Marriage Status in Day County
Out of a total of 2,348 households in Day County, 1,394 (59.4%) are family households, while 954 (40.6%) are nonfamily households. The most numerous type of family households are 2-person households, comprising 765, and the most common type of nonfamily households are 1-person households, comprising 834.

| Household Size | Family Households | Nonfamily Households |
| 1-Person Households | - | 834 (35.5%) |
| 2-Person Households | 765 (32.6%) | 119 (5.1%) |
| 3-Person Households | 203 (8.6%) | 0 (0.0%) |
| 4-Person Households | 222 (9.5%) | 1 (0.0%) |
| 5-Person Households | 159 (6.8%) | 0 (0.0%) |
| 6-Person Households | 30 (1.3%) | 0 (0.0%) |
| 7+ Person Households | 15 (0.6%) | 0 (0.0%) |
| Total | 1,394 (59.4%) | 954 (40.6%) |
Female Fertility in Day County
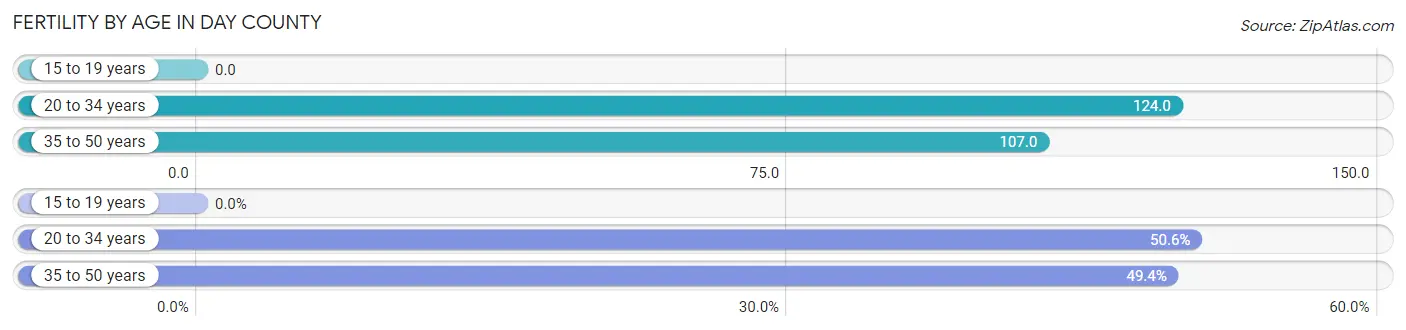
Fertility by Age in Day County
Average fertility rate in Day County is 89.0 births per 1,000 women. Women in the age bracket of 20 to 34 years have the highest fertility rate with 124.0 births per 1,000 women. Women in the age bracket of 20 to 34 years acount for 50.6% of all women with births.
| Age Bracket | Women with Births | Births / 1,000 Women |
| 15 to 19 years | 0 (0.0%) | 0.0 |
| 20 to 34 years | 42 (50.6%) | 124.0 |
| 35 to 50 years | 41 (49.4%) | 107.0 |
| Total | 83 (100.0%) | 89.0 |
Fertility by Age by Marriage Status in Day County
42.2% of women with births (83) in Day County are married. The highest percentage of unmarried women with births falls into 35 to 50 years age bracket with 80.5% of them unmarried at the time of birth, while the lowest percentage of unmarried women with births belong to 20 to 34 years age bracket with 35.7% of them unmarried.

| Age Bracket | Married | Unmarried |
| 15 to 19 years | 0 (0.0%) | 0 (0.0%) |
| 20 to 34 years | 27 (64.3%) | 15 (35.7%) |
| 35 to 50 years | 8 (19.5%) | 33 (80.5%) |
| Total | 35 (42.2%) | 48 (57.8%) |
Fertility by Education in Day County

| Educational Attainment | Women with Births | Births / 1,000 Women |
| Less than High School | 0 (0.0%) | 0.0 |
| High School Diploma | 31 (37.3%) | 123.0 |
| College or Associate's Degree | 37 (44.6%) | 137.0 |
| Bachelor's Degree | 8 (9.6%) | 47.0 |
| Graduate Degree | 7 (8.4%) | 304.0 |
| Total | 83 (100.0%) | 89.0 |
Fertility by Education by Marriage Status in Day County
57.8% of women with births in Day County are unmarried. Women with the educational attainment of bachelor's degree are most likely to be married with 100.0% of them married at childbirth, while women with the educational attainment of college or associate's degree are least likely to be married with 78.4% of them unmarried at childbirth.

| Educational Attainment | Married | Unmarried |
| Less than High School | 0 (0.0%) | 0 (0.0%) |
| High School Diploma | 16 (51.6%) | 15 (48.4%) |
| College or Associate's Degree | 8 (21.6%) | 29 (78.4%) |
| Bachelor's Degree | 8 (100.0%) | 0 (0.0%) |
| Graduate Degree | 3 (42.9%) | 4 (57.1%) |
| Total | 35 (42.2%) | 48 (57.8%) |
Income in Day County
Income Overview in Day County
Per Capita Income in Day County is $34,210, while median incomes of families and households are $76,583 and $57,558 respectively.
| Characteristic | Number | Measure |
| Per Capita Income | 5,485 | $34,210 |
| Median Family Income | 1,394 | $76,583 |
| Mean Family Income | 1,394 | $92,817 |
| Median Household Income | 2,348 | $57,558 |
| Mean Household Income | 2,348 | $78,591 |
| Income Deficit | 1,394 | $11,275 |
| Wage / Income Gap (%) | 5,485 | 42.92% |
| Wage / Income Gap ($) | 5,485 | 57.08¢ per $1 |
| Gini / Inequality Index | 5,485 | 0.44 |
Earnings by Sex in Day County
Average Earnings in Day County are $34,766, $44,566 for men and $25,438 for women, a difference of 42.9%.

| Sex | Number | Average Earnings |
| Male | 1,579 (55.1%) | $44,566 |
| Female | 1,286 (44.9%) | $25,438 |
| Total | 2,865 (100.0%) | $34,766 |
Earnings by Sex by Income Bracket in Day County
The most common earnings brackets in Day County are $100,000+ for men (169 | 10.7%) and $25,000 to $29,999 for women (122 | 9.5%).

| Income | Male | Female |
| $2,499 or less | 130 (8.2%) | 62 (4.8%) |
| $2,500 to $4,999 | 74 (4.7%) | 96 (7.5%) |
| $5,000 to $7,499 | 65 (4.1%) | 88 (6.8%) |
| $7,500 to $9,999 | 31 (2.0%) | 62 (4.8%) |
| $10,000 to $12,499 | 44 (2.8%) | 64 (5.0%) |
| $12,500 to $14,999 | 9 (0.6%) | 40 (3.1%) |
| $15,000 to $17,499 | 19 (1.2%) | 48 (3.7%) |
| $17,500 to $19,999 | 25 (1.6%) | 53 (4.1%) |
| $20,000 to $22,499 | 60 (3.8%) | 70 (5.4%) |
| $22,500 to $24,999 | 22 (1.4%) | 53 (4.1%) |
| $25,000 to $29,999 | 92 (5.8%) | 122 (9.5%) |
| $30,000 to $34,999 | 49 (3.1%) | 62 (4.8%) |
| $35,000 to $39,999 | 56 (3.5%) | 64 (5.0%) |
| $40,000 to $44,999 | 122 (7.7%) | 80 (6.2%) |
| $45,000 to $49,999 | 155 (9.8%) | 56 (4.3%) |
| $50,000 to $54,999 | 64 (4.1%) | 37 (2.9%) |
| $55,000 to $64,999 | 105 (6.7%) | 79 (6.1%) |
| $65,000 to $74,999 | 135 (8.6%) | 82 (6.4%) |
| $75,000 to $99,999 | 153 (9.7%) | 48 (3.7%) |
| $100,000+ | 169 (10.7%) | 20 (1.6%) |
| Total | 1,579 (100.0%) | 1,286 (100.0%) |
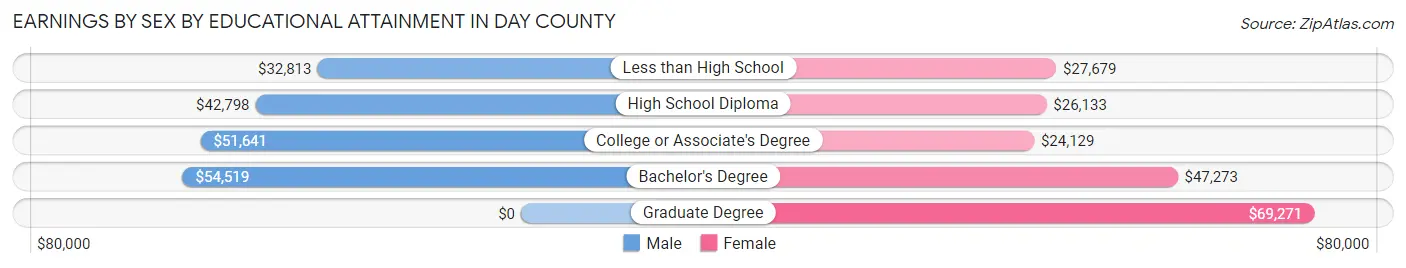
Earnings by Sex by Educational Attainment in Day County
Average earnings in Day County are $46,745 for men and $28,845 for women, a difference of 38.3%. Men with an educational attainment of bachelor's degree enjoy the highest average annual earnings of $54,519, while those with less than high school education earn the least with $32,813. Women with an educational attainment of graduate degree earn the most with the average annual earnings of $69,271, while those with college or associate's degree education have the smallest earnings of $24,129.
| Educational Attainment | Male Income | Female Income |
| Less than High School | $32,813 | $27,679 |
| High School Diploma | $42,798 | $26,133 |
| College or Associate's Degree | $51,641 | $24,129 |
| Bachelor's Degree | $54,519 | $47,273 |
| Graduate Degree | - | - |
| Total | $46,745 | $28,845 |
Family Income in Day County
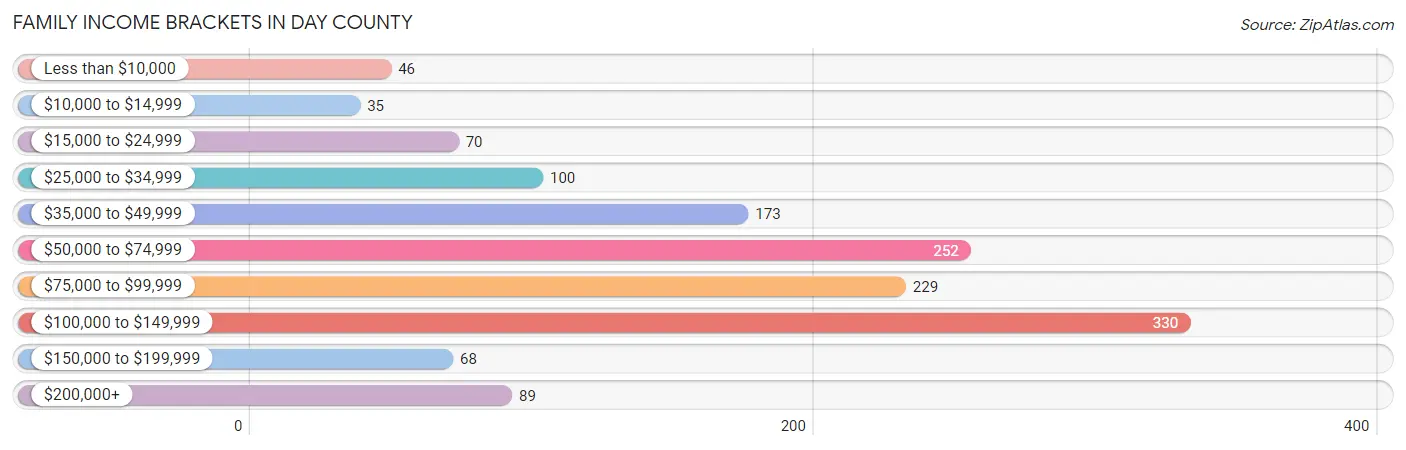
Family Income Brackets in Day County
According to the Day County family income data, there are 330 families falling into the $100,000 to $149,999 income range, which is the most common income bracket and makes up 23.7% of all families. Conversely, the $10,000 to $14,999 income bracket is the least frequent group with only 35 families (2.5%) belonging to this category.
| Income Bracket | # Families | % Families |
| Less than $10,000 | 46 | 3.3% |
| $10,000 to $14,999 | 35 | 2.5% |
| $15,000 to $24,999 | 70 | 5.0% |
| $25,000 to $34,999 | 100 | 7.2% |
| $35,000 to $49,999 | 173 | 12.4% |
| $50,000 to $74,999 | 252 | 18.1% |
| $75,000 to $99,999 | 229 | 16.4% |
| $100,000 to $149,999 | 330 | 23.7% |
| $150,000 to $199,999 | 68 | 4.9% |
| $200,000+ | 89 | 6.4% |
Family Income by Famaliy Size in Day County
5-person families (111 | 8.0%) account for the highest median family income in Day County with $95,893 per family, while 2-person families (787 | 56.5%) have the highest median income of $36,406 per family member.

| Income Bracket | # Families | Median Income |
| 2-Person Families | 787 (56.5%) | $72,813 |
| 3-Person Families | 259 (18.6%) | $76,125 |
| 4-Person Families | 192 (13.8%) | $88,333 |
| 5-Person Families | 111 (8.0%) | $95,893 |
| 6-Person Families | 30 (2.1%) | $0 |
| 7+ Person Families | 15 (1.1%) | $0 |
| Total | 1,394 (100.0%) | $76,583 |
Family Income by Number of Earners in Day County
The median family income in Day County is $76,583, with families comprising 3+ earners (132) having the highest median family income of $116,250, while families with no earners (281) have the lowest median family income of $39,007, accounting for 9.5% and 20.2% of families, respectively.

| Number of Earners | # Families | Median Income |
| No Earners | 281 (20.2%) | $39,007 |
| 1 Earner | 383 (27.5%) | $56,023 |
| 2 Earners | 598 (42.9%) | $91,500 |
| 3+ Earners | 132 (9.5%) | $116,250 |
| Total | 1,394 (100.0%) | $76,583 |
Household Income in Day County
Household Income Brackets in Day County
With 413 households falling in the category, the $50,000 to $74,999 income range is the most frequent in Day County, accounting for 17.6% of all households. In contrast, only 73 households (3.1%) fall into the less than $10,000 income bracket, making it the least populous group.

| Income Bracket | # Households | % Households |
| Less than $10,000 | 73 | 3.1% |
| $10,000 to $14,999 | 167 | 7.1% |
| $15,000 to $24,999 | 169 | 7.2% |
| $25,000 to $34,999 | 225 | 9.6% |
| $35,000 to $49,999 | 399 | 17.0% |
| $50,000 to $74,999 | 413 | 17.6% |
| $75,000 to $99,999 | 310 | 13.2% |
| $100,000 to $149,999 | 385 | 16.4% |
| $150,000 to $199,999 | 106 | 4.5% |
| $200,000+ | 101 | 4.3% |
Household Income by Householder Age in Day County
The median household income in Day County is $57,558, with the highest median household income of $73,047 found in the 45 to 64 years age bracket for the primary householder. A total of 795 households (33.9%) fall into this category. Meanwhile, the 15 to 24 years age bracket for the primary householder has the lowest median household income of $0, with 87 households (3.7%) in this group.
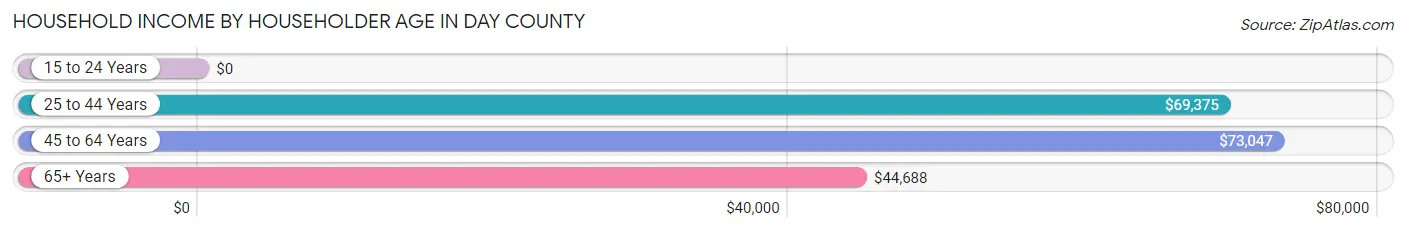
| Income Bracket | # Households | Median Income |
| 15 to 24 Years | 87 (3.7%) | $0 |
| 25 to 44 Years | 570 (24.3%) | $69,375 |
| 45 to 64 Years | 795 (33.9%) | $73,047 |
| 65+ Years | 896 (38.2%) | $44,688 |
| Total | 2,348 (100.0%) | $57,558 |
Poverty in Day County
Income Below Poverty by Sex and Age in Day County
With 12.3% poverty level for males and 17.3% for females among the residents of Day County, 15 year old males and 16 and 17 year old females are the most vulnerable to poverty, with 8 males (44.4%) and 51 females (46.0%) in their respective age groups living below the poverty level.

| Age Bracket | Male | Female |
| Under 5 Years | 53 (30.6%) | 4 (2.7%) |
| 5 Years | 6 (21.4%) | 0 (0.0%) |
| 6 to 11 Years | 24 (13.1%) | 58 (27.2%) |
| 12 to 14 Years | 31 (26.5%) | 14 (17.1%) |
| 15 Years | 8 (44.4%) | 15 (39.5%) |
| 16 and 17 Years | 0 (0.0%) | 51 (46.0%) |
| 18 to 24 Years | 31 (15.8%) | 42 (28.8%) |
| 25 to 34 Years | 23 (8.6%) | 48 (18.9%) |
| 35 to 44 Years | 33 (10.9%) | 29 (11.2%) |
| 45 to 54 Years | 5 (1.9%) | 19 (7.6%) |
| 55 to 64 Years | 81 (17.5%) | 55 (13.9%) |
| 65 to 74 Years | 35 (8.6%) | 48 (13.1%) |
| 75 Years and over | 12 (4.8%) | 64 (21.0%) |
| Total | 342 (12.3%) | 447 (17.3%) |
Income Above Poverty by Sex and Age in Day County
According to the poverty statistics in Day County, males aged 16 and 17 years and females aged 5 years are the age groups that are most secure financially, with 100.0% of males and 100.0% of females in these age groups living above the poverty line.

| Age Bracket | Male | Female |
| Under 5 Years | 120 (69.4%) | 146 (97.3%) |
| 5 Years | 22 (78.6%) | 17 (100.0%) |
| 6 to 11 Years | 159 (86.9%) | 155 (72.8%) |
| 12 to 14 Years | 86 (73.5%) | 68 (82.9%) |
| 15 Years | 10 (55.6%) | 23 (60.5%) |
| 16 and 17 Years | 96 (100.0%) | 60 (54.0%) |
| 18 to 24 Years | 165 (84.2%) | 104 (71.2%) |
| 25 to 34 Years | 244 (91.4%) | 206 (81.1%) |
| 35 to 44 Years | 269 (89.1%) | 230 (88.8%) |
| 45 to 54 Years | 264 (98.1%) | 232 (92.4%) |
| 55 to 64 Years | 382 (82.5%) | 341 (86.1%) |
| 65 to 74 Years | 374 (91.4%) | 319 (86.9%) |
| 75 Years and over | 240 (95.2%) | 241 (79.0%) |
| Total | 2,431 (87.7%) | 2,142 (82.7%) |
Income Below Poverty Among Married-Couple Families in Day County
The poverty statistics for married-couple families in Day County show that 5.7% or 60 of the total 1,061 families live below the poverty line. Families with 5 or more children have the highest poverty rate of 100.0%, comprising of 6 families. On the other hand, families with 3 or 4 children have the lowest poverty rate of 0.0%, which includes 0 families.

| Children | Above Poverty | Below Poverty |
| No Children | 696 (92.9%) | 53 (7.1%) |
| 1 or 2 Children | 195 (99.5%) | 1 (0.5%) |
| 3 or 4 Children | 110 (100.0%) | 0 (0.0%) |
| 5 or more Children | 0 (0.0%) | 6 (100.0%) |
| Total | 1,001 (94.3%) | 60 (5.7%) |
Income Below Poverty Among Single-Parent Households in Day County
According to the poverty data in Day County, 14.9% or 24 single-father households and 32.6% or 56 single-mother households are living below the poverty line. Among single-father households, those with 3 or 4 children have the highest poverty rate, with 6 households (100.0%) experiencing poverty. Likewise, among single-mother households, those with 3 or 4 children have the highest poverty rate, with 33 households (80.5%) falling below the poverty line.

| Children | Single Father | Single Mother |
| No Children | 3 (5.4%) | 5 (8.1%) |
| 1 or 2 Children | 15 (16.7%) | 18 (26.1%) |
| 3 or 4 Children | 6 (100.0%) | 33 (80.5%) |
| 5 or more Children | 0 (0.0%) | 0 (0.0%) |
| Total | 24 (14.9%) | 56 (32.6%) |
Income Below Poverty Among Married-Couple vs Single-Parent Households in Day County
The poverty data for Day County shows that 60 of the married-couple family households (5.7%) and 80 of the single-parent households (24.0%) are living below the poverty level. Within the married-couple family households, those with 5 or more children have the highest poverty rate, with 6 households (100.0%) falling below the poverty line. Among the single-parent households, those with 3 or 4 children have the highest poverty rate, with 39 household (83.0%) living below poverty.

| Children | Married-Couple Families | Single-Parent Households |
| No Children | 53 (7.1%) | 8 (6.8%) |
| 1 or 2 Children | 1 (0.5%) | 33 (20.7%) |
| 3 or 4 Children | 0 (0.0%) | 39 (83.0%) |
| 5 or more Children | 6 (100.0%) | 0 (0.0%) |
| Total | 60 (5.7%) | 80 (24.0%) |
Employment Characteristics in Day County
Employment by Class of Employer in Day County
Among the 2,449 employed individuals in Day County, private company employees (1,372 | 56.0%), self-employed (not incorporated) (309 | 12.6%), and local government employees (188 | 7.7%) make up the most common classes of employment.

| Employer Class | # Employees | % Employees |
| Private Company Employees | 1,372 | 56.0% |
| Self-Employed (Incorporated) | 160 | 6.5% |
| Self-Employed (Not Incorporated) | 309 | 12.6% |
| Not-for-profit Organizations | 147 | 6.0% |
| Local Government Employees | 188 | 7.7% |
| State Government Employees | 111 | 4.5% |
| Federal Government Employees | 128 | 5.2% |
| Unpaid Family Workers | 34 | 1.4% |
| Total | 2,449 | 100.0% |
Employment Status by Age in Day County
According to the labor force statistics for Day County, out of the total population over 16 years of age (4,462), 57.2% or 2,552 individuals are in the labor force, with 2.6% or 66 of them unemployed. The age group with the highest labor force participation rate is 35 to 44 years, with 85.8% or 489 individuals in the labor force. Within the labor force, the 16 to 19 years age range has the highest percentage of unemployed individuals, with 16.8% or 26 of them being unemployed.

| Age Bracket | In Labor Force | Unemployed |
| 16 to 19 Years | 155 (45.6%) | 26 (16.8%) |
| 20 to 24 Years | 149 (70.0%) | 4 (2.7%) |
| 25 to 29 Years | 174 (71.9%) | 3 (1.7%) |
| 30 to 34 Years | 228 (79.2%) | 3 (1.3%) |
| 35 to 44 Years | 489 (85.8%) | 14 (2.9%) |
| 45 to 54 Years | 441 (84.8%) | 0 (0.0%) |
| 55 to 59 Years | 349 (78.3%) | 10 (2.9%) |
| 60 to 64 Years | 265 (64.2%) | 2 (0.8%) |
| 65 to 74 Years | 267 (33.5%) | 5 (1.9%) |
| 75 Years and over | 35 (5.5%) | 0 (0.0%) |
| Total | 2,552 (57.2%) | 66 (2.6%) |
Employment Status by Educational Attainment in Day County
According to labor force statistics for Day County, 78.5% of individuals (1,946) out of the total population between 25 and 64 years of age (2,479) are in the labor force, with 1.6% or 31 of them being unemployed. The group with the highest labor force participation rate are those with the educational attainment of bachelor's degree or higher, with 85.5% or 479 individuals in the labor force. Within the labor force, individuals with high school diploma education have the highest percentage of unemployment, with 3.7% or 24 of them being unemployed.

| Educational Attainment | In Labor Force | Unemployed |
| Less than High School | 110 (66.7%) | 6 (3.6%) |
| High School Diploma | 650 (76.3%) | 32 (3.7%) |
| College / Associate Degree | 707 (78.4%) | 5 (0.6%) |
| Bachelor's Degree or higher | 479 (85.5%) | 0 (0.0%) |
| Total | 1,946 (78.5%) | 40 (1.6%) |
Employment Occupations by Sex in Day County
Management, Business, Science and Arts Occupations
The most common Management, Business, Science and Arts occupations in Day County are Management (444 | 17.9%), Community & Social Service (183 | 7.4%), Health Diagnosing & Treating (132 | 5.3%), Education Instruction & Library (125 | 5.0%), and Health Technologists (113 | 4.5%).

Management, Business, Science and Arts Occupations by Sex
Within the Management, Business, Science and Arts occupations in Day County, the most male-oriented occupations are Computers & Mathematics (100.0%), Arts, Media & Entertainment (100.0%), and Architecture & Engineering (87.7%), while the most female-oriented occupations are Education Instruction & Library (87.2%), Health Diagnosing & Treating (84.9%), and Health Technologists (84.1%).
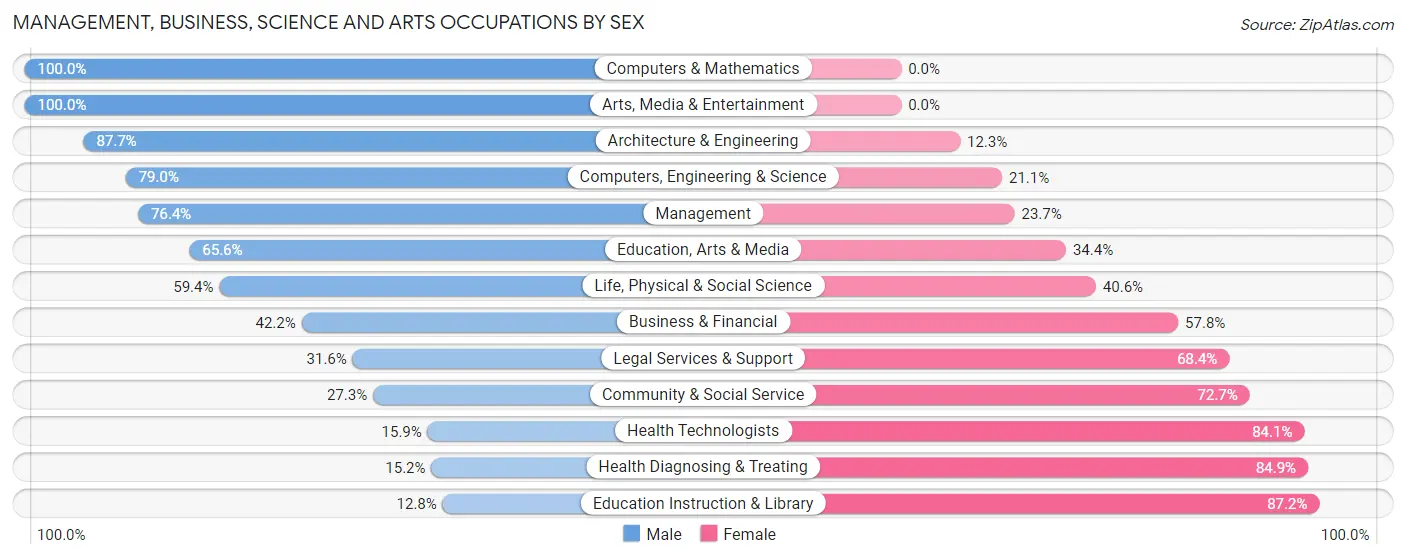
| Occupation | Male | Female |
| Management | 339 (76.3%) | 105 (23.6%) |
| Business & Financial | 38 (42.2%) | 52 (57.8%) |
| Computers, Engineering & Science | 75 (78.9%) | 20 (21.0%) |
| Computers & Mathematics | 6 (100.0%) | 0 (0.0%) |
| Architecture & Engineering | 50 (87.7%) | 7 (12.3%) |
| Life, Physical & Social Science | 19 (59.4%) | 13 (40.6%) |
| Community & Social Service | 50 (27.3%) | 133 (72.7%) |
| Education, Arts & Media | 21 (65.6%) | 11 (34.4%) |
| Legal Services & Support | 6 (31.6%) | 13 (68.4%) |
| Education Instruction & Library | 16 (12.8%) | 109 (87.2%) |
| Arts, Media & Entertainment | 7 (100.0%) | 0 (0.0%) |
| Health Diagnosing & Treating | 20 (15.1%) | 112 (84.9%) |
| Health Technologists | 18 (15.9%) | 95 (84.1%) |
| Total (Category) | 522 (55.3%) | 422 (44.7%) |
| Total (Overall) | 1,396 (56.2%) | 1,089 (43.8%) |
Services Occupations
The most common Services occupations in Day County are Food Preparation & Serving (129 | 5.2%), Cleaning & Maintenance (92 | 3.7%), Healthcare Support (88 | 3.5%), and Personal Care & Service (34 | 1.4%).

Services Occupations by Sex
Within the Services occupations in Day County, the most male-oriented occupations are Cleaning & Maintenance (54.3%), Food Preparation & Serving (25.6%), and Personal Care & Service (14.7%), while the most female-oriented occupations are Healthcare Support (97.7%), Personal Care & Service (85.3%), and Food Preparation & Serving (74.4%).

| Occupation | Male | Female |
| Healthcare Support | 2 (2.3%) | 86 (97.7%) |
| Security & Protection | 0 (0.0%) | 0 (0.0%) |
| Firefighting & Prevention | 0 (0.0%) | 0 (0.0%) |
| Law Enforcement | 0 (0.0%) | 0 (0.0%) |
| Food Preparation & Serving | 33 (25.6%) | 96 (74.4%) |
| Cleaning & Maintenance | 50 (54.3%) | 42 (45.7%) |
| Personal Care & Service | 5 (14.7%) | 29 (85.3%) |
| Total (Category) | 90 (26.2%) | 253 (73.8%) |
| Total (Overall) | 1,396 (56.2%) | 1,089 (43.8%) |
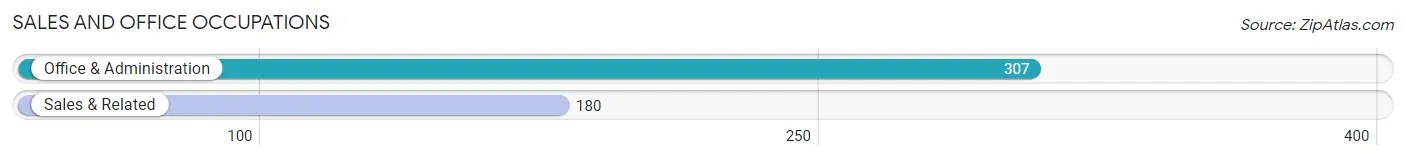
Sales and Office Occupations
The most common Sales and Office occupations in Day County are Office & Administration (307 | 12.3%), and Sales & Related (180 | 7.2%).
Sales and Office Occupations by Sex
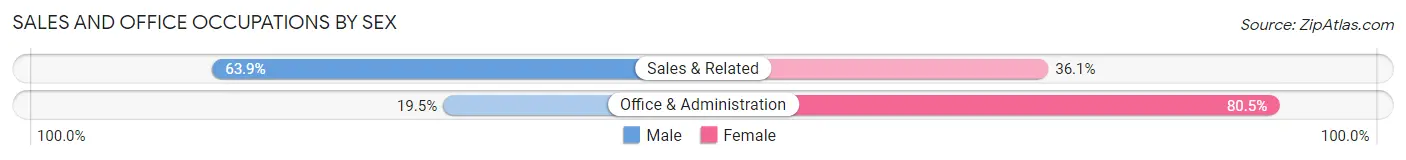
| Occupation | Male | Female |
| Sales & Related | 115 (63.9%) | 65 (36.1%) |
| Office & Administration | 60 (19.5%) | 247 (80.5%) |
| Total (Category) | 175 (35.9%) | 312 (64.1%) |
| Total (Overall) | 1,396 (56.2%) | 1,089 (43.8%) |
Natural Resources, Construction and Maintenance Occupations
The most common Natural Resources, Construction and Maintenance occupations in Day County are Installation, Maintenance & Repair (148 | 6.0%), Construction & Extraction (137 | 5.5%), and Farming, Fishing & Forestry (97 | 3.9%).

Natural Resources, Construction and Maintenance Occupations by Sex

| Occupation | Male | Female |
| Farming, Fishing & Forestry | 89 (91.7%) | 8 (8.3%) |
| Construction & Extraction | 123 (89.8%) | 14 (10.2%) |
| Installation, Maintenance & Repair | 143 (96.6%) | 5 (3.4%) |
| Total (Category) | 355 (92.9%) | 27 (7.1%) |
| Total (Overall) | 1,396 (56.2%) | 1,089 (43.8%) |
Production, Transportation and Moving Occupations
The most common Production, Transportation and Moving occupations in Day County are Production (172 | 6.9%), Transportation (84 | 3.4%), and Material Moving (73 | 2.9%).

Production, Transportation and Moving Occupations by Sex

| Occupation | Male | Female |
| Production | 114 (66.3%) | 58 (33.7%) |
| Transportation | 75 (89.3%) | 9 (10.7%) |
| Material Moving | 65 (89.0%) | 8 (11.0%) |
| Total (Category) | 254 (77.2%) | 75 (22.8%) |
| Total (Overall) | 1,396 (56.2%) | 1,089 (43.8%) |
Employment Industries by Sex in Day County
Employment Industries in Day County
The major employment industries in Day County include Agriculture, Fishing & Hunting (348 | 14.0%), Manufacturing (336 | 13.5%), Health Care & Social Assistance (304 | 12.2%), Retail Trade (230 | 9.3%), and Educational Services (179 | 7.2%).
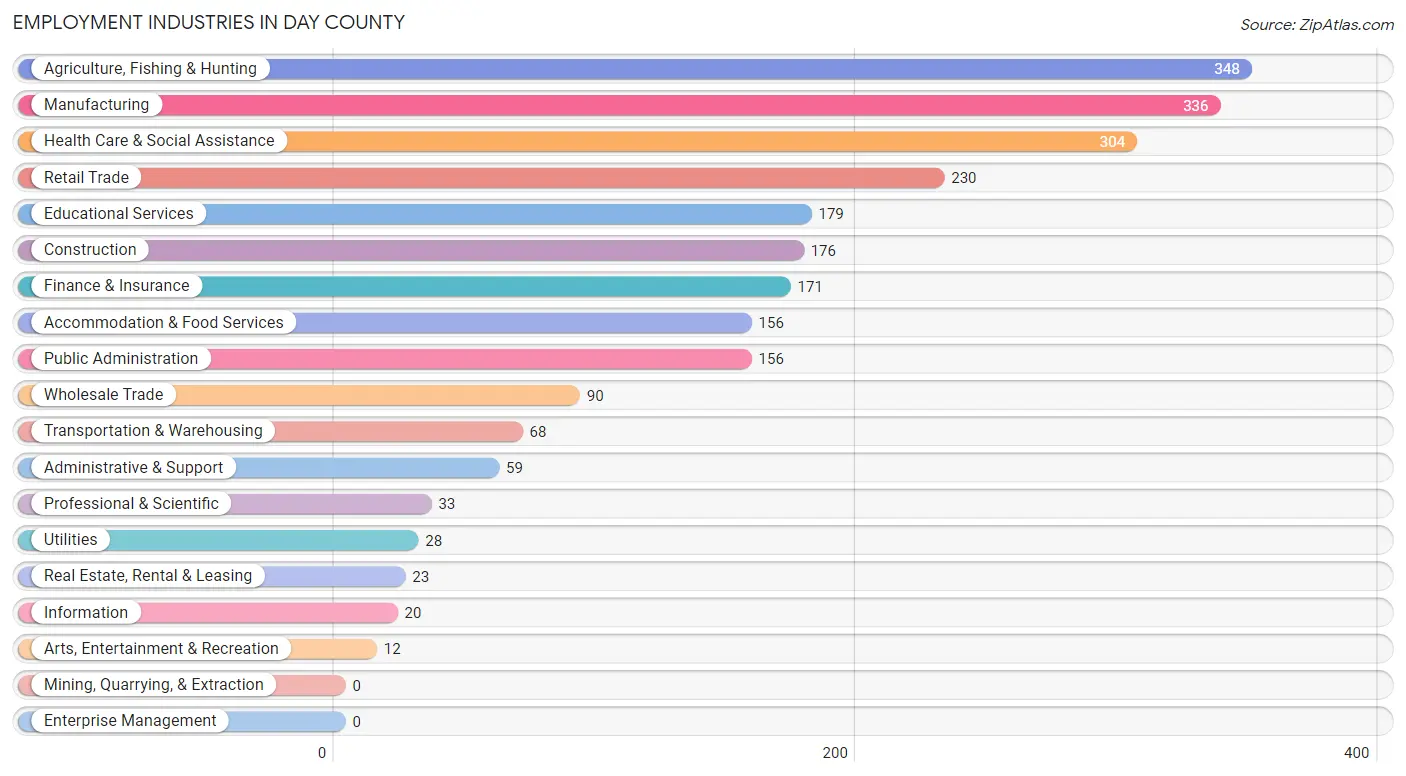
Employment Industries by Sex in Day County
The Day County industries that see more men than women are Utilities (100.0%), Arts, Entertainment & Recreation (100.0%), and Construction (90.3%), whereas the industries that tend to have a higher number of women are Finance & Insurance (86.0%), Health Care & Social Assistance (81.6%), and Educational Services (74.9%).

| Industry | Male | Female |
| Agriculture, Fishing & Hunting | 307 (88.2%) | 41 (11.8%) |
| Mining, Quarrying, & Extraction | 0 (0.0%) | 0 (0.0%) |
| Construction | 159 (90.3%) | 17 (9.7%) |
| Manufacturing | 226 (67.3%) | 110 (32.7%) |
| Wholesale Trade | 79 (87.8%) | 11 (12.2%) |
| Retail Trade | 133 (57.8%) | 97 (42.2%) |
| Transportation & Warehousing | 54 (79.4%) | 14 (20.6%) |
| Utilities | 28 (100.0%) | 0 (0.0%) |
| Information | 16 (80.0%) | 4 (20.0%) |
| Finance & Insurance | 24 (14.0%) | 147 (86.0%) |
| Real Estate, Rental & Leasing | 11 (47.8%) | 12 (52.2%) |
| Professional & Scientific | 16 (48.5%) | 17 (51.5%) |
| Enterprise Management | 0 (0.0%) | 0 (0.0%) |
| Administrative & Support | 16 (27.1%) | 43 (72.9%) |
| Educational Services | 45 (25.1%) | 134 (74.9%) |
| Health Care & Social Assistance | 56 (18.4%) | 248 (81.6%) |
| Arts, Entertainment & Recreation | 12 (100.0%) | 0 (0.0%) |
| Accommodation & Food Services | 61 (39.1%) | 95 (60.9%) |
| Public Administration | 85 (54.5%) | 71 (45.5%) |
| Total | 1,396 (56.2%) | 1,089 (43.8%) |
Education in Day County
School Enrollment in Day County
The most common levels of schooling among the 1,122 students in Day County are high school (324 | 28.9%), middle school (262 | 23.4%), and elementary school (230 | 20.5%).

| School Level | # Students | % Students |
| Nursery / Preschool | 101 | 9.0% |
| Kindergarten | 49 | 4.4% |
| Elementary School | 230 | 20.5% |
| Middle School | 262 | 23.4% |
| High School | 324 | 28.9% |
| College / Undergraduate | 127 | 11.3% |
| Graduate / Professional | 29 | 2.6% |
| Total | 1,122 | 100.0% |
School Enrollment by Age by Funding Source in Day County
Out of a total of 1,122 students who are enrolled in schools in Day County, 79 (7.0%) attend a private institution, while the remaining 1,043 (93.0%) are enrolled in public schools. The age group of 25 to 34 year olds has the highest likelihood of being enrolled in private schools, with 14 (70.0% in the age bracket) enrolled. Conversely, the age group of 15 to 17 year olds has the lowest likelihood of being enrolled in a private school, with 244 (100.0% in the age bracket) attending a public institution.

| Age Bracket | Public School | Private School |
| 3 to 4 Year Olds | 59 (93.6%) | 4 (6.4%) |
| 5 to 9 Year Old | 255 (94.4%) | 15 (5.6%) |
| 10 to 14 Year Olds | 283 (89.0%) | 35 (11.0%) |
| 15 to 17 Year Olds | 244 (100.0%) | 0 (0.0%) |
| 18 to 19 Year Olds | 65 (85.5%) | 11 (14.5%) |
| 20 to 24 Year Olds | 79 (100.0%) | 0 (0.0%) |
| 25 to 34 Year Olds | 6 (30.0%) | 14 (70.0%) |
| 35 Years and over | 52 (100.0%) | 0 (0.0%) |
| Total | 1,043 (93.0%) | 79 (7.0%) |
Educational Attainment by Field of Study in Day County
Education (263 | 27.7%), bio, nature & agricultural (137 | 14.4%), science & technology (117 | 12.3%), business (117 | 12.3%), and liberal arts & history (68 | 7.2%) are the most common fields of study among 948 individuals in Day County who have obtained a bachelor's degree or higher.

| Field of Study | # Graduates | % Graduates |
| Computers & Mathematics | 3 | 0.3% |
| Bio, Nature & Agricultural | 137 | 14.4% |
| Physical & Health Sciences | 15 | 1.6% |
| Psychology | 32 | 3.4% |
| Social Sciences | 49 | 5.2% |
| Engineering | 24 | 2.5% |
| Multidisciplinary Studies | 5 | 0.5% |
| Science & Technology | 117 | 12.3% |
| Business | 117 | 12.3% |
| Education | 263 | 27.7% |
| Literature & Languages | 26 | 2.7% |
| Liberal Arts & History | 68 | 7.2% |
| Visual & Performing Arts | 29 | 3.1% |
| Communications | 11 | 1.2% |
| Arts & Humanities | 52 | 5.5% |
| Total | 948 | 100.0% |
Transportation & Commute in Day County
Vehicle Availability by Sex in Day County
The most prevalent vehicle ownership categories in Day County are males with 2 vehicles (415, accounting for 30.5%) and females with 2 vehicles (350, making up 38.4%).

| Vehicles Available | Male | Female |
| No Vehicle | 25 (1.8%) | 0 (0.0%) |
| 1 Vehicle | 194 (14.2%) | 157 (14.5%) |
| 2 Vehicles | 415 (30.5%) | 350 (32.4%) |
| 3 Vehicles | 336 (24.7%) | 291 (26.9%) |
| 4 Vehicles | 228 (16.8%) | 142 (13.1%) |
| 5 or more Vehicles | 163 (12.0%) | 142 (13.1%) |
| Total | 1,361 (100.0%) | 1,082 (100.0%) |
Commute Time in Day County
The most frequently occuring commute durations in Day County are 5 to 9 minutes (586 commuters, 26.9%), less than 5 minutes (363 commuters, 16.6%), and 15 to 19 minutes (280 commuters, 12.8%).

| Commute Time | # Commuters | % Commuters |
| Less than 5 Minutes | 363 | 16.6% |
| 5 to 9 Minutes | 586 | 26.9% |
| 10 to 14 Minutes | 224 | 10.3% |
| 15 to 19 Minutes | 280 | 12.8% |
| 20 to 24 Minutes | 118 | 5.4% |
| 25 to 29 Minutes | 44 | 2.0% |
| 30 to 34 Minutes | 149 | 6.8% |
| 35 to 39 Minutes | 28 | 1.3% |
| 40 to 44 Minutes | 37 | 1.7% |
| 45 to 59 Minutes | 249 | 11.4% |
| 60 to 89 Minutes | 63 | 2.9% |
| 90 or more Minutes | 41 | 1.9% |
Commute Time by Sex in Day County
The most common commute times in Day County are 5 to 9 minutes (273 commuters, 23.3%) for males and 5 to 9 minutes (313 commuters, 31.0%) for females.

| Commute Time | Male | Female |
| Less than 5 Minutes | 178 (15.2%) | 185 (18.3%) |
| 5 to 9 Minutes | 273 (23.3%) | 313 (31.0%) |
| 10 to 14 Minutes | 130 (11.1%) | 94 (9.3%) |
| 15 to 19 Minutes | 137 (11.7%) | 143 (14.2%) |
| 20 to 24 Minutes | 58 (4.9%) | 60 (5.9%) |
| 25 to 29 Minutes | 29 (2.5%) | 15 (1.5%) |
| 30 to 34 Minutes | 109 (9.3%) | 40 (4.0%) |
| 35 to 39 Minutes | 6 (0.5%) | 22 (2.2%) |
| 40 to 44 Minutes | 14 (1.2%) | 23 (2.3%) |
| 45 to 59 Minutes | 164 (14.0%) | 85 (8.4%) |
| 60 to 89 Minutes | 39 (3.3%) | 24 (2.4%) |
| 90 or more Minutes | 36 (3.1%) | 5 (0.5%) |
Time of Departure to Work by Sex in Day County
The most frequent times of departure to work in Day County are 7:00 AM to 7:29 AM (305, 26.0%) for males and 7:30 AM to 7:59 AM (287, 28.4%) for females.

| Time of Departure | Male | Female |
| 12:00 AM to 4:59 AM | 37 (3.2%) | 15 (1.5%) |
| 5:00 AM to 5:29 AM | 8 (0.7%) | 3 (0.3%) |
| 5:30 AM to 5:59 AM | 61 (5.2%) | 38 (3.8%) |
| 6:00 AM to 6:29 AM | 83 (7.1%) | 70 (6.9%) |
| 6:30 AM to 6:59 AM | 111 (9.5%) | 54 (5.3%) |
| 7:00 AM to 7:29 AM | 305 (26.0%) | 202 (20.0%) |
| 7:30 AM to 7:59 AM | 277 (23.6%) | 287 (28.4%) |
| 8:00 AM to 8:29 AM | 171 (14.6%) | 158 (15.7%) |
| 8:30 AM to 8:59 AM | 18 (1.5%) | 25 (2.5%) |
| 9:00 AM to 9:59 AM | 23 (2.0%) | 21 (2.1%) |
| 10:00 AM to 10:59 AM | 12 (1.0%) | 31 (3.1%) |
| 11:00 AM to 11:59 AM | 10 (0.9%) | 15 (1.5%) |
| 12:00 PM to 3:59 PM | 46 (3.9%) | 52 (5.1%) |
| 4:00 PM to 11:59 PM | 11 (0.9%) | 38 (3.8%) |
| Total | 1,173 (100.0%) | 1,009 (100.0%) |
Housing Occupancy in Day County
Occupancy by Ownership in Day County
Of the total 2,348 dwellings in Day County, owner-occupied units account for 1,757 (74.8%), while renter-occupied units make up 591 (25.2%).

| Occupancy | # Housing Units | % Housing Units |
| Owner Occupied Housing Units | 1,757 | 74.8% |
| Renter-Occupied Housing Units | 591 | 25.2% |
| Total Occupied Housing Units | 2,348 | 100.0% |
Occupancy by Household Size in Day County
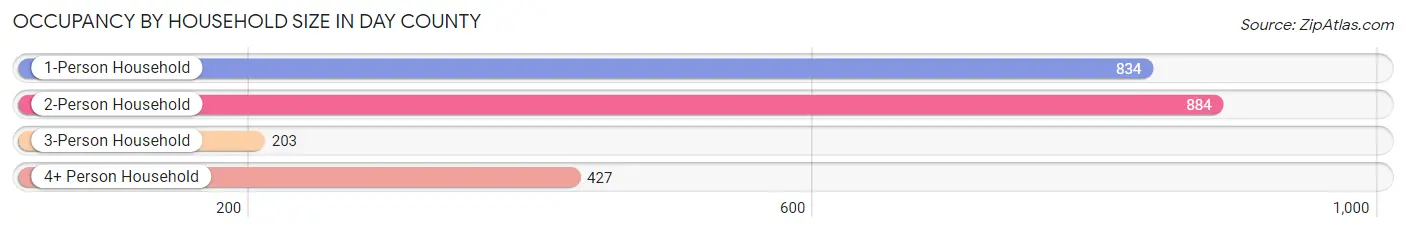
| Household Size | # Housing Units | % Housing Units |
| 1-Person Household | 834 | 35.5% |
| 2-Person Household | 884 | 37.7% |
| 3-Person Household | 203 | 8.6% |
| 4+ Person Household | 427 | 18.2% |
| Total Housing Units | 2,348 | 100.0% |
Occupancy by Ownership by Household Size in Day County

| Household Size | Owner-occupied | Renter-occupied |
| 1-Person Household | 511 (61.3%) | 323 (38.7%) |
| 2-Person Household | 765 (86.5%) | 119 (13.5%) |
| 3-Person Household | 169 (83.3%) | 34 (16.8%) |
| 4+ Person Household | 312 (73.1%) | 115 (26.9%) |
| Total Housing Units | 1,757 (74.8%) | 591 (25.2%) |
Occupancy by Educational Attainment in Day County

| Household Size | Owner-occupied | Renter-occupied |
| Less than High School | 127 (67.9%) | 60 (32.1%) |
| High School Diploma | 545 (67.1%) | 267 (32.9%) |
| College/Associate Degree | 662 (79.4%) | 172 (20.6%) |
| Bachelor's Degree or higher | 423 (82.1%) | 92 (17.9%) |
Occupancy by Age of Householder in Day County

| Age Bracket | # Households | % Households |
| Under 35 Years | 332 | 14.1% |
| 35 to 44 Years | 325 | 13.8% |
| 45 to 54 Years | 229 | 9.8% |
| 55 to 64 Years | 566 | 24.1% |
| 65 to 74 Years | 485 | 20.7% |
| 75 to 84 Years | 254 | 10.8% |
| 85 Years and Over | 157 | 6.7% |
| Total | 2,348 | 100.0% |
Housing Finances in Day County
Median Income by Occupancy in Day County

| Occupancy Type | # Households | Median Income |
| Owner-Occupied | 1,757 (74.8%) | $71,332 |
| Renter-Occupied | 591 (25.2%) | $35,306 |
| Average | 2,348 (100.0%) | $57,558 |
Occupancy by Householder Income Bracket in Day County

| Income Bracket | Owner-occupied | Renter-occupied |
| Less than $5,000 | 0 (0.0%) | 11 (1.9%) |
| $5,000 to $9,999 | 12 (0.7%) | 49 (8.3%) |
| $10,000 to $14,999 | 63 (3.6%) | 103 (17.4%) |
| $15,000 to $19,999 | 75 (4.3%) | 32 (5.4%) |
| $20,000 to $24,999 | 34 (1.9%) | 28 (4.7%) |
| $25,000 to $34,999 | 158 (9.0%) | 67 (11.3%) |
| $35,000 to $49,999 | 239 (13.6%) | 160 (27.1%) |
| $50,000 to $74,999 | 351 (20.0%) | 62 (10.5%) |
| $75,000 to $99,999 | 279 (15.9%) | 32 (5.4%) |
| $100,000 to $149,999 | 344 (19.6%) | 41 (6.9%) |
| $150,000 or more | 202 (11.5%) | 6 (1.0%) |
| Total | 1,757 (100.0%) | 591 (100.0%) |
Monthly Housing Cost Tiers in Day County

| Monthly Cost | Owner-occupied | Renter-occupied |
| Less than $300 | 103 (5.9%) | 94 (15.9%) |
| $300 to $499 | 283 (16.1%) | 89 (15.1%) |
| $500 to $799 | 512 (29.1%) | 150 (25.4%) |
| $800 to $999 | 224 (12.8%) | 47 (8.0%) |
| $1,000 to $1,499 | 365 (20.8%) | 73 (12.3%) |
| $1,500 to $1,999 | 101 (5.8%) | 5 (0.9%) |
| $2,000 to $2,499 | 53 (3.0%) | 0 (0.0%) |
| $2,500 to $2,999 | 80 (4.5%) | 0 (0.0%) |
| $3,000 or more | 36 (2.1%) | 1 (0.2%) |
| Total | 1,757 (100.0%) | 591 (100.0%) |
Physical Housing Characteristics in Day County
Housing Structures in Day County

| Structure Type | # Housing Units | % Housing Units |
| Single Unit, Detached | 2,022 | 86.1% |
| Single Unit, Attached | 4 | 0.2% |
| 2 Unit Apartments | 7 | 0.3% |
| 3 or 4 Unit Apartments | 91 | 3.9% |
| 5 to 9 Unit Apartments | 58 | 2.5% |
| 10 or more Apartments | 92 | 3.9% |
| Mobile Home / Other | 74 | 3.2% |
| Total | 2,348 | 100.0% |
Housing Structures by Occupancy in Day County
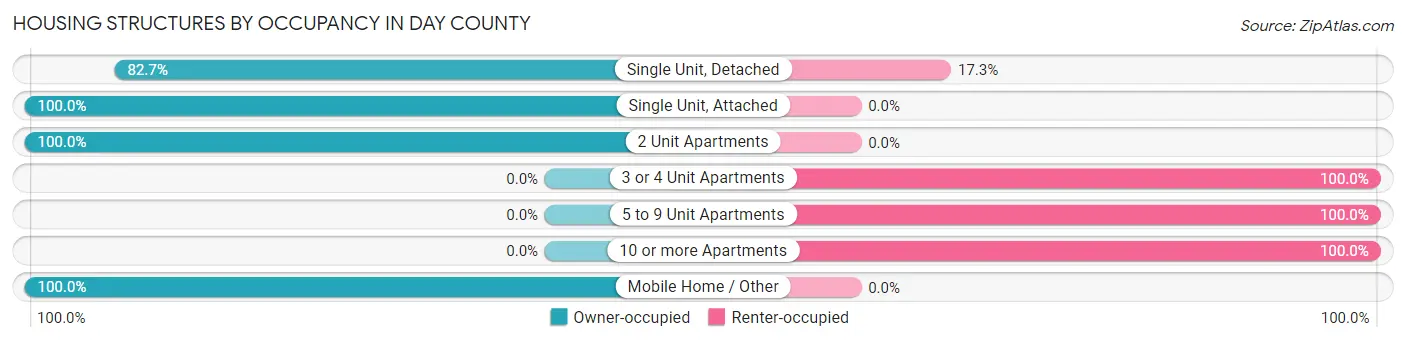
| Structure Type | Owner-occupied | Renter-occupied |
| Single Unit, Detached | 1,672 (82.7%) | 350 (17.3%) |
| Single Unit, Attached | 4 (100.0%) | 0 (0.0%) |
| 2 Unit Apartments | 7 (100.0%) | 0 (0.0%) |
| 3 or 4 Unit Apartments | 0 (0.0%) | 91 (100.0%) |
| 5 to 9 Unit Apartments | 0 (0.0%) | 58 (100.0%) |
| 10 or more Apartments | 0 (0.0%) | 92 (100.0%) |
| Mobile Home / Other | 74 (100.0%) | 0 (0.0%) |
| Total | 1,757 (74.8%) | 591 (25.2%) |
Housing Structures by Number of Rooms in Day County

| Number of Rooms | Owner-occupied | Renter-occupied |
| 1 Room | 0 (0.0%) | 1 (0.2%) |
| 2 or 3 Rooms | 34 (1.9%) | 138 (23.4%) |
| 4 or 5 Rooms | 464 (26.4%) | 250 (42.3%) |
| 6 or 7 Rooms | 555 (31.6%) | 92 (15.6%) |
| 8 or more Rooms | 704 (40.1%) | 110 (18.6%) |
| Total | 1,757 (100.0%) | 591 (100.0%) |
Housing Structure by Heating Type in Day County

| Heating Type | Owner-occupied | Renter-occupied |
| Utility Gas | 447 (25.4%) | 97 (16.4%) |
| Bottled, Tank, or LP Gas | 601 (34.2%) | 124 (21.0%) |
| Electricity | 570 (32.4%) | 298 (50.4%) |
| Fuel Oil or Kerosene | 77 (4.4%) | 39 (6.6%) |
| Coal or Coke | 0 (0.0%) | 0 (0.0%) |
| All other Fuels | 44 (2.5%) | 33 (5.6%) |
| No Fuel Used | 18 (1.0%) | 0 (0.0%) |
| Total | 1,757 (100.0%) | 591 (100.0%) |
Household Vehicle Usage in Day County

| Vehicles per Household | Owner-occupied | Renter-occupied |
| No Vehicle | 7 (0.4%) | 87 (14.7%) |
| 1 Vehicle | 320 (18.2%) | 264 (44.7%) |
| 2 Vehicles | 646 (36.8%) | 175 (29.6%) |
| 3 or more Vehicles | 784 (44.6%) | 65 (11.0%) |
| Total | 1,757 (100.0%) | 591 (100.0%) |
Real Estate & Mortgages in Day County
Real Estate and Mortgage Overview in Day County
| Characteristic | Without Mortgage | With Mortgage |
| Housing Units | 995 | 762 |
| Median Property Value | $114,100 | $172,900 |
| Median Household Income | $56,450 | $103 |
| Monthly Housing Costs | $558 | $36 |
| Real Estate Taxes | $1,398 | $8 |
Property Value by Mortgage Status in Day County

| Property Value | Without Mortgage | With Mortgage |
| Less than $50,000 | 162 (16.3%) | 50 (6.6%) |
| $50,000 to $99,999 | 245 (24.6%) | 181 (23.7%) |
| $100,000 to $299,999 | 425 (42.7%) | 350 (45.9%) |
| $300,000 to $499,999 | 79 (7.9%) | 75 (9.8%) |
| $500,000 to $749,999 | 38 (3.8%) | 50 (6.6%) |
| $750,000 to $999,999 | 5 (0.5%) | 24 (3.2%) |
| $1,000,000 or more | 41 (4.1%) | 32 (4.2%) |
| Total | 995 (100.0%) | 762 (100.0%) |
Household Income by Mortgage Status in Day County
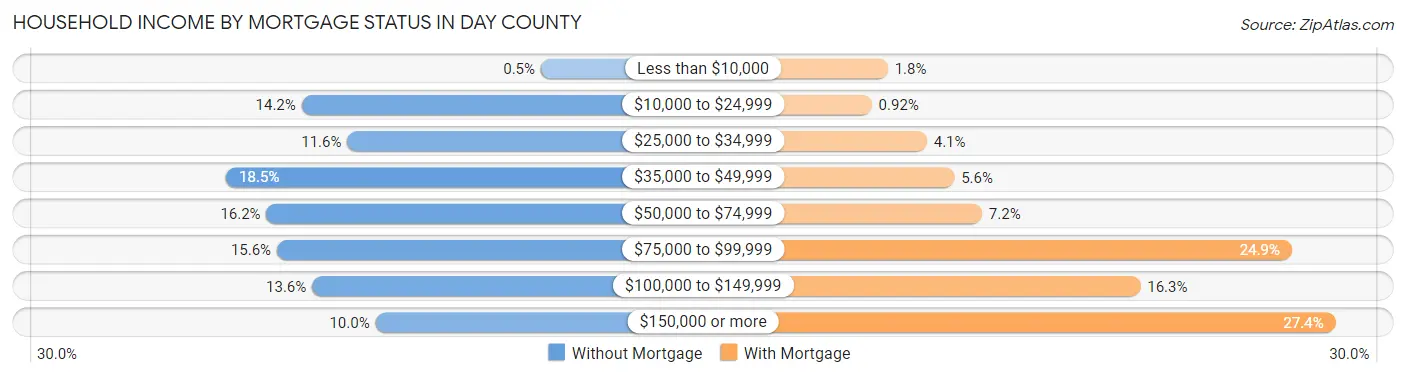
| Household Income | Without Mortgage | With Mortgage |
| Less than $10,000 | 5 (0.5%) | 14 (1.8%) |
| $10,000 to $24,999 | 141 (14.2%) | 7 (0.9%) |
| $25,000 to $34,999 | 115 (11.6%) | 31 (4.1%) |
| $35,000 to $49,999 | 184 (18.5%) | 43 (5.6%) |
| $50,000 to $74,999 | 161 (16.2%) | 55 (7.2%) |
| $75,000 to $99,999 | 155 (15.6%) | 190 (24.9%) |
| $100,000 to $149,999 | 135 (13.6%) | 124 (16.3%) |
| $150,000 or more | 99 (10.0%) | 209 (27.4%) |
| Total | 995 (100.0%) | 762 (100.0%) |
Property Value to Household Income Ratio in Day County
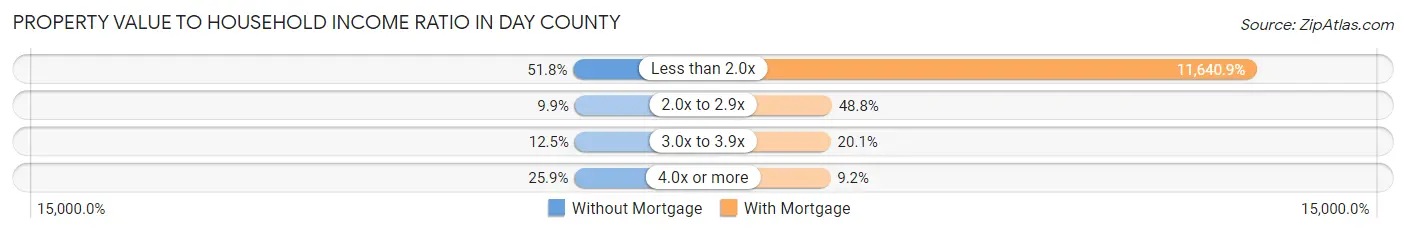
| Value-to-Income Ratio | Without Mortgage | With Mortgage |
| Less than 2.0x | 515 (51.8%) | 88,704 (11,640.9%) |
| 2.0x to 2.9x | 98 (9.9%) | 372 (48.8%) |
| 3.0x to 3.9x | 124 (12.5%) | 153 (20.1%) |
| 4.0x or more | 258 (25.9%) | 70 (9.2%) |
| Total | 995 (100.0%) | 762 (100.0%) |
Real Estate Taxes by Mortgage Status in Day County

| Property Taxes | Without Mortgage | With Mortgage |
| Less than $800 | 214 (21.5%) | 0 (0.0%) |
| $800 to $1,499 | 302 (30.3%) | 120 (15.8%) |
| $800 to $1,499 | 439 (44.1%) | 230 (30.2%) |
| Total | 995 (100.0%) | 762 (100.0%) |
Health & Disability in Day County
Health Insurance Coverage by Age in Day County

| Age Bracket | With Coverage | Without Coverage |
| Under 6 Years | 354 (96.2%) | 14 (3.8%) |
| 6 to 18 Years | 866 (94.0%) | 55 (6.0%) |
| 19 to 25 Years | 301 (89.6%) | 35 (10.4%) |
| 26 to 34 Years | 391 (83.6%) | 77 (16.5%) |
| 35 to 44 Years | 458 (81.6%) | 103 (18.4%) |
| 45 to 54 Years | 449 (86.4%) | 71 (13.7%) |
| 55 to 64 Years | 777 (90.4%) | 82 (9.6%) |
| 65 to 74 Years | 771 (99.4%) | 5 (0.6%) |
| 75 Years and older | 557 (100.0%) | 0 (0.0%) |
| Total | 4,924 (91.8%) | 442 (8.2%) |
Health Insurance Coverage by Citizenship Status in Day County

| Citizenship Status | With Coverage | Without Coverage |
| Native Born | 354 (96.2%) | 14 (3.8%) |
| Foreign Born, Citizen | 866 (94.0%) | 55 (6.0%) |
| Foreign Born, not a Citizen | 301 (89.6%) | 35 (10.4%) |
Health Insurance Coverage by Household Income in Day County

| Household Income | With Coverage | Without Coverage |
| Under $25,000 | 531 (79.8%) | 134 (20.2%) |
| $25,000 to $49,999 | 1,079 (91.5%) | 100 (8.5%) |
| $50,000 to $74,999 | 890 (90.0%) | 99 (10.0%) |
| $75,000 to $99,999 | 766 (98.3%) | 13 (1.7%) |
| $100,000 and over | 1,652 (94.5%) | 96 (5.5%) |
Public vs Private Health Insurance Coverage by Age in Day County

| Age Bracket | Public Insurance | Private Insurance |
| Under 6 | 164 (44.6%) | 196 (53.3%) |
| 6 to 18 Years | 296 (32.1%) | 583 (63.3%) |
| 19 to 25 Years | 61 (18.1%) | 258 (76.8%) |
| 25 to 34 Years | 74 (15.8%) | 325 (69.4%) |
| 35 to 44 Years | 35 (6.2%) | 425 (75.8%) |
| 45 to 54 Years | 29 (5.6%) | 437 (84.0%) |
| 55 to 64 Years | 146 (17.0%) | 678 (78.9%) |
| 65 to 74 Years | 743 (95.8%) | 321 (41.4%) |
| 75 Years and over | 557 (100.0%) | 323 (58.0%) |
| Total | 2,105 (39.2%) | 3,546 (66.1%) |
Disability Status by Sex by Age in Day County

| Age Bracket | Male | Female |
| Under 5 Years | 0 (0.0%) | 0 (0.0%) |
| 5 to 17 Years | 17 (3.8%) | 14 (3.0%) |
| 18 to 34 Years | 29 (6.3%) | 19 (4.8%) |
| 35 to 64 Years | 112 (10.8%) | 72 (8.0%) |
| 65 to 74 Years | 126 (30.8%) | 92 (25.1%) |
| 75 Years and over | 116 (46.0%) | 128 (42.0%) |
Disability Class by Sex by Age in Day County
Disability Class: Hearing Difficulty

| Age Bracket | Male | Female |
| Under 5 Years | 0 (0.0%) | 0 (0.0%) |
| 5 to 17 Years | 0 (0.0%) | 8 (1.7%) |
| 18 to 34 Years | 5 (1.1%) | 0 (0.0%) |
| 35 to 64 Years | 50 (4.8%) | 2 (0.2%) |
| 65 to 74 Years | 32 (7.8%) | 43 (11.7%) |
| 75 Years and over | 84 (33.3%) | 44 (14.4%) |
Disability Class: Vision Difficulty

| Age Bracket | Male | Female |
| Under 5 Years | 0 (0.0%) | 0 (0.0%) |
| 5 to 17 Years | 0 (0.0%) | 0 (0.0%) |
| 18 to 34 Years | 0 (0.0%) | 5 (1.3%) |
| 35 to 64 Years | 28 (2.7%) | 14 (1.5%) |
| 65 to 74 Years | 4 (1.0%) | 4 (1.1%) |
| 75 Years and over | 12 (4.8%) | 16 (5.2%) |
Disability Class: Cognitive Difficulty

| Age Bracket | Male | Female |
| 5 to 17 Years | 17 (3.8%) | 13 (2.8%) |
| 18 to 34 Years | 29 (6.3%) | 17 (4.3%) |
| 35 to 64 Years | 17 (1.6%) | 21 (2.3%) |
| 65 to 74 Years | 23 (5.6%) | 0 (0.0%) |
| 75 Years and over | 13 (5.2%) | 12 (3.9%) |
Disability Class: Ambulatory Difficulty

| Age Bracket | Male | Female |
| 5 to 17 Years | 0 (0.0%) | 0 (0.0%) |
| 18 to 34 Years | 0 (0.0%) | 0 (0.0%) |
| 35 to 64 Years | 17 (1.6%) | 41 (4.5%) |
| 65 to 74 Years | 90 (22.0%) | 69 (18.8%) |
| 75 Years and over | 41 (16.3%) | 116 (38.0%) |
Disability Class: Self-Care Difficulty

| Age Bracket | Male | Female |
| 5 to 17 Years | 3 (0.7%) | 0 (0.0%) |
| 18 to 34 Years | 0 (0.0%) | 7 (1.8%) |
| 35 to 64 Years | 0 (0.0%) | 3 (0.3%) |
| 65 to 74 Years | 15 (3.7%) | 0 (0.0%) |
| 75 Years and over | 14 (5.6%) | 14 (4.6%) |
Technology Access in Day County
Computing Device Access in Day County
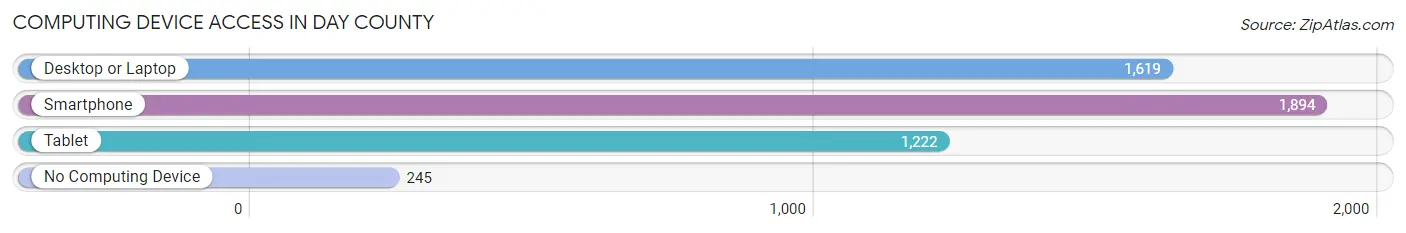
| Device Type | # Households | % Households |
| Desktop or Laptop | 1,619 | 69.0% |
| Smartphone | 1,894 | 80.7% |
| Tablet | 1,222 | 52.0% |
| No Computing Device | 245 | 10.4% |
| Total | 2,348 | 100.0% |
Internet Access in Day County

| Internet Type | # Households | % Households |
| Dial-Up Internet | 1 | 0.0% |
| Broadband Home | 1,525 | 64.9% |
| Cellular Data Only | 295 | 12.6% |
| Satellite Internet | 126 | 5.4% |
| No Internet | 467 | 19.9% |
| Total | 2,348 | 100.0% |
Day County Summary
Day County is located in the northeastern corner of South Dakota, and is bordered by Roberts County to the north, Marshall County to the east, Deuel County to the south, and Grant County to the west. The county seat is Webster, and the county was named for Civil War General George Day.
Geography
Day County covers an area of 1,072 square miles, and is mostly flat, with some rolling hills in the western part of the county. The terrain is mostly prairie, with some wooded areas in the western part of the county. The county is drained by the James River, which flows through the county from north to south. The county is also home to several small lakes, including Lake Cochrane, Lake Henry, and Lake Traverse.
The climate of Day County is characterized by hot summers and cold winters. The average annual temperature is 48°F, and the average annual precipitation is 20 inches.
Demographics
As of the 2010 census, there were 5,710 people, 2,093 households, and 1,521 families living in Day County. The population density was 5.3 people per square mile. The racial makeup of the county was 97.2% White, 0.3% African American, 0.3% Native American, 0.3% Asian, 0.1% Pacific Islander, 0.7% from other races, and 0.9% from two or more races. Hispanic or Latino of any race were 1.7% of the population.
The median income for a household in Day County was $41,945, and the median income for a family was $50,945. The per capita income for the county was $20,845. About 8.2% of families and 11.2% of the population were below the poverty line, including 14.2% of those under age 18 and 8.2% of those age 65 or over.
Economy
Day County is primarily an agricultural county, with the majority of the population employed in farming and related industries. The county is home to several large farms, and the main crops grown in the county are corn, soybeans, wheat, and hay. The county is also home to several small businesses, including a few restaurants, a grocery store, and a few retail stores.
The county is also home to several manufacturing companies, including a furniture manufacturer, a plastics manufacturer, and a metal fabrication company. The county is also home to several energy companies, including a wind farm and a solar farm.
Day County is also home to several tourist attractions, including the Day County Museum, the Day County Historical Society, and the Day County Fairgrounds. The county is also home to several parks, including the Day County State Park, the Day County Recreation Area, and the Day County Wildlife Management Area.
Conclusion
Day County is a rural county located in the northeastern corner of South Dakota. The county is mostly agricultural, with the majority of the population employed in farming and related industries. The county is also home to several small businesses, manufacturing companies, energy companies, and tourist attractions. The county has a population of 5,710, and the median income for a household is $41,945.
Common Questions
What is the Total Population of Day County?
Total Population of Day County is 5,485.
What is the Total Male Population of Day County?
Total Male Population of Day County is 2,821.
What is the Total Female Population of Day County?
Total Female Population of Day County is 2,664.
What is the Ratio of Males per 100 Females in Day County?
There are 105.89 Males per 100 Females in Day County.
What is the Ratio of Females per 100 Males in Day County?
There are 94.43 Females per 100 Males in Day County.
What is the Median Population Age in Day County?
Median Population Age in Day County is 47.2 Years.
What is the Average Family Size in Day County
Average Family Size in Day County is 3.0 People.
What is the Average Household Size in Day County
Average Household Size in Day County is 2.3 People.
What is Per Capita Income in Day County?
Per Capita income in Day County is $34,210.
What is the Median Family Income in Day County?
Median Family Income in Day County is $76,583.
What is the Median Household income in Day County?
Median Household Income in Day County is $57,558.
What is Income or Wage Gap in Day County?
Income or Wage Gap in Day County is 42.9%.
Women in Day County earn 57.1 cents for every dollar earned by a man.
What is Family Income Deficit in Day County?
Family Income Deficit in Day County is $11,275.
Families that are below poverty line in Day County earn $11,275 less on average than the poverty threshold level.
What is Inequality or Gini Index in Day County?
Inequality or Gini Index in Day County is 0.44.
How Large is the Labor Force in Day County?
There are 2,552 People in the Labor Forcein in Day County.
What is the Percentage of People in the Labor Force in Day County?
57.2% of People are in the Labor Force in Day County.
What is the Unemployment Rate in Day County?
Unemployment Rate in Day County is 2.6%.