Davison County, SD
Davison County Map
Davison County Overview
19,966
TOTAL POPULATION
9,894
MALE POPULATION
10,072
FEMALE POPULATION
98.23
MALES / 100 FEMALES
101.80
FEMALES / 100 MALES
39.7
MEDIAN AGE
3.0
AVG FAMILY SIZE
2.3
AVG HOUSEHOLD SIZE
$33,282
PER CAPITA INCOME
$86,005
AVG FAMILY INCOME
$55,606
AVG HOUSEHOLD INCOME
32.1%
WAGE / INCOME GAP [ % ]
67.9¢/ $1
WAGE / INCOME GAP [ $ ]
0.45
INEQUALITY / GINI INDEX
10,602
LABOR FORCE [ PEOPLE ]
67.7%
PERCENT IN LABOR FORCE
1.4%
UNEMPLOYMENT RATE
Davison County Area Codes
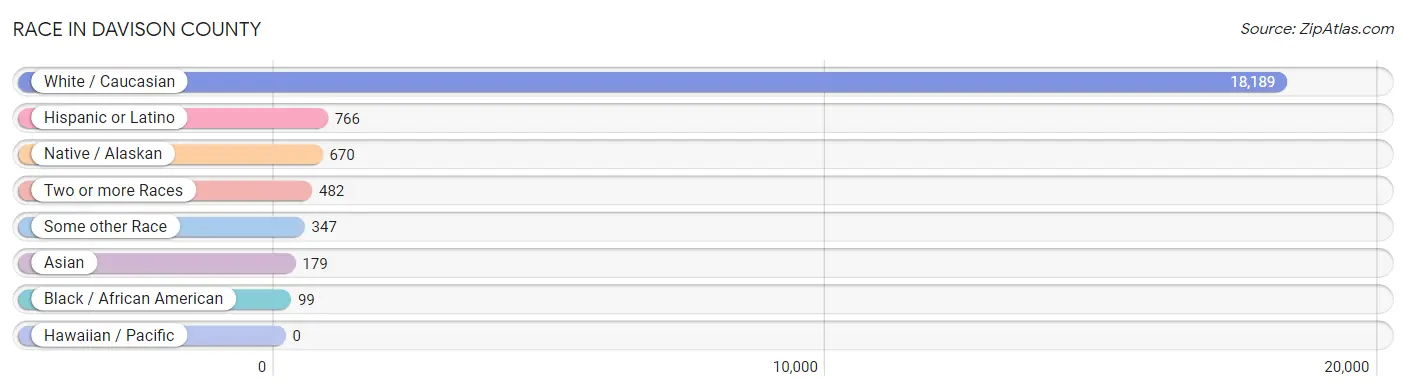
Race in Davison County
The most populous races in Davison County are White / Caucasian (18,189 | 91.1%), Hispanic or Latino (766 | 3.8%), and Native / Alaskan (670 | 3.4%).
| Race | # Population | % Population |
| Asian | 179 | 0.9% |
| Black / African American | 99 | 0.5% |
| Hawaiian / Pacific | 0 | 0.0% |
| Hispanic or Latino | 766 | 3.8% |
| Native / Alaskan | 670 | 3.4% |
| White / Caucasian | 18,189 | 91.1% |
| Two or more Races | 482 | 2.4% |
| Some other Race | 347 | 1.7% |
| Total | 19,966 | 100.0% |
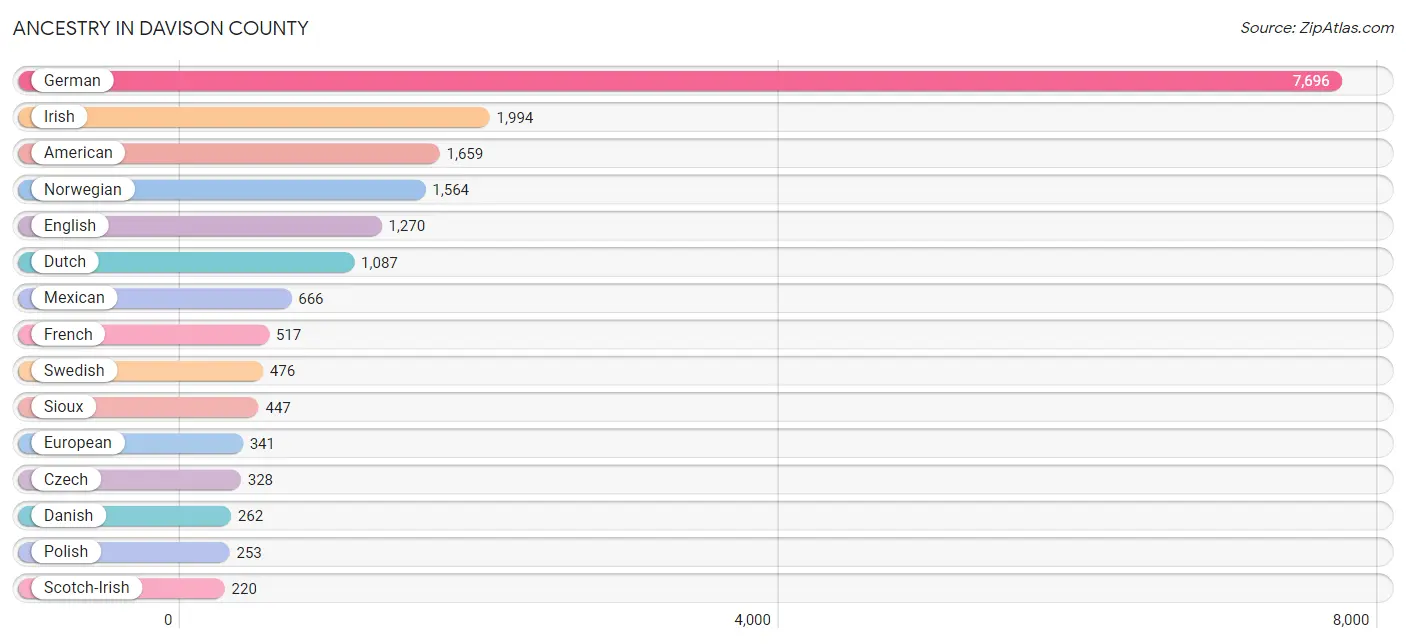
Ancestry in Davison County
The most populous ancestries reported in Davison County are German (7,696 | 38.6%), Irish (1,994 | 10.0%), American (1,659 | 8.3%), Norwegian (1,564 | 7.8%), and English (1,270 | 6.4%), together accounting for 71.0% of all Davison County residents.
| Ancestry | # Population | % Population |
| African | 8 | 0.0% |
| American | 1,659 | 8.3% |
| Arab | 48 | 0.2% |
| Austrian | 75 | 0.4% |
| Belgian | 73 | 0.4% |
| Bhutanese | 2 | 0.0% |
| Blackfeet | 1 | 0.0% |
| Burmese | 10 | 0.1% |
| Canadian | 28 | 0.1% |
| Central American | 50 | 0.3% |
| Cherokee | 74 | 0.4% |
| Chippewa | 8 | 0.0% |
| Choctaw | 53 | 0.3% |
| Czech | 328 | 1.6% |
| Czechoslovakian | 63 | 0.3% |
| Danish | 262 | 1.3% |
| Dutch | 1,087 | 5.4% |
| Eastern European | 10 | 0.1% |
| English | 1,270 | 6.4% |
| European | 341 | 1.7% |
| Finnish | 24 | 0.1% |
| French | 517 | 2.6% |
| French Canadian | 111 | 0.6% |
| German | 7,696 | 38.6% |
| Greek | 22 | 0.1% |
| Guatemalan | 50 | 0.3% |
| Hungarian | 28 | 0.1% |
| Indian (Asian) | 13 | 0.1% |
| Irish | 1,994 | 10.0% |
| Italian | 128 | 0.6% |
| Jamaican | 17 | 0.1% |
| Korean | 6 | 0.0% |
| Latvian | 43 | 0.2% |
| Lebanese | 43 | 0.2% |
| Luxembourger | 28 | 0.1% |
| Mexican | 666 | 3.3% |
| Norwegian | 1,564 | 7.8% |
| Pennsylvania German | 16 | 0.1% |
| Polish | 253 | 1.3% |
| Puerto Rican | 5 | 0.0% |
| Russian | 142 | 0.7% |
| Scandinavian | 100 | 0.5% |
| Scotch-Irish | 220 | 1.1% |
| Scottish | 209 | 1.1% |
| Sioux | 447 | 2.2% |
| Sri Lankan | 143 | 0.7% |
| Subsaharan African | 35 | 0.2% |
| Swedish | 476 | 2.4% |
| Swiss | 60 | 0.3% |
| Welsh | 20 | 0.1% | View All 50 Rows |
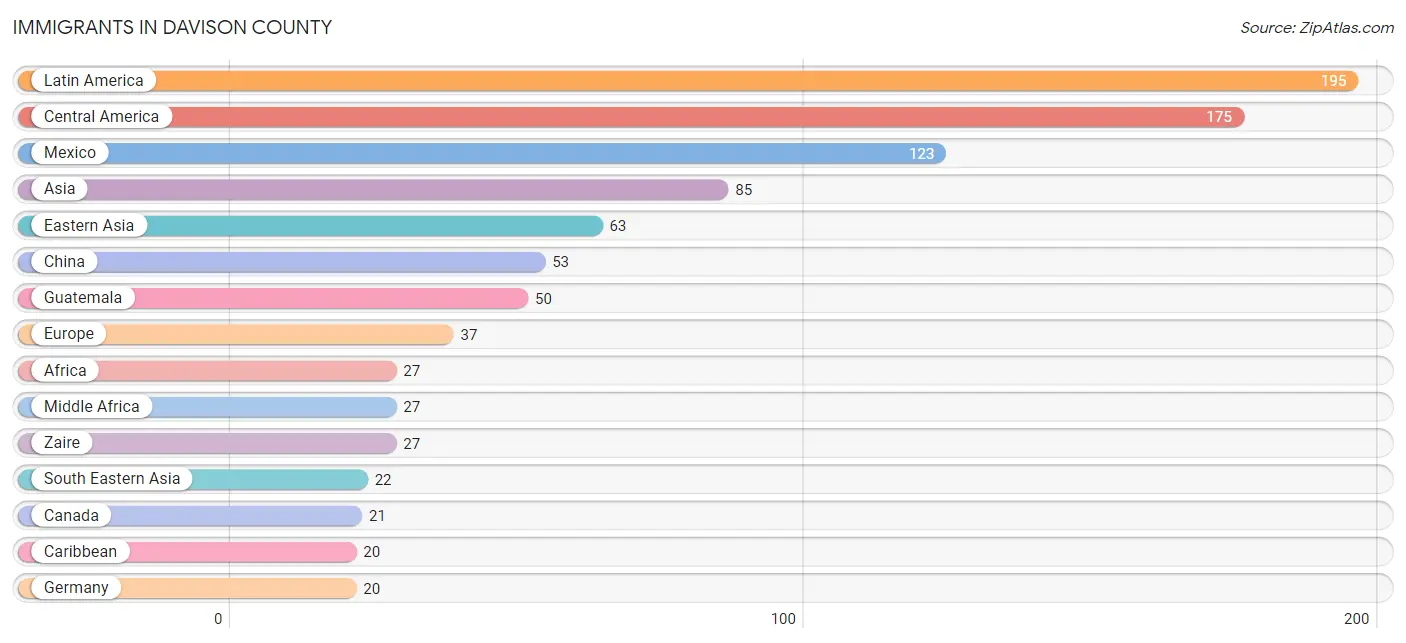
Immigrants in Davison County
The most numerous immigrant groups reported in Davison County came from Latin America (195 | 1.0%), Central America (175 | 0.9%), Mexico (123 | 0.6%), Asia (85 | 0.4%), and Eastern Asia (63 | 0.3%), together accounting for 3.2% of all Davison County residents.
| Immigration Origin | # Population | % Population |
| Africa | 27 | 0.1% |
| Asia | 85 | 0.4% |
| Canada | 21 | 0.1% |
| Caribbean | 20 | 0.1% |
| Central America | 175 | 0.9% |
| China | 53 | 0.3% |
| Eastern Asia | 63 | 0.3% |
| Eastern Europe | 6 | 0.0% |
| El Salvador | 2 | 0.0% |
| England | 7 | 0.0% |
| Europe | 37 | 0.2% |
| Germany | 20 | 0.1% |
| Guatemala | 50 | 0.3% |
| Ireland | 4 | 0.0% |
| Jamaica | 20 | 0.1% |
| Korea | 10 | 0.1% |
| Latin America | 195 | 1.0% |
| Mexico | 123 | 0.6% |
| Middle Africa | 27 | 0.1% |
| Northern Europe | 11 | 0.1% |
| Philippines | 6 | 0.0% |
| Russia | 6 | 0.0% |
| South Eastern Asia | 22 | 0.1% |
| Thailand | 9 | 0.1% |
| Western Europe | 20 | 0.1% |
| Zaire | 27 | 0.1% | View All 26 Rows |
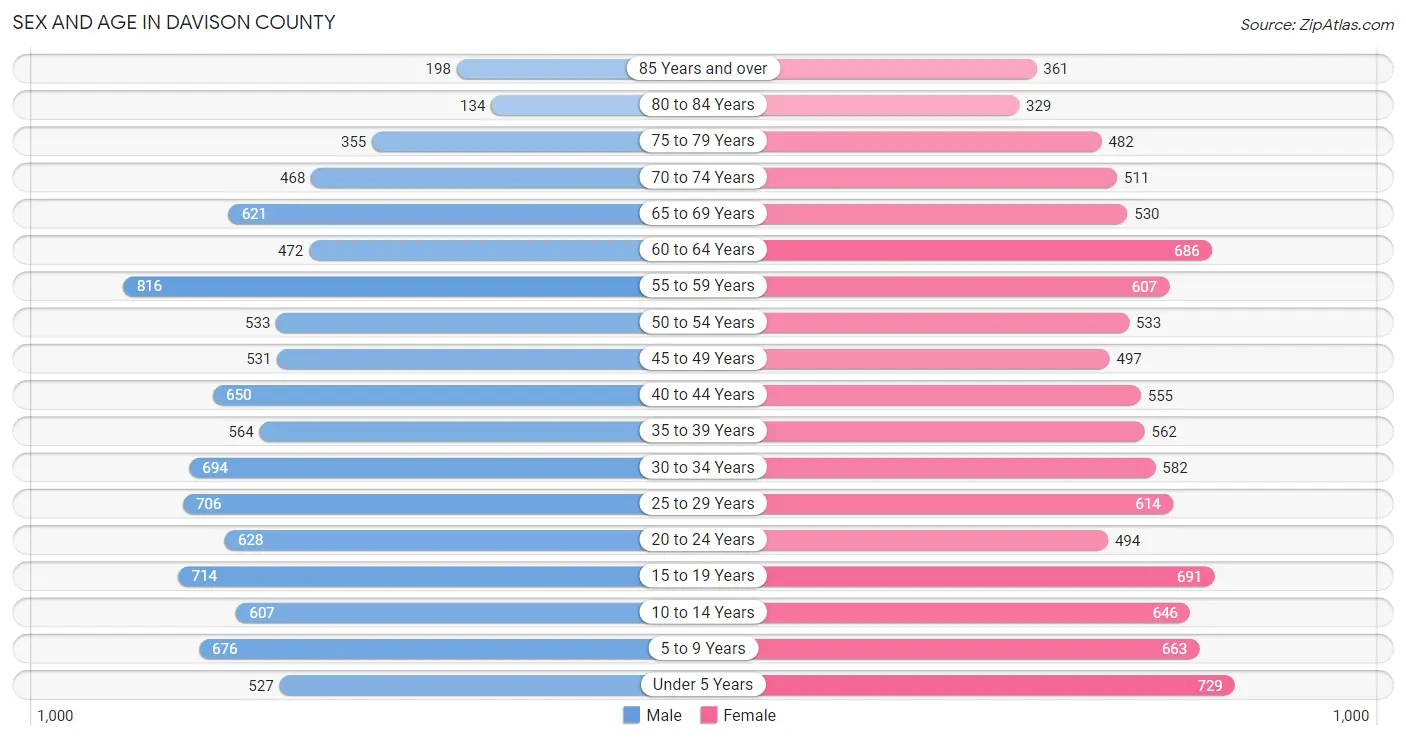
Sex and Age in Davison County
Sex and Age in Davison County
The most populous age groups in Davison County are 55 to 59 Years (816 | 8.3%) for men and Under 5 Years (729 | 7.2%) for women.
| Age Bracket | Male | Female |
| Under 5 Years | 527 (5.3%) | 729 (7.2%) |
| 5 to 9 Years | 676 (6.8%) | 663 (6.6%) |
| 10 to 14 Years | 607 (6.1%) | 646 (6.4%) |
| 15 to 19 Years | 714 (7.2%) | 691 (6.9%) |
| 20 to 24 Years | 628 (6.4%) | 494 (4.9%) |
| 25 to 29 Years | 706 (7.1%) | 614 (6.1%) |
| 30 to 34 Years | 694 (7.0%) | 582 (5.8%) |
| 35 to 39 Years | 564 (5.7%) | 562 (5.6%) |
| 40 to 44 Years | 650 (6.6%) | 555 (5.5%) |
| 45 to 49 Years | 531 (5.4%) | 497 (4.9%) |
| 50 to 54 Years | 533 (5.4%) | 533 (5.3%) |
| 55 to 59 Years | 816 (8.3%) | 607 (6.0%) |
| 60 to 64 Years | 472 (4.8%) | 686 (6.8%) |
| 65 to 69 Years | 621 (6.3%) | 530 (5.3%) |
| 70 to 74 Years | 468 (4.7%) | 511 (5.1%) |
| 75 to 79 Years | 355 (3.6%) | 482 (4.8%) |
| 80 to 84 Years | 134 (1.3%) | 329 (3.3%) |
| 85 Years and over | 198 (2.0%) | 361 (3.6%) |
| Total | 9,894 (100.0%) | 10,072 (100.0%) |
Families and Households in Davison County
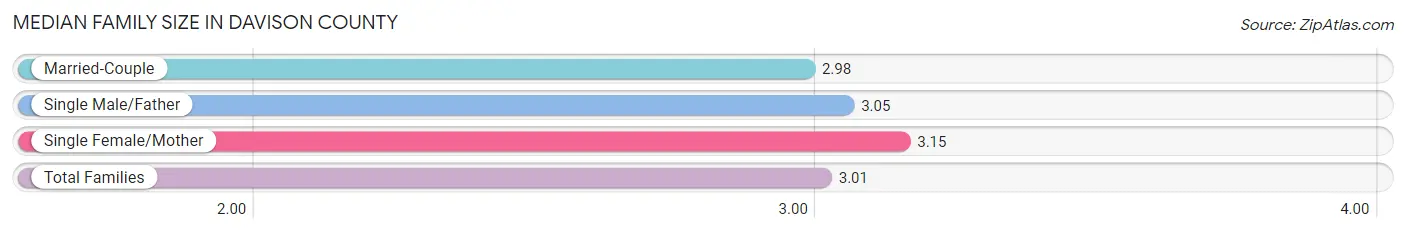
Median Family Size in Davison County
The median family size in Davison County is 3.01 persons per family, with single female/mother families (678 | 14.3%) accounting for the largest median family size of 3.15 persons per family. On the other hand, married-couple families (3,786 | 79.6%) represent the smallest median family size with 2.98 persons per family.
| Family Type | # Families | Family Size |
| Married-Couple | 3,786 (79.6%) | 2.98 |
| Single Male/Father | 290 (6.1%) | 3.05 |
| Single Female/Mother | 678 (14.3%) | 3.15 |
| Total Families | 4,754 (100.0%) | 3.01 |
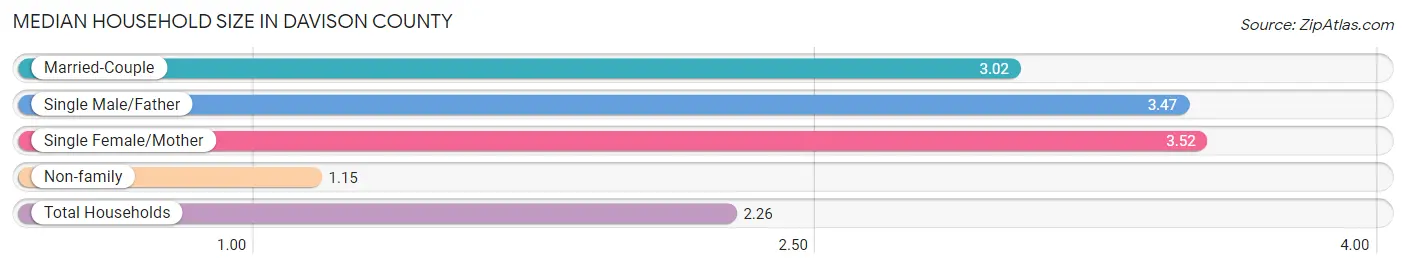
Median Household Size in Davison County
The median household size in Davison County is 2.26 persons per household, with single female/mother households (678 | 8.0%) accounting for the largest median household size of 3.52 persons per household. non-family households (3,694 | 43.7%) represent the smallest median household size with 1.15 persons per household.
| Household Type | # Households | Household Size |
| Married-Couple | 3,786 (44.8%) | 3.02 |
| Single Male/Father | 290 (3.4%) | 3.47 |
| Single Female/Mother | 678 (8.0%) | 3.52 |
| Non-family | 3,694 (43.7%) | 1.15 |
| Total Households | 8,448 (100.0%) | 2.26 |
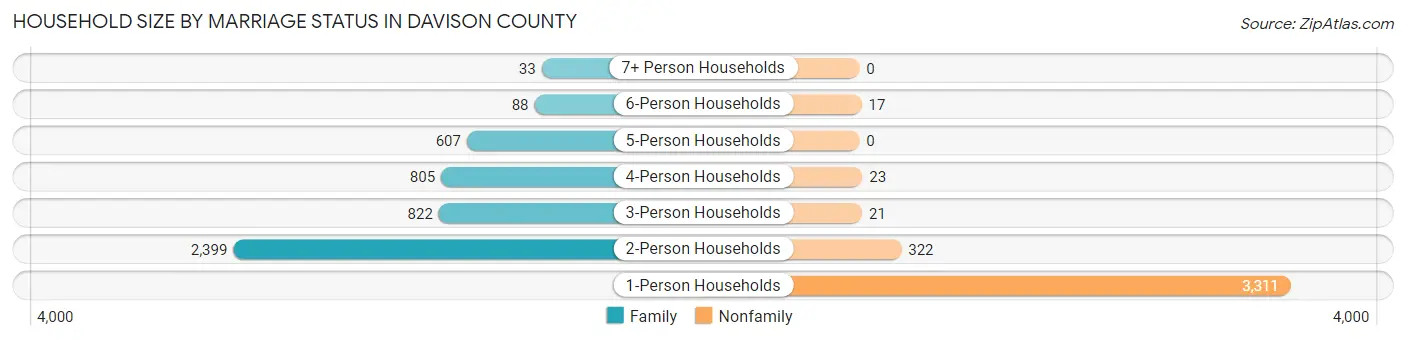
Household Size by Marriage Status in Davison County
Out of a total of 8,448 households in Davison County, 4,754 (56.3%) are family households, while 3,694 (43.7%) are nonfamily households. The most numerous type of family households are 2-person households, comprising 2,399, and the most common type of nonfamily households are 1-person households, comprising 3,311.
| Household Size | Family Households | Nonfamily Households |
| 1-Person Households | - | 3,311 (39.2%) |
| 2-Person Households | 2,399 (28.4%) | 322 (3.8%) |
| 3-Person Households | 822 (9.7%) | 21 (0.3%) |
| 4-Person Households | 805 (9.5%) | 23 (0.3%) |
| 5-Person Households | 607 (7.2%) | 0 (0.0%) |
| 6-Person Households | 88 (1.0%) | 17 (0.2%) |
| 7+ Person Households | 33 (0.4%) | 0 (0.0%) |
| Total | 4,754 (56.3%) | 3,694 (43.7%) |
Female Fertility in Davison County
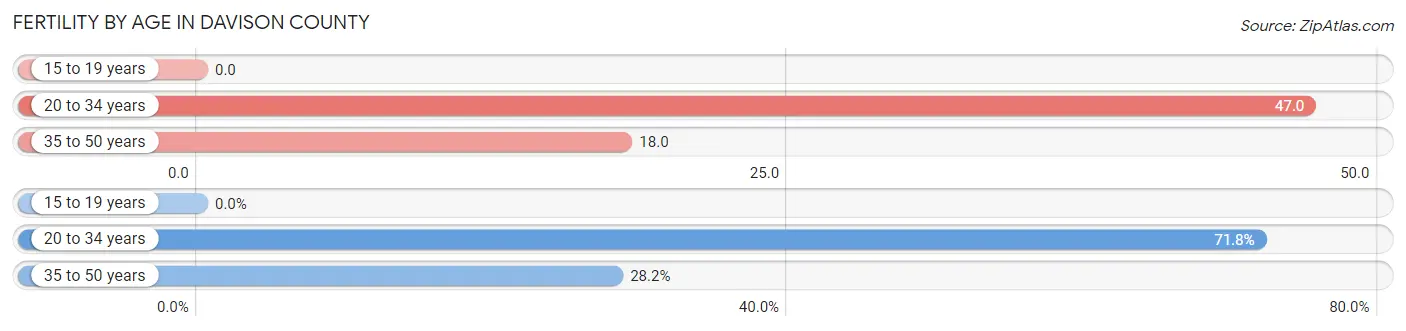
Fertility by Age in Davison County
Average fertility rate in Davison County is 27.0 births per 1,000 women. Women in the age bracket of 20 to 34 years have the highest fertility rate with 47.0 births per 1,000 women. Women in the age bracket of 20 to 34 years acount for 71.8% of all women with births.
| Age Bracket | Women with Births | Births / 1,000 Women |
| 15 to 19 years | 0 (0.0%) | 0.0 |
| 20 to 34 years | 79 (71.8%) | 47.0 |
| 35 to 50 years | 31 (28.2%) | 18.0 |
| Total | 110 (100.0%) | 27.0 |
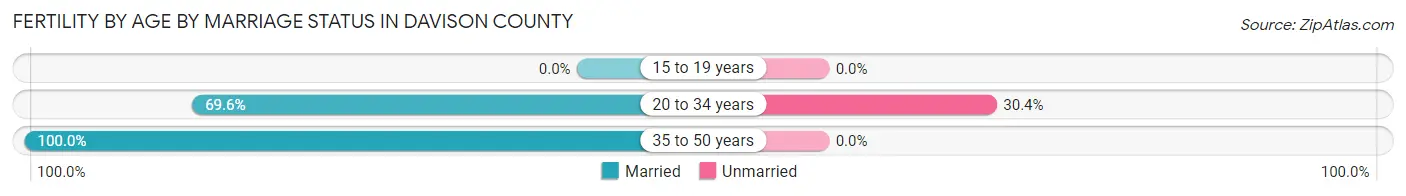
Fertility by Age by Marriage Status in Davison County
78.2% of women with births (110) in Davison County are married. The highest percentage of unmarried women with births falls into 20 to 34 years age bracket with 30.4% of them unmarried at the time of birth, while the lowest percentage of unmarried women with births belong to 35 to 50 years age bracket with 0.0% of them unmarried.
| Age Bracket | Married | Unmarried |
| 15 to 19 years | 0 (0.0%) | 0 (0.0%) |
| 20 to 34 years | 55 (69.6%) | 24 (30.4%) |
| 35 to 50 years | 31 (100.0%) | 0 (0.0%) |
| Total | 86 (78.2%) | 24 (21.8%) |
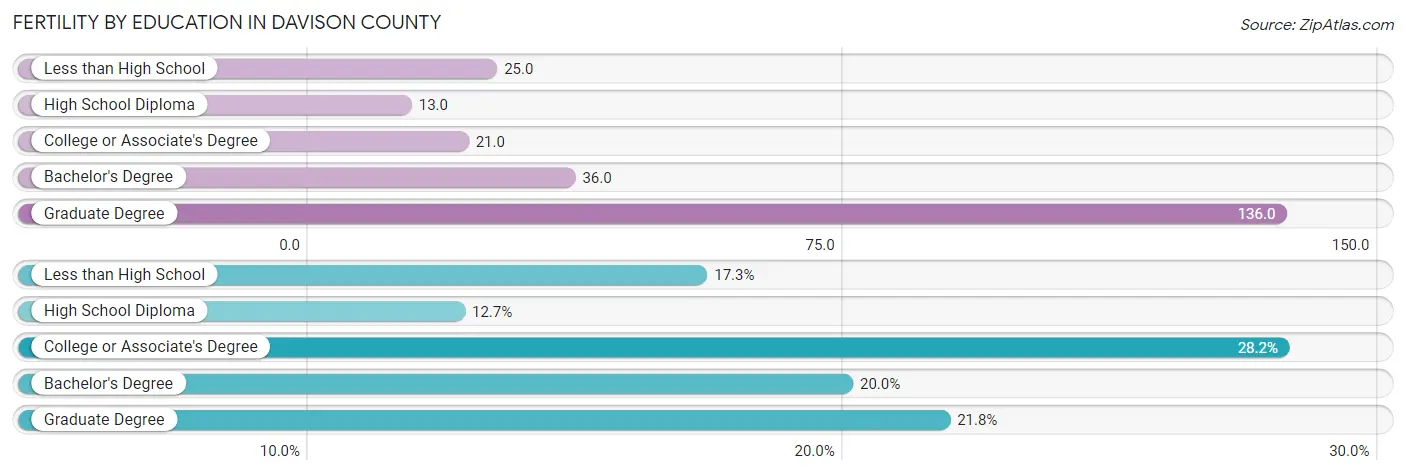
Fertility by Education in Davison County
Average fertility rate in Davison County is 27.0 births per 1,000 women. Women with the education attainment of graduate degree have the highest fertility rate of 136.0 births per 1,000 women, while women with the education attainment of high school diploma have the lowest fertility at 13.0 births per 1,000 women. Women with the education attainment of college or associate's degree represent 28.2% of all women with births.
| Educational Attainment | Women with Births | Births / 1,000 Women |
| Less than High School | 19 (17.3%) | 25.0 |
| High School Diploma | 14 (12.7%) | 13.0 |
| College or Associate's Degree | 31 (28.2%) | 21.0 |
| Bachelor's Degree | 22 (20.0%) | 36.0 |
| Graduate Degree | 24 (21.8%) | 136.0 |
| Total | 110 (100.0%) | 27.0 |
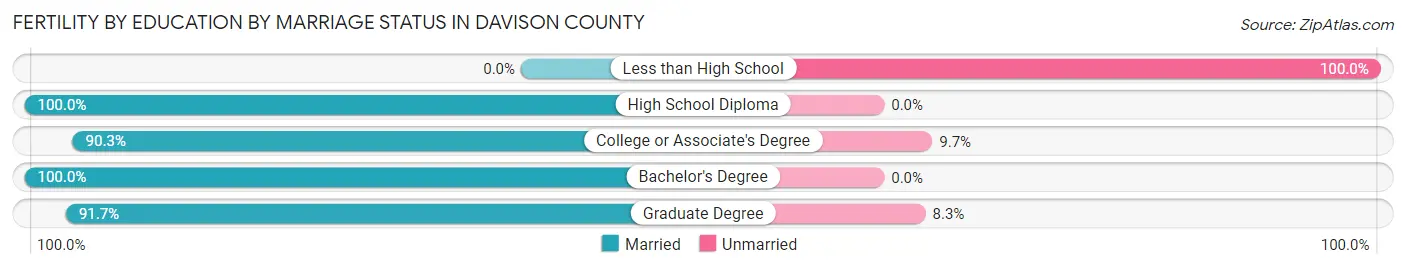
Fertility by Education by Marriage Status in Davison County
21.8% of women with births in Davison County are unmarried. Women with the educational attainment of high school diploma are most likely to be married with 100.0% of them married at childbirth, while women with the educational attainment of less than high school are least likely to be married with 100.0% of them unmarried at childbirth.
| Educational Attainment | Married | Unmarried |
| Less than High School | 0 (0.0%) | 19 (100.0%) |
| High School Diploma | 14 (100.0%) | 0 (0.0%) |
| College or Associate's Degree | 28 (90.3%) | 3 (9.7%) |
| Bachelor's Degree | 22 (100.0%) | 0 (0.0%) |
| Graduate Degree | 22 (91.7%) | 2 (8.3%) |
| Total | 86 (78.2%) | 24 (21.8%) |
Income in Davison County
Income Overview in Davison County
Per Capita Income in Davison County is $33,282, while median incomes of families and households are $86,005 and $55,606 respectively.
| Characteristic | Number | Measure |
| Per Capita Income | 19,966 | $33,282 |
| Median Family Income | 4,754 | $86,005 |
| Mean Family Income | 4,754 | $100,986 |
| Median Household Income | 8,448 | $55,606 |
| Mean Household Income | 8,448 | $76,883 |
| Income Deficit | 4,754 | $0 |
| Wage / Income Gap (%) | 19,966 | 32.10% |
| Wage / Income Gap ($) | 19,966 | 67.90¢ per $1 |
| Gini / Inequality Index | 19,966 | 0.45 |
Earnings by Sex in Davison County
Average Earnings in Davison County are $36,733, $43,484 for men and $29,527 for women, a difference of 32.1%.
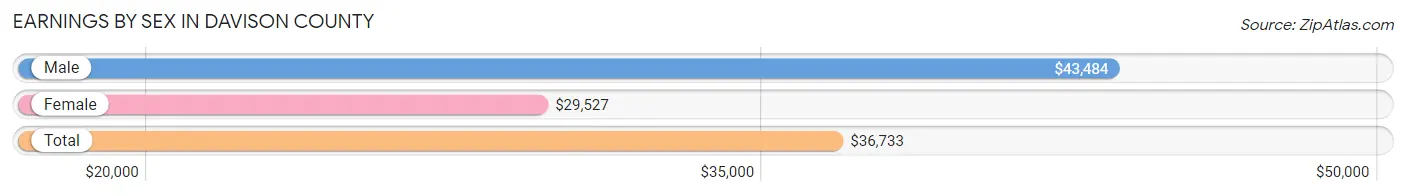
| Sex | Number | Average Earnings |
| Male | 6,031 (53.3%) | $43,484 |
| Female | 5,274 (46.7%) | $29,527 |
| Total | 11,305 (100.0%) | $36,733 |
Earnings by Sex by Income Bracket in Davison County
The most common earnings brackets in Davison County are $55,000 to $64,999 for men (734 | 12.2%) and $35,000 to $39,999 for women (534 | 10.1%).
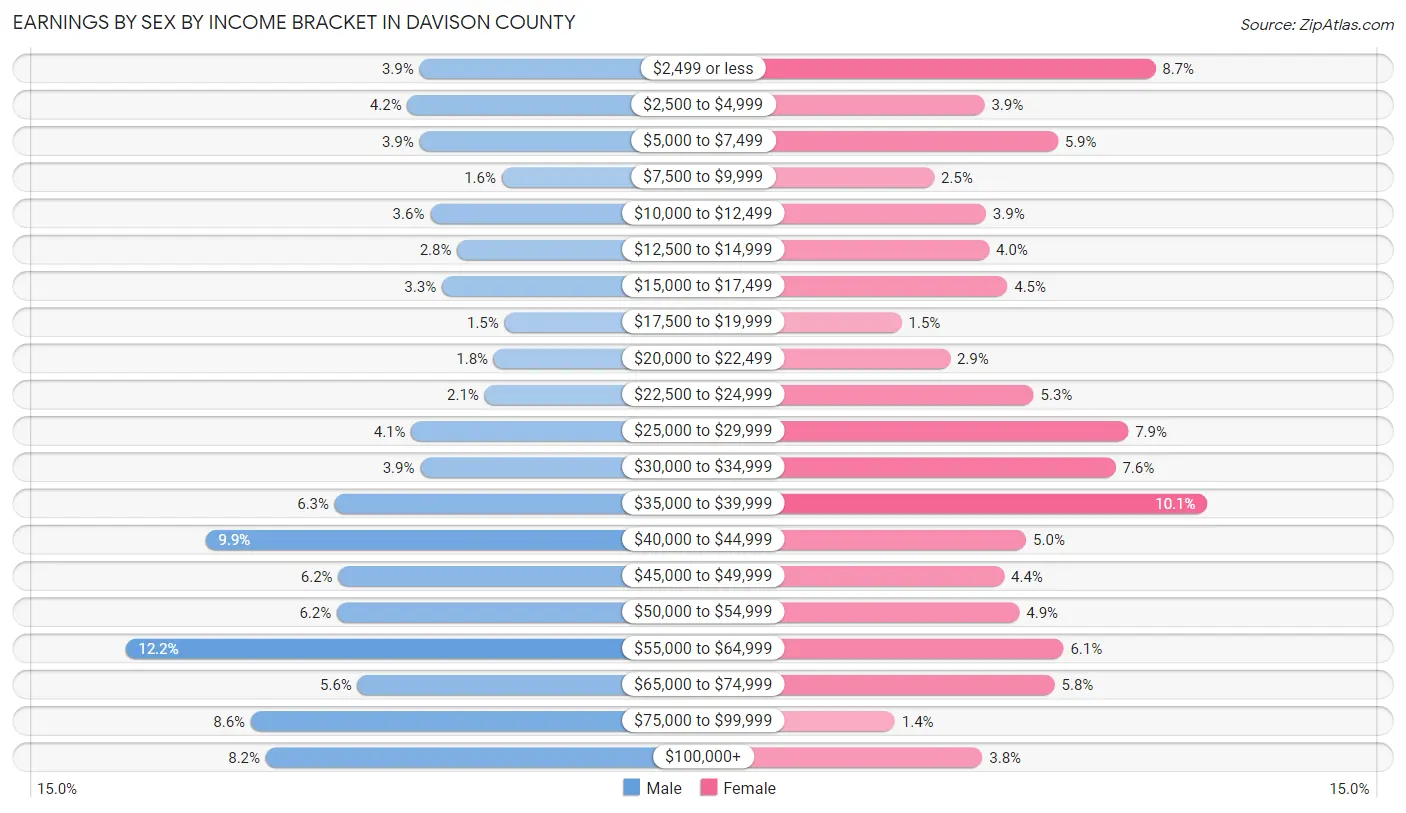
| Income | Male | Female |
| $2,499 or less | 235 (3.9%) | 457 (8.7%) |
| $2,500 to $4,999 | 256 (4.2%) | 204 (3.9%) |
| $5,000 to $7,499 | 235 (3.9%) | 313 (5.9%) |
| $7,500 to $9,999 | 96 (1.6%) | 129 (2.5%) |
| $10,000 to $12,499 | 217 (3.6%) | 206 (3.9%) |
| $12,500 to $14,999 | 171 (2.8%) | 211 (4.0%) |
| $15,000 to $17,499 | 197 (3.3%) | 238 (4.5%) |
| $17,500 to $19,999 | 91 (1.5%) | 81 (1.5%) |
| $20,000 to $22,499 | 109 (1.8%) | 153 (2.9%) |
| $22,500 to $24,999 | 125 (2.1%) | 277 (5.2%) |
| $25,000 to $29,999 | 249 (4.1%) | 417 (7.9%) |
| $30,000 to $34,999 | 234 (3.9%) | 398 (7.5%) |
| $35,000 to $39,999 | 379 (6.3%) | 534 (10.1%) |
| $40,000 to $44,999 | 598 (9.9%) | 266 (5.0%) |
| $45,000 to $49,999 | 373 (6.2%) | 233 (4.4%) |
| $50,000 to $54,999 | 375 (6.2%) | 256 (4.9%) |
| $55,000 to $64,999 | 734 (12.2%) | 321 (6.1%) |
| $65,000 to $74,999 | 340 (5.6%) | 308 (5.8%) |
| $75,000 to $99,999 | 521 (8.6%) | 71 (1.3%) |
| $100,000+ | 496 (8.2%) | 201 (3.8%) |
| Total | 6,031 (100.0%) | 5,274 (100.0%) |
Earnings by Sex by Educational Attainment in Davison County
Average earnings in Davison County are $46,361 for men and $34,459 for women, a difference of 25.7%. Men with an educational attainment of bachelor's degree enjoy the highest average annual earnings of $58,333, while those with high school diploma education earn the least with $40,223. Women with an educational attainment of graduate degree earn the most with the average annual earnings of $57,034, while those with high school diploma education have the smallest earnings of $29,375.
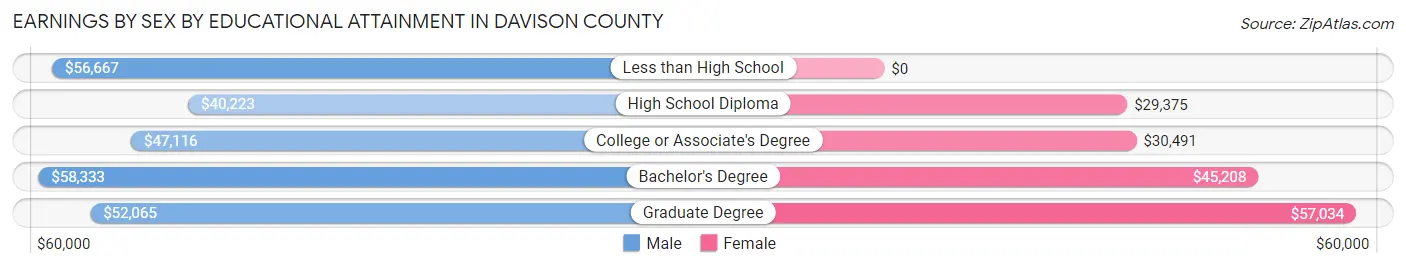
| Educational Attainment | Male Income | Female Income |
| Less than High School | $56,667 | $0 |
| High School Diploma | $40,223 | $29,375 |
| College or Associate's Degree | $47,116 | $30,491 |
| Bachelor's Degree | $58,333 | $45,208 |
| Graduate Degree | $52,065 | $57,034 |
| Total | $46,361 | $34,459 |
Family Income in Davison County
Family Income Brackets in Davison County
According to the Davison County family income data, there are 1,036 families falling into the $100,000 to $149,999 income range, which is the most common income bracket and makes up 21.8% of all families. Conversely, the $10,000 to $14,999 income bracket is the least frequent group with only 100 families (2.1%) belonging to this category.
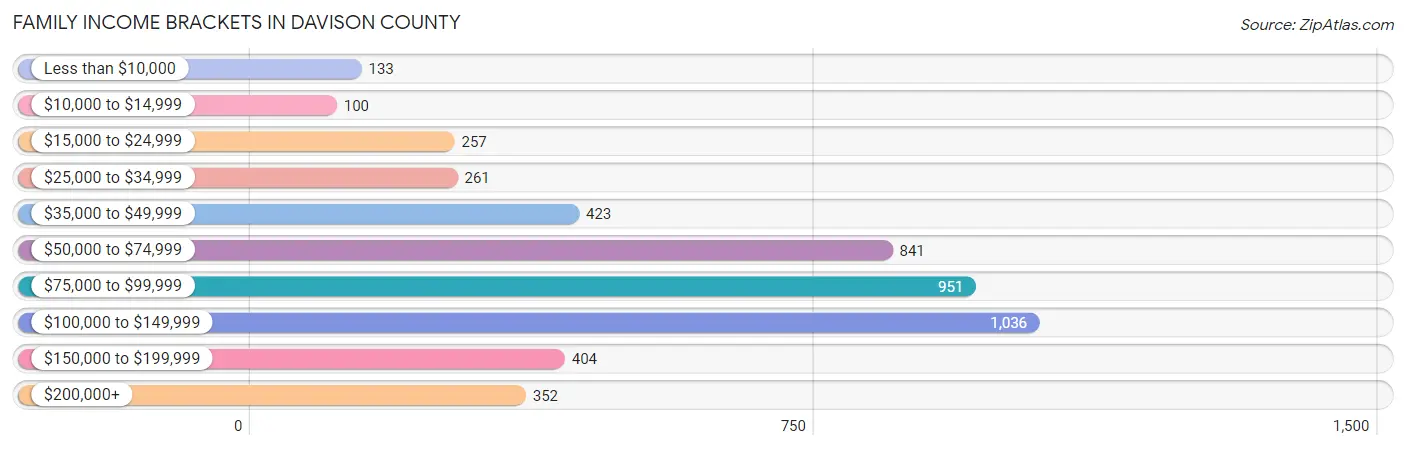
| Income Bracket | # Families | % Families |
| Less than $10,000 | 133 | 2.8% |
| $10,000 to $14,999 | 100 | 2.1% |
| $15,000 to $24,999 | 257 | 5.4% |
| $25,000 to $34,999 | 261 | 5.5% |
| $35,000 to $49,999 | 423 | 8.9% |
| $50,000 to $74,999 | 841 | 17.7% |
| $75,000 to $99,999 | 951 | 20.0% |
| $100,000 to $149,999 | 1,036 | 21.8% |
| $150,000 to $199,999 | 404 | 8.5% |
| $200,000+ | 352 | 7.4% |
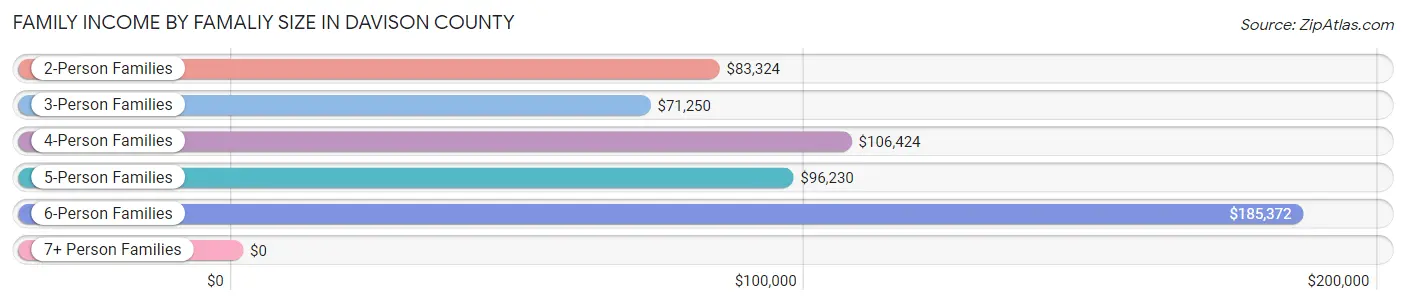
Family Income by Famaliy Size in Davison County
6-person families (80 | 1.7%) account for the highest median family income in Davison County with $185,372 per family, while 2-person families (2,508 | 52.8%) have the highest median income of $41,662 per family member.
| Income Bracket | # Families | Median Income |
| 2-Person Families | 2,508 (52.8%) | $83,324 |
| 3-Person Families | 1,042 (21.9%) | $71,250 |
| 4-Person Families | 510 (10.7%) | $106,424 |
| 5-Person Families | 591 (12.4%) | $96,230 |
| 6-Person Families | 80 (1.7%) | $185,372 |
| 7+ Person Families | 23 (0.5%) | $0 |
| Total | 4,754 (100.0%) | $86,005 |
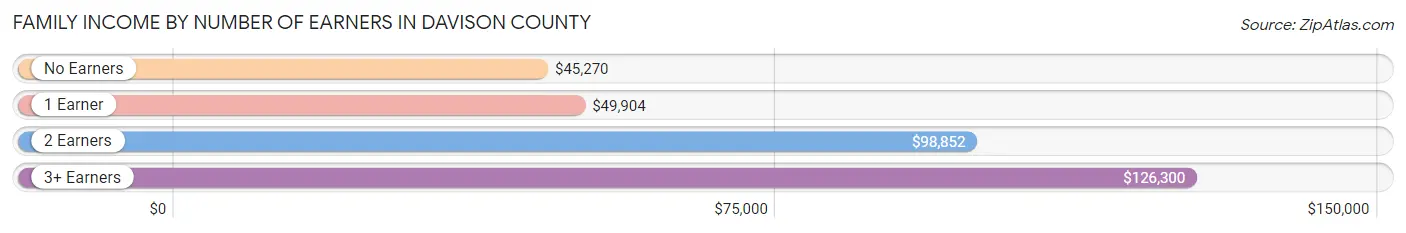
Family Income by Number of Earners in Davison County
The median family income in Davison County is $86,005, with families comprising 3+ earners (620) having the highest median family income of $126,300, while families with no earners (690) have the lowest median family income of $45,270, accounting for 13.0% and 14.5% of families, respectively.
| Number of Earners | # Families | Median Income |
| No Earners | 690 (14.5%) | $45,270 |
| 1 Earner | 1,241 (26.1%) | $49,904 |
| 2 Earners | 2,203 (46.3%) | $98,852 |
| 3+ Earners | 620 (13.0%) | $126,300 |
| Total | 4,754 (100.0%) | $86,005 |
Household Income in Davison County
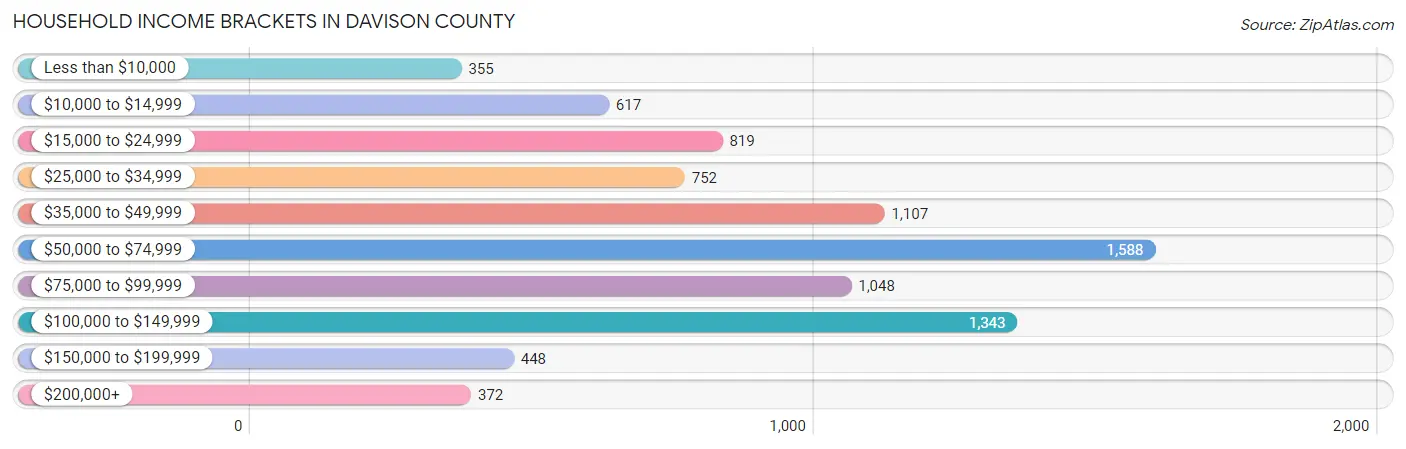
Household Income Brackets in Davison County
With 1,588 households falling in the category, the $50,000 to $74,999 income range is the most frequent in Davison County, accounting for 18.8% of all households. In contrast, only 355 households (4.2%) fall into the less than $10,000 income bracket, making it the least populous group.
| Income Bracket | # Households | % Households |
| Less than $10,000 | 355 | 4.2% |
| $10,000 to $14,999 | 617 | 7.3% |
| $15,000 to $24,999 | 819 | 9.7% |
| $25,000 to $34,999 | 752 | 8.9% |
| $35,000 to $49,999 | 1,107 | 13.1% |
| $50,000 to $74,999 | 1,588 | 18.8% |
| $75,000 to $99,999 | 1,048 | 12.4% |
| $100,000 to $149,999 | 1,343 | 15.9% |
| $150,000 to $199,999 | 448 | 5.3% |
| $200,000+ | 372 | 4.4% |
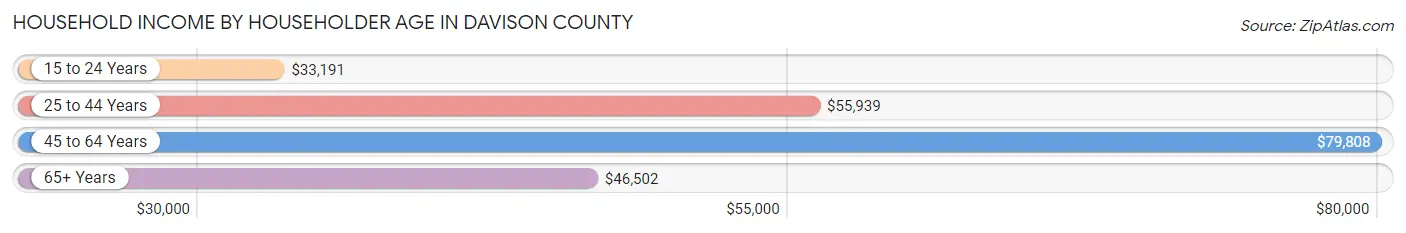
Household Income by Householder Age in Davison County
The median household income in Davison County is $55,606, with the highest median household income of $79,808 found in the 45 to 64 years age bracket for the primary householder. A total of 2,588 households (30.6%) fall into this category. Meanwhile, the 15 to 24 years age bracket for the primary householder has the lowest median household income of $33,191, with 500 households (5.9%) in this group.
| Income Bracket | # Households | Median Income |
| 15 to 24 Years | 500 (5.9%) | $33,191 |
| 25 to 44 Years | 2,747 (32.5%) | $55,939 |
| 45 to 64 Years | 2,588 (30.6%) | $79,808 |
| 65+ Years | 2,613 (30.9%) | $46,502 |
| Total | 8,448 (100.0%) | $55,606 |
Poverty in Davison County
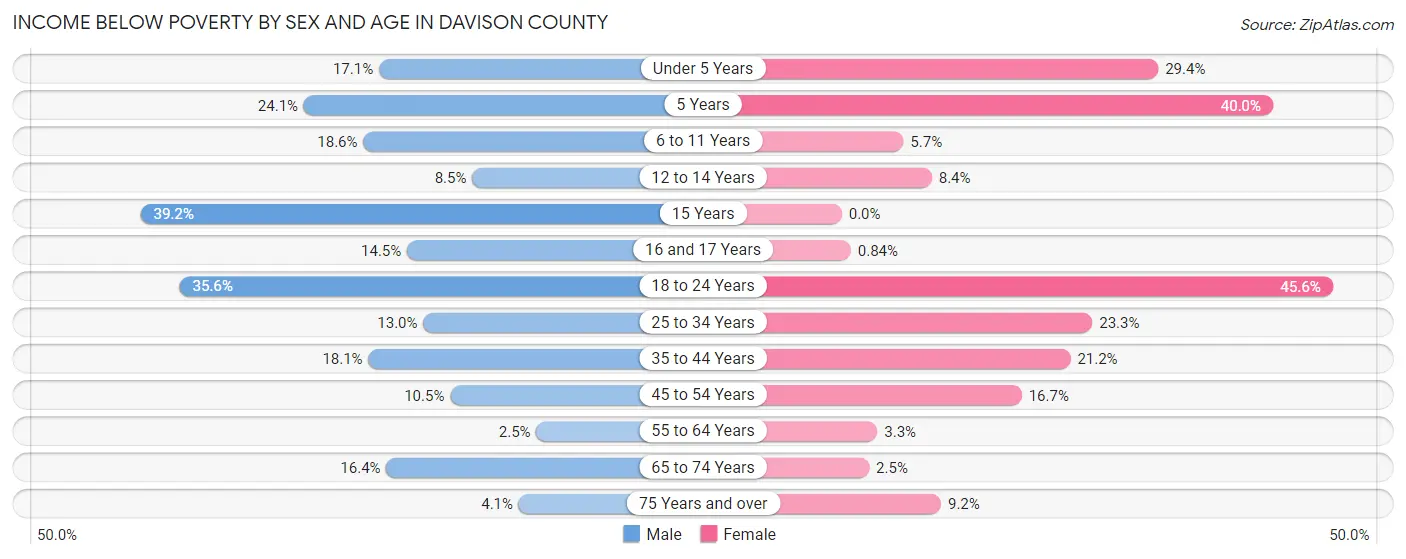
Income Below Poverty by Sex and Age in Davison County
With 15.1% poverty level for males and 15.2% for females among the residents of Davison County, 15 year old males and 18 to 24 year old females are the most vulnerable to poverty, with 124 males (39.2%) and 302 females (45.6%) in their respective age groups living below the poverty level.
| Age Bracket | Male | Female |
| Under 5 Years | 90 (17.1%) | 205 (29.4%) |
| 5 Years | 59 (24.1%) | 24 (40.0%) |
| 6 to 11 Years | 131 (18.6%) | 38 (5.7%) |
| 12 to 14 Years | 25 (8.5%) | 36 (8.4%) |
| 15 Years | 124 (39.2%) | 0 (0.0%) |
| 16 and 17 Years | 19 (14.5%) | 2 (0.8%) |
| 18 to 24 Years | 260 (35.6%) | 302 (45.6%) |
| 25 to 34 Years | 180 (13.0%) | 276 (23.3%) |
| 35 to 44 Years | 218 (18.1%) | 237 (21.2%) |
| 45 to 54 Years | 110 (10.5%) | 172 (16.7%) |
| 55 to 64 Years | 32 (2.5%) | 42 (3.3%) |
| 65 to 74 Years | 174 (16.4%) | 26 (2.5%) |
| 75 Years and over | 26 (4.1%) | 98 (9.2%) |
| Total | 1,448 (15.1%) | 1,458 (15.2%) |
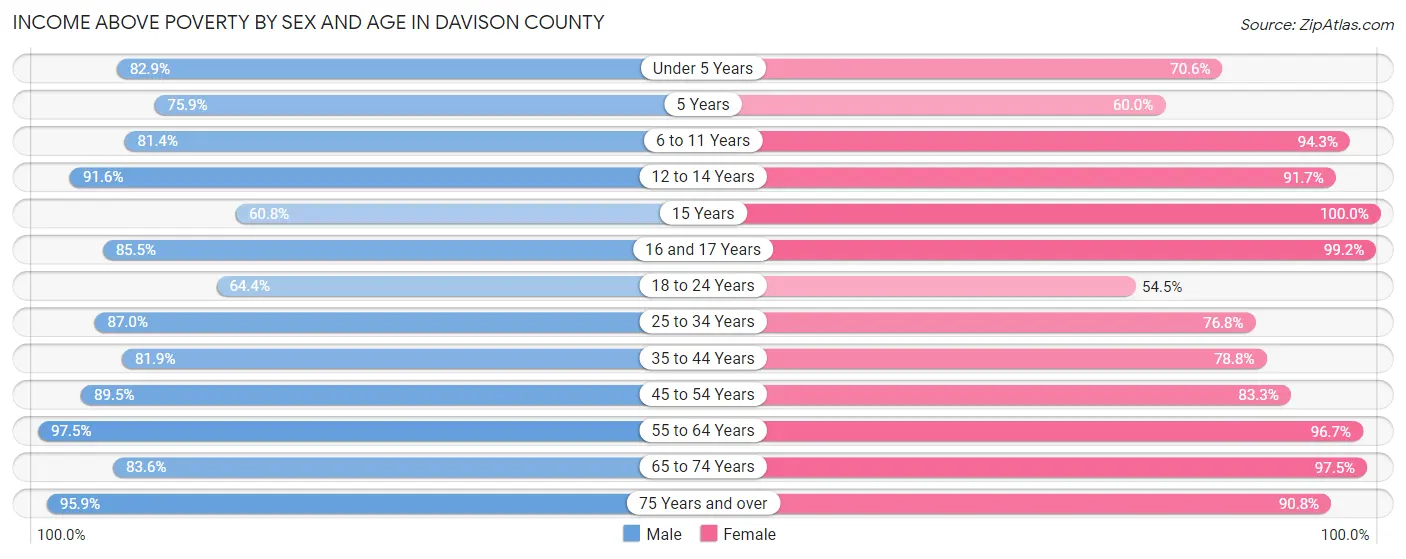
Income Above Poverty by Sex and Age in Davison County
According to the poverty statistics in Davison County, males aged 55 to 64 years and females aged 15 years are the age groups that are most secure financially, with 97.5% of males and 100.0% of females in these age groups living above the poverty line.
| Age Bracket | Male | Female |
| Under 5 Years | 436 (82.9%) | 493 (70.6%) |
| 5 Years | 186 (75.9%) | 36 (60.0%) |
| 6 to 11 Years | 575 (81.4%) | 626 (94.3%) |
| 12 to 14 Years | 271 (91.5%) | 395 (91.6%) |
| 15 Years | 192 (60.8%) | 129 (100.0%) |
| 16 and 17 Years | 112 (85.5%) | 235 (99.2%) |
| 18 to 24 Years | 470 (64.4%) | 361 (54.4%) |
| 25 to 34 Years | 1,206 (87.0%) | 911 (76.7%) |
| 35 to 44 Years | 987 (81.9%) | 880 (78.8%) |
| 45 to 54 Years | 938 (89.5%) | 858 (83.3%) |
| 55 to 64 Years | 1,249 (97.5%) | 1,230 (96.7%) |
| 65 to 74 Years | 886 (83.6%) | 998 (97.5%) |
| 75 Years and over | 604 (95.9%) | 966 (90.8%) |
| Total | 8,112 (84.9%) | 8,118 (84.8%) |
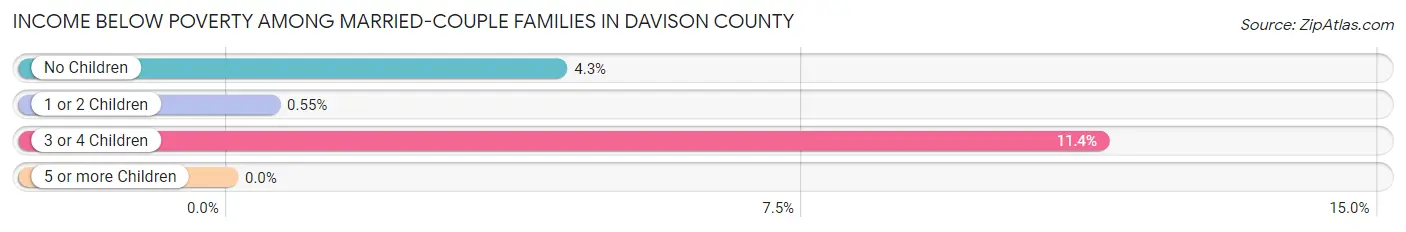
Income Below Poverty Among Married-Couple Families in Davison County
The poverty statistics for married-couple families in Davison County show that 4.5% or 171 of the total 3,786 families live below the poverty line. Families with 3 or 4 children have the highest poverty rate of 11.4%, comprising of 58 families. On the other hand, families with 5 or more children have the lowest poverty rate of 0.0%, which includes 0 families.
| Children | Above Poverty | Below Poverty |
| No Children | 2,425 (95.7%) | 109 (4.3%) |
| 1 or 2 Children | 717 (99.5%) | 4 (0.5%) |
| 3 or 4 Children | 452 (88.6%) | 58 (11.4%) |
| 5 or more Children | 21 (100.0%) | 0 (0.0%) |
| Total | 3,615 (95.5%) | 171 (4.5%) |
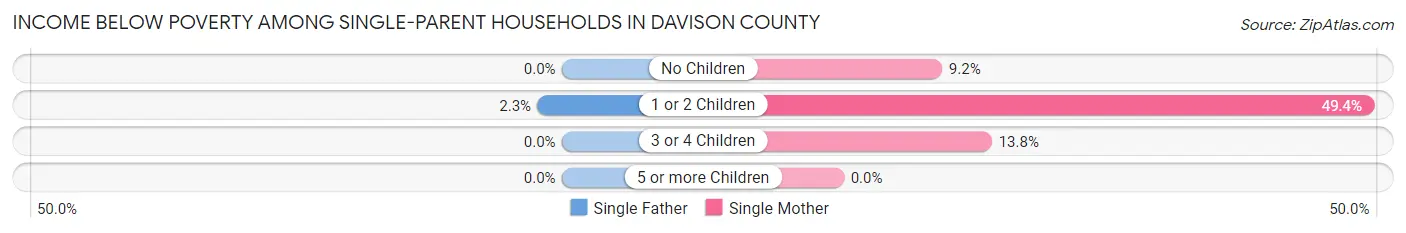
Income Below Poverty Among Single-Parent Households in Davison County
According to the poverty data in Davison County, 1.0% or 3 single-father households and 37.9% or 257 single-mother households are living below the poverty line. Among single-father households, those with 1 or 2 children have the highest poverty rate, with 3 households (2.3%) experiencing poverty. Likewise, among single-mother households, those with 1 or 2 children have the highest poverty rate, with 236 households (49.4%) falling below the poverty line.
| Children | Single Father | Single Mother |
| No Children | 0 (0.0%) | 13 (9.1%) |
| 1 or 2 Children | 3 (2.3%) | 236 (49.4%) |
| 3 or 4 Children | 0 (0.0%) | 8 (13.8%) |
| 5 or more Children | 0 (0.0%) | 0 (0.0%) |
| Total | 3 (1.0%) | 257 (37.9%) |
Income Below Poverty Among Married-Couple vs Single-Parent Households in Davison County
The poverty data for Davison County shows that 171 of the married-couple family households (4.5%) and 260 of the single-parent households (26.9%) are living below the poverty level. Within the married-couple family households, those with 3 or 4 children have the highest poverty rate, with 58 households (11.4%) falling below the poverty line. Among the single-parent households, those with 1 or 2 children have the highest poverty rate, with 239 household (39.2%) living below poverty.
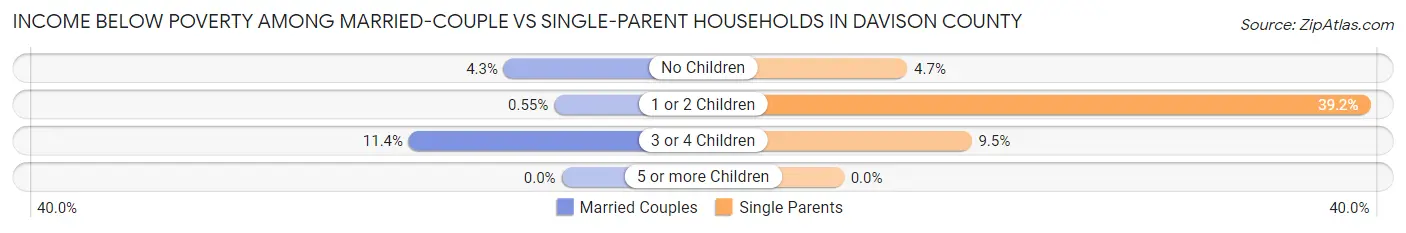
| Children | Married-Couple Families | Single-Parent Households |
| No Children | 109 (4.3%) | 13 (4.7%) |
| 1 or 2 Children | 4 (0.5%) | 239 (39.2%) |
| 3 or 4 Children | 58 (11.4%) | 8 (9.5%) |
| 5 or more Children | 0 (0.0%) | 0 (0.0%) |
| Total | 171 (4.5%) | 260 (26.9%) |
Employment Characteristics in Davison County
Employment by Class of Employer in Davison County
Among the 10,274 employed individuals in Davison County, private company employees (6,232 | 60.7%), not-for-profit organizations (1,309 | 12.7%), and self-employed (not incorporated) (952 | 9.3%) make up the most common classes of employment.
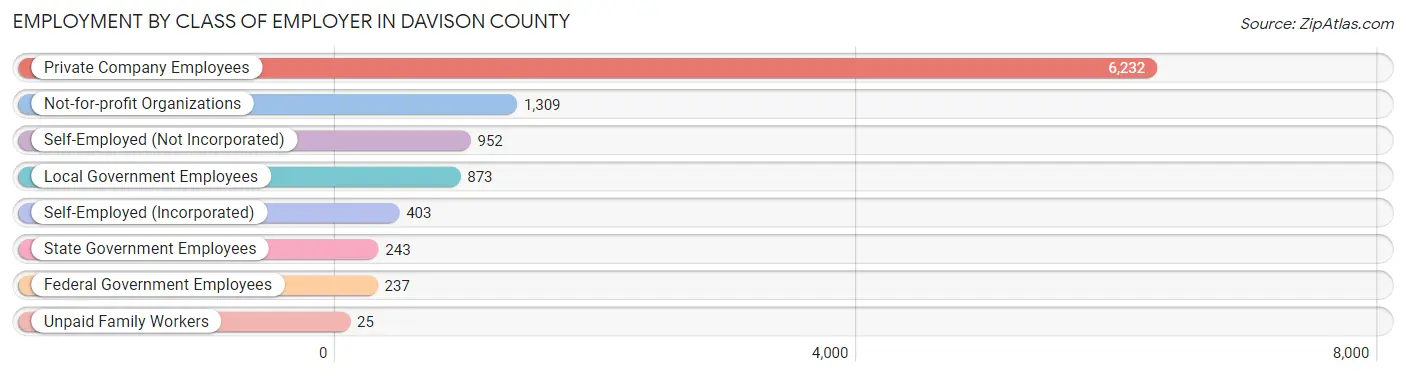
| Employer Class | # Employees | % Employees |
| Private Company Employees | 6,232 | 60.7% |
| Self-Employed (Incorporated) | 403 | 3.9% |
| Self-Employed (Not Incorporated) | 952 | 9.3% |
| Not-for-profit Organizations | 1,309 | 12.7% |
| Local Government Employees | 873 | 8.5% |
| State Government Employees | 243 | 2.4% |
| Federal Government Employees | 237 | 2.3% |
| Unpaid Family Workers | 25 | 0.2% |
| Total | 10,274 | 100.0% |
Employment Status by Age in Davison County
According to the labor force statistics for Davison County, out of the total population over 16 years of age (15,661), 67.7% or 10,602 individuals are in the labor force, with 1.4% or 148 of them unemployed. The age group with the highest labor force participation rate is 30 to 34 years, with 91.0% or 1,161 individuals in the labor force. Within the labor force, the 16 to 19 years age range has the highest percentage of unemployed individuals, with 8.5% or 46 of them being unemployed.
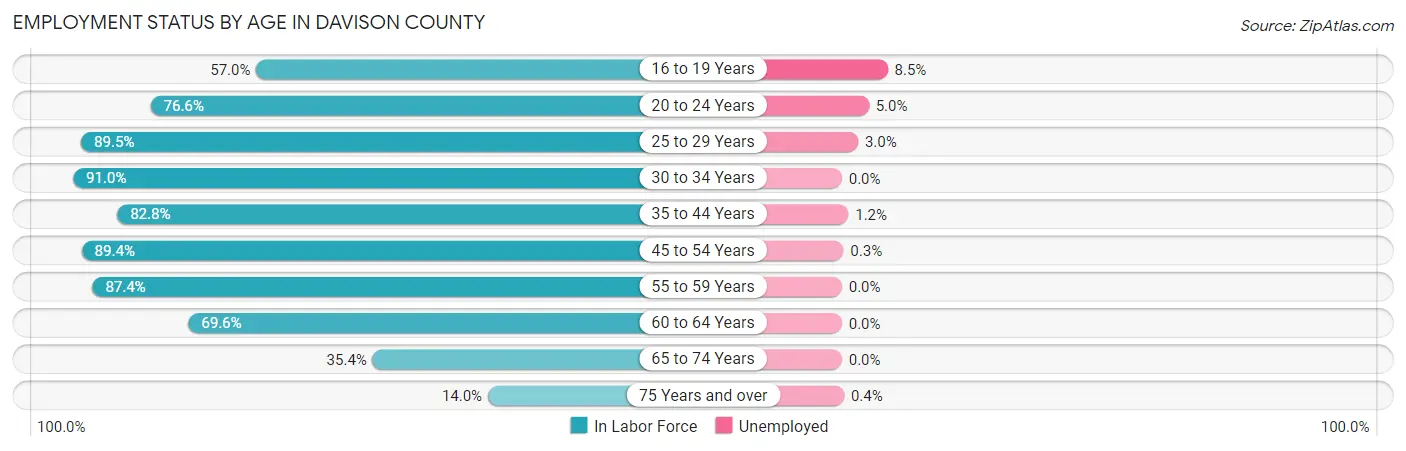
| Age Bracket | In Labor Force | Unemployed |
| 16 to 19 Years | 540 (57.0%) | 46 (8.5%) |
| 20 to 24 Years | 859 (76.6%) | 43 (5.0%) |
| 25 to 29 Years | 1,181 (89.5%) | 35 (3.0%) |
| 30 to 34 Years | 1,161 (91.0%) | 0 (0.0%) |
| 35 to 44 Years | 1,930 (82.8%) | 23 (1.2%) |
| 45 to 54 Years | 1,872 (89.4%) | 6 (0.3%) |
| 55 to 59 Years | 1,244 (87.4%) | 0 (0.0%) |
| 60 to 64 Years | 806 (69.6%) | 0 (0.0%) |
| 65 to 74 Years | 754 (35.4%) | 0 (0.0%) |
| 75 Years and over | 260 (14.0%) | 1 (0.4%) |
| Total | 10,602 (67.7%) | 148 (1.4%) |
Employment Status by Educational Attainment in Davison County
According to labor force statistics for Davison County, 85.3% of individuals (8,191) out of the total population between 25 and 64 years of age (9,602) are in the labor force, with 0.8% or 66 of them being unemployed. The group with the highest labor force participation rate are those with the educational attainment of bachelor's degree or higher, with 93.6% or 2,209 individuals in the labor force. Within the labor force, individuals with high school diploma education have the highest percentage of unemployment, with 1.9% or 47 of them being unemployed.
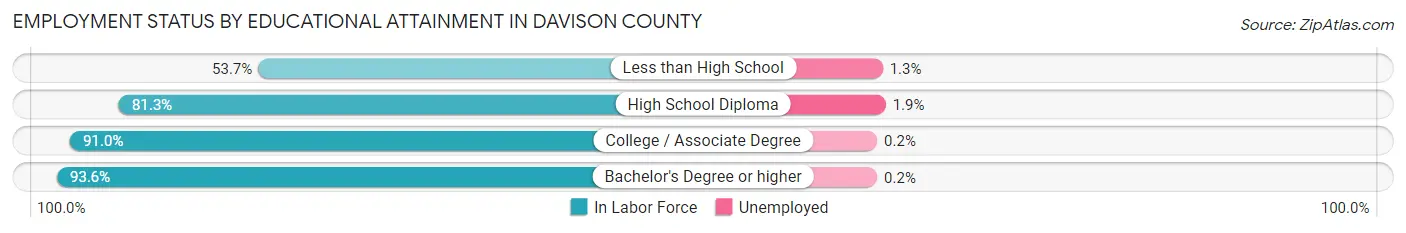
| Educational Attainment | In Labor Force | Unemployed |
| Less than High School | 449 (53.7%) | 11 (1.3%) |
| High School Diploma | 2,485 (81.3%) | 58 (1.9%) |
| College / Associate Degree | 3,048 (91.0%) | 7 (0.2%) |
| Bachelor's Degree or higher | 2,209 (93.6%) | 5 (0.2%) |
| Total | 8,191 (85.3%) | 77 (0.8%) |
Employment Occupations by Sex in Davison County
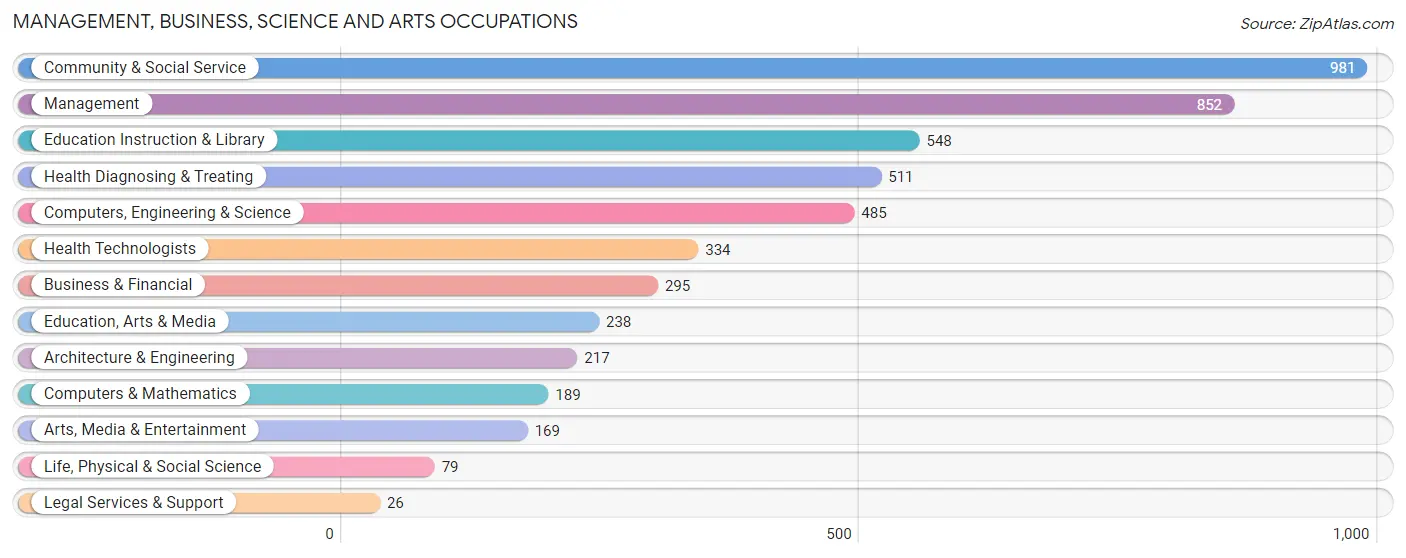
Management, Business, Science and Arts Occupations
The most common Management, Business, Science and Arts occupations in Davison County are Community & Social Service (981 | 9.4%), Management (852 | 8.2%), Education Instruction & Library (548 | 5.2%), Health Diagnosing & Treating (511 | 4.9%), and Computers, Engineering & Science (485 | 4.6%).
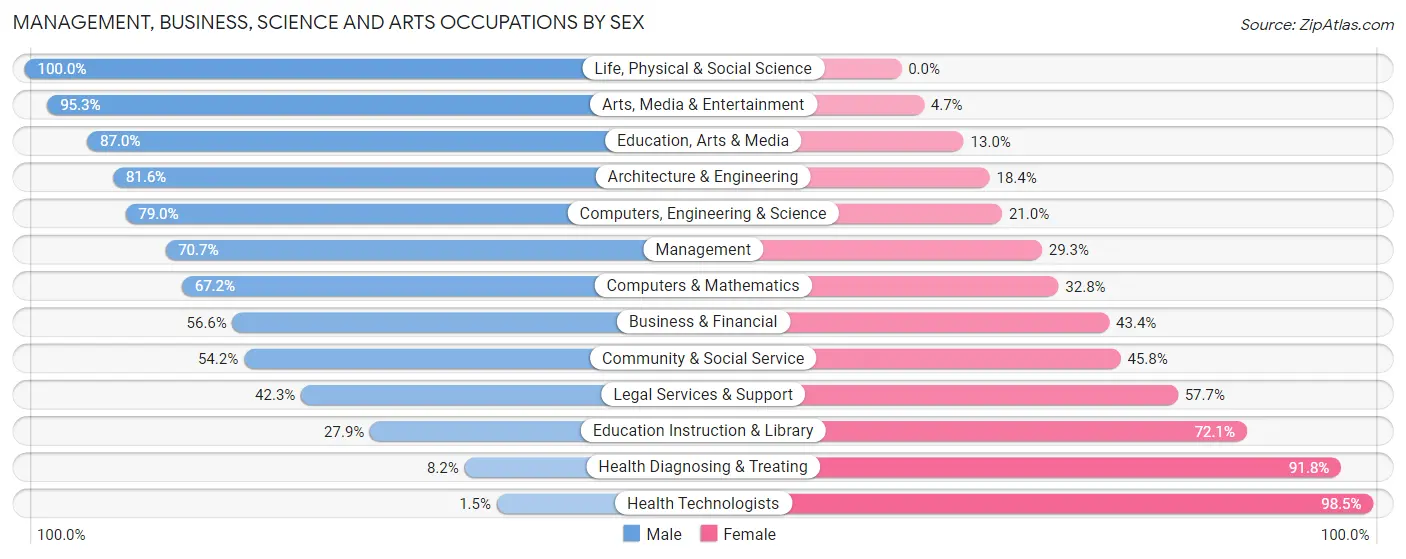
Management, Business, Science and Arts Occupations by Sex
Within the Management, Business, Science and Arts occupations in Davison County, the most male-oriented occupations are Life, Physical & Social Science (100.0%), Arts, Media & Entertainment (95.3%), and Education, Arts & Media (87.0%), while the most female-oriented occupations are Health Technologists (98.5%), Health Diagnosing & Treating (91.8%), and Education Instruction & Library (72.1%).
| Occupation | Male | Female |
| Management | 602 (70.7%) | 250 (29.3%) |
| Business & Financial | 167 (56.6%) | 128 (43.4%) |
| Computers, Engineering & Science | 383 (79.0%) | 102 (21.0%) |
| Computers & Mathematics | 127 (67.2%) | 62 (32.8%) |
| Architecture & Engineering | 177 (81.6%) | 40 (18.4%) |
| Life, Physical & Social Science | 79 (100.0%) | 0 (0.0%) |
| Community & Social Service | 532 (54.2%) | 449 (45.8%) |
| Education, Arts & Media | 207 (87.0%) | 31 (13.0%) |
| Legal Services & Support | 11 (42.3%) | 15 (57.7%) |
| Education Instruction & Library | 153 (27.9%) | 395 (72.1%) |
| Arts, Media & Entertainment | 161 (95.3%) | 8 (4.7%) |
| Health Diagnosing & Treating | 42 (8.2%) | 469 (91.8%) |
| Health Technologists | 5 (1.5%) | 329 (98.5%) |
| Total (Category) | 1,726 (55.2%) | 1,398 (44.8%) |
| Total (Overall) | 5,465 (52.4%) | 4,968 (47.6%) |
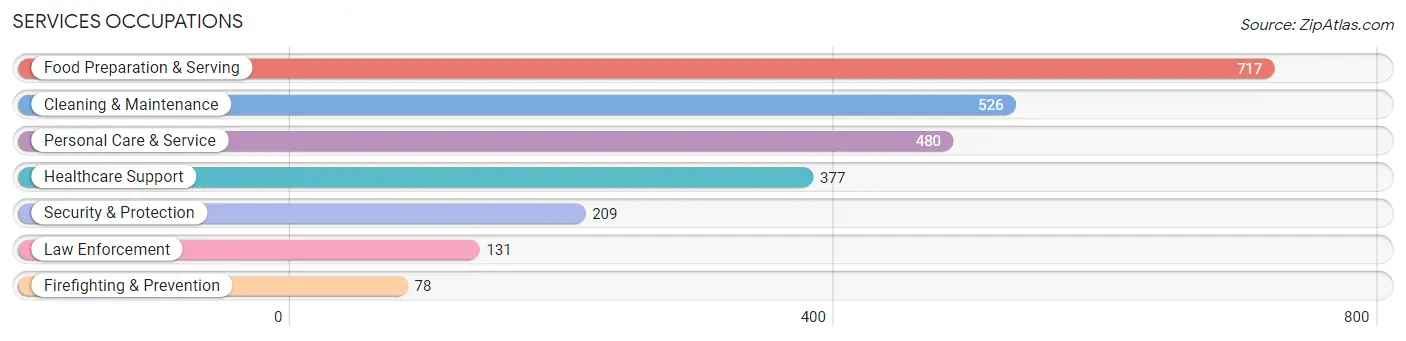
Services Occupations
The most common Services occupations in Davison County are Food Preparation & Serving (717 | 6.9%), Cleaning & Maintenance (526 | 5.0%), Personal Care & Service (480 | 4.6%), Healthcare Support (377 | 3.6%), and Security & Protection (209 | 2.0%).
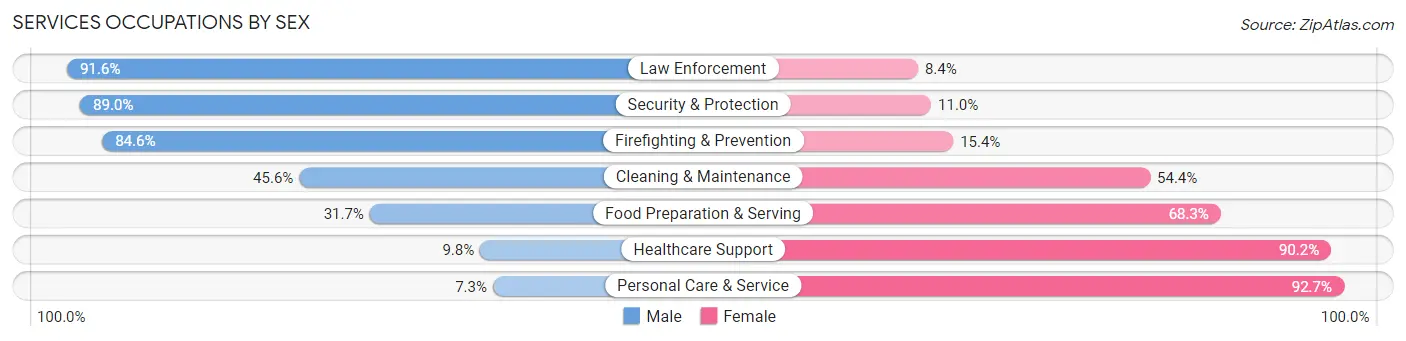
Services Occupations by Sex
Within the Services occupations in Davison County, the most male-oriented occupations are Law Enforcement (91.6%), Security & Protection (89.0%), and Firefighting & Prevention (84.6%), while the most female-oriented occupations are Personal Care & Service (92.7%), Healthcare Support (90.2%), and Food Preparation & Serving (68.3%).
| Occupation | Male | Female |
| Healthcare Support | 37 (9.8%) | 340 (90.2%) |
| Security & Protection | 186 (89.0%) | 23 (11.0%) |
| Firefighting & Prevention | 66 (84.6%) | 12 (15.4%) |
| Law Enforcement | 120 (91.6%) | 11 (8.4%) |
| Food Preparation & Serving | 227 (31.7%) | 490 (68.3%) |
| Cleaning & Maintenance | 240 (45.6%) | 286 (54.4%) |
| Personal Care & Service | 35 (7.3%) | 445 (92.7%) |
| Total (Category) | 725 (31.4%) | 1,584 (68.6%) |
| Total (Overall) | 5,465 (52.4%) | 4,968 (47.6%) |
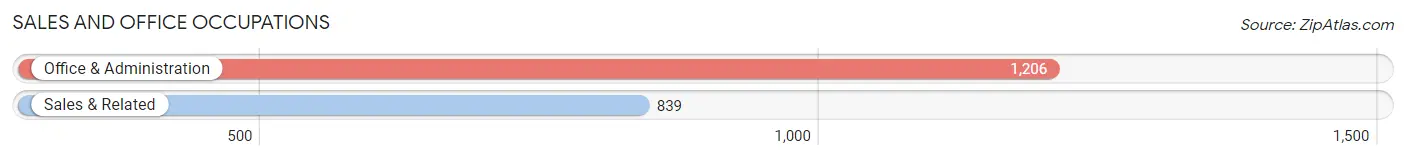
Sales and Office Occupations
The most common Sales and Office occupations in Davison County are Office & Administration (1,206 | 11.6%), and Sales & Related (839 | 8.0%).
Sales and Office Occupations by Sex
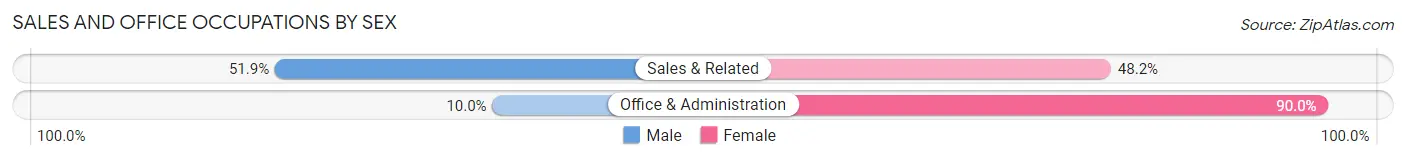
| Occupation | Male | Female |
| Sales & Related | 435 (51.8%) | 404 (48.1%) |
| Office & Administration | 121 (10.0%) | 1,085 (90.0%) |
| Total (Category) | 556 (27.2%) | 1,489 (72.8%) |
| Total (Overall) | 5,465 (52.4%) | 4,968 (47.6%) |
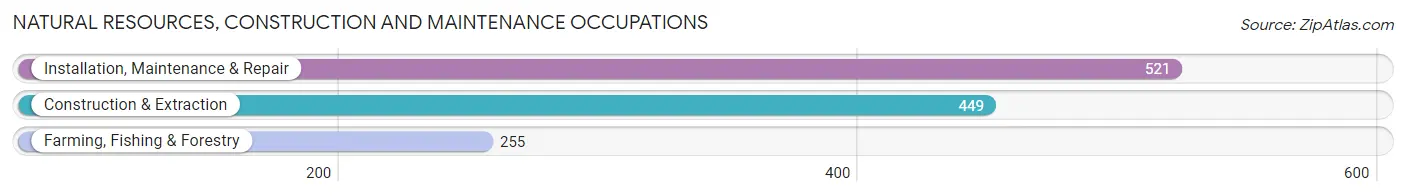
Natural Resources, Construction and Maintenance Occupations
The most common Natural Resources, Construction and Maintenance occupations in Davison County are Installation, Maintenance & Repair (521 | 5.0%), Construction & Extraction (449 | 4.3%), and Farming, Fishing & Forestry (255 | 2.4%).
Natural Resources, Construction and Maintenance Occupations by Sex
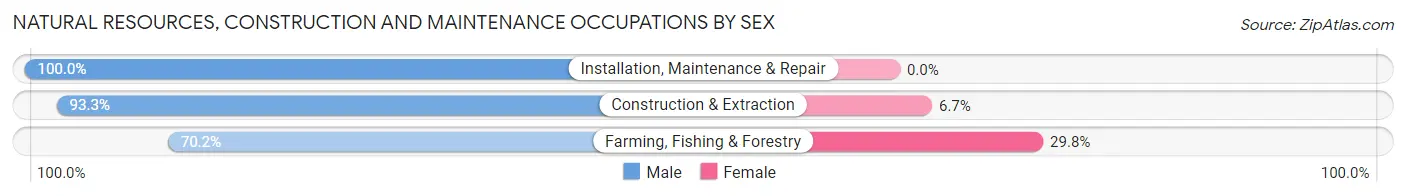
| Occupation | Male | Female |
| Farming, Fishing & Forestry | 179 (70.2%) | 76 (29.8%) |
| Construction & Extraction | 419 (93.3%) | 30 (6.7%) |
| Installation, Maintenance & Repair | 521 (100.0%) | 0 (0.0%) |
| Total (Category) | 1,119 (91.3%) | 106 (8.6%) |
| Total (Overall) | 5,465 (52.4%) | 4,968 (47.6%) |
Production, Transportation and Moving Occupations
The most common Production, Transportation and Moving occupations in Davison County are Production (708 | 6.8%), Material Moving (670 | 6.4%), and Transportation (352 | 3.4%).
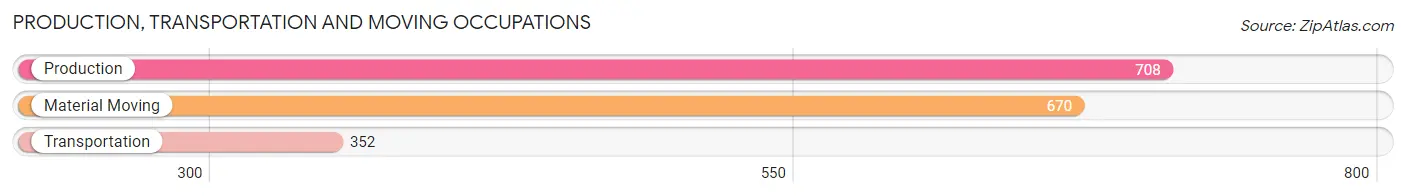
Production, Transportation and Moving Occupations by Sex
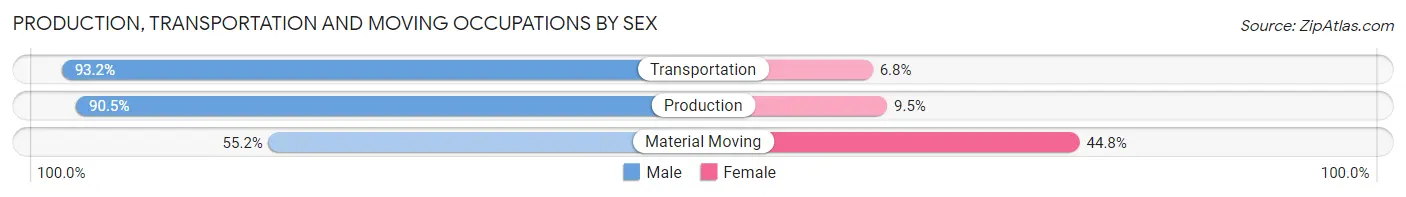
| Occupation | Male | Female |
| Production | 641 (90.5%) | 67 (9.5%) |
| Transportation | 328 (93.2%) | 24 (6.8%) |
| Material Moving | 370 (55.2%) | 300 (44.8%) |
| Total (Category) | 1,339 (77.4%) | 391 (22.6%) |
| Total (Overall) | 5,465 (52.4%) | 4,968 (47.6%) |
Employment Industries by Sex in Davison County
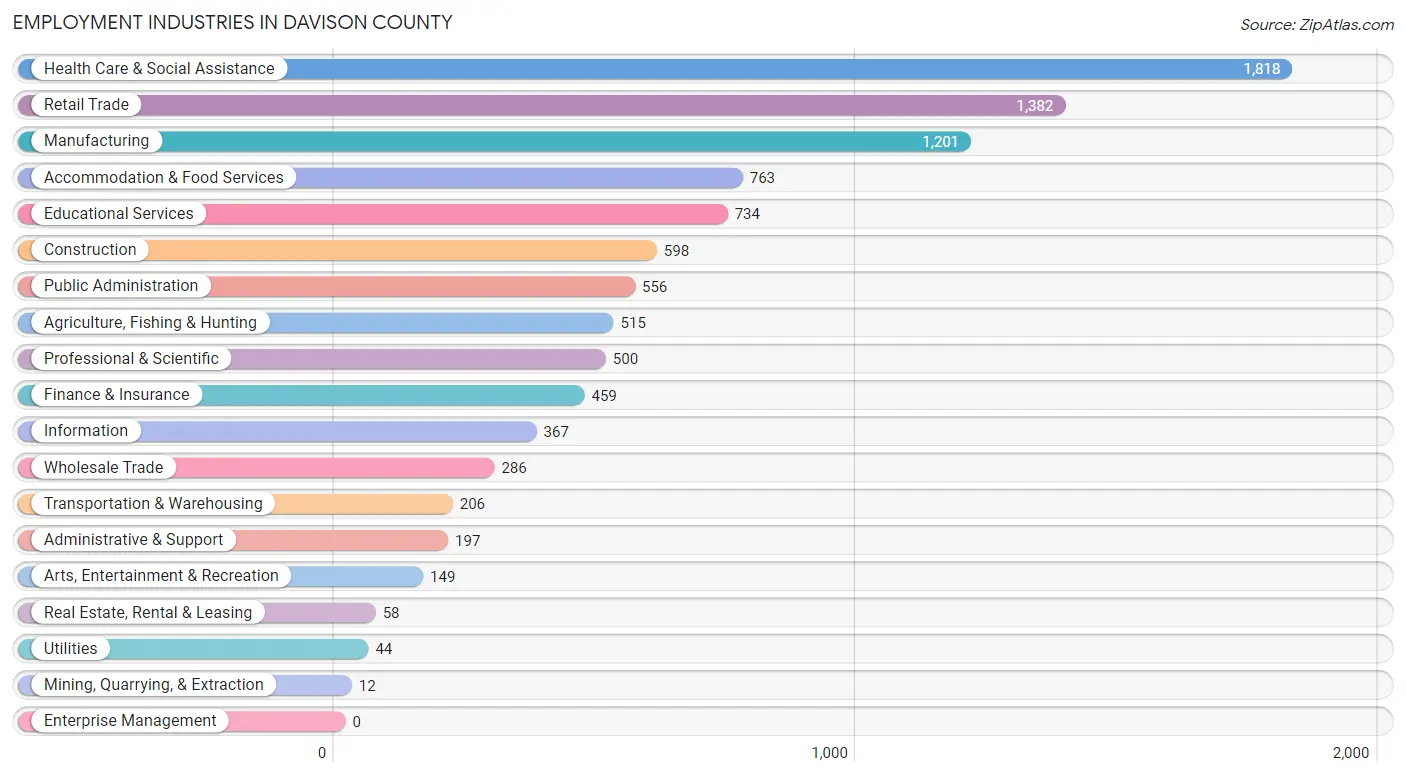
Employment Industries in Davison County
The major employment industries in Davison County include Health Care & Social Assistance (1,818 | 17.4%), Retail Trade (1,382 | 13.3%), Manufacturing (1,201 | 11.5%), Accommodation & Food Services (763 | 7.3%), and Educational Services (734 | 7.0%).
Employment Industries by Sex in Davison County
The Davison County industries that see more men than women are Mining, Quarrying, & Extraction (100.0%), Utilities (100.0%), and Information (91.0%), whereas the industries that tend to have a higher number of women are Health Care & Social Assistance (89.3%), Real Estate, Rental & Leasing (84.5%), and Finance & Insurance (79.7%).
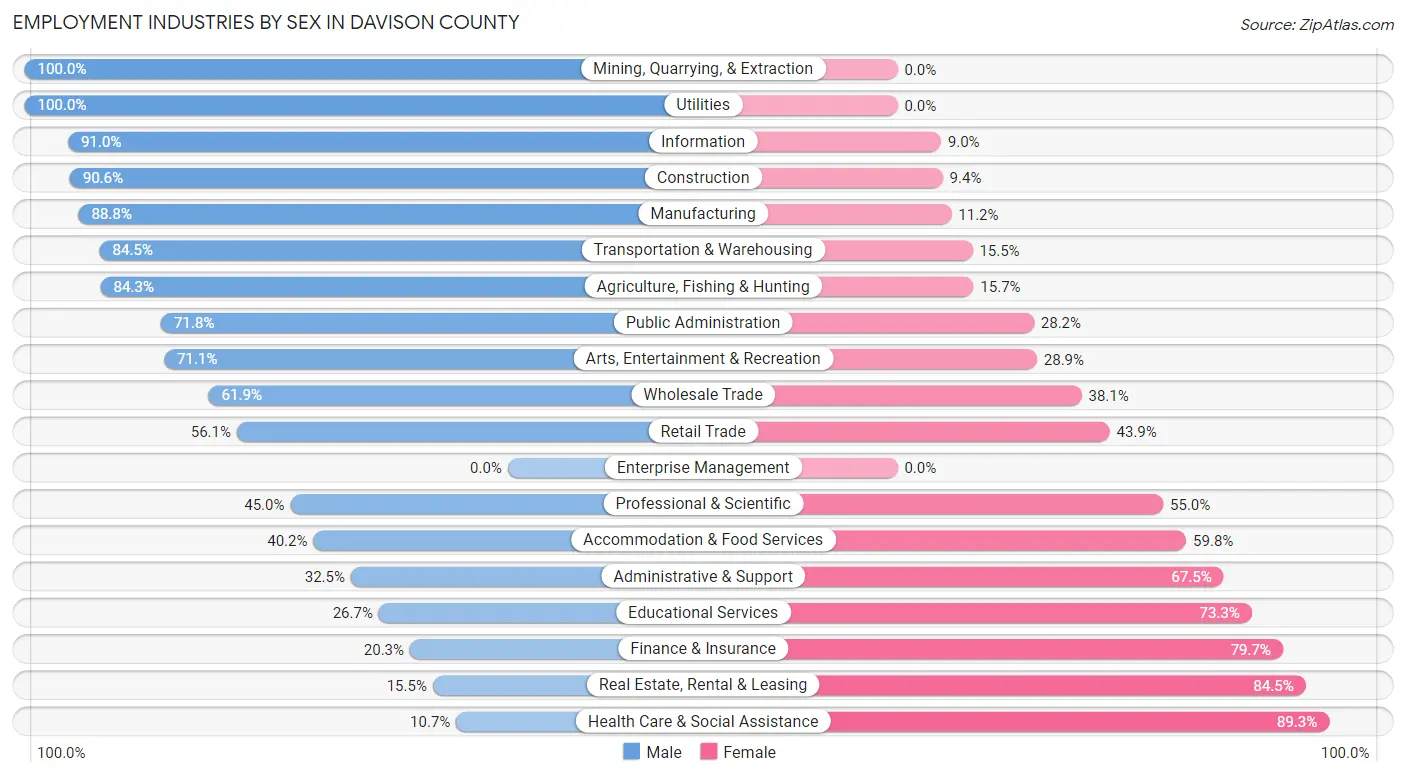
| Industry | Male | Female |
| Agriculture, Fishing & Hunting | 434 (84.3%) | 81 (15.7%) |
| Mining, Quarrying, & Extraction | 12 (100.0%) | 0 (0.0%) |
| Construction | 542 (90.6%) | 56 (9.4%) |
| Manufacturing | 1,067 (88.8%) | 134 (11.2%) |
| Wholesale Trade | 177 (61.9%) | 109 (38.1%) |
| Retail Trade | 775 (56.1%) | 607 (43.9%) |
| Transportation & Warehousing | 174 (84.5%) | 32 (15.5%) |
| Utilities | 44 (100.0%) | 0 (0.0%) |
| Information | 334 (91.0%) | 33 (9.0%) |
| Finance & Insurance | 93 (20.3%) | 366 (79.7%) |
| Real Estate, Rental & Leasing | 9 (15.5%) | 49 (84.5%) |
| Professional & Scientific | 225 (45.0%) | 275 (55.0%) |
| Enterprise Management | 0 (0.0%) | 0 (0.0%) |
| Administrative & Support | 64 (32.5%) | 133 (67.5%) |
| Educational Services | 196 (26.7%) | 538 (73.3%) |
| Health Care & Social Assistance | 194 (10.7%) | 1,624 (89.3%) |
| Arts, Entertainment & Recreation | 106 (71.1%) | 43 (28.9%) |
| Accommodation & Food Services | 307 (40.2%) | 456 (59.8%) |
| Public Administration | 399 (71.8%) | 157 (28.2%) |
| Total | 5,465 (52.4%) | 4,968 (47.6%) |
Education in Davison County
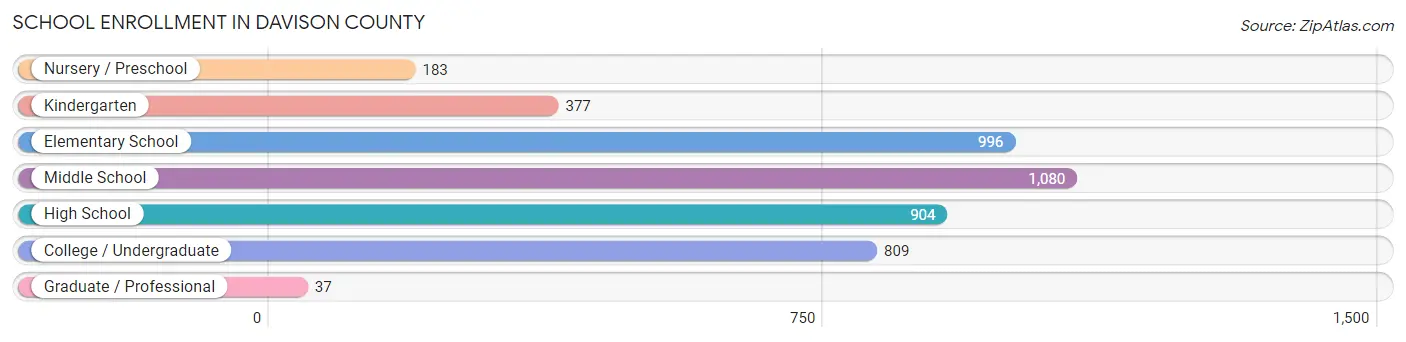
School Enrollment in Davison County
The most common levels of schooling among the 4,386 students in Davison County are middle school (1,080 | 24.6%), elementary school (996 | 22.7%), and high school (904 | 20.6%).
| School Level | # Students | % Students |
| Nursery / Preschool | 183 | 4.2% |
| Kindergarten | 377 | 8.6% |
| Elementary School | 996 | 22.7% |
| Middle School | 1,080 | 24.6% |
| High School | 904 | 20.6% |
| College / Undergraduate | 809 | 18.4% |
| Graduate / Professional | 37 | 0.8% |
| Total | 4,386 | 100.0% |
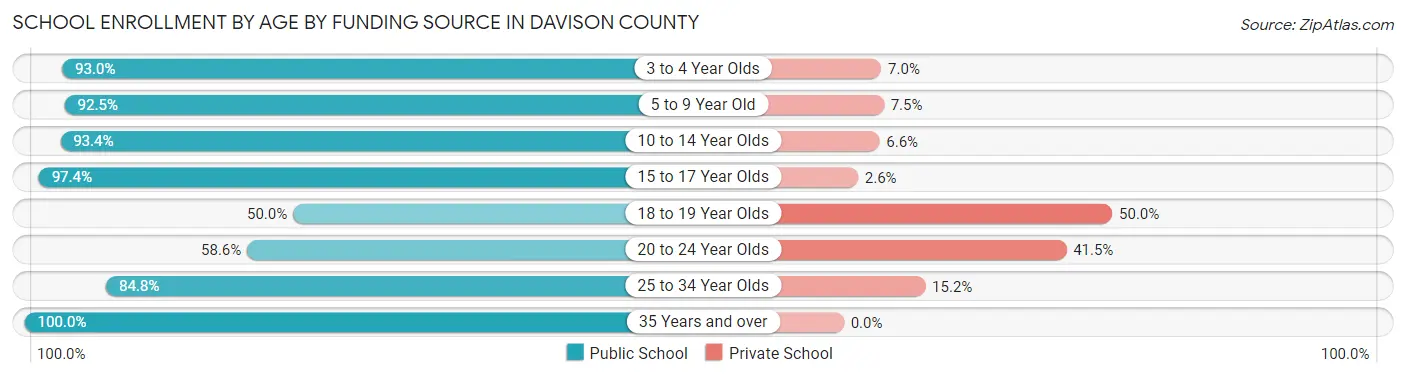
School Enrollment by Age by Funding Source in Davison County
Out of a total of 4,386 students who are enrolled in schools in Davison County, 588 (13.4%) attend a private institution, while the remaining 3,798 (86.6%) are enrolled in public schools. The age group of 18 to 19 year olds has the highest likelihood of being enrolled in private schools, with 194 (50.0% in the age bracket) enrolled. Conversely, the age group of 35 years and over has the lowest likelihood of being enrolled in a private school, with 50 (100.0% in the age bracket) attending a public institution.
| Age Bracket | Public School | Private School |
| 3 to 4 Year Olds | 120 (93.0%) | 9 (7.0%) |
| 5 to 9 Year Old | 1,154 (92.5%) | 93 (7.5%) |
| 10 to 14 Year Olds | 1,167 (93.4%) | 83 (6.6%) |
| 15 to 17 Year Olds | 774 (97.4%) | 21 (2.6%) |
| 18 to 19 Year Olds | 194 (50.0%) | 194 (50.0%) |
| 20 to 24 Year Olds | 243 (58.6%) | 172 (41.4%) |
| 25 to 34 Year Olds | 95 (84.8%) | 17 (15.2%) |
| 35 Years and over | 50 (100.0%) | 0 (0.0%) |
| Total | 3,798 (86.6%) | 588 (13.4%) |
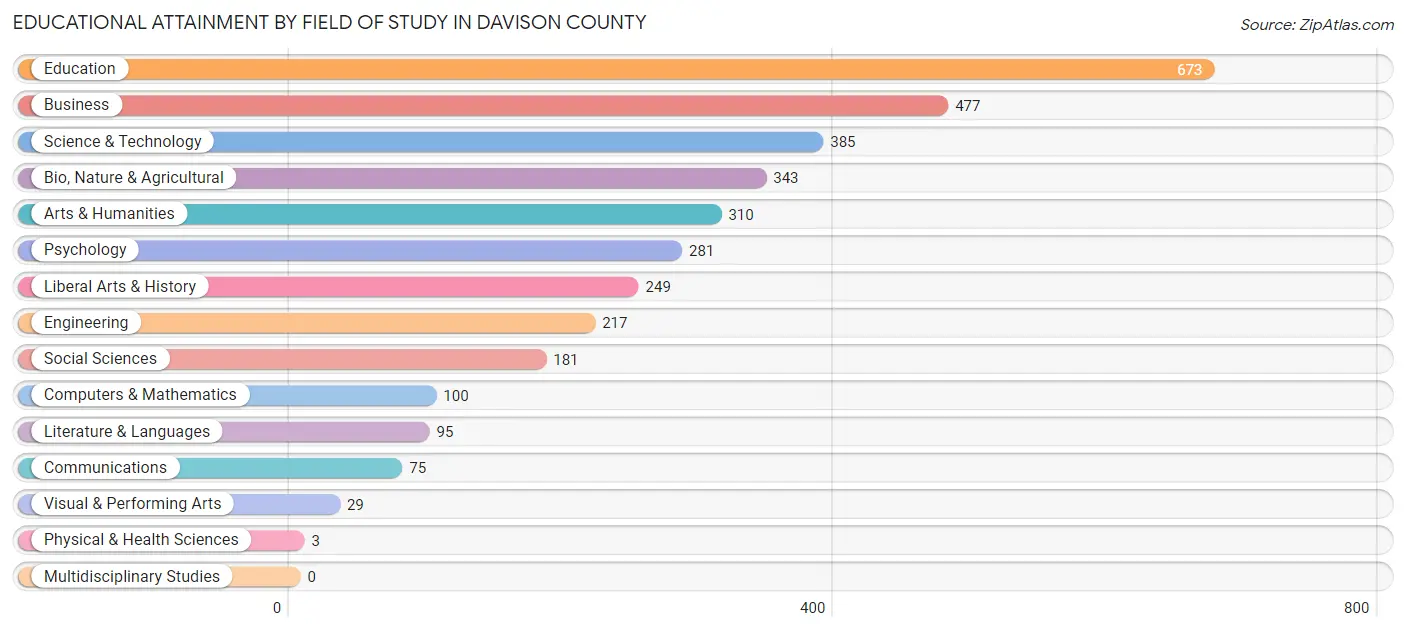
Educational Attainment by Field of Study in Davison County
Education (673 | 19.7%), business (477 | 14.0%), science & technology (385 | 11.3%), bio, nature & agricultural (343 | 10.0%), and arts & humanities (310 | 9.1%) are the most common fields of study among 3,418 individuals in Davison County who have obtained a bachelor's degree or higher.
| Field of Study | # Graduates | % Graduates |
| Computers & Mathematics | 100 | 2.9% |
| Bio, Nature & Agricultural | 343 | 10.0% |
| Physical & Health Sciences | 3 | 0.1% |
| Psychology | 281 | 8.2% |
| Social Sciences | 181 | 5.3% |
| Engineering | 217 | 6.4% |
| Multidisciplinary Studies | 0 | 0.0% |
| Science & Technology | 385 | 11.3% |
| Business | 477 | 14.0% |
| Education | 673 | 19.7% |
| Literature & Languages | 95 | 2.8% |
| Liberal Arts & History | 249 | 7.3% |
| Visual & Performing Arts | 29 | 0.9% |
| Communications | 75 | 2.2% |
| Arts & Humanities | 310 | 9.1% |
| Total | 3,418 | 100.0% |
Transportation & Commute in Davison County
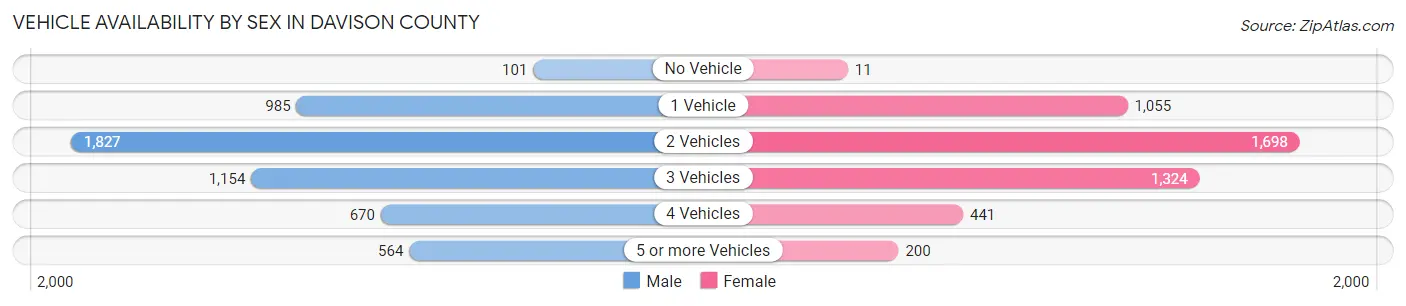
Vehicle Availability by Sex in Davison County
The most prevalent vehicle ownership categories in Davison County are males with 2 vehicles (1,827, accounting for 34.5%) and females with 2 vehicles (1,698, making up 38.6%).
| Vehicles Available | Male | Female |
| No Vehicle | 101 (1.9%) | 11 (0.2%) |
| 1 Vehicle | 985 (18.6%) | 1,055 (22.3%) |
| 2 Vehicles | 1,827 (34.5%) | 1,698 (35.9%) |
| 3 Vehicles | 1,154 (21.8%) | 1,324 (28.0%) |
| 4 Vehicles | 670 (12.6%) | 441 (9.3%) |
| 5 or more Vehicles | 564 (10.6%) | 200 (4.2%) |
| Total | 5,301 (100.0%) | 4,729 (100.0%) |
Commute Time in Davison County
The most frequently occuring commute durations in Davison County are 5 to 9 minutes (3,291 commuters, 34.7%), 10 to 14 minutes (2,351 commuters, 24.8%), and 15 to 19 minutes (1,329 commuters, 14.0%).
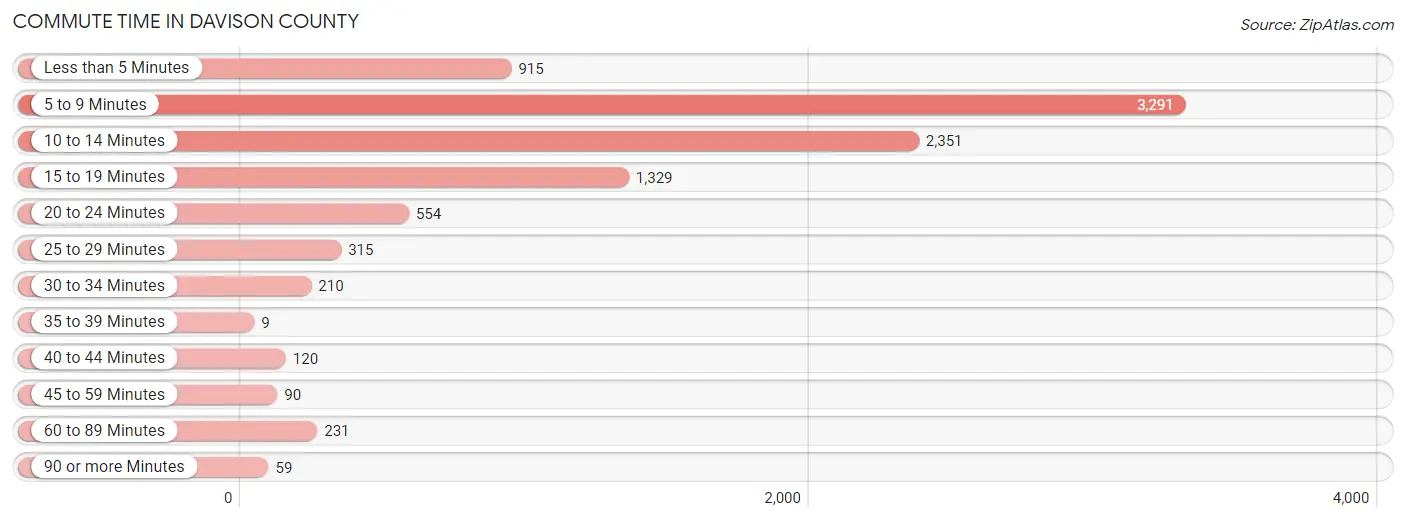
| Commute Time | # Commuters | % Commuters |
| Less than 5 Minutes | 915 | 9.7% |
| 5 to 9 Minutes | 3,291 | 34.7% |
| 10 to 14 Minutes | 2,351 | 24.8% |
| 15 to 19 Minutes | 1,329 | 14.0% |
| 20 to 24 Minutes | 554 | 5.9% |
| 25 to 29 Minutes | 315 | 3.3% |
| 30 to 34 Minutes | 210 | 2.2% |
| 35 to 39 Minutes | 9 | 0.1% |
| 40 to 44 Minutes | 120 | 1.3% |
| 45 to 59 Minutes | 90 | 0.9% |
| 60 to 89 Minutes | 231 | 2.4% |
| 90 or more Minutes | 59 | 0.6% |
Commute Time by Sex in Davison County
The most common commute times in Davison County are 5 to 9 minutes (1,673 commuters, 32.4%) for males and 5 to 9 minutes (1,618 commuters, 37.5%) for females.
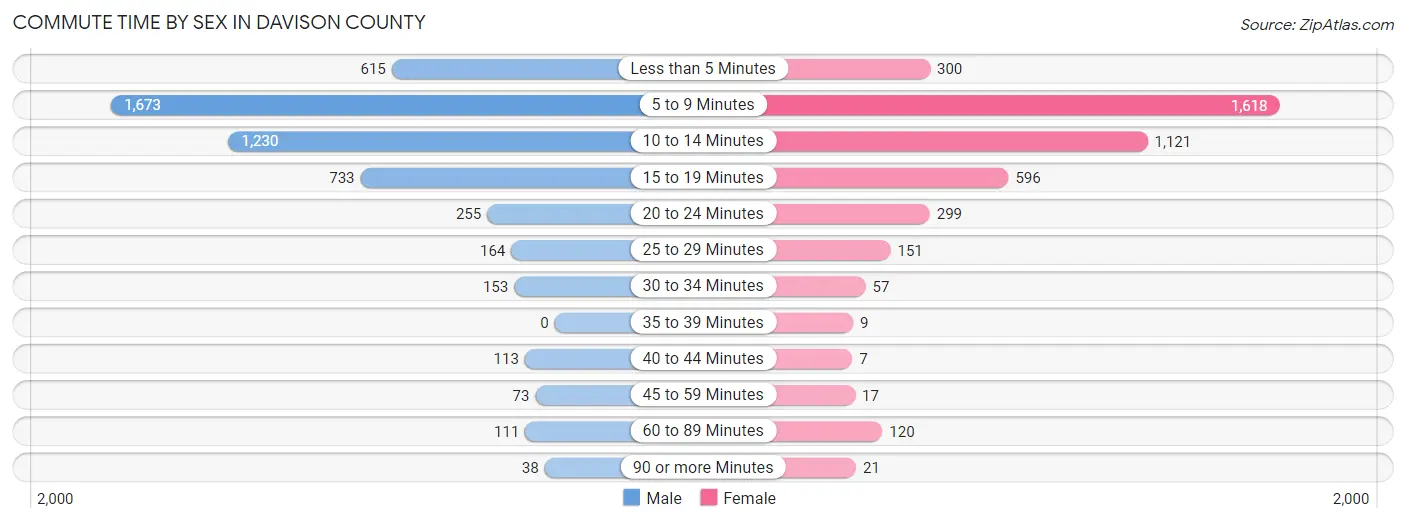
| Commute Time | Male | Female |
| Less than 5 Minutes | 615 (11.9%) | 300 (7.0%) |
| 5 to 9 Minutes | 1,673 (32.4%) | 1,618 (37.5%) |
| 10 to 14 Minutes | 1,230 (23.8%) | 1,121 (26.0%) |
| 15 to 19 Minutes | 733 (14.2%) | 596 (13.8%) |
| 20 to 24 Minutes | 255 (4.9%) | 299 (6.9%) |
| 25 to 29 Minutes | 164 (3.2%) | 151 (3.5%) |
| 30 to 34 Minutes | 153 (3.0%) | 57 (1.3%) |
| 35 to 39 Minutes | 0 (0.0%) | 9 (0.2%) |
| 40 to 44 Minutes | 113 (2.2%) | 7 (0.2%) |
| 45 to 59 Minutes | 73 (1.4%) | 17 (0.4%) |
| 60 to 89 Minutes | 111 (2.1%) | 120 (2.8%) |
| 90 or more Minutes | 38 (0.7%) | 21 (0.5%) |
Time of Departure to Work by Sex in Davison County
The most frequent times of departure to work in Davison County are 7:30 AM to 7:59 AM (1,162, 22.5%) for males and 7:30 AM to 7:59 AM (1,238, 28.7%) for females.
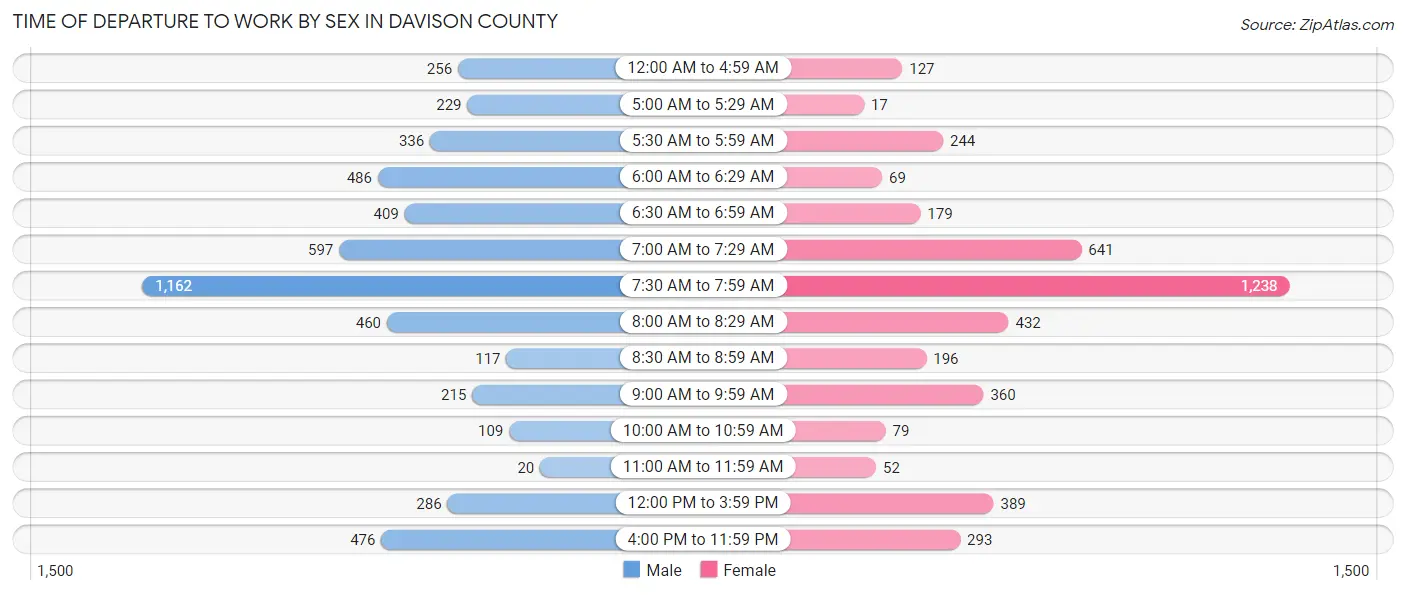
| Time of Departure | Male | Female |
| 12:00 AM to 4:59 AM | 256 (5.0%) | 127 (2.9%) |
| 5:00 AM to 5:29 AM | 229 (4.4%) | 17 (0.4%) |
| 5:30 AM to 5:59 AM | 336 (6.5%) | 244 (5.7%) |
| 6:00 AM to 6:29 AM | 486 (9.4%) | 69 (1.6%) |
| 6:30 AM to 6:59 AM | 409 (7.9%) | 179 (4.2%) |
| 7:00 AM to 7:29 AM | 597 (11.6%) | 641 (14.8%) |
| 7:30 AM to 7:59 AM | 1,162 (22.5%) | 1,238 (28.7%) |
| 8:00 AM to 8:29 AM | 460 (8.9%) | 432 (10.0%) |
| 8:30 AM to 8:59 AM | 117 (2.3%) | 196 (4.5%) |
| 9:00 AM to 9:59 AM | 215 (4.2%) | 360 (8.3%) |
| 10:00 AM to 10:59 AM | 109 (2.1%) | 79 (1.8%) |
| 11:00 AM to 11:59 AM | 20 (0.4%) | 52 (1.2%) |
| 12:00 PM to 3:59 PM | 286 (5.5%) | 389 (9.0%) |
| 4:00 PM to 11:59 PM | 476 (9.2%) | 293 (6.8%) |
| Total | 5,158 (100.0%) | 4,316 (100.0%) |
Housing Occupancy in Davison County
Occupancy by Ownership in Davison County
Of the total 8,448 dwellings in Davison County, owner-occupied units account for 5,306 (62.8%), while renter-occupied units make up 3,142 (37.2%).
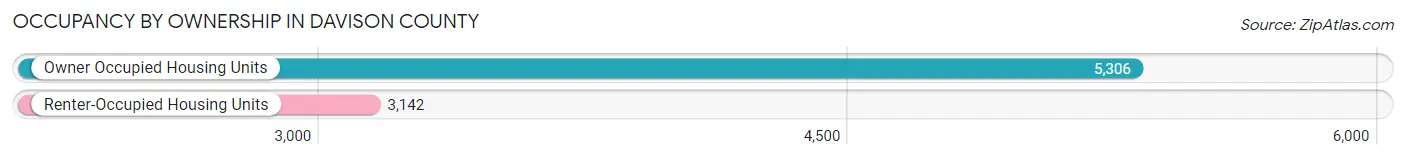
| Occupancy | # Housing Units | % Housing Units |
| Owner Occupied Housing Units | 5,306 | 62.8% |
| Renter-Occupied Housing Units | 3,142 | 37.2% |
| Total Occupied Housing Units | 8,448 | 100.0% |
Occupancy by Household Size in Davison County
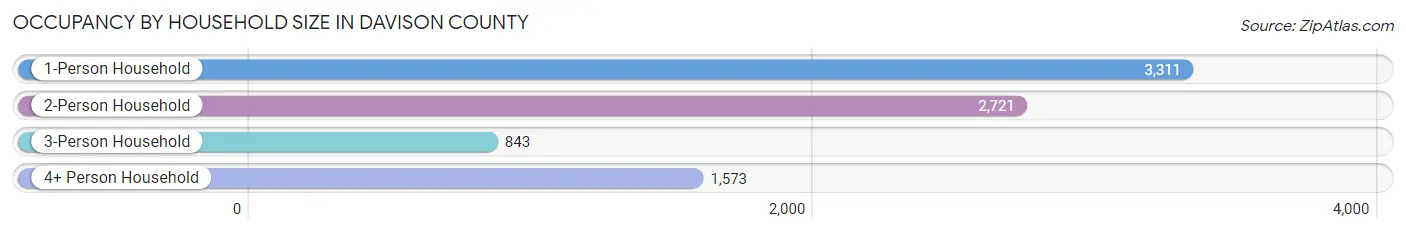
| Household Size | # Housing Units | % Housing Units |
| 1-Person Household | 3,311 | 39.2% |
| 2-Person Household | 2,721 | 32.2% |
| 3-Person Household | 843 | 10.0% |
| 4+ Person Household | 1,573 | 18.6% |
| Total Housing Units | 8,448 | 100.0% |
Occupancy by Ownership by Household Size in Davison County
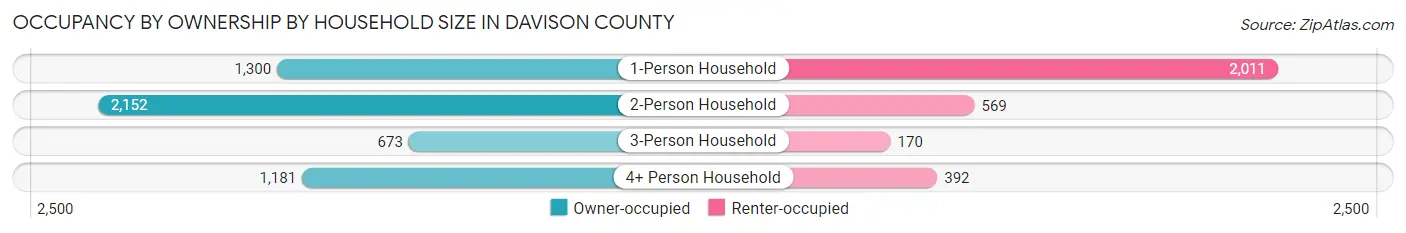
| Household Size | Owner-occupied | Renter-occupied |
| 1-Person Household | 1,300 (39.3%) | 2,011 (60.7%) |
| 2-Person Household | 2,152 (79.1%) | 569 (20.9%) |
| 3-Person Household | 673 (79.8%) | 170 (20.2%) |
| 4+ Person Household | 1,181 (75.1%) | 392 (24.9%) |
| Total Housing Units | 5,306 (62.8%) | 3,142 (37.2%) |
Occupancy by Educational Attainment in Davison County
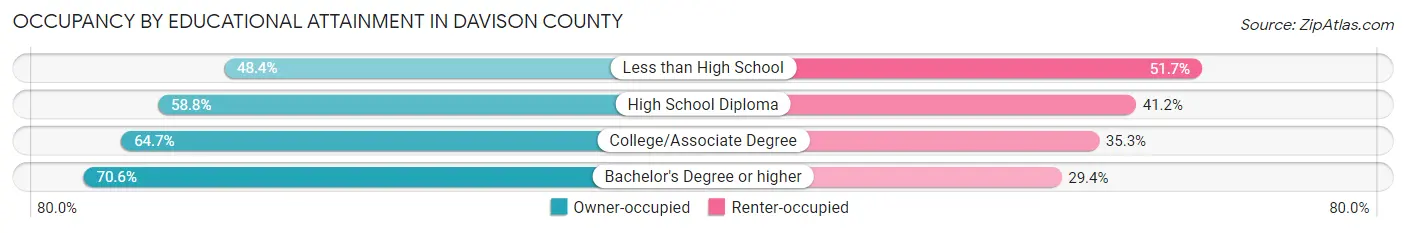
| Household Size | Owner-occupied | Renter-occupied |
| Less than High School | 322 (48.3%) | 344 (51.6%) |
| High School Diploma | 1,627 (58.8%) | 1,139 (41.2%) |
| College/Associate Degree | 2,019 (64.7%) | 1,103 (35.3%) |
| Bachelor's Degree or higher | 1,338 (70.6%) | 556 (29.4%) |
Occupancy by Age of Householder in Davison County
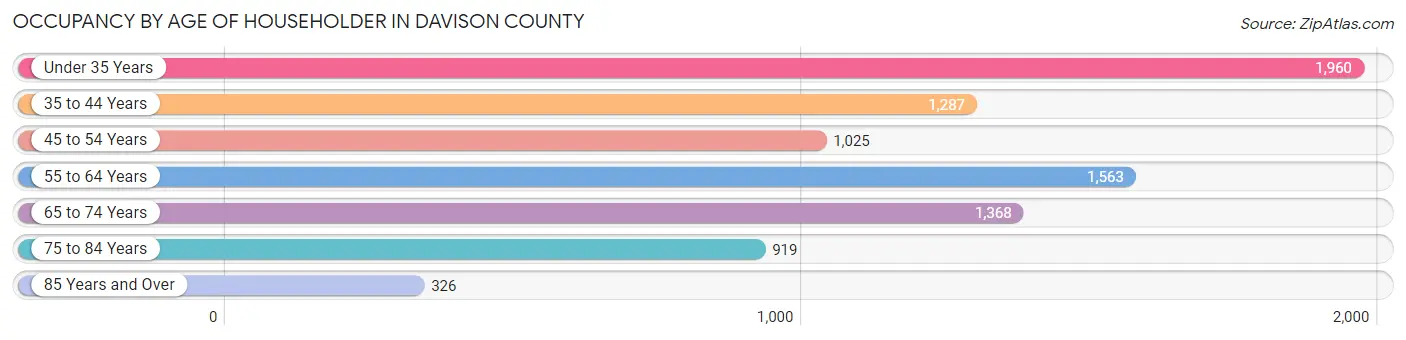
| Age Bracket | # Households | % Households |
| Under 35 Years | 1,960 | 23.2% |
| 35 to 44 Years | 1,287 | 15.2% |
| 45 to 54 Years | 1,025 | 12.1% |
| 55 to 64 Years | 1,563 | 18.5% |
| 65 to 74 Years | 1,368 | 16.2% |
| 75 to 84 Years | 919 | 10.9% |
| 85 Years and Over | 326 | 3.9% |
| Total | 8,448 | 100.0% |
Housing Finances in Davison County
Median Income by Occupancy in Davison County
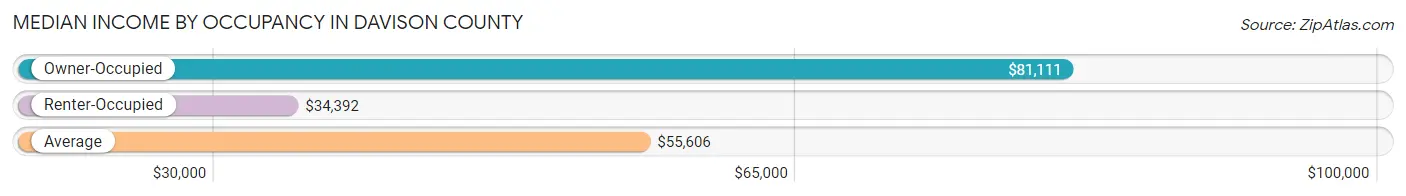
| Occupancy Type | # Households | Median Income |
| Owner-Occupied | 5,306 (62.8%) | $81,111 |
| Renter-Occupied | 3,142 (37.2%) | $34,392 |
| Average | 8,448 (100.0%) | $55,606 |
Occupancy by Householder Income Bracket in Davison County
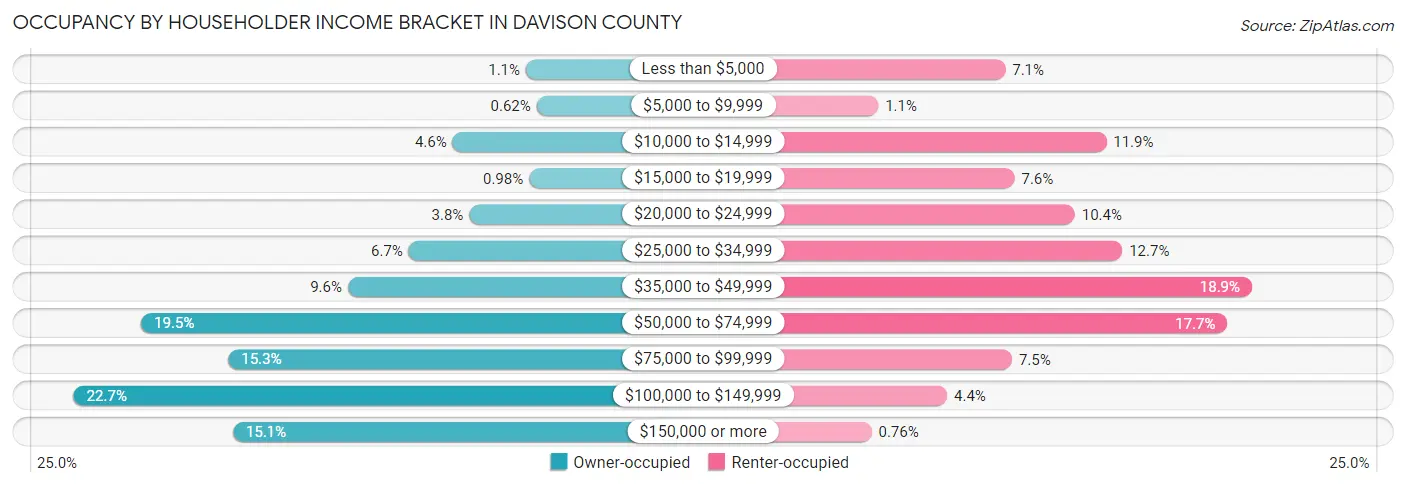
| Income Bracket | Owner-occupied | Renter-occupied |
| Less than $5,000 | 60 (1.1%) | 224 (7.1%) |
| $5,000 to $9,999 | 33 (0.6%) | 34 (1.1%) |
| $10,000 to $14,999 | 245 (4.6%) | 375 (11.9%) |
| $15,000 to $19,999 | 52 (1.0%) | 238 (7.6%) |
| $20,000 to $24,999 | 203 (3.8%) | 328 (10.4%) |
| $25,000 to $34,999 | 356 (6.7%) | 399 (12.7%) |
| $35,000 to $49,999 | 510 (9.6%) | 593 (18.9%) |
| $50,000 to $74,999 | 1,032 (19.5%) | 556 (17.7%) |
| $75,000 to $99,999 | 812 (15.3%) | 234 (7.4%) |
| $100,000 to $149,999 | 1,203 (22.7%) | 137 (4.4%) |
| $150,000 or more | 800 (15.1%) | 24 (0.8%) |
| Total | 5,306 (100.0%) | 3,142 (100.0%) |
Monthly Housing Cost Tiers in Davison County
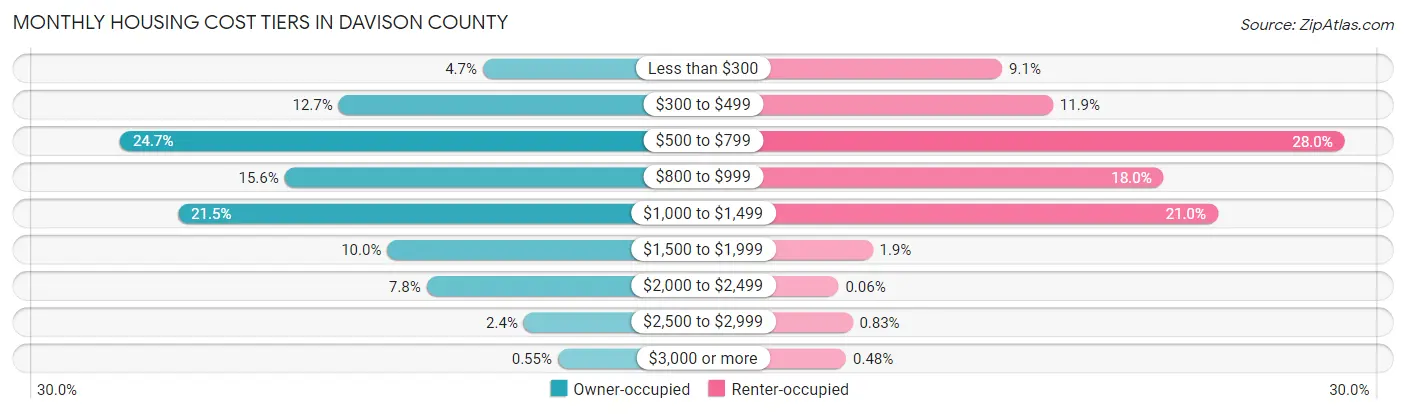
| Monthly Cost | Owner-occupied | Renter-occupied |
| Less than $300 | 249 (4.7%) | 286 (9.1%) |
| $300 to $499 | 672 (12.7%) | 374 (11.9%) |
| $500 to $799 | 1,312 (24.7%) | 880 (28.0%) |
| $800 to $999 | 830 (15.6%) | 566 (18.0%) |
| $1,000 to $1,499 | 1,142 (21.5%) | 660 (21.0%) |
| $1,500 to $1,999 | 529 (10.0%) | 61 (1.9%) |
| $2,000 to $2,499 | 414 (7.8%) | 2 (0.1%) |
| $2,500 to $2,999 | 129 (2.4%) | 26 (0.8%) |
| $3,000 or more | 29 (0.5%) | 15 (0.5%) |
| Total | 5,306 (100.0%) | 3,142 (100.0%) |
Physical Housing Characteristics in Davison County
Housing Structures in Davison County
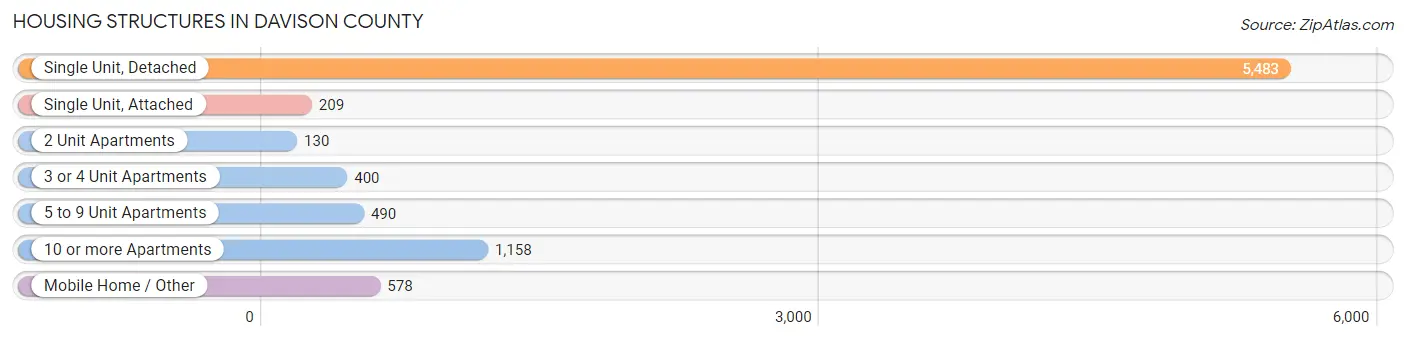
| Structure Type | # Housing Units | % Housing Units |
| Single Unit, Detached | 5,483 | 64.9% |
| Single Unit, Attached | 209 | 2.5% |
| 2 Unit Apartments | 130 | 1.5% |
| 3 or 4 Unit Apartments | 400 | 4.7% |
| 5 to 9 Unit Apartments | 490 | 5.8% |
| 10 or more Apartments | 1,158 | 13.7% |
| Mobile Home / Other | 578 | 6.8% |
| Total | 8,448 | 100.0% |
Housing Structures by Occupancy in Davison County
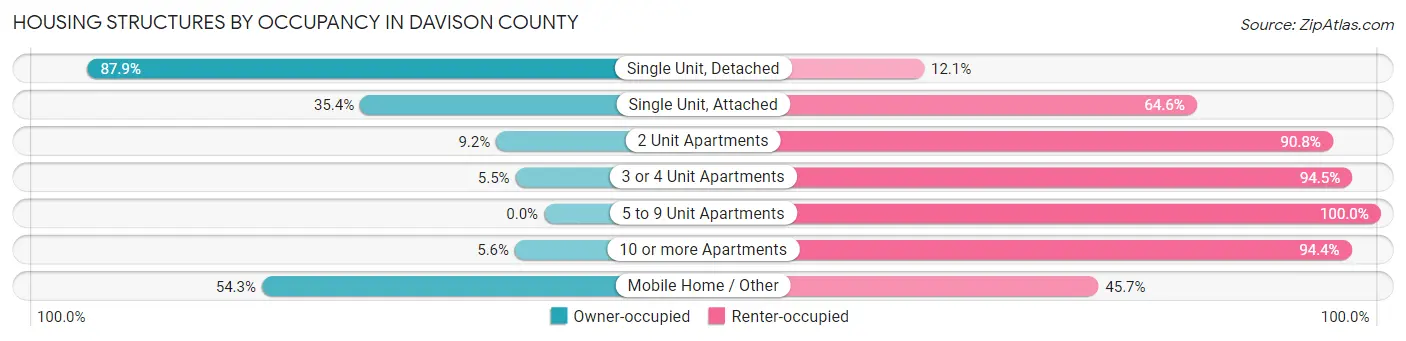
| Structure Type | Owner-occupied | Renter-occupied |
| Single Unit, Detached | 4,819 (87.9%) | 664 (12.1%) |
| Single Unit, Attached | 74 (35.4%) | 135 (64.6%) |
| 2 Unit Apartments | 12 (9.2%) | 118 (90.8%) |
| 3 or 4 Unit Apartments | 22 (5.5%) | 378 (94.5%) |
| 5 to 9 Unit Apartments | 0 (0.0%) | 490 (100.0%) |
| 10 or more Apartments | 65 (5.6%) | 1,093 (94.4%) |
| Mobile Home / Other | 314 (54.3%) | 264 (45.7%) |
| Total | 5,306 (62.8%) | 3,142 (37.2%) |
Housing Structures by Number of Rooms in Davison County
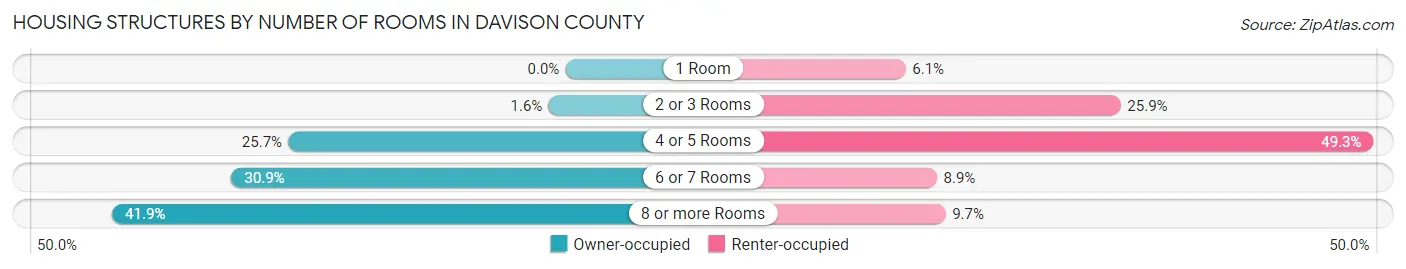
| Number of Rooms | Owner-occupied | Renter-occupied |
| 1 Room | 0 (0.0%) | 190 (6.0%) |
| 2 or 3 Rooms | 84 (1.6%) | 815 (25.9%) |
| 4 or 5 Rooms | 1,361 (25.7%) | 1,550 (49.3%) |
| 6 or 7 Rooms | 1,638 (30.9%) | 281 (8.9%) |
| 8 or more Rooms | 2,223 (41.9%) | 306 (9.7%) |
| Total | 5,306 (100.0%) | 3,142 (100.0%) |
Housing Structure by Heating Type in Davison County
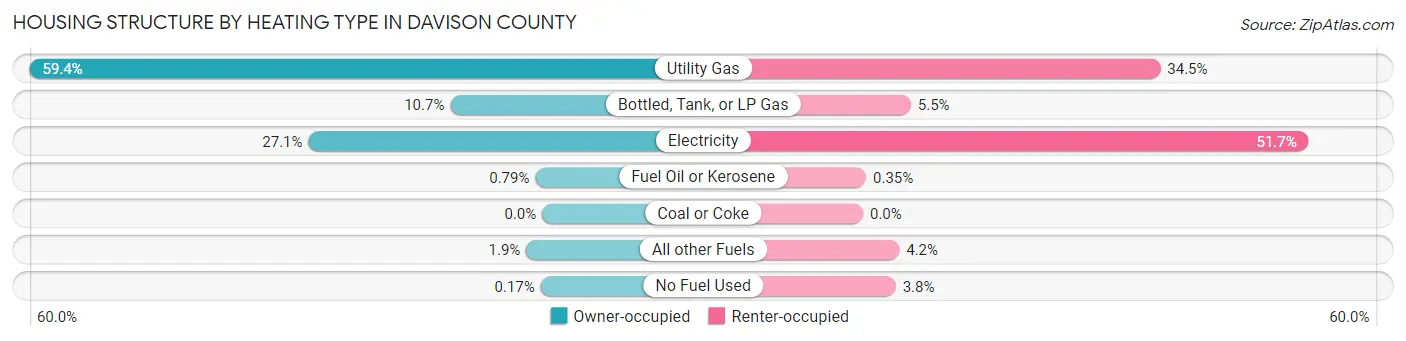
| Heating Type | Owner-occupied | Renter-occupied |
| Utility Gas | 3,154 (59.4%) | 1,083 (34.5%) |
| Bottled, Tank, or LP Gas | 565 (10.6%) | 174 (5.5%) |
| Electricity | 1,438 (27.1%) | 1,623 (51.6%) |
| Fuel Oil or Kerosene | 42 (0.8%) | 11 (0.4%) |
| Coal or Coke | 0 (0.0%) | 0 (0.0%) |
| All other Fuels | 98 (1.8%) | 132 (4.2%) |
| No Fuel Used | 9 (0.2%) | 119 (3.8%) |
| Total | 5,306 (100.0%) | 3,142 (100.0%) |
Household Vehicle Usage in Davison County
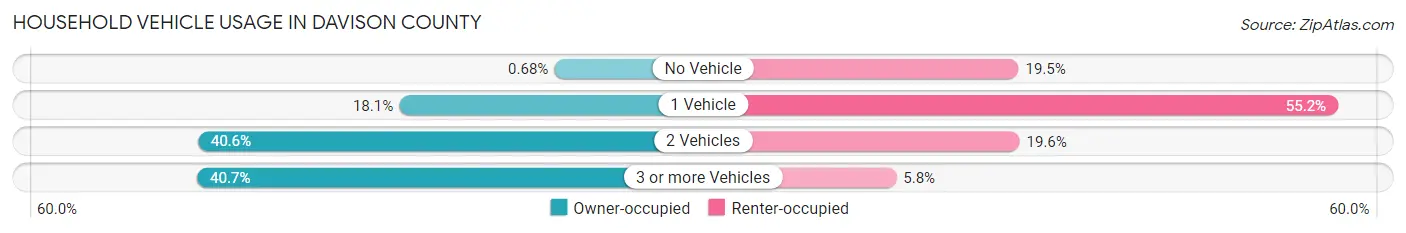
| Vehicles per Household | Owner-occupied | Renter-occupied |
| No Vehicle | 36 (0.7%) | 611 (19.5%) |
| 1 Vehicle | 958 (18.1%) | 1,735 (55.2%) |
| 2 Vehicles | 2,154 (40.6%) | 615 (19.6%) |
| 3 or more Vehicles | 2,158 (40.7%) | 181 (5.8%) |
| Total | 5,306 (100.0%) | 3,142 (100.0%) |
Real Estate & Mortgages in Davison County
Real Estate and Mortgage Overview in Davison County
| Characteristic | Without Mortgage | With Mortgage |
| Housing Units | 2,431 | 2,875 |
| Median Property Value | $164,500 | $192,200 |
| Median Household Income | $62,659 | $483 |
| Monthly Housing Costs | $557 | $29 |
| Real Estate Taxes | $2,276 | $27 |
Property Value by Mortgage Status in Davison County
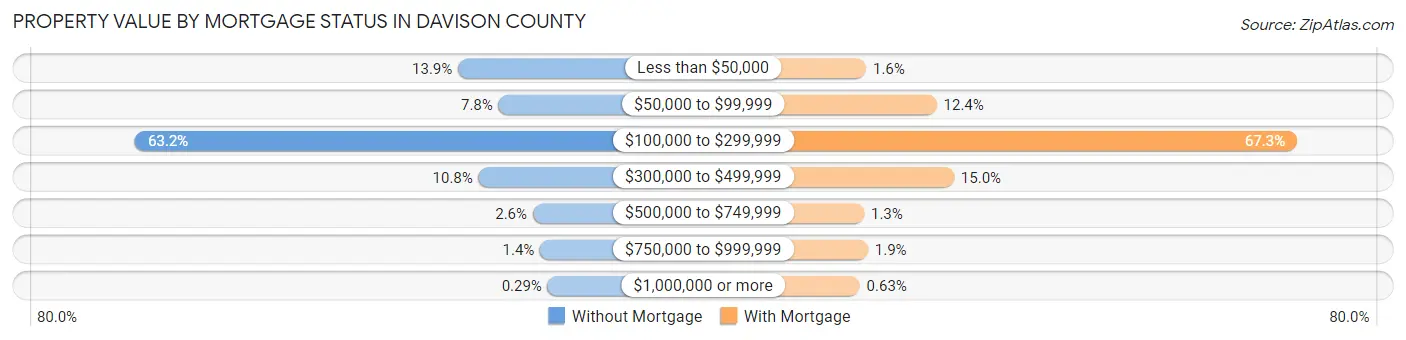
| Property Value | Without Mortgage | With Mortgage |
| Less than $50,000 | 339 (13.9%) | 46 (1.6%) |
| $50,000 to $99,999 | 189 (7.8%) | 355 (12.3%) |
| $100,000 to $299,999 | 1,536 (63.2%) | 1,934 (67.3%) |
| $300,000 to $499,999 | 263 (10.8%) | 431 (15.0%) |
| $500,000 to $749,999 | 62 (2.5%) | 37 (1.3%) |
| $750,000 to $999,999 | 35 (1.4%) | 54 (1.9%) |
| $1,000,000 or more | 7 (0.3%) | 18 (0.6%) |
| Total | 2,431 (100.0%) | 2,875 (100.0%) |
Household Income by Mortgage Status in Davison County
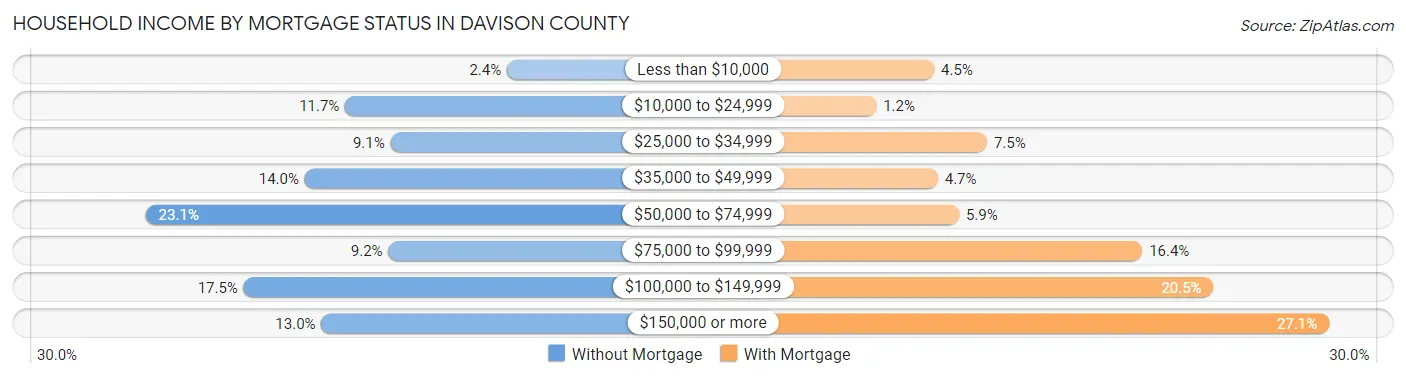
| Household Income | Without Mortgage | With Mortgage |
| Less than $10,000 | 59 (2.4%) | 129 (4.5%) |
| $10,000 to $24,999 | 284 (11.7%) | 34 (1.2%) |
| $25,000 to $34,999 | 221 (9.1%) | 216 (7.5%) |
| $35,000 to $49,999 | 340 (14.0%) | 135 (4.7%) |
| $50,000 to $74,999 | 561 (23.1%) | 170 (5.9%) |
| $75,000 to $99,999 | 224 (9.2%) | 471 (16.4%) |
| $100,000 to $149,999 | 425 (17.5%) | 588 (20.4%) |
| $150,000 or more | 317 (13.0%) | 778 (27.1%) |
| Total | 2,431 (100.0%) | 2,875 (100.0%) |
Property Value to Household Income Ratio in Davison County
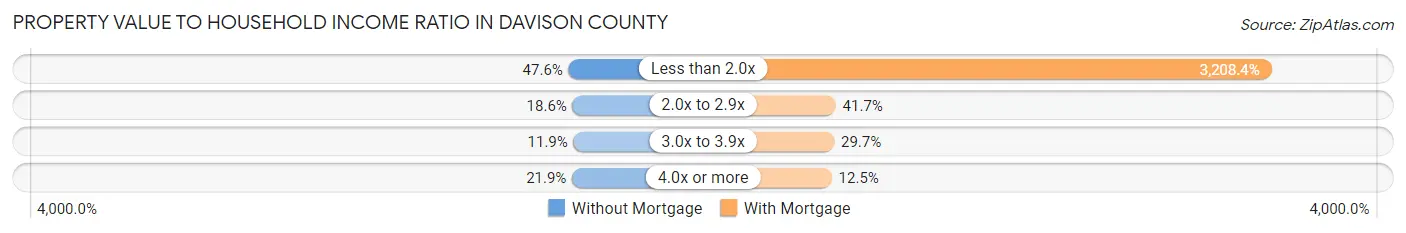
| Value-to-Income Ratio | Without Mortgage | With Mortgage |
| Less than 2.0x | 1,157 (47.6%) | 92,241 (3,208.4%) |
| 2.0x to 2.9x | 451 (18.5%) | 1,200 (41.7%) |
| 3.0x to 3.9x | 289 (11.9%) | 853 (29.7%) |
| 4.0x or more | 533 (21.9%) | 359 (12.5%) |
| Total | 2,431 (100.0%) | 2,875 (100.0%) |
Real Estate Taxes by Mortgage Status in Davison County
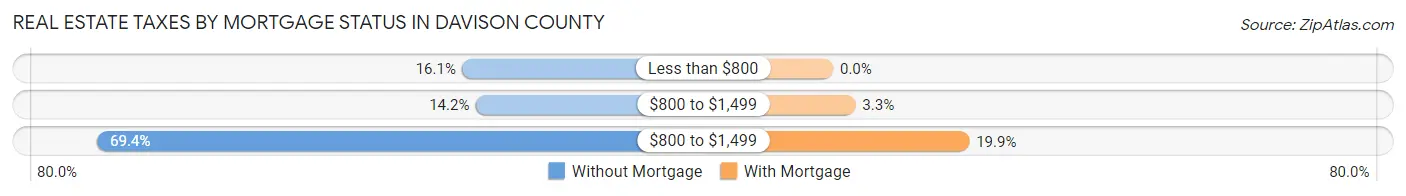
| Property Taxes | Without Mortgage | With Mortgage |
| Less than $800 | 392 (16.1%) | 0 (0.0%) |
| $800 to $1,499 | 344 (14.1%) | 94 (3.3%) |
| $800 to $1,499 | 1,687 (69.4%) | 572 (19.9%) |
| Total | 2,431 (100.0%) | 2,875 (100.0%) |
Health & Disability in Davison County
Health Insurance Coverage by Age in Davison County
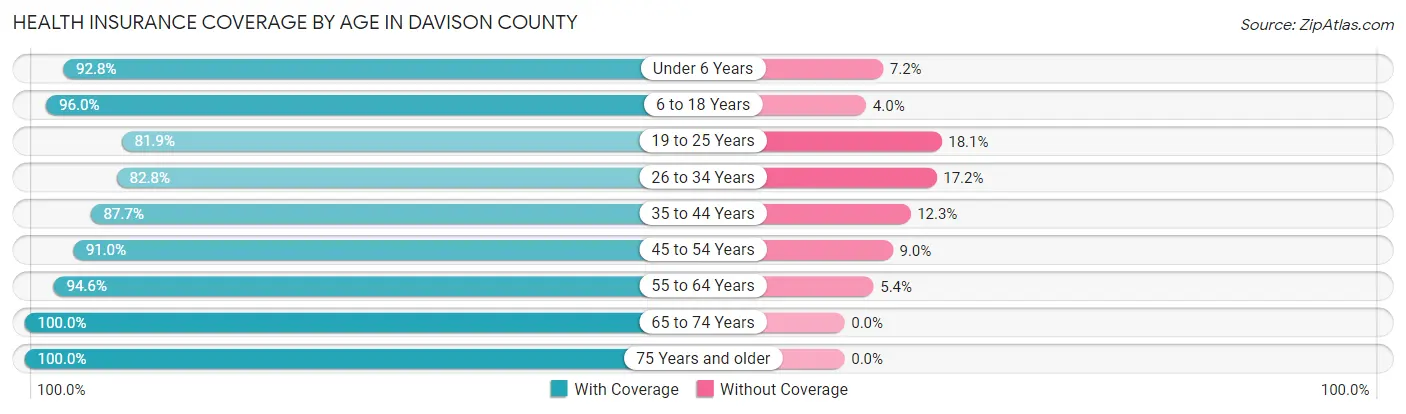
| Age Bracket | With Coverage | Without Coverage |
| Under 6 Years | 1,498 (92.8%) | 116 (7.2%) |
| 6 to 18 Years | 3,099 (96.0%) | 130 (4.0%) |
| 19 to 25 Years | 1,409 (81.9%) | 311 (18.1%) |
| 26 to 34 Years | 1,940 (82.8%) | 402 (17.2%) |
| 35 to 44 Years | 2,026 (87.7%) | 284 (12.3%) |
| 45 to 54 Years | 1,882 (91.0%) | 186 (9.0%) |
| 55 to 64 Years | 2,415 (94.6%) | 138 (5.4%) |
| 65 to 74 Years | 2,084 (100.0%) | 0 (0.0%) |
| 75 Years and older | 1,694 (100.0%) | 0 (0.0%) |
| Total | 18,047 (92.0%) | 1,567 (8.0%) |
Health Insurance Coverage by Citizenship Status in Davison County
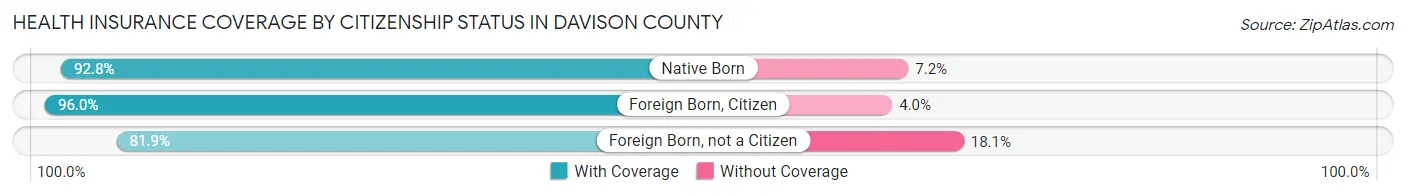
| Citizenship Status | With Coverage | Without Coverage |
| Native Born | 1,498 (92.8%) | 116 (7.2%) |
| Foreign Born, Citizen | 3,099 (96.0%) | 130 (4.0%) |
| Foreign Born, not a Citizen | 1,409 (81.9%) | 311 (18.1%) |
Health Insurance Coverage by Household Income in Davison County
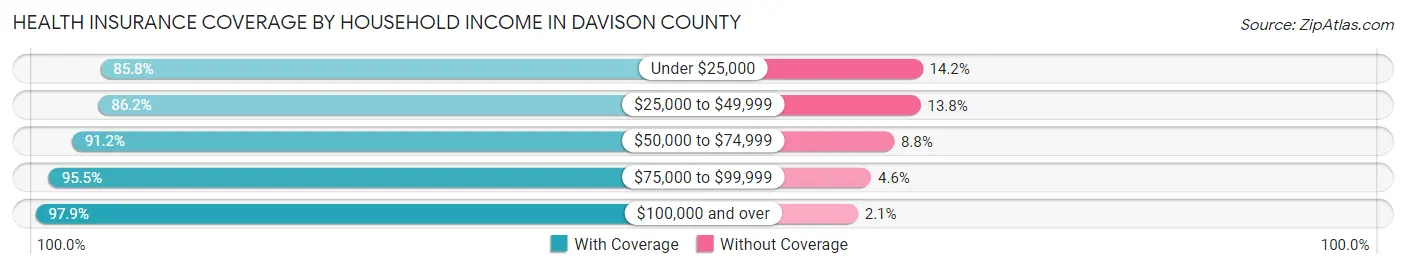
| Household Income | With Coverage | Without Coverage |
| Under $25,000 | 2,224 (85.8%) | 368 (14.2%) |
| $25,000 to $49,999 | 3,017 (86.2%) | 484 (13.8%) |
| $50,000 to $74,999 | 3,285 (91.2%) | 318 (8.8%) |
| $75,000 to $99,999 | 2,730 (95.5%) | 130 (4.5%) |
| $100,000 and over | 6,375 (97.9%) | 134 (2.1%) |
Public vs Private Health Insurance Coverage by Age in Davison County
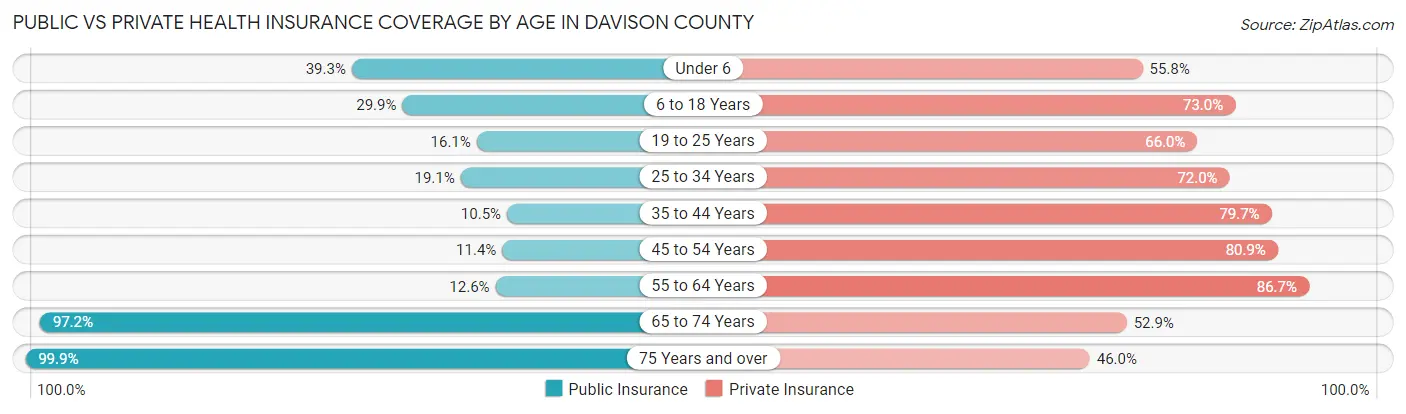
| Age Bracket | Public Insurance | Private Insurance |
| Under 6 | 634 (39.3%) | 901 (55.8%) |
| 6 to 18 Years | 965 (29.9%) | 2,357 (73.0%) |
| 19 to 25 Years | 277 (16.1%) | 1,135 (66.0%) |
| 25 to 34 Years | 447 (19.1%) | 1,685 (72.0%) |
| 35 to 44 Years | 242 (10.5%) | 1,842 (79.7%) |
| 45 to 54 Years | 235 (11.4%) | 1,673 (80.9%) |
| 55 to 64 Years | 322 (12.6%) | 2,213 (86.7%) |
| 65 to 74 Years | 2,025 (97.2%) | 1,102 (52.9%) |
| 75 Years and over | 1,692 (99.9%) | 780 (46.0%) |
| Total | 6,839 (34.9%) | 13,688 (69.8%) |
Disability Status by Sex by Age in Davison County
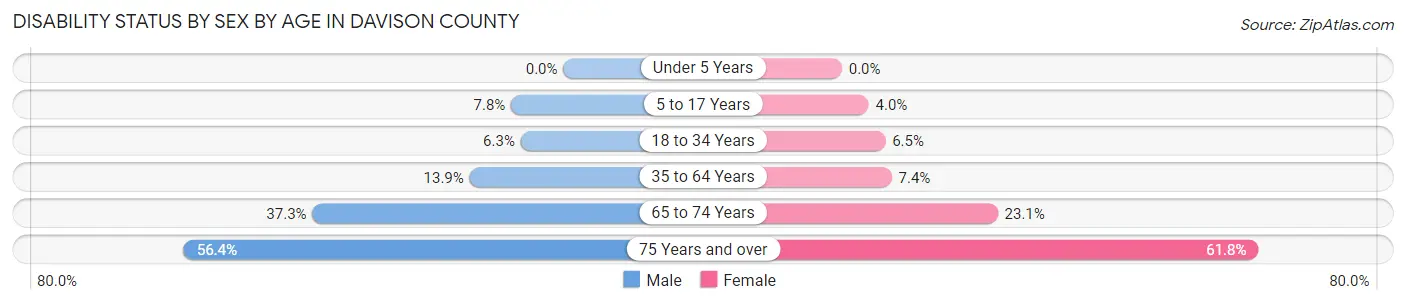
| Age Bracket | Male | Female |
| Under 5 Years | 0 (0.0%) | 0 (0.0%) |
| 5 to 17 Years | 134 (7.7%) | 66 (4.0%) |
| 18 to 34 Years | 144 (6.3%) | 128 (6.5%) |
| 35 to 64 Years | 489 (13.9%) | 253 (7.4%) |
| 65 to 74 Years | 395 (37.3%) | 237 (23.1%) |
| 75 Years and over | 355 (56.4%) | 658 (61.8%) |
Disability Class by Sex by Age in Davison County
Disability Class: Hearing Difficulty
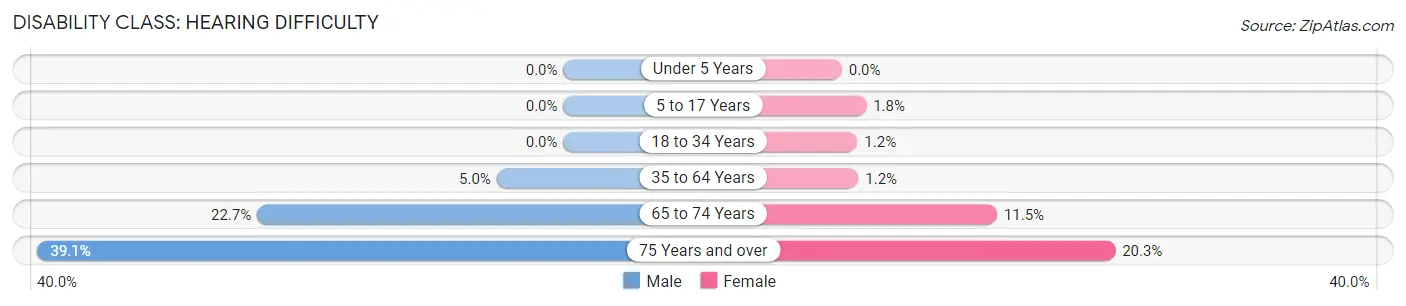
| Age Bracket | Male | Female |
| Under 5 Years | 0 (0.0%) | 0 (0.0%) |
| 5 to 17 Years | 0 (0.0%) | 30 (1.8%) |
| 18 to 34 Years | 0 (0.0%) | 23 (1.2%) |
| 35 to 64 Years | 174 (5.0%) | 42 (1.2%) |
| 65 to 74 Years | 241 (22.7%) | 118 (11.5%) |
| 75 Years and over | 246 (39.1%) | 216 (20.3%) |
Disability Class: Vision Difficulty
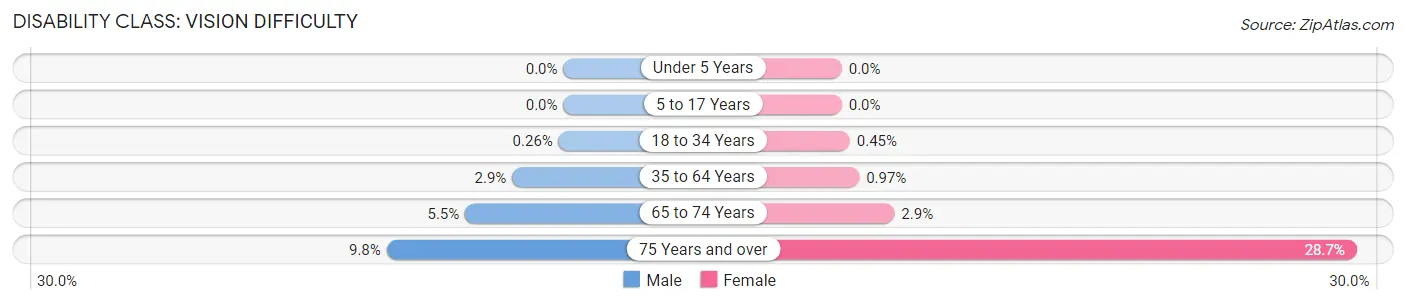
| Age Bracket | Male | Female |
| Under 5 Years | 0 (0.0%) | 0 (0.0%) |
| 5 to 17 Years | 0 (0.0%) | 0 (0.0%) |
| 18 to 34 Years | 6 (0.3%) | 9 (0.4%) |
| 35 to 64 Years | 100 (2.9%) | 33 (1.0%) |
| 65 to 74 Years | 58 (5.5%) | 30 (2.9%) |
| 75 Years and over | 62 (9.8%) | 305 (28.7%) |
Disability Class: Cognitive Difficulty
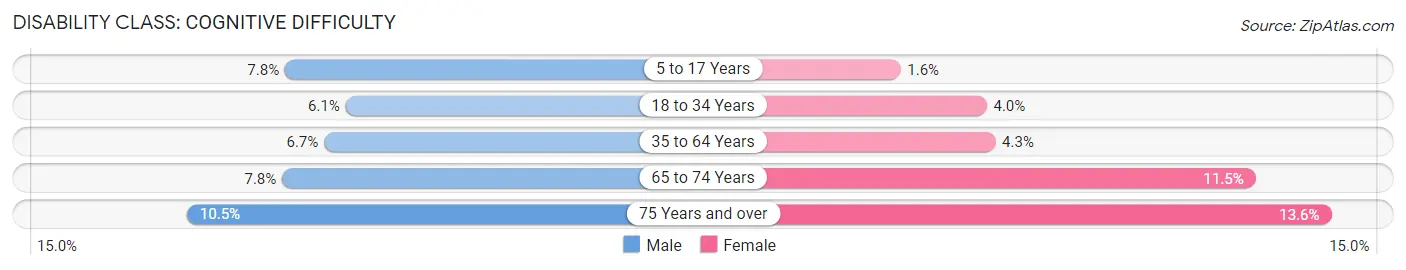
| Age Bracket | Male | Female |
| 5 to 17 Years | 134 (7.7%) | 27 (1.6%) |
| 18 to 34 Years | 138 (6.1%) | 80 (4.0%) |
| 35 to 64 Years | 234 (6.7%) | 146 (4.3%) |
| 65 to 74 Years | 83 (7.8%) | 118 (11.5%) |
| 75 Years and over | 66 (10.5%) | 145 (13.6%) |
Disability Class: Ambulatory Difficulty
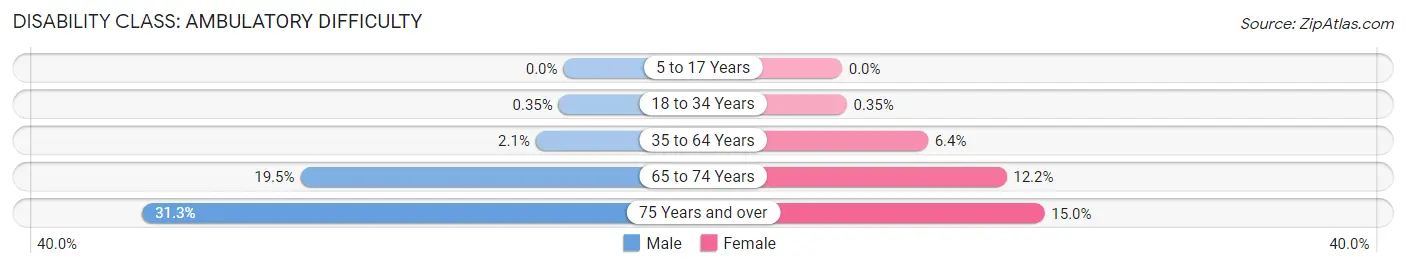
| Age Bracket | Male | Female |
| 5 to 17 Years | 0 (0.0%) | 0 (0.0%) |
| 18 to 34 Years | 8 (0.4%) | 7 (0.4%) |
| 35 to 64 Years | 72 (2.1%) | 218 (6.4%) |
| 65 to 74 Years | 207 (19.5%) | 125 (12.2%) |
| 75 Years and over | 197 (31.3%) | 160 (15.0%) |
Disability Class: Self-Care Difficulty
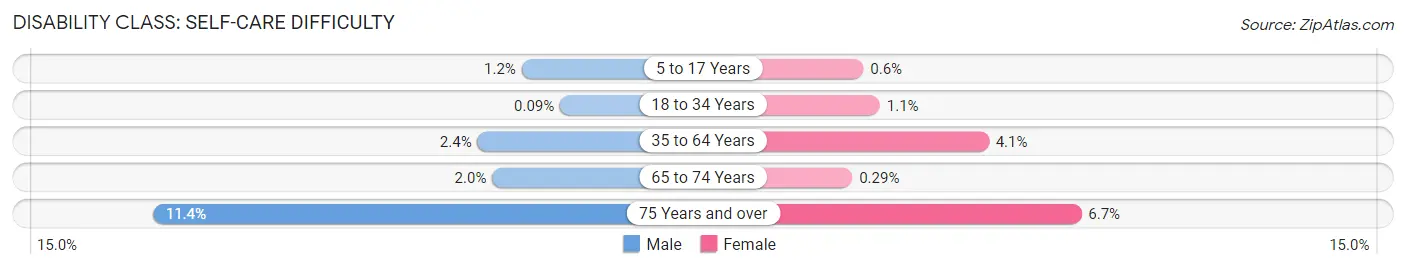
| Age Bracket | Male | Female |
| 5 to 17 Years | 20 (1.2%) | 10 (0.6%) |
| 18 to 34 Years | 2 (0.1%) | 21 (1.1%) |
| 35 to 64 Years | 84 (2.4%) | 140 (4.1%) |
| 65 to 74 Years | 21 (2.0%) | 3 (0.3%) |
| 75 Years and over | 72 (11.4%) | 71 (6.7%) |
Technology Access in Davison County
Computing Device Access in Davison County
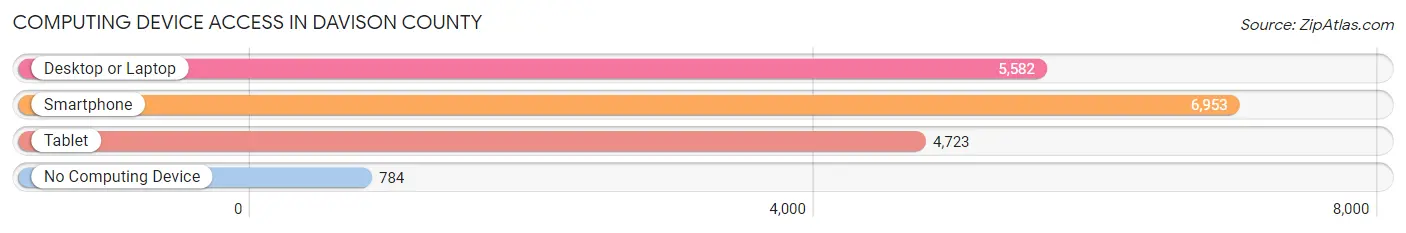
| Device Type | # Households | % Households |
| Desktop or Laptop | 5,582 | 66.1% |
| Smartphone | 6,953 | 82.3% |
| Tablet | 4,723 | 55.9% |
| No Computing Device | 784 | 9.3% |
| Total | 8,448 | 100.0% |
Internet Access in Davison County
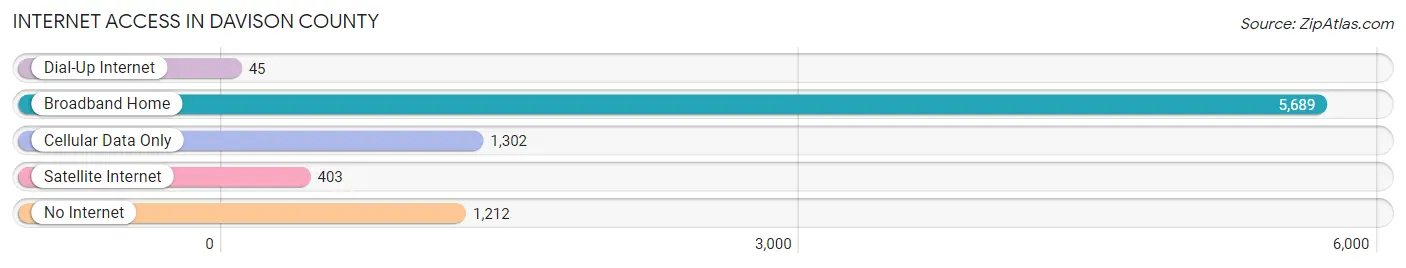
| Internet Type | # Households | % Households |
| Dial-Up Internet | 45 | 0.5% |
| Broadband Home | 5,689 | 67.3% |
| Cellular Data Only | 1,302 | 15.4% |
| Satellite Internet | 403 | 4.8% |
| No Internet | 1,212 | 14.3% |
| Total | 8,448 | 100.0% |
Davison County Summary
Davison County, South Dakota is located in the southeastern corner of the state and is part of the Sioux Falls Metropolitan Statistical Area. The county was established in 1873 and named after Major General John Adams Davison, a Civil War veteran. As of the 2010 census, the population was 19,504, making it the fourth most populous county in South Dakota.
Geography
Davison County is located in the southeastern corner of South Dakota, bordered by the Big Sioux River to the east and the James River to the west. The county covers an area of 576 square miles and is mostly rural, with the majority of the population living in the county seat of Mitchell. Other towns in the county include Mount Vernon, Ethan, and Fulton. The terrain is mostly flat, with rolling hills in the western part of the county. The county is home to several lakes, including Lake Mitchell, Lake Herman, and Lake Poinsett.
Climate
Davison County has a humid continental climate, with cold winters and hot, humid summers. The average annual temperature is 48°F, with an average high of 73°F in July and an average low of 22°F in January. The average annual precipitation is 22 inches, with the majority of it falling in the summer months.
Demographics
As of the 2010 census, there were 19,504 people, 7,717 households, and 5,092 families living in the county. The population density was 34 people per square mile. The racial makeup of the county was 94.3% White, 0.7% African American, 0.5% Native American, 0.4% Asian, 0.1% Pacific Islander, 2.7% from other races, and 1.3% from two or more races. Hispanic or Latino of any race were 4.3% of the population.
The median income for a household in the county was $45,845, and the median income for a family was $54,945. The per capita income for the county was $21,845. About 8.2% of families and 11.2% of the population were below the poverty line, including 14.2% of those under age 18 and 8.2% of those age 65 or over.
Economy
Davison County is largely agricultural, with corn, soybeans, and wheat being the main crops. The county is also home to several manufacturing companies, including Dakota Steel, which produces steel products, and Mitchell Plastics, which produces plastic products. The county is also home to several retail stores, including Walmart, Target, and Kohl's.
The county is served by the Mitchell Municipal Airport, which offers daily flights to Minneapolis, Chicago, and Denver. The county is also served by several major highways, including Interstate 90, U.S. Route 14, and U.S. Route 81.
Conclusion
Davison County, South Dakota is a rural county located in the southeastern corner of the state. The county is home to 19,504 people, most of whom live in the county seat of Mitchell. The county is largely agricultural, with corn, soybeans, and wheat being the main crops. The county is also home to several manufacturing companies and retail stores. The county is served by the Mitchell Municipal Airport and several major highways.
Common Questions
What is the Total Population of Davison County?
Total Population of Davison County is 19,966.
What is the Total Male Population of Davison County?
Total Male Population of Davison County is 9,894.
What is the Total Female Population of Davison County?
Total Female Population of Davison County is 10,072.
What is the Ratio of Males per 100 Females in Davison County?
There are 98.23 Males per 100 Females in Davison County.
What is the Ratio of Females per 100 Males in Davison County?
There are 101.80 Females per 100 Males in Davison County.
What is the Median Population Age in Davison County?
Median Population Age in Davison County is 39.7 Years.
What is the Average Family Size in Davison County
Average Family Size in Davison County is 3.0 People.
What is the Average Household Size in Davison County
Average Household Size in Davison County is 2.3 People.
What is Per Capita Income in Davison County?
Per Capita income in Davison County is $33,282.
What is the Median Family Income in Davison County?
Median Family Income in Davison County is $86,005.
What is the Median Household income in Davison County?
Median Household Income in Davison County is $55,606.
What is Income or Wage Gap in Davison County?
Income or Wage Gap in Davison County is 32.1%.
Women in Davison County earn 67.9 cents for every dollar earned by a man.
What is Inequality or Gini Index in Davison County?
Inequality or Gini Index in Davison County is 0.45.
How Large is the Labor Force in Davison County?
There are 10,602 People in the Labor Forcein in Davison County.
What is the Percentage of People in the Labor Force in Davison County?
67.7% of People are in the Labor Force in Davison County.
What is the Unemployment Rate in Davison County?
Unemployment Rate in Davison County is 1.4%.