Codington County, SD
Codington County Map
Codington County Overview
28,402
TOTAL POPULATION
14,365
MALE POPULATION
14,037
FEMALE POPULATION
102.34
MALES / 100 FEMALES
97.72
FEMALES / 100 MALES
39.6
MEDIAN AGE
2.9
AVG FAMILY SIZE
2.3
AVG HOUSEHOLD SIZE
$36,016
PER CAPITA INCOME
$88,199
AVG FAMILY INCOME
$65,747
AVG HOUSEHOLD INCOME
35.9%
WAGE / INCOME GAP [ % ]
64.1¢/ $1
WAGE / INCOME GAP [ $ ]
$11,134
FAMILY INCOME DEFICIT
0.43
INEQUALITY / GINI INDEX
15,677
LABOR FORCE [ PEOPLE ]
69.1%
PERCENT IN LABOR FORCE
1.5%
UNEMPLOYMENT RATE
Codington County Area Codes
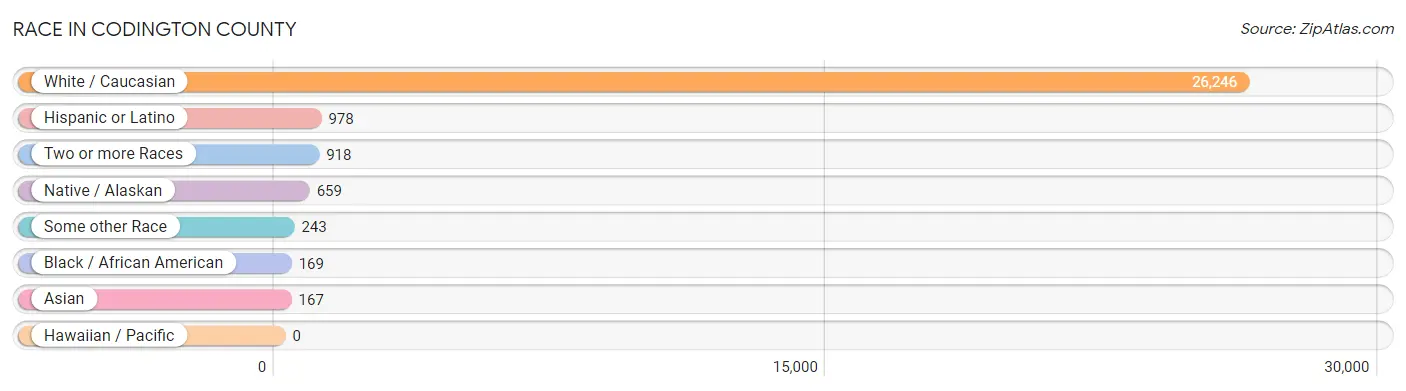
Race in Codington County
The most populous races in Codington County are White / Caucasian (26,246 | 92.4%), Hispanic or Latino (978 | 3.4%), and Two or more Races (918 | 3.2%).
| Race | # Population | % Population |
| Asian | 167 | 0.6% |
| Black / African American | 169 | 0.6% |
| Hawaiian / Pacific | 0 | 0.0% |
| Hispanic or Latino | 978 | 3.4% |
| Native / Alaskan | 659 | 2.3% |
| White / Caucasian | 26,246 | 92.4% |
| Two or more Races | 918 | 3.2% |
| Some other Race | 243 | 0.9% |
| Total | 28,402 | 100.0% |
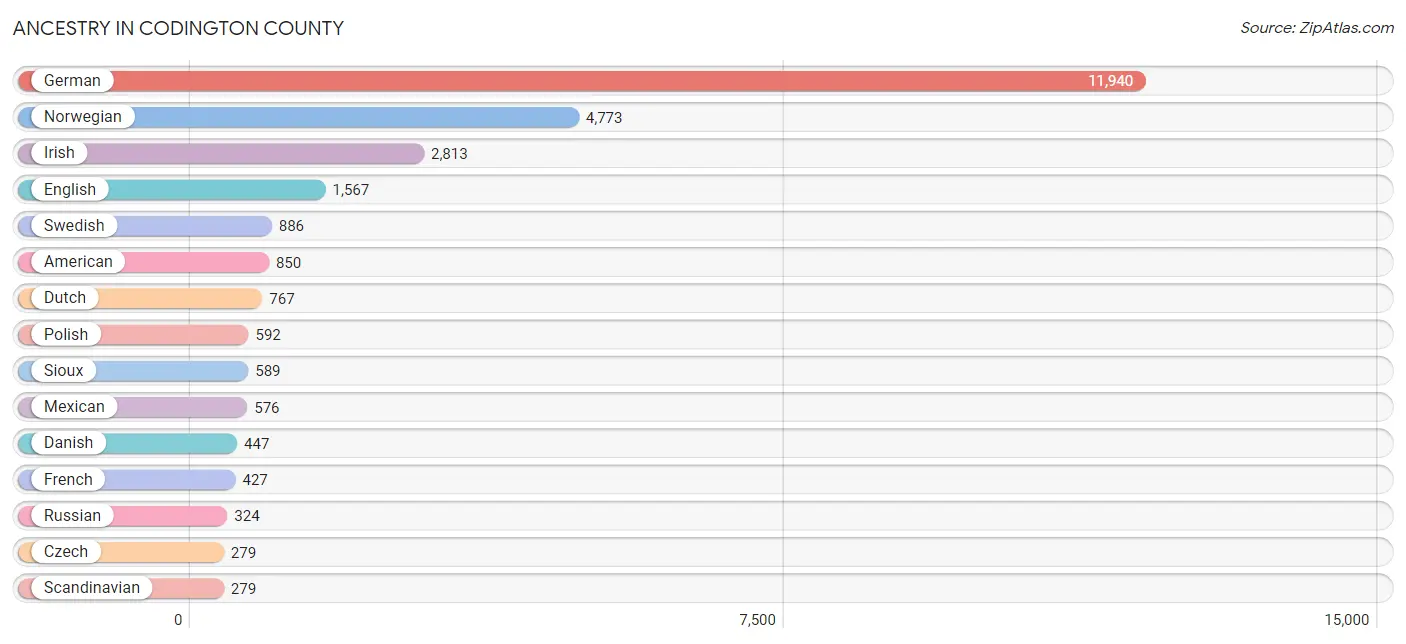
Ancestry in Codington County
The most populous ancestries reported in Codington County are German (11,940 | 42.0%), Norwegian (4,773 | 16.8%), Irish (2,813 | 9.9%), English (1,567 | 5.5%), and Swedish (886 | 3.1%), together accounting for 77.4% of all Codington County residents.
| Ancestry | # Population | % Population |
| American | 850 | 3.0% |
| Arab | 3 | 0.0% |
| Austrian | 19 | 0.1% |
| Bangladeshi | 10 | 0.0% |
| Belgian | 30 | 0.1% |
| Bhutanese | 73 | 0.3% |
| British | 101 | 0.4% |
| Burmese | 72 | 0.3% |
| Canadian | 16 | 0.1% |
| Central American | 191 | 0.7% |
| Chippewa | 1 | 0.0% |
| Colombian | 35 | 0.1% |
| Cuban | 93 | 0.3% |
| Czech | 279 | 1.0% |
| Czechoslovakian | 69 | 0.2% |
| Danish | 447 | 1.6% |
| Dominican | 26 | 0.1% |
| Dutch | 767 | 2.7% |
| Eastern European | 21 | 0.1% |
| English | 1,567 | 5.5% |
| Ethiopian | 92 | 0.3% |
| European | 174 | 0.6% |
| Finnish | 241 | 0.9% |
| French | 427 | 1.5% |
| French Canadian | 71 | 0.3% |
| German | 11,940 | 42.0% |
| Greek | 17 | 0.1% |
| Guamanian / Chamorro | 35 | 0.1% |
| Guatemalan | 175 | 0.6% |
| Hungarian | 16 | 0.1% |
| Indian (Asian) | 112 | 0.4% |
| Inupiat | 16 | 0.1% |
| Irish | 2,813 | 9.9% |
| Italian | 264 | 0.9% |
| Korean | 126 | 0.4% |
| Luxembourger | 1 | 0.0% |
| Mexican | 576 | 2.0% |
| Native Hawaiian | 37 | 0.1% |
| New Zealander | 2 | 0.0% |
| Northern European | 73 | 0.3% |
| Norwegian | 4,773 | 16.8% |
| Panamanian | 16 | 0.1% |
| Pennsylvania German | 21 | 0.1% |
| Polish | 592 | 2.1% |
| Portuguese | 2 | 0.0% |
| Puerto Rican | 13 | 0.1% |
| Russian | 324 | 1.1% |
| Samoan | 36 | 0.1% |
| Scandinavian | 279 | 1.0% |
| Scotch-Irish | 136 | 0.5% |
| Scottish | 255 | 0.9% |
| Sioux | 589 | 2.1% |
| South American | 35 | 0.1% |
| Spaniard | 14 | 0.1% |
| Sri Lankan | 88 | 0.3% |
| Subsaharan African | 92 | 0.3% |
| Swedish | 886 | 3.1% |
| Swiss | 29 | 0.1% |
| Thai | 75 | 0.3% |
| Ukrainian | 18 | 0.1% |
| Welsh | 117 | 0.4% | View All 61 Rows |
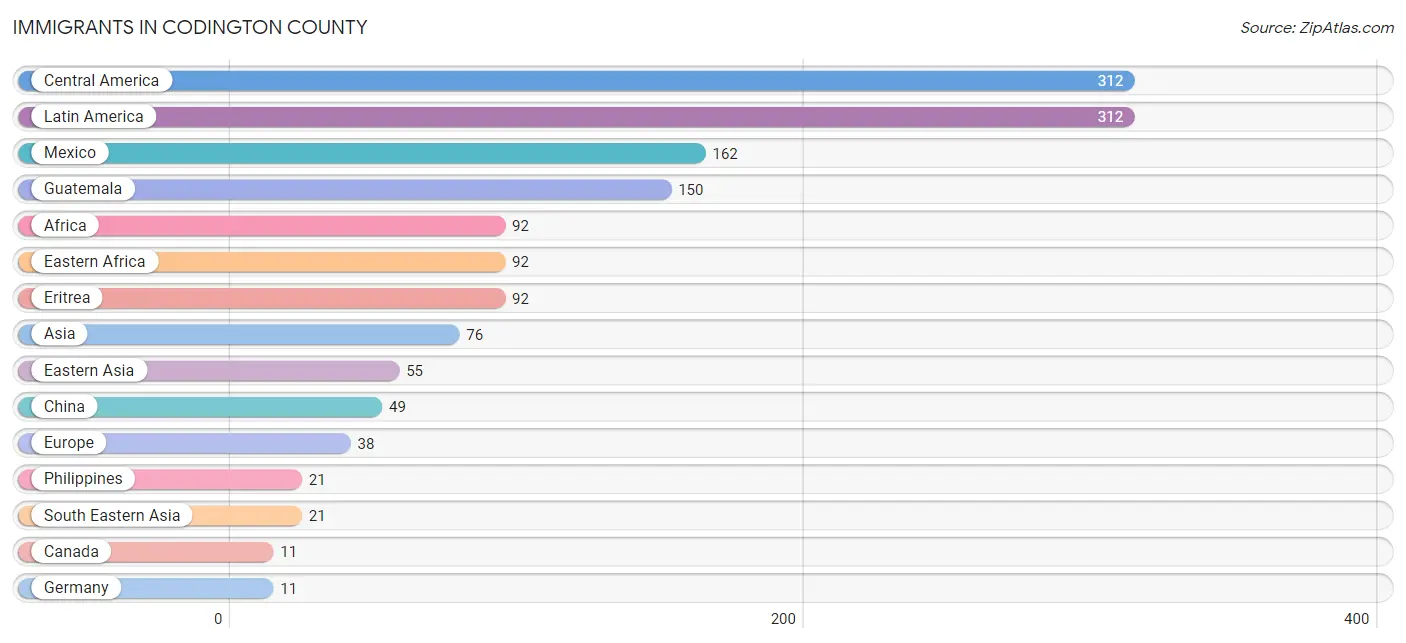
Immigrants in Codington County
The most numerous immigrant groups reported in Codington County came from Central America (312 | 1.1%), Latin America (312 | 1.1%), Mexico (162 | 0.6%), Guatemala (150 | 0.5%), and Africa (92 | 0.3%), together accounting for 3.6% of all Codington County residents.
| Immigration Origin | # Population | % Population |
| Africa | 92 | 0.3% |
| Asia | 76 | 0.3% |
| Canada | 11 | 0.0% |
| Central America | 312 | 1.1% |
| China | 49 | 0.2% |
| Eastern Africa | 92 | 0.3% |
| Eastern Asia | 55 | 0.2% |
| Eastern Europe | 10 | 0.0% |
| Eritrea | 92 | 0.3% |
| Europe | 38 | 0.1% |
| Germany | 11 | 0.0% |
| Guatemala | 150 | 0.5% |
| Italy | 6 | 0.0% |
| Korea | 6 | 0.0% |
| Latin America | 312 | 1.1% |
| Mexico | 162 | 0.6% |
| Northern Europe | 11 | 0.0% |
| Philippines | 21 | 0.1% |
| Russia | 10 | 0.0% |
| South Eastern Asia | 21 | 0.1% |
| Southern Europe | 6 | 0.0% |
| Western Europe | 11 | 0.0% | View All 22 Rows |
Sex and Age in Codington County
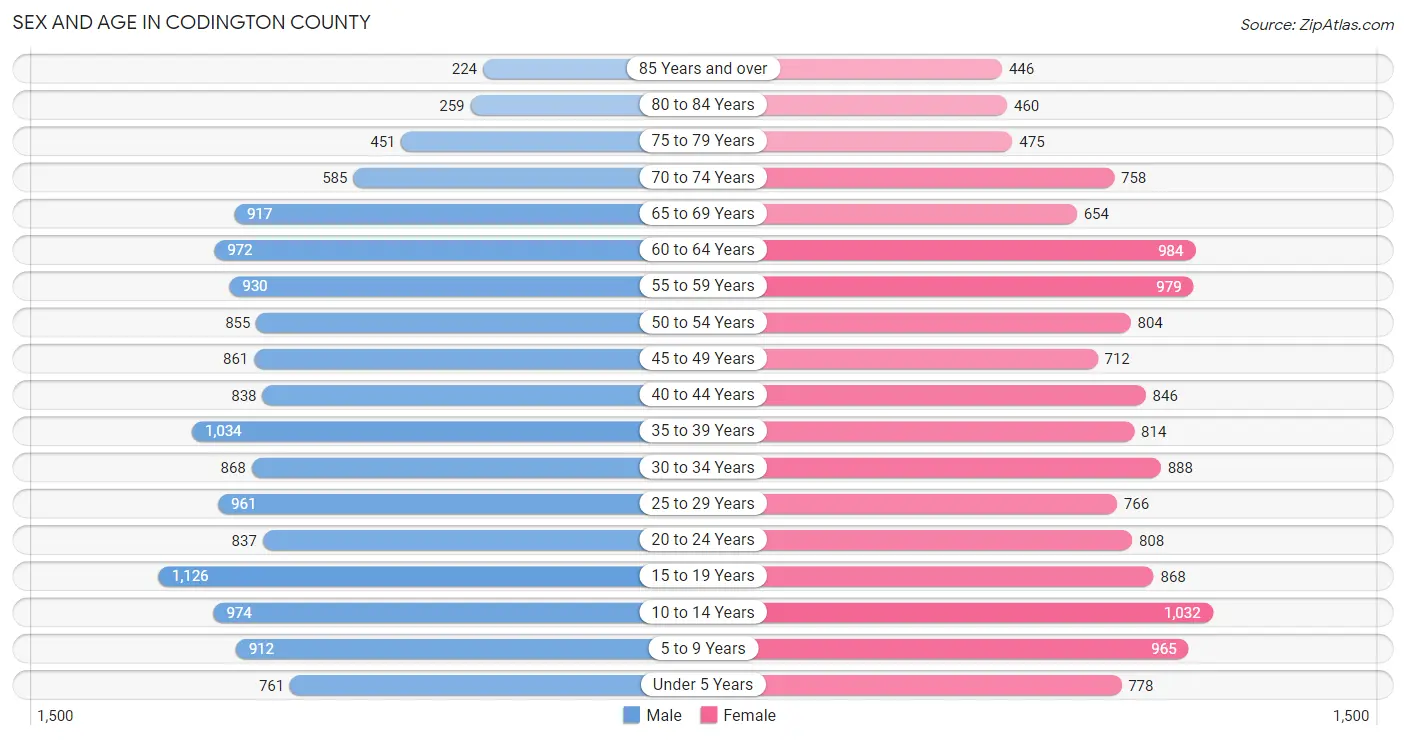
Sex and Age in Codington County
The most populous age groups in Codington County are 15 to 19 Years (1,126 | 7.8%) for men and 10 to 14 Years (1,032 | 7.3%) for women.
| Age Bracket | Male | Female |
| Under 5 Years | 761 (5.3%) | 778 (5.5%) |
| 5 to 9 Years | 912 (6.4%) | 965 (6.9%) |
| 10 to 14 Years | 974 (6.8%) | 1,032 (7.3%) |
| 15 to 19 Years | 1,126 (7.8%) | 868 (6.2%) |
| 20 to 24 Years | 837 (5.8%) | 808 (5.8%) |
| 25 to 29 Years | 961 (6.7%) | 766 (5.5%) |
| 30 to 34 Years | 868 (6.0%) | 888 (6.3%) |
| 35 to 39 Years | 1,034 (7.2%) | 814 (5.8%) |
| 40 to 44 Years | 838 (5.8%) | 846 (6.0%) |
| 45 to 49 Years | 861 (6.0%) | 712 (5.1%) |
| 50 to 54 Years | 855 (5.9%) | 804 (5.7%) |
| 55 to 59 Years | 930 (6.5%) | 979 (7.0%) |
| 60 to 64 Years | 972 (6.8%) | 984 (7.0%) |
| 65 to 69 Years | 917 (6.4%) | 654 (4.7%) |
| 70 to 74 Years | 585 (4.1%) | 758 (5.4%) |
| 75 to 79 Years | 451 (3.1%) | 475 (3.4%) |
| 80 to 84 Years | 259 (1.8%) | 460 (3.3%) |
| 85 Years and over | 224 (1.6%) | 446 (3.2%) |
| Total | 14,365 (100.0%) | 14,037 (100.0%) |
Families and Households in Codington County
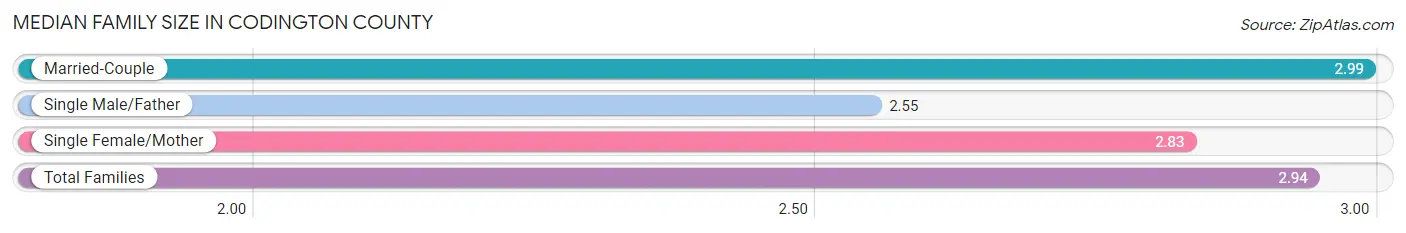
Median Family Size in Codington County
The median family size in Codington County is 2.94 persons per family, with married-couple families (5,837 | 82.3%) accounting for the largest median family size of 2.99 persons per family. On the other hand, single male/father families (470 | 6.6%) represent the smallest median family size with 2.55 persons per family.
| Family Type | # Families | Family Size |
| Married-Couple | 5,837 (82.3%) | 2.99 |
| Single Male/Father | 470 (6.6%) | 2.55 |
| Single Female/Mother | 784 (11.1%) | 2.83 |
| Total Families | 7,091 (100.0%) | 2.94 |
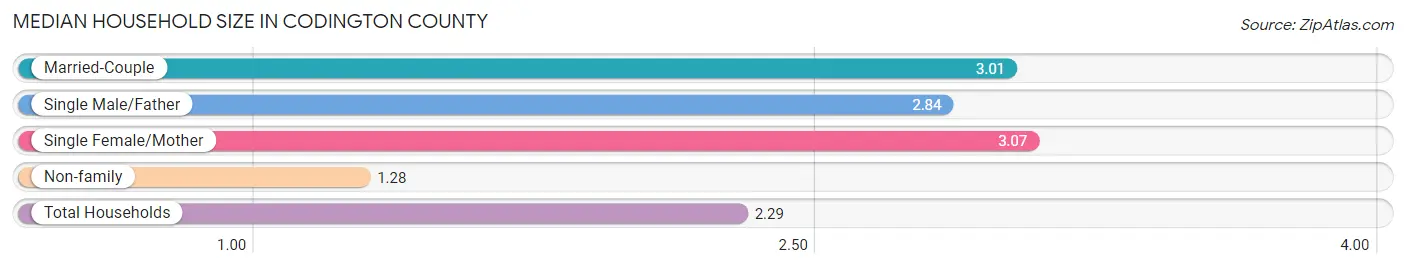
Median Household Size in Codington County
The median household size in Codington County is 2.29 persons per household, with single female/mother households (784 | 6.4%) accounting for the largest median household size of 3.07 persons per household. non-family households (5,074 | 41.7%) represent the smallest median household size with 1.28 persons per household.
| Household Type | # Households | Household Size |
| Married-Couple | 5,837 (48.0%) | 3.01 |
| Single Male/Father | 470 (3.9%) | 2.84 |
| Single Female/Mother | 784 (6.4%) | 3.07 |
| Non-family | 5,074 (41.7%) | 1.28 |
| Total Households | 12,165 (100.0%) | 2.29 |
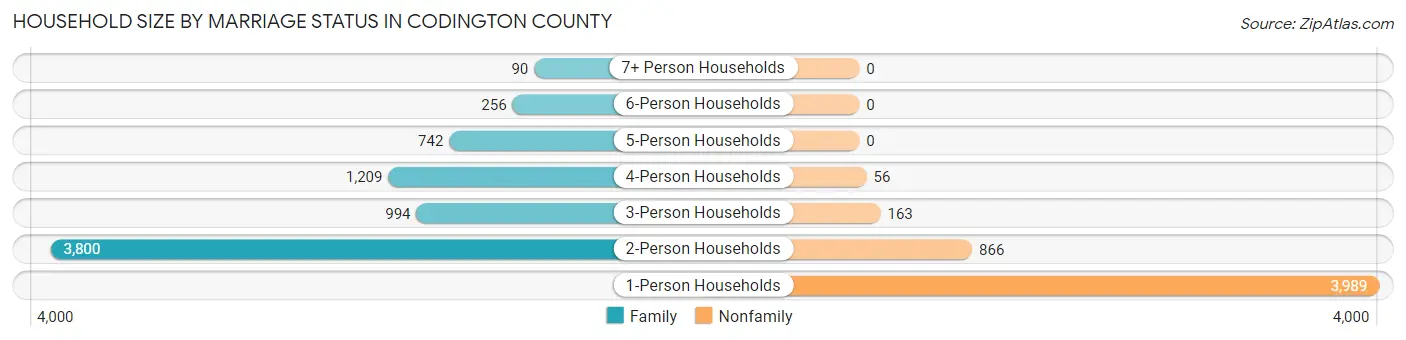
Household Size by Marriage Status in Codington County
Out of a total of 12,165 households in Codington County, 7,091 (58.3%) are family households, while 5,074 (41.7%) are nonfamily households. The most numerous type of family households are 2-person households, comprising 3,800, and the most common type of nonfamily households are 1-person households, comprising 3,989.
| Household Size | Family Households | Nonfamily Households |
| 1-Person Households | - | 3,989 (32.8%) |
| 2-Person Households | 3,800 (31.2%) | 866 (7.1%) |
| 3-Person Households | 994 (8.2%) | 163 (1.3%) |
| 4-Person Households | 1,209 (9.9%) | 56 (0.5%) |
| 5-Person Households | 742 (6.1%) | 0 (0.0%) |
| 6-Person Households | 256 (2.1%) | 0 (0.0%) |
| 7+ Person Households | 90 (0.7%) | 0 (0.0%) |
| Total | 7,091 (58.3%) | 5,074 (41.7%) |
Female Fertility in Codington County
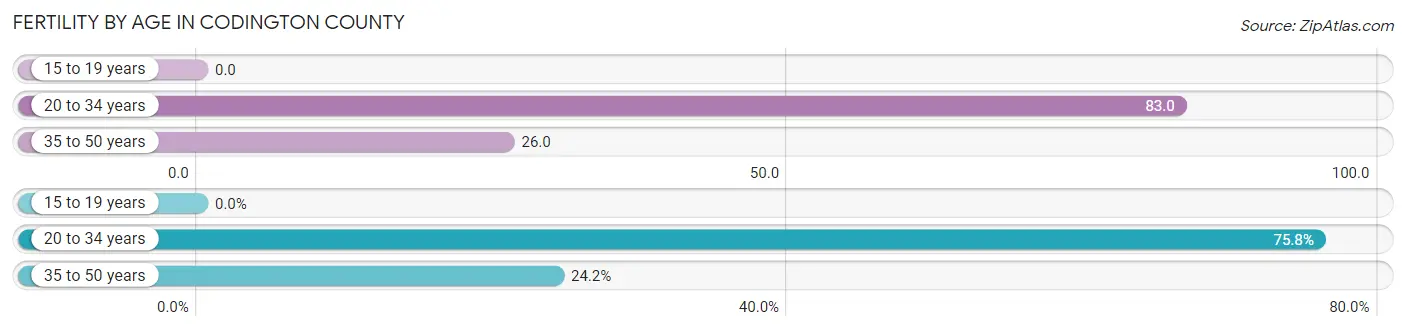
Fertility by Age in Codington County
Average fertility rate in Codington County is 46.0 births per 1,000 women. Women in the age bracket of 20 to 34 years have the highest fertility rate with 83.0 births per 1,000 women. Women in the age bracket of 20 to 34 years acount for 75.8% of all women with births.
| Age Bracket | Women with Births | Births / 1,000 Women |
| 15 to 19 years | 0 (0.0%) | 0.0 |
| 20 to 34 years | 204 (75.8%) | 83.0 |
| 35 to 50 years | 65 (24.2%) | 26.0 |
| Total | 269 (100.0%) | 46.0 |
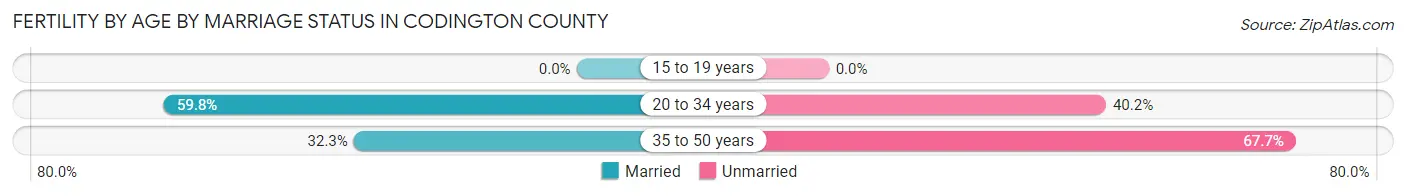
Fertility by Age by Marriage Status in Codington County
53.2% of women with births (269) in Codington County are married. The highest percentage of unmarried women with births falls into 35 to 50 years age bracket with 67.7% of them unmarried at the time of birth, while the lowest percentage of unmarried women with births belong to 20 to 34 years age bracket with 40.2% of them unmarried.
| Age Bracket | Married | Unmarried |
| 15 to 19 years | 0 (0.0%) | 0 (0.0%) |
| 20 to 34 years | 122 (59.8%) | 82 (40.2%) |
| 35 to 50 years | 21 (32.3%) | 44 (67.7%) |
| Total | 143 (53.2%) | 126 (46.8%) |
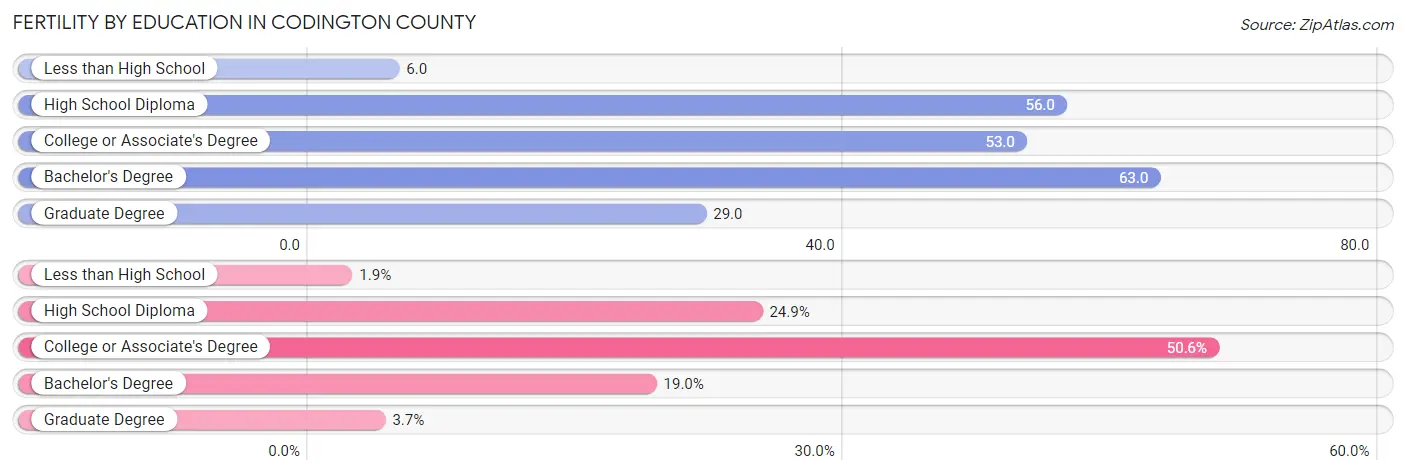
Fertility by Education in Codington County
Average fertility rate in Codington County is 46.0 births per 1,000 women. Women with the education attainment of bachelor's degree have the highest fertility rate of 63.0 births per 1,000 women, while women with the education attainment of less than high school have the lowest fertility at 6.0 births per 1,000 women. Women with the education attainment of college or associate's degree represent 50.6% of all women with births.
| Educational Attainment | Women with Births | Births / 1,000 Women |
| Less than High School | 5 (1.9%) | 6.0 |
| High School Diploma | 67 (24.9%) | 56.0 |
| College or Associate's Degree | 136 (50.6%) | 53.0 |
| Bachelor's Degree | 51 (19.0%) | 63.0 |
| Graduate Degree | 10 (3.7%) | 29.0 |
| Total | 269 (100.0%) | 46.0 |
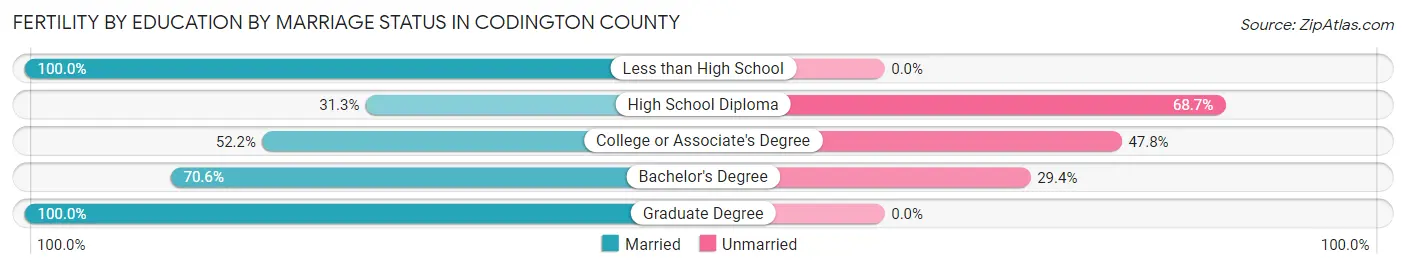
Fertility by Education by Marriage Status in Codington County
46.8% of women with births in Codington County are unmarried. Women with the educational attainment of less than high school are most likely to be married with 100.0% of them married at childbirth, while women with the educational attainment of high school diploma are least likely to be married with 68.7% of them unmarried at childbirth.
| Educational Attainment | Married | Unmarried |
| Less than High School | 5 (100.0%) | 0 (0.0%) |
| High School Diploma | 21 (31.3%) | 46 (68.7%) |
| College or Associate's Degree | 71 (52.2%) | 65 (47.8%) |
| Bachelor's Degree | 36 (70.6%) | 15 (29.4%) |
| Graduate Degree | 10 (100.0%) | 0 (0.0%) |
| Total | 143 (53.2%) | 126 (46.8%) |
Income in Codington County
Income Overview in Codington County
Per Capita Income in Codington County is $36,016, while median incomes of families and households are $88,199 and $65,747 respectively.
| Characteristic | Number | Measure |
| Per Capita Income | 28,402 | $36,016 |
| Median Family Income | 7,091 | $88,199 |
| Mean Family Income | 7,091 | $103,762 |
| Median Household Income | 12,165 | $65,747 |
| Mean Household Income | 12,165 | $82,684 |
| Income Deficit | 7,091 | $11,134 |
| Wage / Income Gap (%) | 28,402 | 35.92% |
| Wage / Income Gap ($) | 28,402 | 64.08¢ per $1 |
| Gini / Inequality Index | 28,402 | 0.43 |
Earnings by Sex in Codington County
Average Earnings in Codington County are $37,922, $48,483 for men and $31,069 for women, a difference of 35.9%.
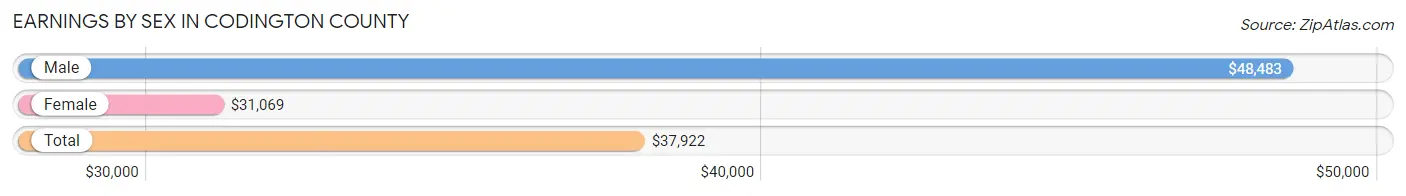
| Sex | Number | Average Earnings |
| Male | 8,791 (53.1%) | $48,483 |
| Female | 7,768 (46.9%) | $31,069 |
| Total | 16,559 (100.0%) | $37,922 |
Earnings by Sex by Income Bracket in Codington County
The most common earnings brackets in Codington County are $55,000 to $64,999 for men (1,239 | 14.1%) and $35,000 to $39,999 for women (709 | 9.1%).
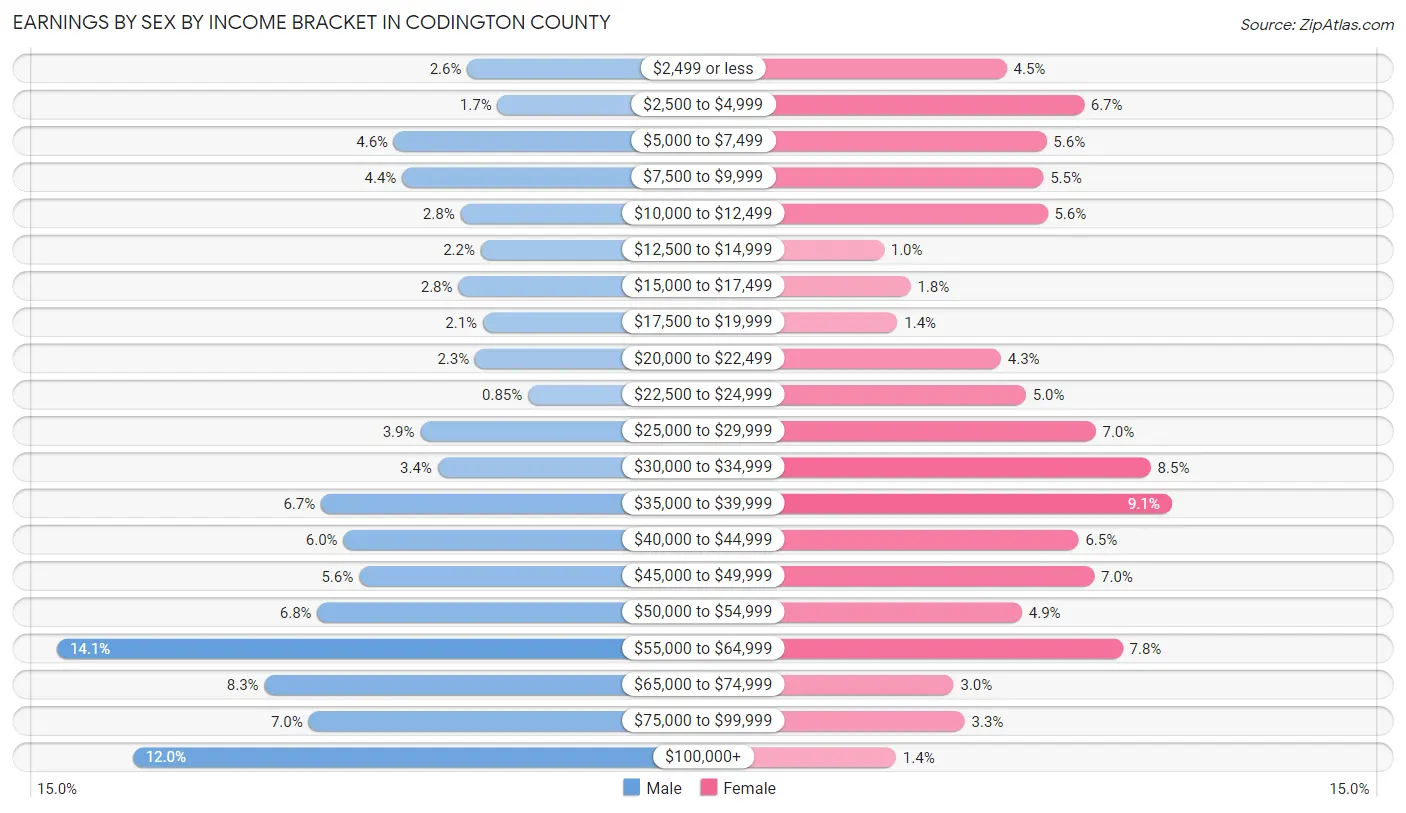
| Income | Male | Female |
| $2,499 or less | 225 (2.6%) | 349 (4.5%) |
| $2,500 to $4,999 | 150 (1.7%) | 517 (6.7%) |
| $5,000 to $7,499 | 406 (4.6%) | 436 (5.6%) |
| $7,500 to $9,999 | 386 (4.4%) | 429 (5.5%) |
| $10,000 to $12,499 | 242 (2.8%) | 438 (5.6%) |
| $12,500 to $14,999 | 192 (2.2%) | 81 (1.0%) |
| $15,000 to $17,499 | 247 (2.8%) | 139 (1.8%) |
| $17,500 to $19,999 | 186 (2.1%) | 110 (1.4%) |
| $20,000 to $22,499 | 206 (2.3%) | 336 (4.3%) |
| $22,500 to $24,999 | 75 (0.9%) | 391 (5.0%) |
| $25,000 to $29,999 | 341 (3.9%) | 543 (7.0%) |
| $30,000 to $34,999 | 298 (3.4%) | 663 (8.5%) |
| $35,000 to $39,999 | 586 (6.7%) | 709 (9.1%) |
| $40,000 to $44,999 | 531 (6.0%) | 506 (6.5%) |
| $45,000 to $49,999 | 492 (5.6%) | 540 (7.0%) |
| $50,000 to $54,999 | 595 (6.8%) | 382 (4.9%) |
| $55,000 to $64,999 | 1,239 (14.1%) | 602 (7.7%) |
| $65,000 to $74,999 | 726 (8.3%) | 233 (3.0%) |
| $75,000 to $99,999 | 617 (7.0%) | 257 (3.3%) |
| $100,000+ | 1,051 (12.0%) | 107 (1.4%) |
| Total | 8,791 (100.0%) | 7,768 (100.0%) |
Earnings by Sex by Educational Attainment in Codington County
Average earnings in Codington County are $54,228 for men and $34,569 for women, a difference of 36.2%. Men with an educational attainment of graduate degree enjoy the highest average annual earnings of $78,625, while those with less than high school education earn the least with $40,625. Women with an educational attainment of graduate degree earn the most with the average annual earnings of $55,905, while those with less than high school education have the smallest earnings of $21,429.
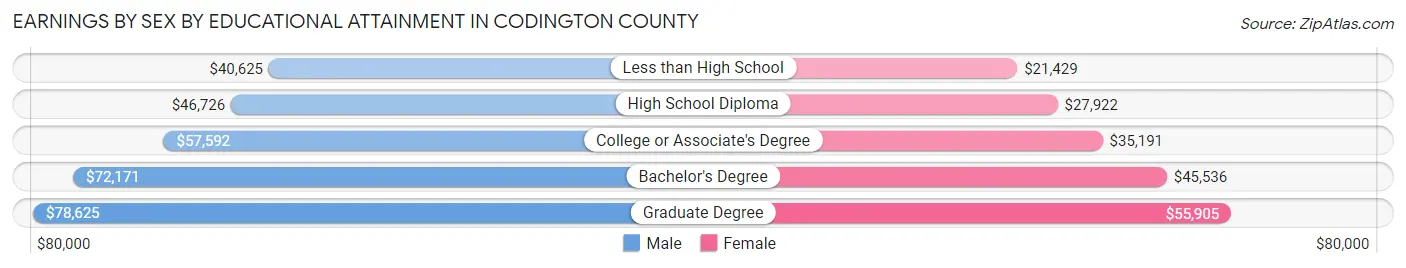
| Educational Attainment | Male Income | Female Income |
| Less than High School | $40,625 | $21,429 |
| High School Diploma | $46,726 | $27,922 |
| College or Associate's Degree | $57,592 | $35,191 |
| Bachelor's Degree | $72,171 | $45,536 |
| Graduate Degree | $78,625 | $55,905 |
| Total | $54,228 | $34,569 |
Family Income in Codington County
Family Income Brackets in Codington County
According to the Codington County family income data, there are 1,844 families falling into the $100,000 to $149,999 income range, which is the most common income bracket and makes up 26.0% of all families. Conversely, the $10,000 to $14,999 income bracket is the least frequent group with only 64 families (0.9%) belonging to this category.
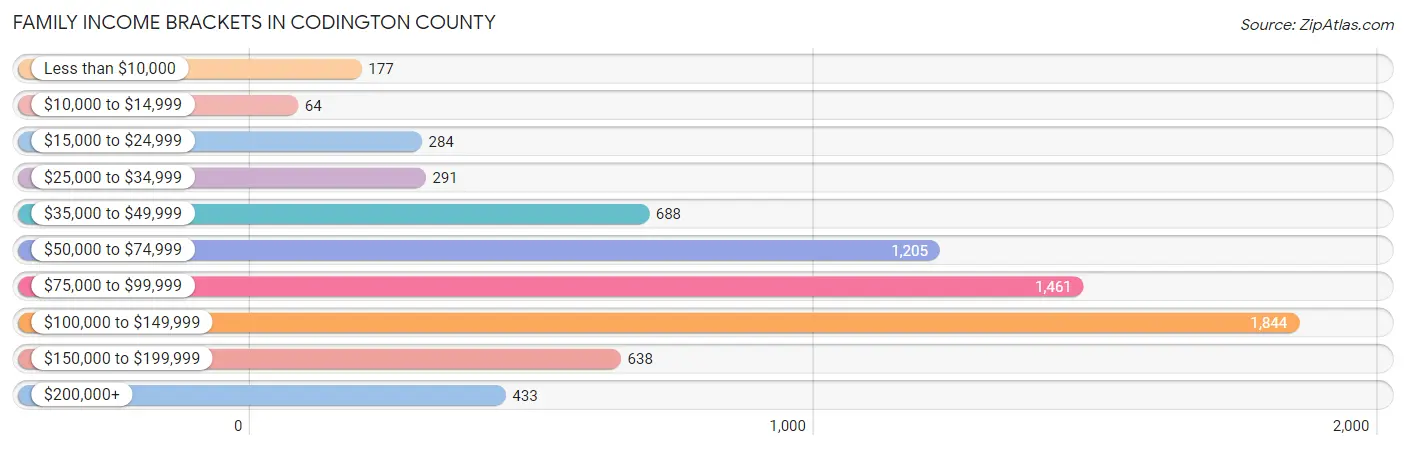
| Income Bracket | # Families | % Families |
| Less than $10,000 | 177 | 2.5% |
| $10,000 to $14,999 | 64 | 0.9% |
| $15,000 to $24,999 | 284 | 4.0% |
| $25,000 to $34,999 | 291 | 4.1% |
| $35,000 to $49,999 | 688 | 9.7% |
| $50,000 to $74,999 | 1,205 | 17.0% |
| $75,000 to $99,999 | 1,461 | 20.6% |
| $100,000 to $149,999 | 1,844 | 26.0% |
| $150,000 to $199,999 | 638 | 9.0% |
| $200,000+ | 433 | 6.1% |
Family Income by Famaliy Size in Codington County
5-person families (691 | 9.7%) account for the highest median family income in Codington County with $101,925 per family, while 2-person families (3,978 | 56.1%) have the highest median income of $40,328 per family member.
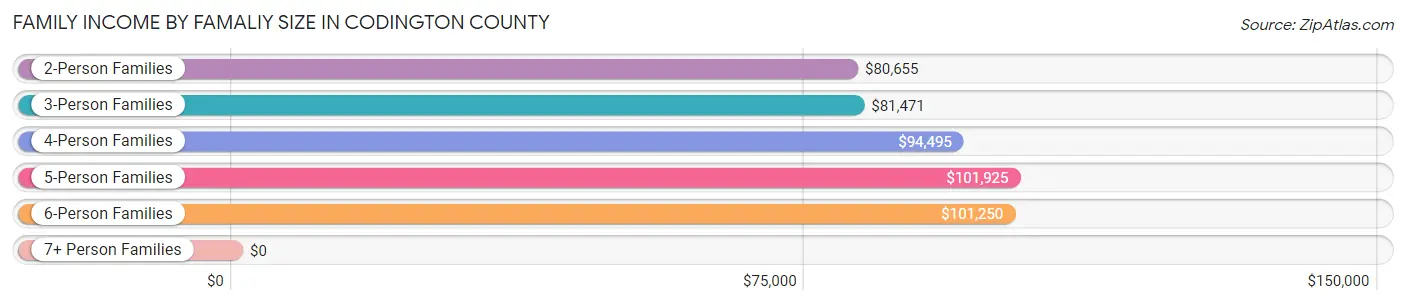
| Income Bracket | # Families | Median Income |
| 2-Person Families | 3,978 (56.1%) | $80,655 |
| 3-Person Families | 992 (14.0%) | $81,471 |
| 4-Person Families | 1,094 (15.4%) | $94,495 |
| 5-Person Families | 691 (9.7%) | $101,925 |
| 6-Person Families | 258 (3.6%) | $101,250 |
| 7+ Person Families | 78 (1.1%) | $0 |
| Total | 7,091 (100.0%) | $88,199 |
Family Income by Number of Earners in Codington County
The median family income in Codington County is $88,199, with families comprising 3+ earners (707) having the highest median family income of $106,875, while families with no earners (998) have the lowest median family income of $49,271, accounting for 10.0% and 14.1% of families, respectively.
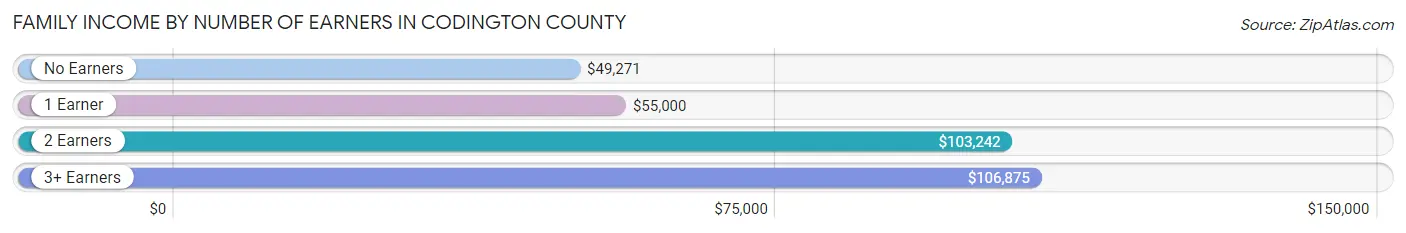
| Number of Earners | # Families | Median Income |
| No Earners | 998 (14.1%) | $49,271 |
| 1 Earner | 1,596 (22.5%) | $55,000 |
| 2 Earners | 3,790 (53.4%) | $103,242 |
| 3+ Earners | 707 (10.0%) | $106,875 |
| Total | 7,091 (100.0%) | $88,199 |
Household Income in Codington County
Household Income Brackets in Codington County
With 2,153 households falling in the category, the $50,000 to $74,999 income range is the most frequent in Codington County, accounting for 17.7% of all households. In contrast, only 438 households (3.6%) fall into the $10,000 to $14,999 income bracket, making it the least populous group.
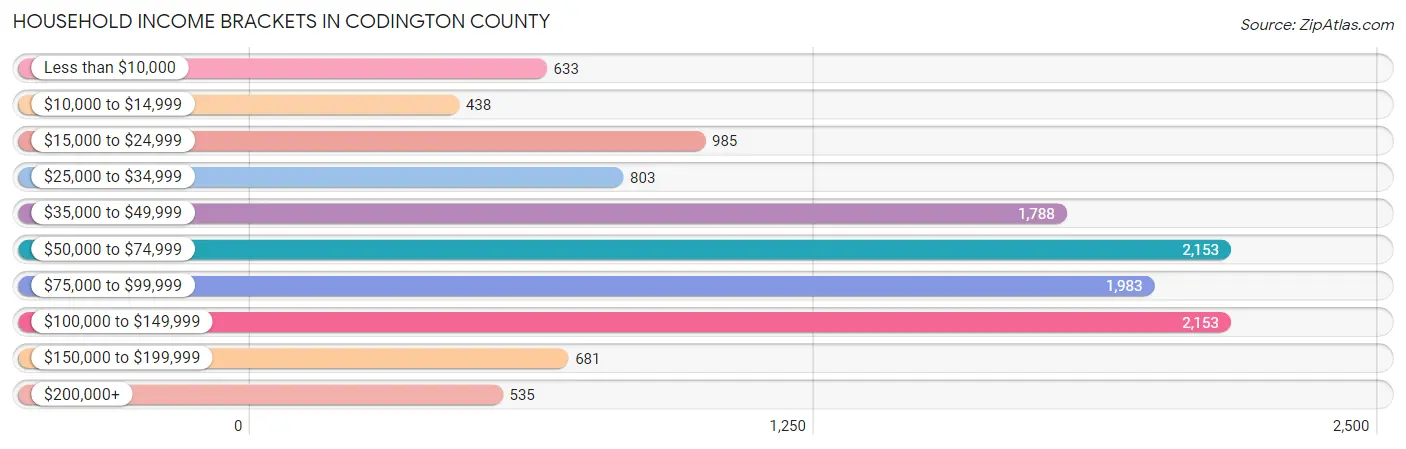
| Income Bracket | # Households | % Households |
| Less than $10,000 | 633 | 5.2% |
| $10,000 to $14,999 | 438 | 3.6% |
| $15,000 to $24,999 | 985 | 8.1% |
| $25,000 to $34,999 | 803 | 6.6% |
| $35,000 to $49,999 | 1,788 | 14.7% |
| $50,000 to $74,999 | 2,153 | 17.7% |
| $75,000 to $99,999 | 1,983 | 16.3% |
| $100,000 to $149,999 | 2,153 | 17.7% |
| $150,000 to $199,999 | 681 | 5.6% |
| $200,000+ | 535 | 4.4% |
Household Income by Householder Age in Codington County
The median household income in Codington County is $65,747, with the highest median household income of $81,081 found in the 45 to 64 years age bracket for the primary householder. A total of 3,766 households (31.0%) fall into this category. Meanwhile, the 15 to 24 years age bracket for the primary householder has the lowest median household income of $34,700, with 1,062 households (8.7%) in this group.
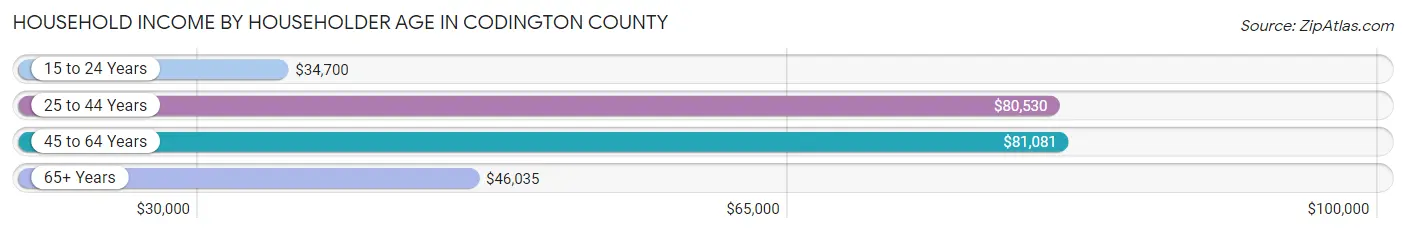
| Income Bracket | # Households | Median Income |
| 15 to 24 Years | 1,062 (8.7%) | $34,700 |
| 25 to 44 Years | 3,874 (31.9%) | $80,530 |
| 45 to 64 Years | 3,766 (31.0%) | $81,081 |
| 65+ Years | 3,463 (28.5%) | $46,035 |
| Total | 12,165 (100.0%) | $65,747 |
Poverty in Codington County
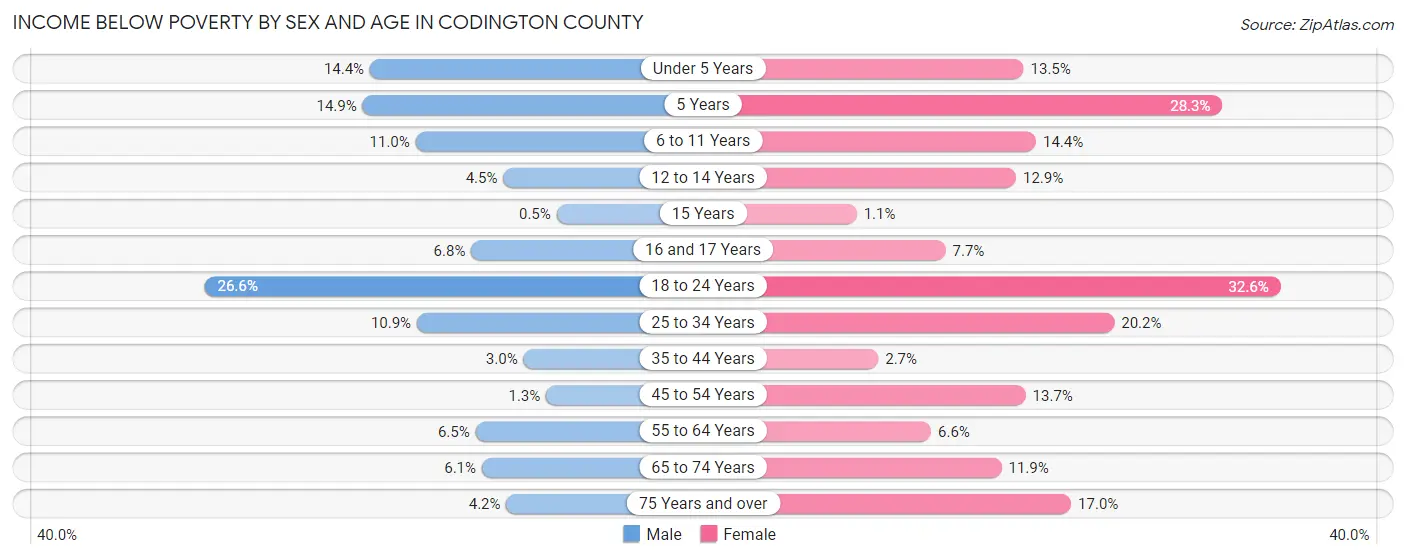
Income Below Poverty by Sex and Age in Codington County
With 8.3% poverty level for males and 13.7% for females among the residents of Codington County, 18 to 24 year old males and 18 to 24 year old females are the most vulnerable to poverty, with 342 males (26.6%) and 358 females (32.6%) in their respective age groups living below the poverty level.
| Age Bracket | Male | Female |
| Under 5 Years | 106 (14.4%) | 105 (13.5%) |
| 5 Years | 24 (14.9%) | 63 (28.2%) |
| 6 to 11 Years | 117 (11.0%) | 175 (14.4%) |
| 12 to 14 Years | 28 (4.5%) | 66 (12.9%) |
| 15 Years | 1 (0.5%) | 1 (1.1%) |
| 16 and 17 Years | 32 (6.8%) | 37 (7.7%) |
| 18 to 24 Years | 342 (26.6%) | 358 (32.6%) |
| 25 to 34 Years | 197 (10.9%) | 328 (20.2%) |
| 35 to 44 Years | 55 (3.0%) | 45 (2.7%) |
| 45 to 54 Years | 22 (1.3%) | 207 (13.7%) |
| 55 to 64 Years | 124 (6.5%) | 129 (6.6%) |
| 65 to 74 Years | 90 (6.0%) | 166 (11.9%) |
| 75 Years and over | 37 (4.2%) | 205 (17.0%) |
| Total | 1,175 (8.3%) | 1,885 (13.7%) |
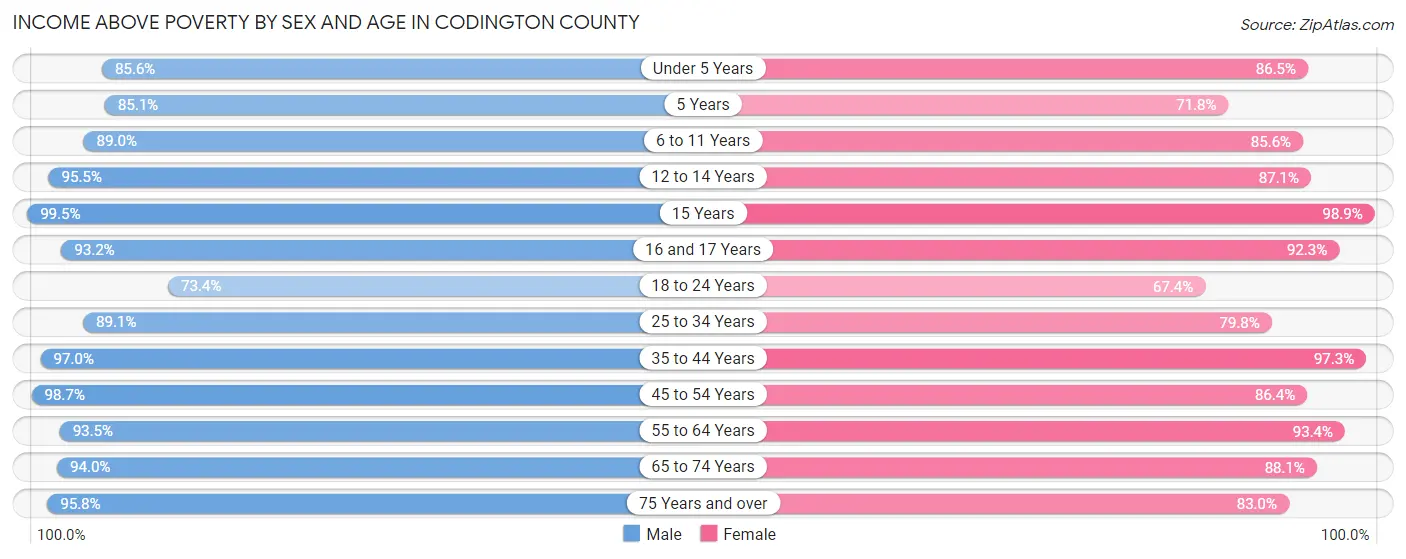
Income Above Poverty by Sex and Age in Codington County
According to the poverty statistics in Codington County, males aged 15 years and females aged 15 years are the age groups that are most secure financially, with 99.5% of males and 98.9% of females in these age groups living above the poverty line.
| Age Bracket | Male | Female |
| Under 5 Years | 632 (85.6%) | 673 (86.5%) |
| 5 Years | 137 (85.1%) | 160 (71.8%) |
| 6 to 11 Years | 950 (89.0%) | 1,039 (85.6%) |
| 12 to 14 Years | 600 (95.5%) | 444 (87.1%) |
| 15 Years | 201 (99.5%) | 89 (98.9%) |
| 16 and 17 Years | 436 (93.2%) | 443 (92.3%) |
| 18 to 24 Years | 942 (73.4%) | 741 (67.4%) |
| 25 to 34 Years | 1,616 (89.1%) | 1,293 (79.8%) |
| 35 to 44 Years | 1,804 (97.0%) | 1,615 (97.3%) |
| 45 to 54 Years | 1,691 (98.7%) | 1,309 (86.4%) |
| 55 to 64 Years | 1,778 (93.5%) | 1,816 (93.4%) |
| 65 to 74 Years | 1,398 (94.0%) | 1,234 (88.1%) |
| 75 Years and over | 837 (95.8%) | 999 (83.0%) |
| Total | 13,022 (91.7%) | 11,855 (86.3%) |
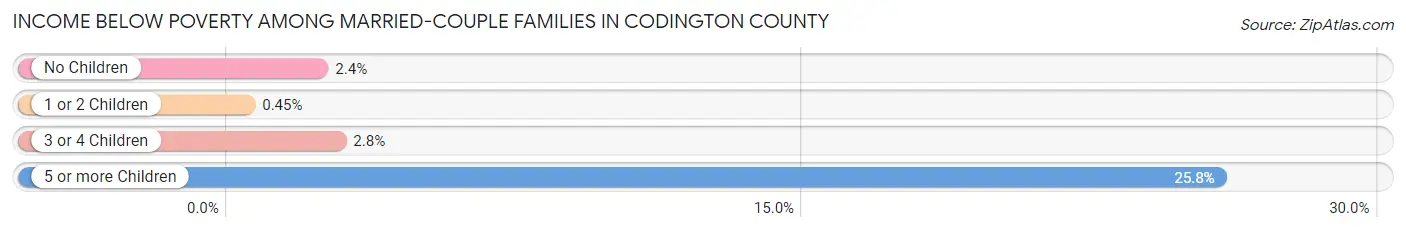
Income Below Poverty Among Married-Couple Families in Codington County
The poverty statistics for married-couple families in Codington County show that 2.0% or 119 of the total 5,837 families live below the poverty line. Families with 5 or more children have the highest poverty rate of 25.8%, comprising of 8 families. On the other hand, families with 1 or 2 children have the lowest poverty rate of 0.4%, which includes 7 families.
| Children | Above Poverty | Below Poverty |
| No Children | 3,311 (97.6%) | 80 (2.4%) |
| 1 or 2 Children | 1,561 (99.6%) | 7 (0.4%) |
| 3 or 4 Children | 823 (97.2%) | 24 (2.8%) |
| 5 or more Children | 23 (74.2%) | 8 (25.8%) |
| Total | 5,718 (98.0%) | 119 (2.0%) |
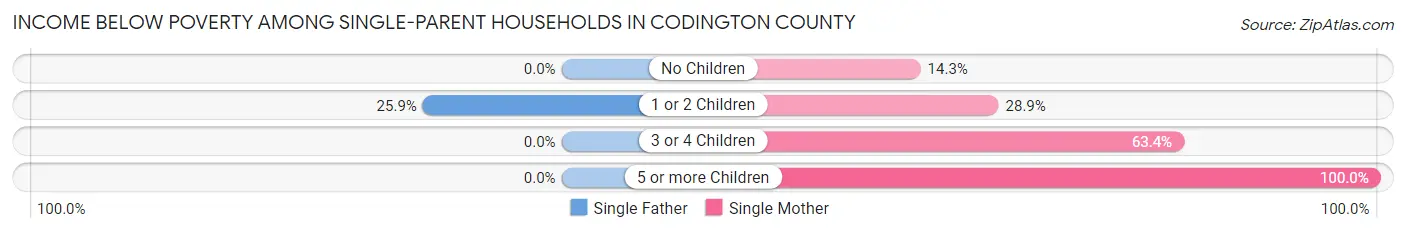
Income Below Poverty Among Single-Parent Households in Codington County
According to the poverty data in Codington County, 6.4% or 30 single-father households and 28.2% or 221 single-mother households are living below the poverty line. Among single-father households, those with 1 or 2 children have the highest poverty rate, with 30 households (25.9%) experiencing poverty. Likewise, among single-mother households, those with 5 or more children have the highest poverty rate, with 2 households (100.0%) falling below the poverty line.
| Children | Single Father | Single Mother |
| No Children | 0 (0.0%) | 41 (14.3%) |
| 1 or 2 Children | 30 (25.9%) | 114 (28.9%) |
| 3 or 4 Children | 0 (0.0%) | 64 (63.4%) |
| 5 or more Children | 0 (0.0%) | 2 (100.0%) |
| Total | 30 (6.4%) | 221 (28.2%) |
Income Below Poverty Among Married-Couple vs Single-Parent Households in Codington County
The poverty data for Codington County shows that 119 of the married-couple family households (2.0%) and 251 of the single-parent households (20.0%) are living below the poverty level. Within the married-couple family households, those with 5 or more children have the highest poverty rate, with 8 households (25.8%) falling below the poverty line. Among the single-parent households, those with 3 or 4 children have the highest poverty rate, with 64 household (36.6%) living below poverty.
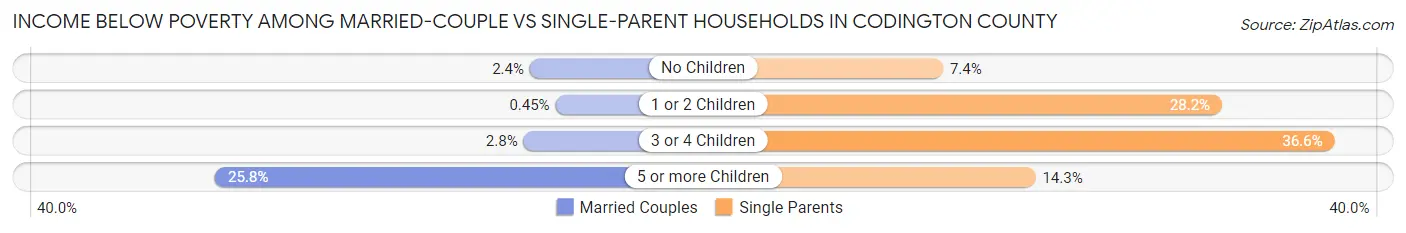
| Children | Married-Couple Families | Single-Parent Households |
| No Children | 80 (2.4%) | 41 (7.4%) |
| 1 or 2 Children | 7 (0.4%) | 144 (28.2%) |
| 3 or 4 Children | 24 (2.8%) | 64 (36.6%) |
| 5 or more Children | 8 (25.8%) | 2 (14.3%) |
| Total | 119 (2.0%) | 251 (20.0%) |
Employment Characteristics in Codington County
Employment by Class of Employer in Codington County
Among the 15,203 employed individuals in Codington County, private company employees (10,419 | 68.5%), local government employees (1,352 | 8.9%), and not-for-profit organizations (1,115 | 7.3%) make up the most common classes of employment.
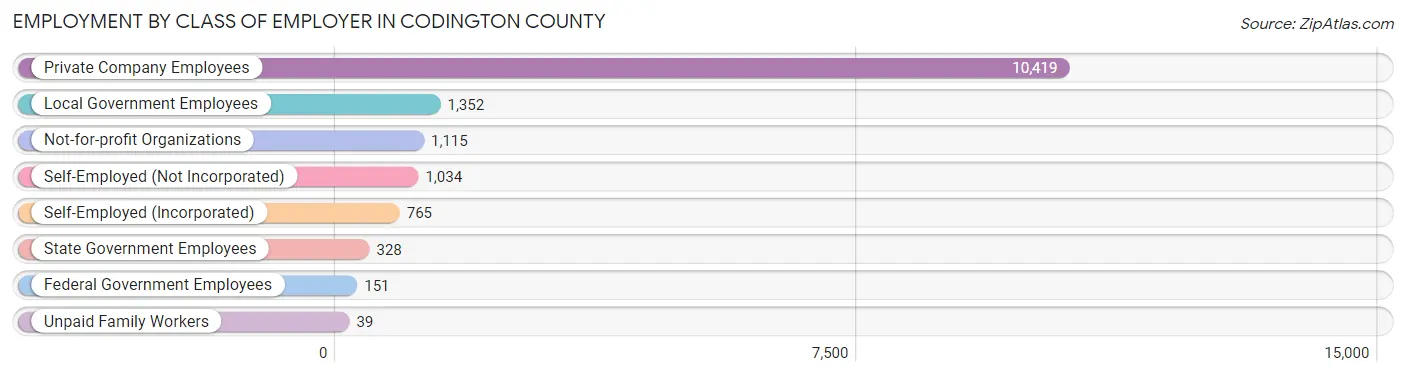
| Employer Class | # Employees | % Employees |
| Private Company Employees | 10,419 | 68.5% |
| Self-Employed (Incorporated) | 765 | 5.0% |
| Self-Employed (Not Incorporated) | 1,034 | 6.8% |
| Not-for-profit Organizations | 1,115 | 7.3% |
| Local Government Employees | 1,352 | 8.9% |
| State Government Employees | 328 | 2.2% |
| Federal Government Employees | 151 | 1.0% |
| Unpaid Family Workers | 39 | 0.3% |
| Total | 15,203 | 100.0% |
Employment Status by Age in Codington County
According to the labor force statistics for Codington County, out of the total population over 16 years of age (22,688), 69.1% or 15,677 individuals are in the labor force, with 1.5% or 235 of them unemployed. The age group with the highest labor force participation rate is 25 to 29 years, with 93.0% or 1,606 individuals in the labor force. Within the labor force, the 30 to 34 years age range has the highest percentage of unemployed individuals, with 3.6% or 55 of them being unemployed.
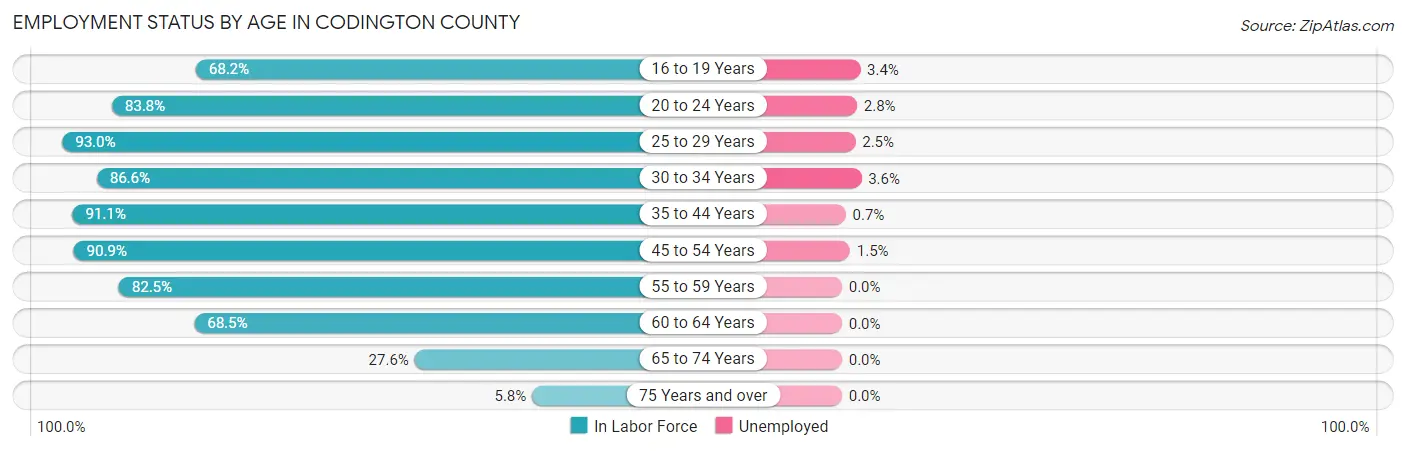
| Age Bracket | In Labor Force | Unemployed |
| 16 to 19 Years | 1,161 (68.2%) | 39 (3.4%) |
| 20 to 24 Years | 1,379 (83.8%) | 39 (2.8%) |
| 25 to 29 Years | 1,606 (93.0%) | 40 (2.5%) |
| 30 to 34 Years | 1,521 (86.6%) | 55 (3.6%) |
| 35 to 44 Years | 3,218 (91.1%) | 23 (0.7%) |
| 45 to 54 Years | 2,938 (90.9%) | 44 (1.5%) |
| 55 to 59 Years | 1,575 (82.5%) | 0 (0.0%) |
| 60 to 64 Years | 1,340 (68.5%) | 0 (0.0%) |
| 65 to 74 Years | 804 (27.6%) | 0 (0.0%) |
| 75 Years and over | 134 (5.8%) | 0 (0.0%) |
| Total | 15,677 (69.1%) | 235 (1.5%) |
Employment Status by Educational Attainment in Codington County
According to labor force statistics for Codington County, 86.4% of individuals (12,193) out of the total population between 25 and 64 years of age (14,112) are in the labor force, with 1.3% or 159 of them being unemployed. The group with the highest labor force participation rate are those with the educational attainment of college / associate degree, with 92.0% or 4,509 individuals in the labor force. Within the labor force, individuals with college / associate degree education have the highest percentage of unemployment, with 2.0% or 90 of them being unemployed.
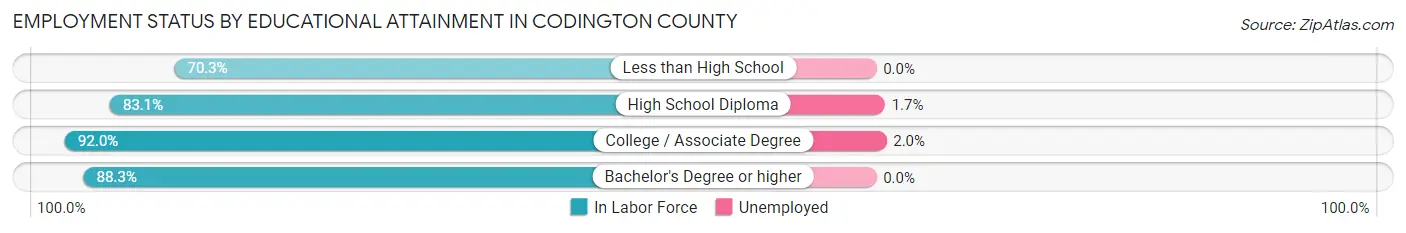
| Educational Attainment | In Labor Force | Unemployed |
| Less than High School | 709 (70.3%) | 0 (0.0%) |
| High School Diploma | 4,234 (83.1%) | 87 (1.7%) |
| College / Associate Degree | 4,509 (92.0%) | 98 (2.0%) |
| Bachelor's Degree or higher | 2,743 (88.3%) | 0 (0.0%) |
| Total | 12,193 (86.4%) | 183 (1.3%) |
Employment Occupations by Sex in Codington County
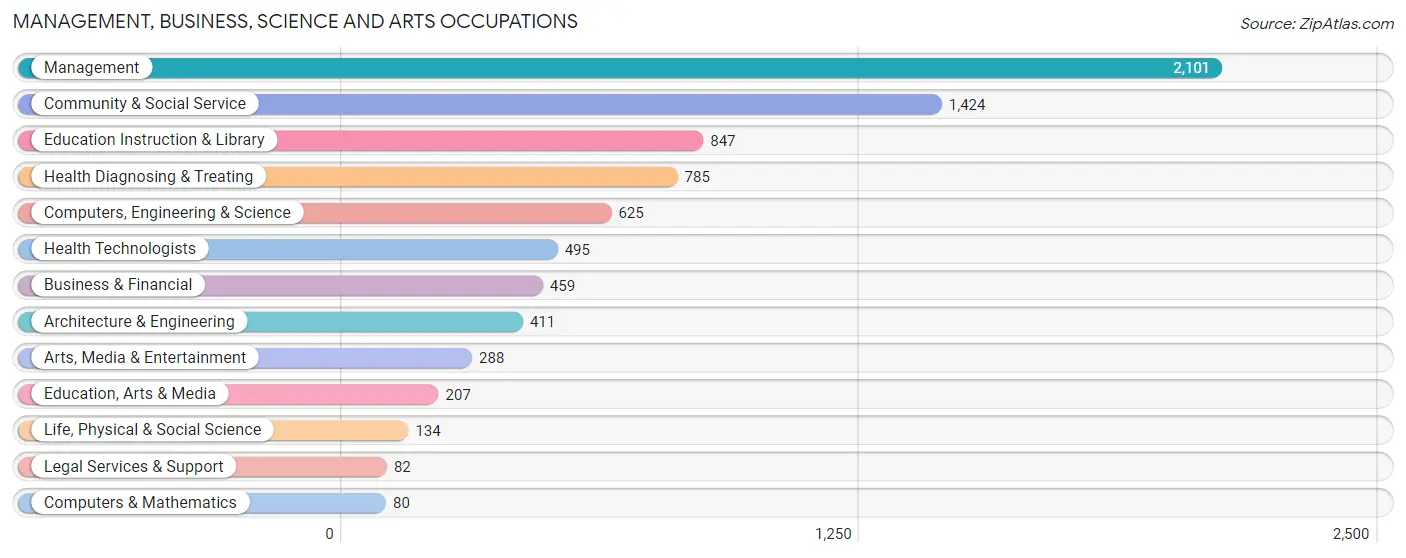
Management, Business, Science and Arts Occupations
The most common Management, Business, Science and Arts occupations in Codington County are Management (2,101 | 13.7%), Community & Social Service (1,424 | 9.2%), Education Instruction & Library (847 | 5.5%), Health Diagnosing & Treating (785 | 5.1%), and Computers, Engineering & Science (625 | 4.1%).
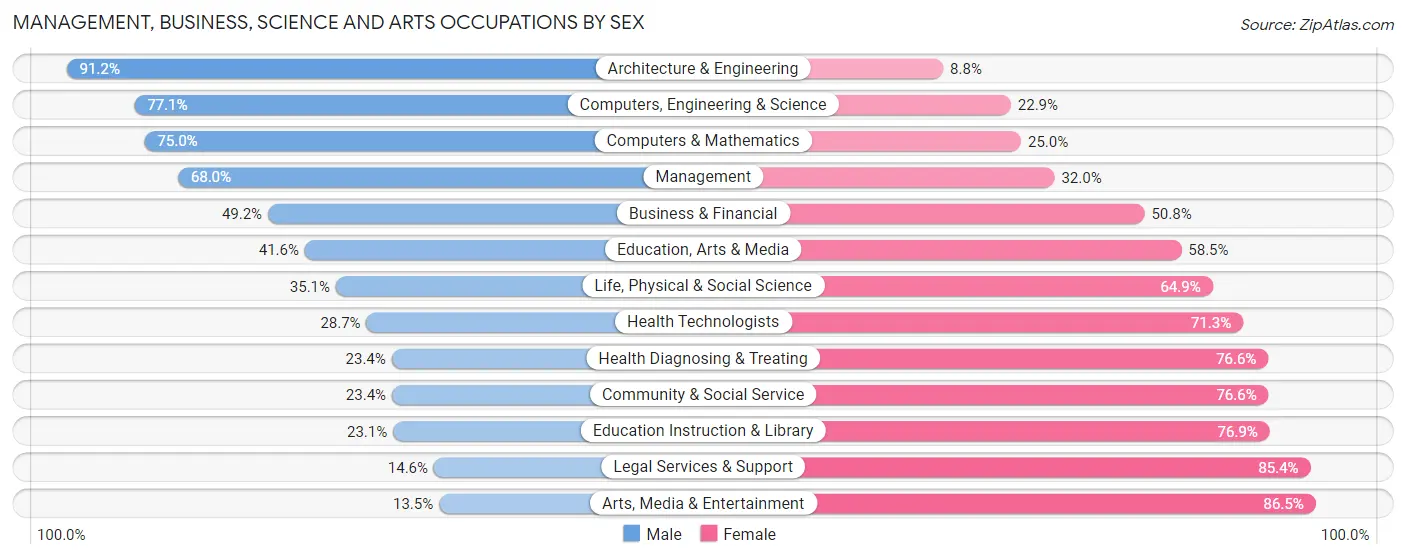
Management, Business, Science and Arts Occupations by Sex
Within the Management, Business, Science and Arts occupations in Codington County, the most male-oriented occupations are Architecture & Engineering (91.2%), Computers, Engineering & Science (77.1%), and Computers & Mathematics (75.0%), while the most female-oriented occupations are Arts, Media & Entertainment (86.5%), Legal Services & Support (85.4%), and Education Instruction & Library (76.9%).
| Occupation | Male | Female |
| Management | 1,429 (68.0%) | 672 (32.0%) |
| Business & Financial | 226 (49.2%) | 233 (50.8%) |
| Computers, Engineering & Science | 482 (77.1%) | 143 (22.9%) |
| Computers & Mathematics | 60 (75.0%) | 20 (25.0%) |
| Architecture & Engineering | 375 (91.2%) | 36 (8.8%) |
| Life, Physical & Social Science | 47 (35.1%) | 87 (64.9%) |
| Community & Social Service | 333 (23.4%) | 1,091 (76.6%) |
| Education, Arts & Media | 86 (41.5%) | 121 (58.5%) |
| Legal Services & Support | 12 (14.6%) | 70 (85.4%) |
| Education Instruction & Library | 196 (23.1%) | 651 (76.9%) |
| Arts, Media & Entertainment | 39 (13.5%) | 249 (86.5%) |
| Health Diagnosing & Treating | 184 (23.4%) | 601 (76.6%) |
| Health Technologists | 142 (28.7%) | 353 (71.3%) |
| Total (Category) | 2,654 (49.2%) | 2,740 (50.8%) |
| Total (Overall) | 8,269 (53.7%) | 7,128 (46.3%) |
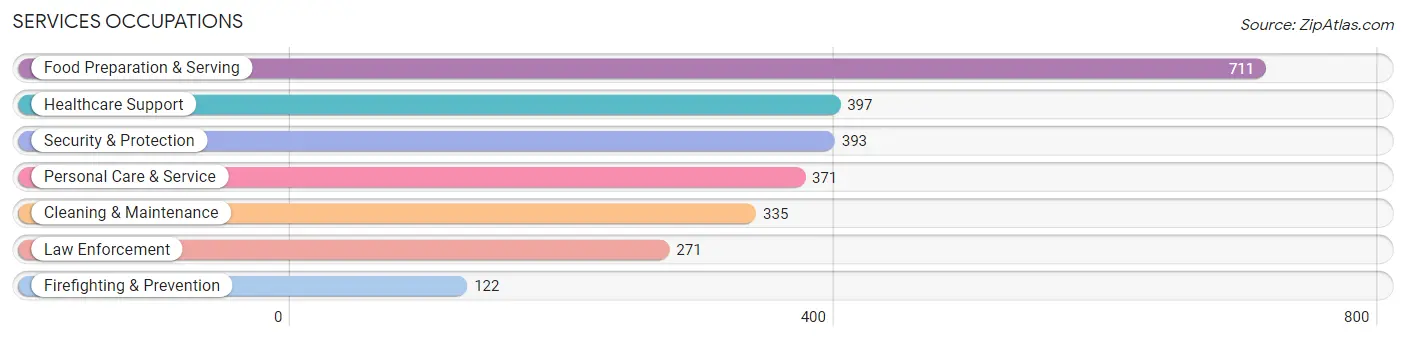
Services Occupations
The most common Services occupations in Codington County are Food Preparation & Serving (711 | 4.6%), Healthcare Support (397 | 2.6%), Security & Protection (393 | 2.5%), Personal Care & Service (371 | 2.4%), and Cleaning & Maintenance (335 | 2.2%).
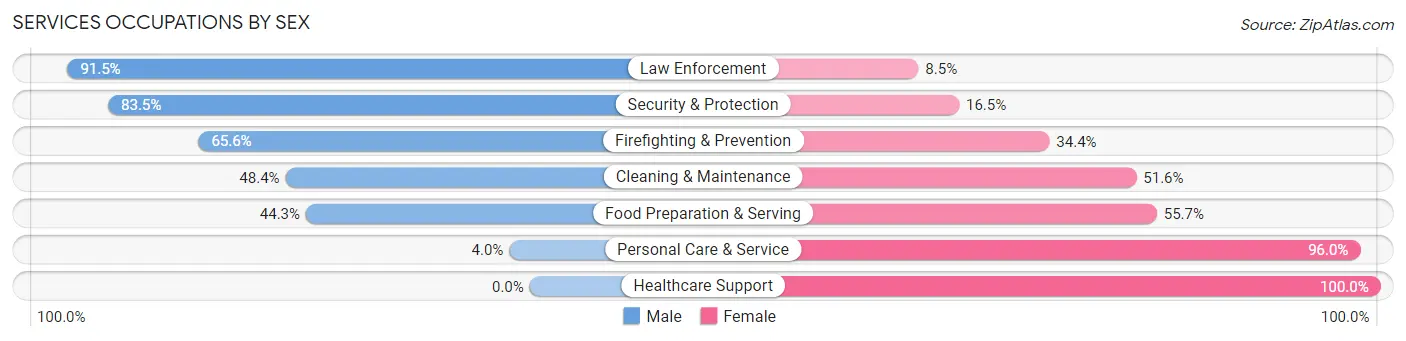
Services Occupations by Sex
Within the Services occupations in Codington County, the most male-oriented occupations are Law Enforcement (91.5%), Security & Protection (83.5%), and Firefighting & Prevention (65.6%), while the most female-oriented occupations are Healthcare Support (100.0%), Personal Care & Service (96.0%), and Food Preparation & Serving (55.7%).
| Occupation | Male | Female |
| Healthcare Support | 0 (0.0%) | 397 (100.0%) |
| Security & Protection | 328 (83.5%) | 65 (16.5%) |
| Firefighting & Prevention | 80 (65.6%) | 42 (34.4%) |
| Law Enforcement | 248 (91.5%) | 23 (8.5%) |
| Food Preparation & Serving | 315 (44.3%) | 396 (55.7%) |
| Cleaning & Maintenance | 162 (48.4%) | 173 (51.6%) |
| Personal Care & Service | 15 (4.0%) | 356 (96.0%) |
| Total (Category) | 820 (37.1%) | 1,387 (62.8%) |
| Total (Overall) | 8,269 (53.7%) | 7,128 (46.3%) |
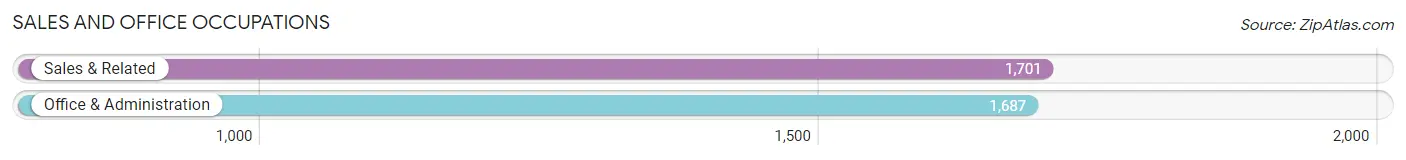
Sales and Office Occupations
The most common Sales and Office occupations in Codington County are Sales & Related (1,701 | 11.1%), and Office & Administration (1,687 | 11.0%).
Sales and Office Occupations by Sex
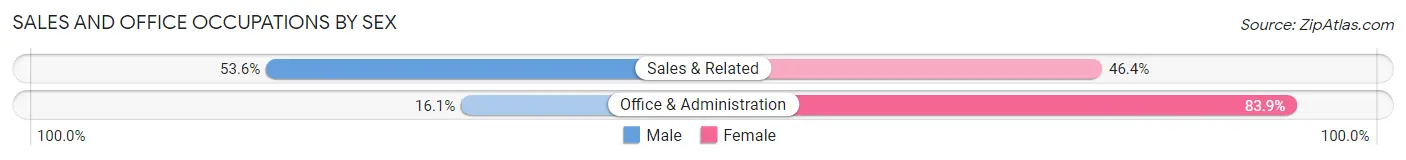
| Occupation | Male | Female |
| Sales & Related | 911 (53.6%) | 790 (46.4%) |
| Office & Administration | 271 (16.1%) | 1,416 (83.9%) |
| Total (Category) | 1,182 (34.9%) | 2,206 (65.1%) |
| Total (Overall) | 8,269 (53.7%) | 7,128 (46.3%) |
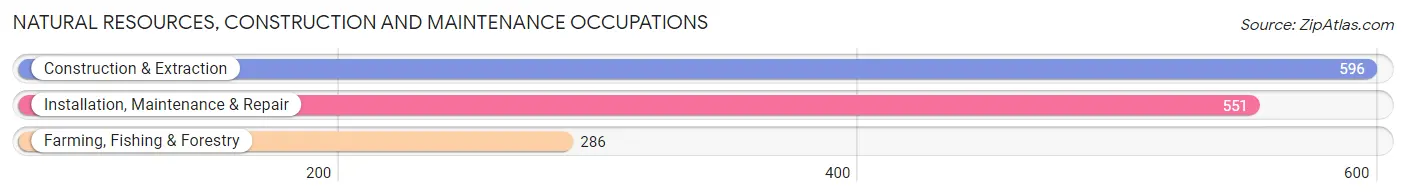
Natural Resources, Construction and Maintenance Occupations
The most common Natural Resources, Construction and Maintenance occupations in Codington County are Construction & Extraction (596 | 3.9%), Installation, Maintenance & Repair (551 | 3.6%), and Farming, Fishing & Forestry (286 | 1.9%).
Natural Resources, Construction and Maintenance Occupations by Sex
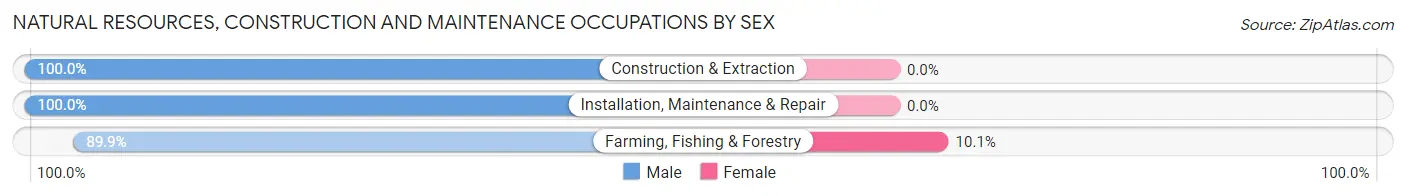
| Occupation | Male | Female |
| Farming, Fishing & Forestry | 257 (89.9%) | 29 (10.1%) |
| Construction & Extraction | 596 (100.0%) | 0 (0.0%) |
| Installation, Maintenance & Repair | 551 (100.0%) | 0 (0.0%) |
| Total (Category) | 1,404 (98.0%) | 29 (2.0%) |
| Total (Overall) | 8,269 (53.7%) | 7,128 (46.3%) |
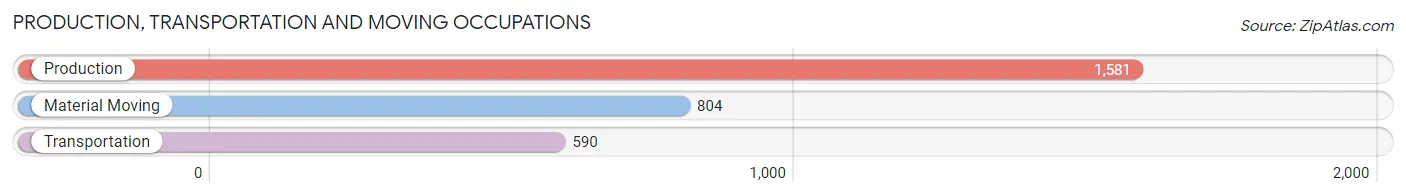
Production, Transportation and Moving Occupations
The most common Production, Transportation and Moving occupations in Codington County are Production (1,581 | 10.3%), Material Moving (804 | 5.2%), and Transportation (590 | 3.8%).
Production, Transportation and Moving Occupations by Sex
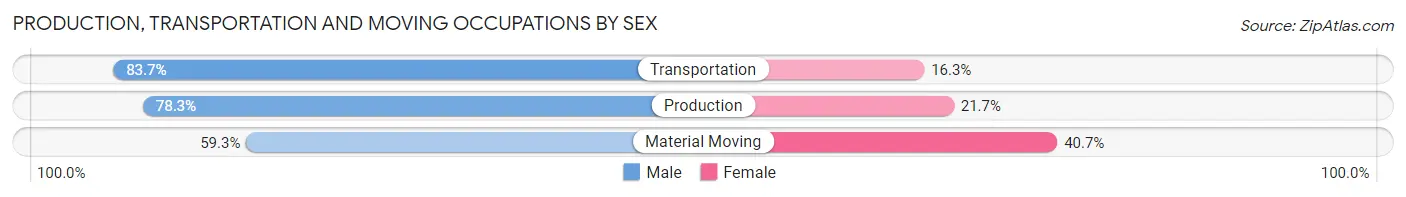
| Occupation | Male | Female |
| Production | 1,238 (78.3%) | 343 (21.7%) |
| Transportation | 494 (83.7%) | 96 (16.3%) |
| Material Moving | 477 (59.3%) | 327 (40.7%) |
| Total (Category) | 2,209 (74.3%) | 766 (25.8%) |
| Total (Overall) | 8,269 (53.7%) | 7,128 (46.3%) |
Employment Industries by Sex in Codington County
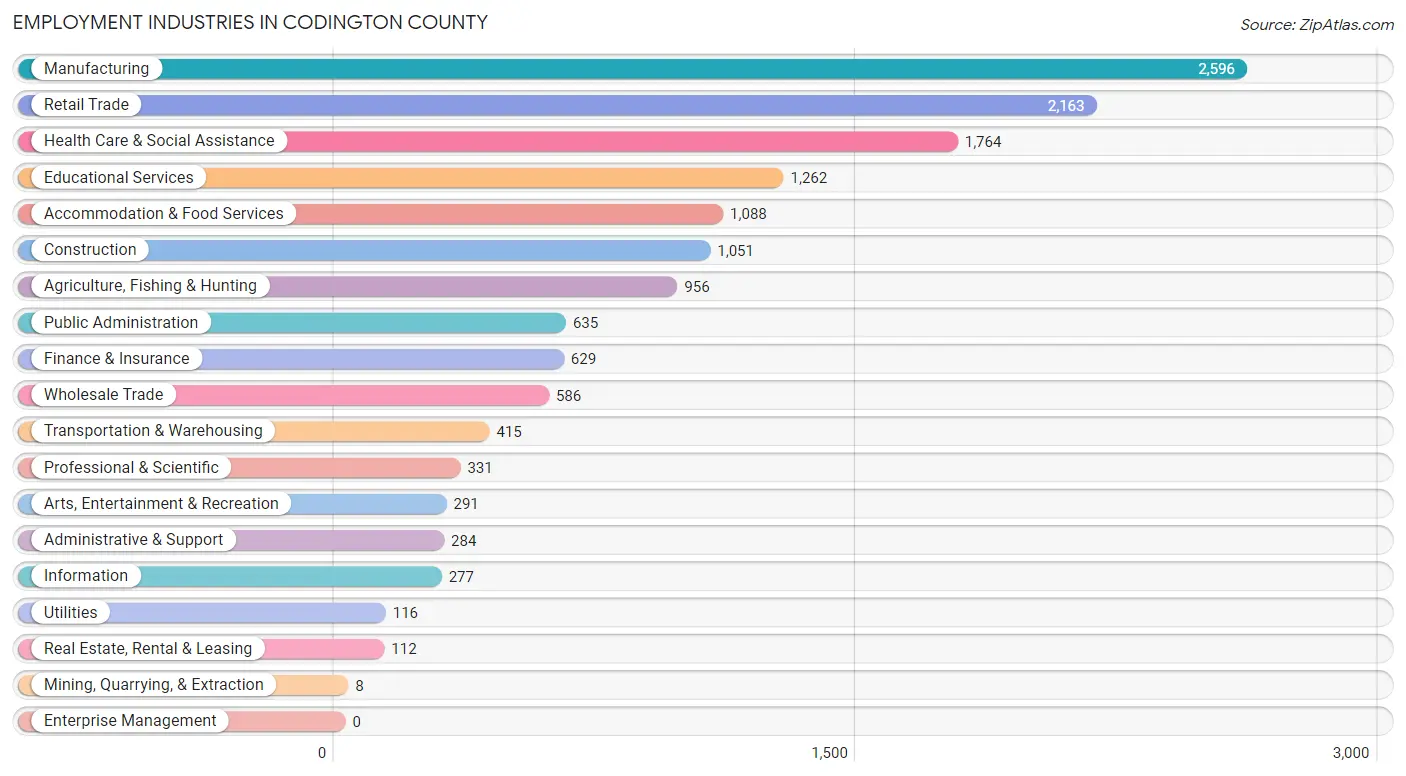
Employment Industries in Codington County
The major employment industries in Codington County include Manufacturing (2,596 | 16.9%), Retail Trade (2,163 | 14.1%), Health Care & Social Assistance (1,764 | 11.5%), Educational Services (1,262 | 8.2%), and Accommodation & Food Services (1,088 | 7.1%).
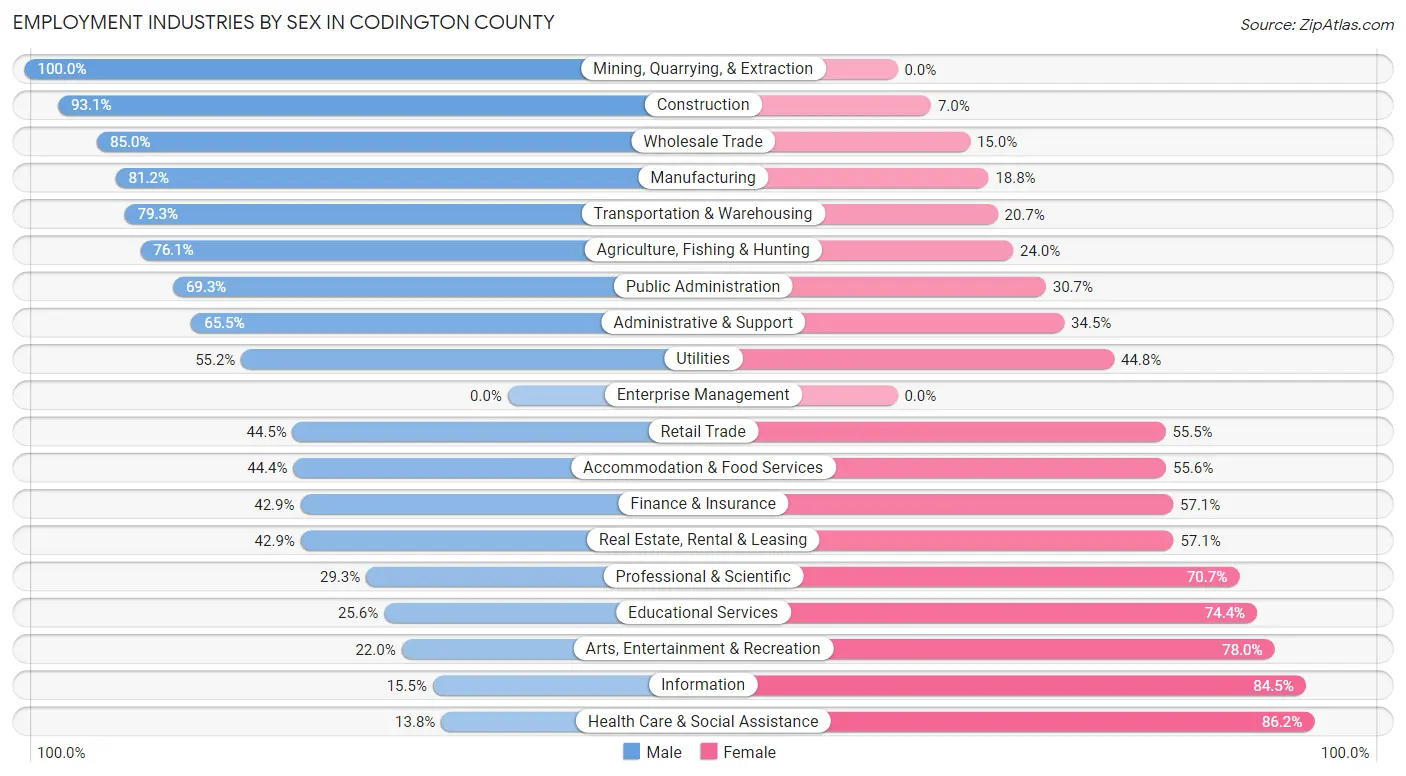
Employment Industries by Sex in Codington County
The Codington County industries that see more men than women are Mining, Quarrying, & Extraction (100.0%), Construction (93.0%), and Wholesale Trade (85.0%), whereas the industries that tend to have a higher number of women are Health Care & Social Assistance (86.2%), Information (84.5%), and Arts, Entertainment & Recreation (78.0%).
| Industry | Male | Female |
| Agriculture, Fishing & Hunting | 727 (76.0%) | 229 (23.9%) |
| Mining, Quarrying, & Extraction | 8 (100.0%) | 0 (0.0%) |
| Construction | 978 (93.0%) | 73 (7.0%) |
| Manufacturing | 2,107 (81.2%) | 489 (18.8%) |
| Wholesale Trade | 498 (85.0%) | 88 (15.0%) |
| Retail Trade | 963 (44.5%) | 1,200 (55.5%) |
| Transportation & Warehousing | 329 (79.3%) | 86 (20.7%) |
| Utilities | 64 (55.2%) | 52 (44.8%) |
| Information | 43 (15.5%) | 234 (84.5%) |
| Finance & Insurance | 270 (42.9%) | 359 (57.1%) |
| Real Estate, Rental & Leasing | 48 (42.9%) | 64 (57.1%) |
| Professional & Scientific | 97 (29.3%) | 234 (70.7%) |
| Enterprise Management | 0 (0.0%) | 0 (0.0%) |
| Administrative & Support | 186 (65.5%) | 98 (34.5%) |
| Educational Services | 323 (25.6%) | 939 (74.4%) |
| Health Care & Social Assistance | 243 (13.8%) | 1,521 (86.2%) |
| Arts, Entertainment & Recreation | 64 (22.0%) | 227 (78.0%) |
| Accommodation & Food Services | 483 (44.4%) | 605 (55.6%) |
| Public Administration | 440 (69.3%) | 195 (30.7%) |
| Total | 8,269 (53.7%) | 7,128 (46.3%) |
Education in Codington County
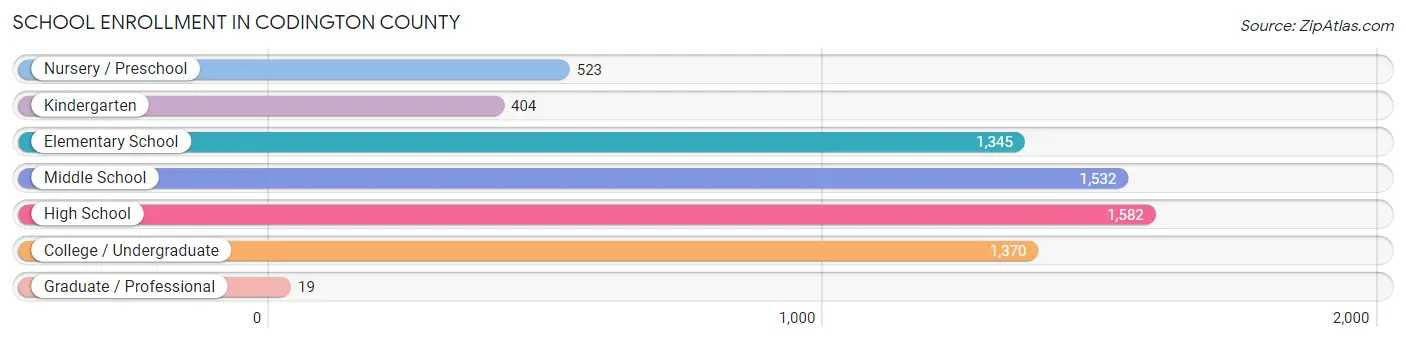
School Enrollment in Codington County
The most common levels of schooling among the 6,775 students in Codington County are high school (1,582 | 23.4%), middle school (1,532 | 22.6%), and college / undergraduate (1,370 | 20.2%).
| School Level | # Students | % Students |
| Nursery / Preschool | 523 | 7.7% |
| Kindergarten | 404 | 6.0% |
| Elementary School | 1,345 | 19.9% |
| Middle School | 1,532 | 22.6% |
| High School | 1,582 | 23.4% |
| College / Undergraduate | 1,370 | 20.2% |
| Graduate / Professional | 19 | 0.3% |
| Total | 6,775 | 100.0% |
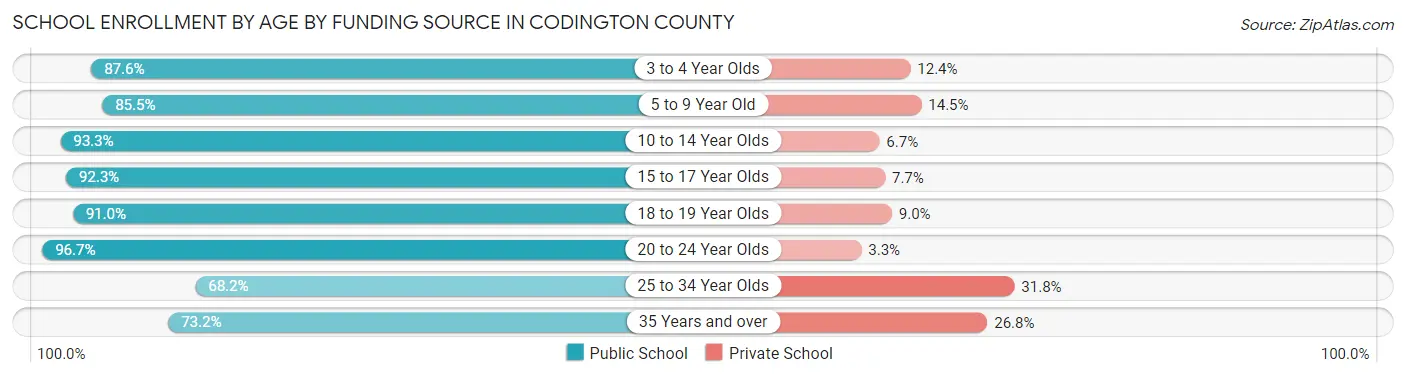
School Enrollment by Age by Funding Source in Codington County
Out of a total of 6,775 students who are enrolled in schools in Codington County, 678 (10.0%) attend a private institution, while the remaining 6,098 (90.0%) are enrolled in public schools. The age group of 25 to 34 year olds has the highest likelihood of being enrolled in private schools, with 69 (31.8% in the age bracket) enrolled. Conversely, the age group of 20 to 24 year olds has the lowest likelihood of being enrolled in a private school, with 646 (96.7% in the age bracket) attending a public institution.
| Age Bracket | Public School | Private School |
| 3 to 4 Year Olds | 275 (87.6%) | 39 (12.4%) |
| 5 to 9 Year Old | 1,472 (85.5%) | 249 (14.5%) |
| 10 to 14 Year Olds | 1,821 (93.3%) | 130 (6.7%) |
| 15 to 17 Year Olds | 1,126 (92.3%) | 94 (7.7%) |
| 18 to 19 Year Olds | 558 (91.0%) | 55 (9.0%) |
| 20 to 24 Year Olds | 646 (96.7%) | 22 (3.3%) |
| 25 to 34 Year Olds | 148 (68.2%) | 69 (31.8%) |
| 35 Years and over | 52 (73.2%) | 19 (26.8%) |
| Total | 6,098 (90.0%) | 678 (10.0%) |
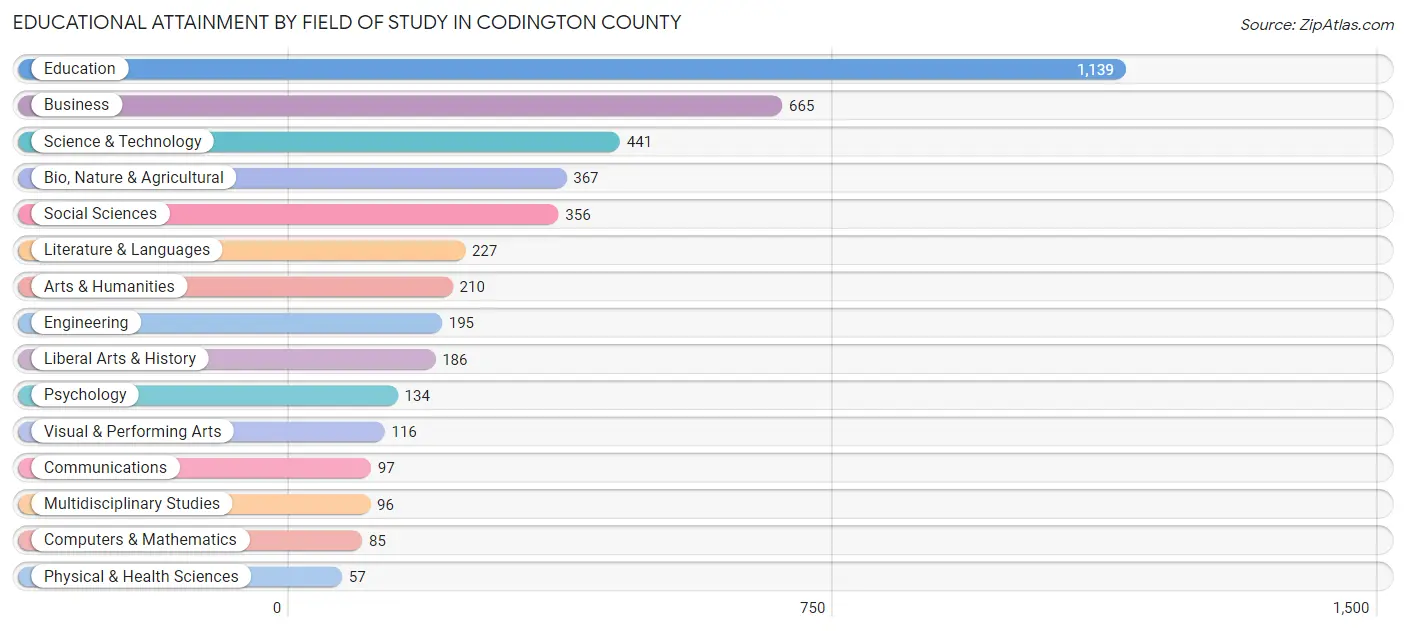
Educational Attainment by Field of Study in Codington County
Education (1,139 | 26.1%), business (665 | 15.2%), science & technology (441 | 10.1%), bio, nature & agricultural (367 | 8.4%), and social sciences (356 | 8.1%) are the most common fields of study among 4,371 individuals in Codington County who have obtained a bachelor's degree or higher.
| Field of Study | # Graduates | % Graduates |
| Computers & Mathematics | 85 | 1.9% |
| Bio, Nature & Agricultural | 367 | 8.4% |
| Physical & Health Sciences | 57 | 1.3% |
| Psychology | 134 | 3.1% |
| Social Sciences | 356 | 8.1% |
| Engineering | 195 | 4.5% |
| Multidisciplinary Studies | 96 | 2.2% |
| Science & Technology | 441 | 10.1% |
| Business | 665 | 15.2% |
| Education | 1,139 | 26.1% |
| Literature & Languages | 227 | 5.2% |
| Liberal Arts & History | 186 | 4.3% |
| Visual & Performing Arts | 116 | 2.6% |
| Communications | 97 | 2.2% |
| Arts & Humanities | 210 | 4.8% |
| Total | 4,371 | 100.0% |
Transportation & Commute in Codington County
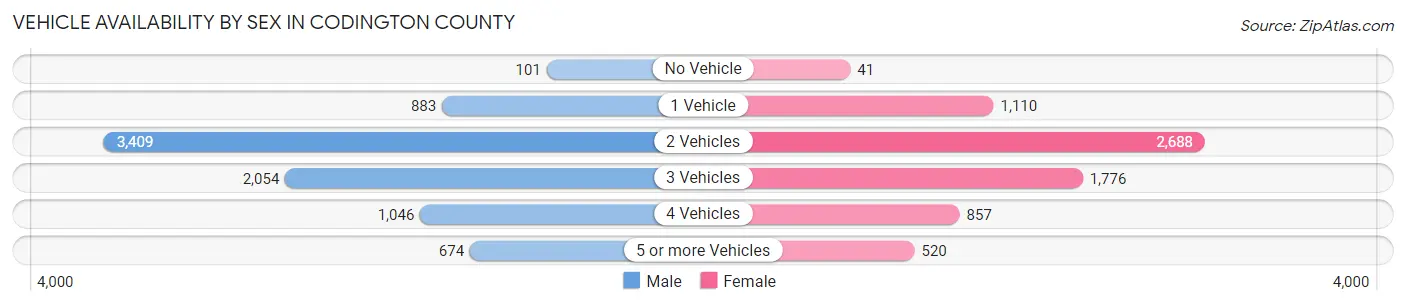
Vehicle Availability by Sex in Codington County
The most prevalent vehicle ownership categories in Codington County are males with 2 vehicles (3,409, accounting for 41.7%) and females with 2 vehicles (2,688, making up 48.8%).
| Vehicles Available | Male | Female |
| No Vehicle | 101 (1.2%) | 41 (0.6%) |
| 1 Vehicle | 883 (10.8%) | 1,110 (15.9%) |
| 2 Vehicles | 3,409 (41.7%) | 2,688 (38.4%) |
| 3 Vehicles | 2,054 (25.2%) | 1,776 (25.4%) |
| 4 Vehicles | 1,046 (12.8%) | 857 (12.3%) |
| 5 or more Vehicles | 674 (8.3%) | 520 (7.4%) |
| Total | 8,167 (100.0%) | 6,992 (100.0%) |
Commute Time in Codington County
The most frequently occuring commute durations in Codington County are 10 to 14 minutes (4,750 commuters, 32.9%), 5 to 9 minutes (3,811 commuters, 26.4%), and 15 to 19 minutes (1,860 commuters, 12.9%).
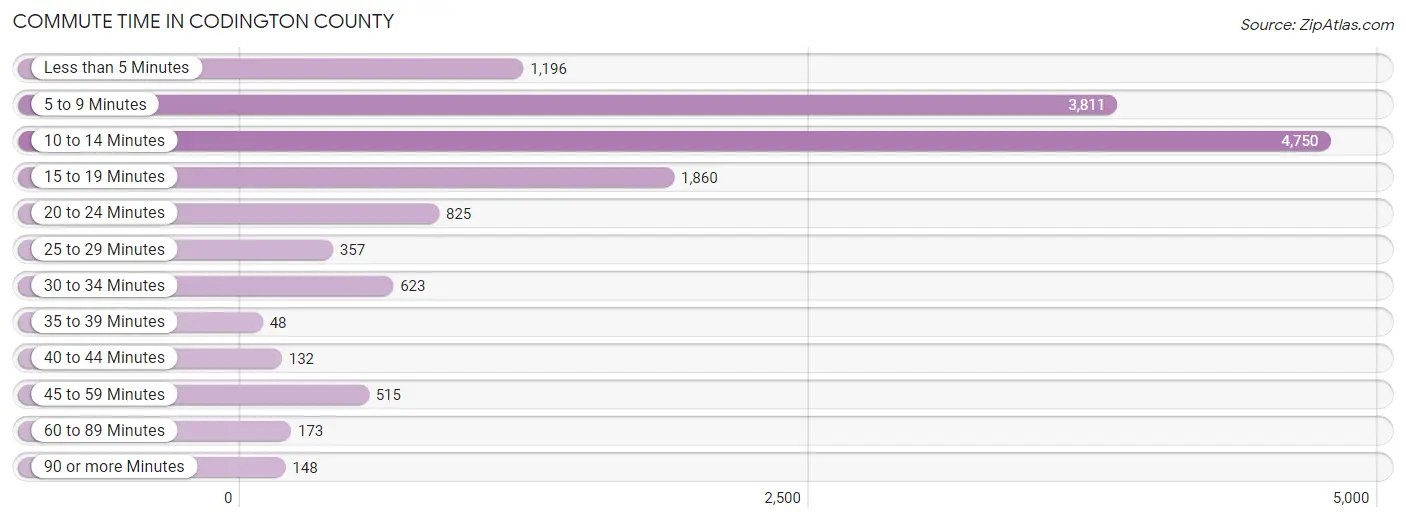
| Commute Time | # Commuters | % Commuters |
| Less than 5 Minutes | 1,196 | 8.3% |
| 5 to 9 Minutes | 3,811 | 26.4% |
| 10 to 14 Minutes | 4,750 | 32.9% |
| 15 to 19 Minutes | 1,860 | 12.9% |
| 20 to 24 Minutes | 825 | 5.7% |
| 25 to 29 Minutes | 357 | 2.5% |
| 30 to 34 Minutes | 623 | 4.3% |
| 35 to 39 Minutes | 48 | 0.3% |
| 40 to 44 Minutes | 132 | 0.9% |
| 45 to 59 Minutes | 515 | 3.6% |
| 60 to 89 Minutes | 173 | 1.2% |
| 90 or more Minutes | 148 | 1.0% |
Commute Time by Sex in Codington County
The most common commute times in Codington County are 10 to 14 minutes (2,525 commuters, 32.4%) for males and 10 to 14 minutes (2,225 commuters, 33.5%) for females.
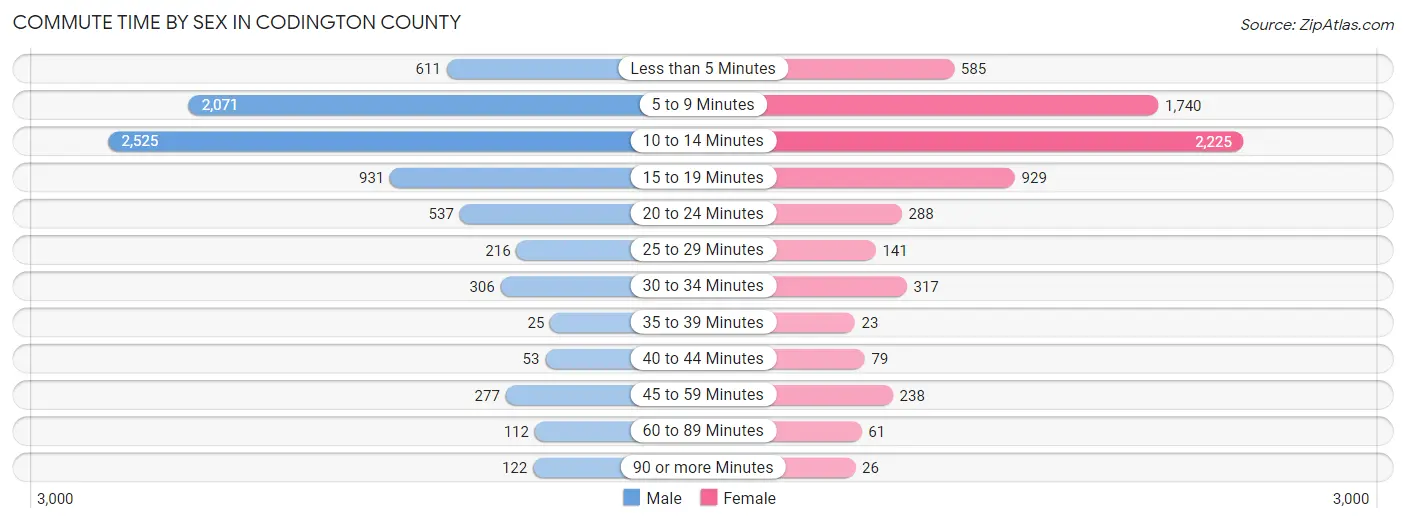
| Commute Time | Male | Female |
| Less than 5 Minutes | 611 (7.9%) | 585 (8.8%) |
| 5 to 9 Minutes | 2,071 (26.6%) | 1,740 (26.2%) |
| 10 to 14 Minutes | 2,525 (32.4%) | 2,225 (33.5%) |
| 15 to 19 Minutes | 931 (12.0%) | 929 (14.0%) |
| 20 to 24 Minutes | 537 (6.9%) | 288 (4.3%) |
| 25 to 29 Minutes | 216 (2.8%) | 141 (2.1%) |
| 30 to 34 Minutes | 306 (3.9%) | 317 (4.8%) |
| 35 to 39 Minutes | 25 (0.3%) | 23 (0.4%) |
| 40 to 44 Minutes | 53 (0.7%) | 79 (1.2%) |
| 45 to 59 Minutes | 277 (3.6%) | 238 (3.6%) |
| 60 to 89 Minutes | 112 (1.4%) | 61 (0.9%) |
| 90 or more Minutes | 122 (1.6%) | 26 (0.4%) |
Time of Departure to Work by Sex in Codington County
The most frequent times of departure to work in Codington County are 7:30 AM to 7:59 AM (1,477, 19.0%) for males and 7:30 AM to 7:59 AM (1,673, 25.2%) for females.
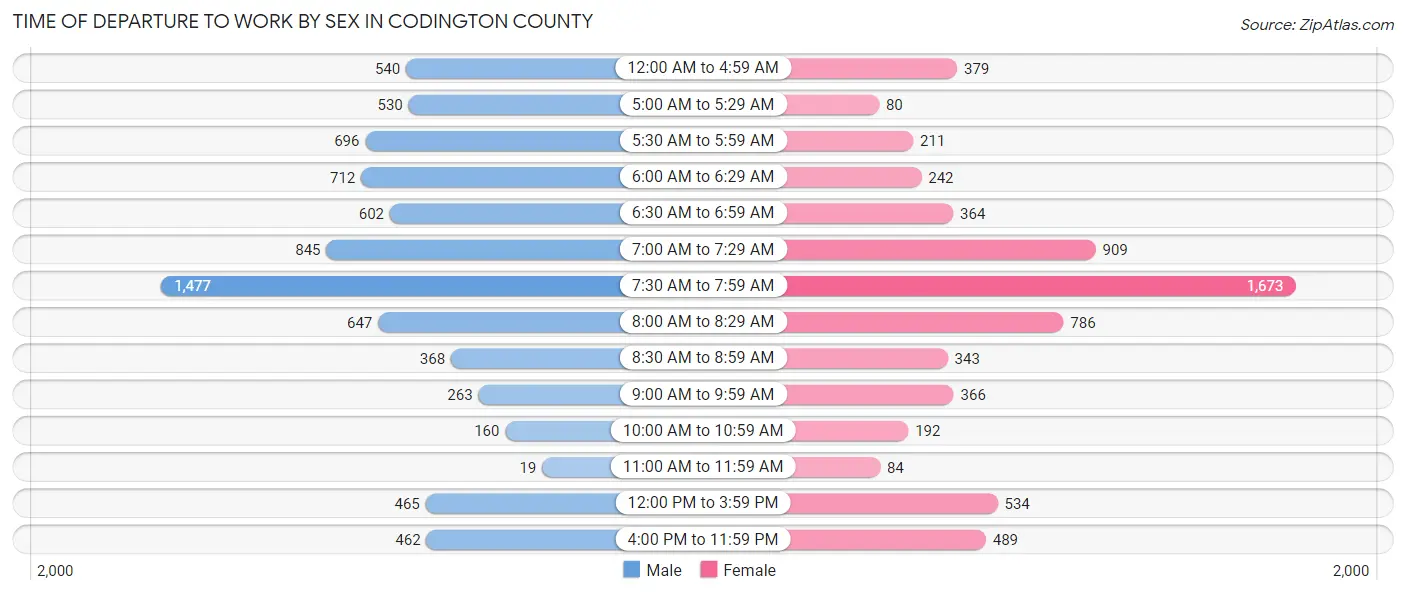
| Time of Departure | Male | Female |
| 12:00 AM to 4:59 AM | 540 (6.9%) | 379 (5.7%) |
| 5:00 AM to 5:29 AM | 530 (6.8%) | 80 (1.2%) |
| 5:30 AM to 5:59 AM | 696 (8.9%) | 211 (3.2%) |
| 6:00 AM to 6:29 AM | 712 (9.1%) | 242 (3.6%) |
| 6:30 AM to 6:59 AM | 602 (7.7%) | 364 (5.5%) |
| 7:00 AM to 7:29 AM | 845 (10.8%) | 909 (13.7%) |
| 7:30 AM to 7:59 AM | 1,477 (19.0%) | 1,673 (25.2%) |
| 8:00 AM to 8:29 AM | 647 (8.3%) | 786 (11.8%) |
| 8:30 AM to 8:59 AM | 368 (4.7%) | 343 (5.2%) |
| 9:00 AM to 9:59 AM | 263 (3.4%) | 366 (5.5%) |
| 10:00 AM to 10:59 AM | 160 (2.1%) | 192 (2.9%) |
| 11:00 AM to 11:59 AM | 19 (0.2%) | 84 (1.3%) |
| 12:00 PM to 3:59 PM | 465 (6.0%) | 534 (8.0%) |
| 4:00 PM to 11:59 PM | 462 (5.9%) | 489 (7.3%) |
| Total | 7,786 (100.0%) | 6,652 (100.0%) |
Housing Occupancy in Codington County
Occupancy by Ownership in Codington County
Of the total 12,165 dwellings in Codington County, owner-occupied units account for 8,168 (67.1%), while renter-occupied units make up 3,997 (32.9%).
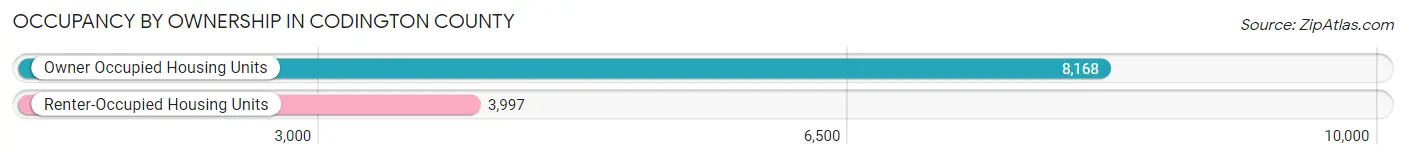
| Occupancy | # Housing Units | % Housing Units |
| Owner Occupied Housing Units | 8,168 | 67.1% |
| Renter-Occupied Housing Units | 3,997 | 32.9% |
| Total Occupied Housing Units | 12,165 | 100.0% |
Occupancy by Household Size in Codington County
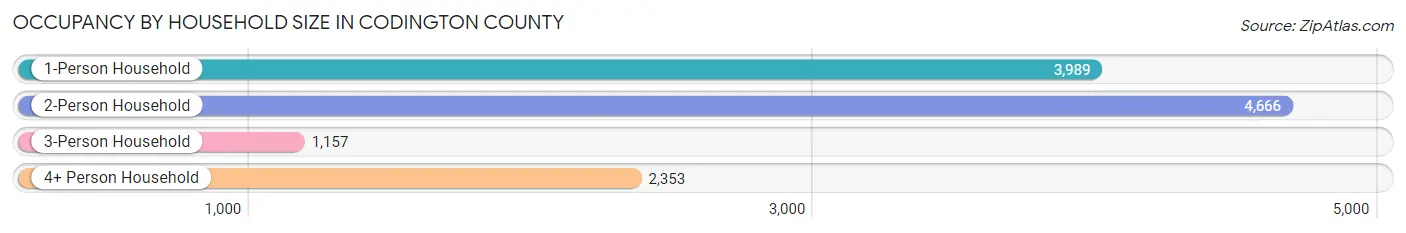
| Household Size | # Housing Units | % Housing Units |
| 1-Person Household | 3,989 | 32.8% |
| 2-Person Household | 4,666 | 38.4% |
| 3-Person Household | 1,157 | 9.5% |
| 4+ Person Household | 2,353 | 19.3% |
| Total Housing Units | 12,165 | 100.0% |
Occupancy by Ownership by Household Size in Codington County
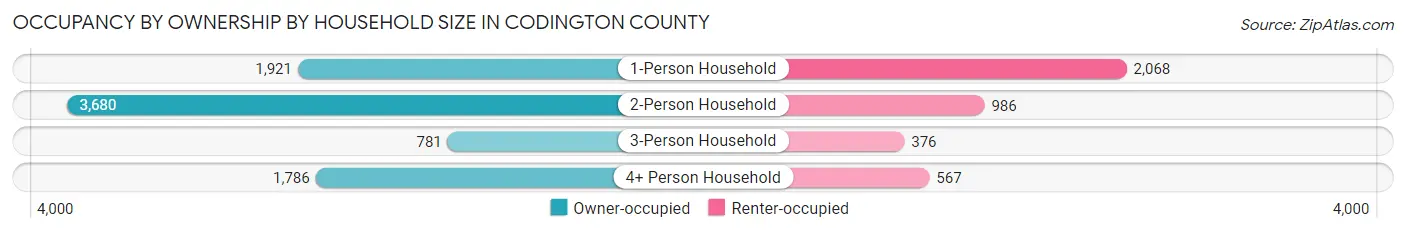
| Household Size | Owner-occupied | Renter-occupied |
| 1-Person Household | 1,921 (48.2%) | 2,068 (51.8%) |
| 2-Person Household | 3,680 (78.9%) | 986 (21.1%) |
| 3-Person Household | 781 (67.5%) | 376 (32.5%) |
| 4+ Person Household | 1,786 (75.9%) | 567 (24.1%) |
| Total Housing Units | 8,168 (67.1%) | 3,997 (32.9%) |
Occupancy by Educational Attainment in Codington County
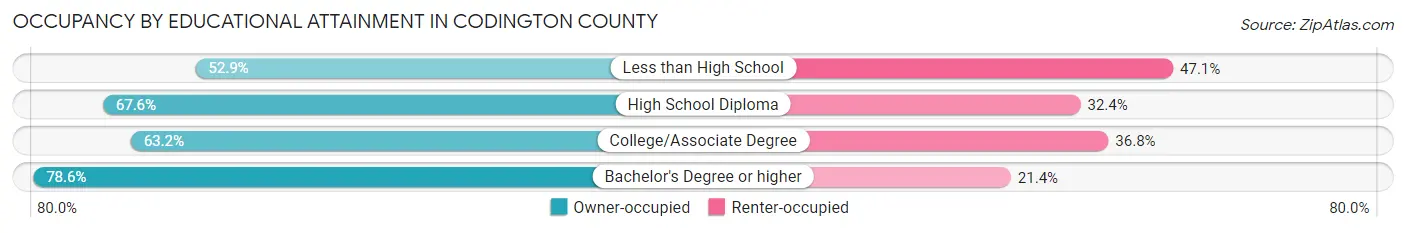
| Household Size | Owner-occupied | Renter-occupied |
| Less than High School | 484 (52.9%) | 431 (47.1%) |
| High School Diploma | 3,098 (67.6%) | 1,486 (32.4%) |
| College/Associate Degree | 2,676 (63.2%) | 1,561 (36.8%) |
| Bachelor's Degree or higher | 1,910 (78.6%) | 519 (21.4%) |
Occupancy by Age of Householder in Codington County
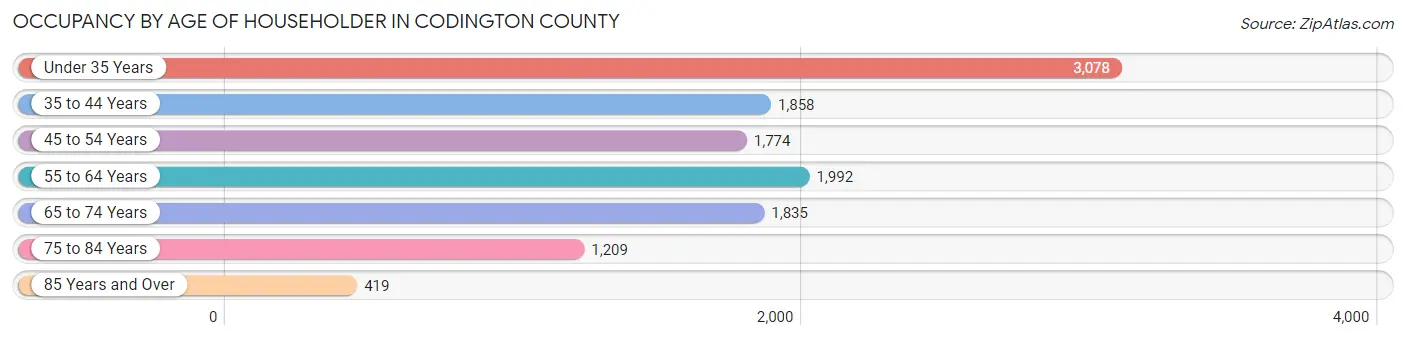
| Age Bracket | # Households | % Households |
| Under 35 Years | 3,078 | 25.3% |
| 35 to 44 Years | 1,858 | 15.3% |
| 45 to 54 Years | 1,774 | 14.6% |
| 55 to 64 Years | 1,992 | 16.4% |
| 65 to 74 Years | 1,835 | 15.1% |
| 75 to 84 Years | 1,209 | 9.9% |
| 85 Years and Over | 419 | 3.4% |
| Total | 12,165 | 100.0% |
Housing Finances in Codington County
Median Income by Occupancy in Codington County
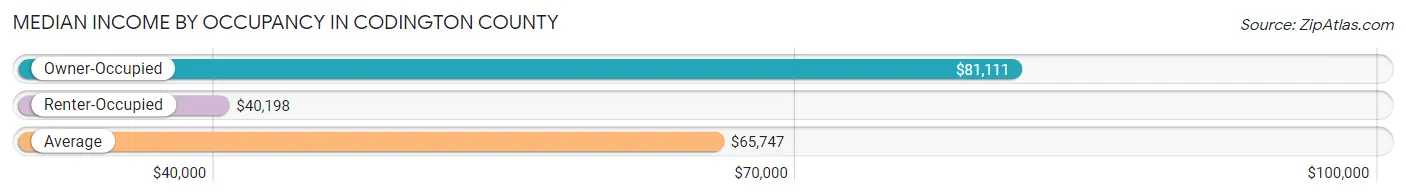
| Occupancy Type | # Households | Median Income |
| Owner-Occupied | 8,168 (67.1%) | $81,111 |
| Renter-Occupied | 3,997 (32.9%) | $40,198 |
| Average | 12,165 (100.0%) | $65,747 |
Occupancy by Householder Income Bracket in Codington County
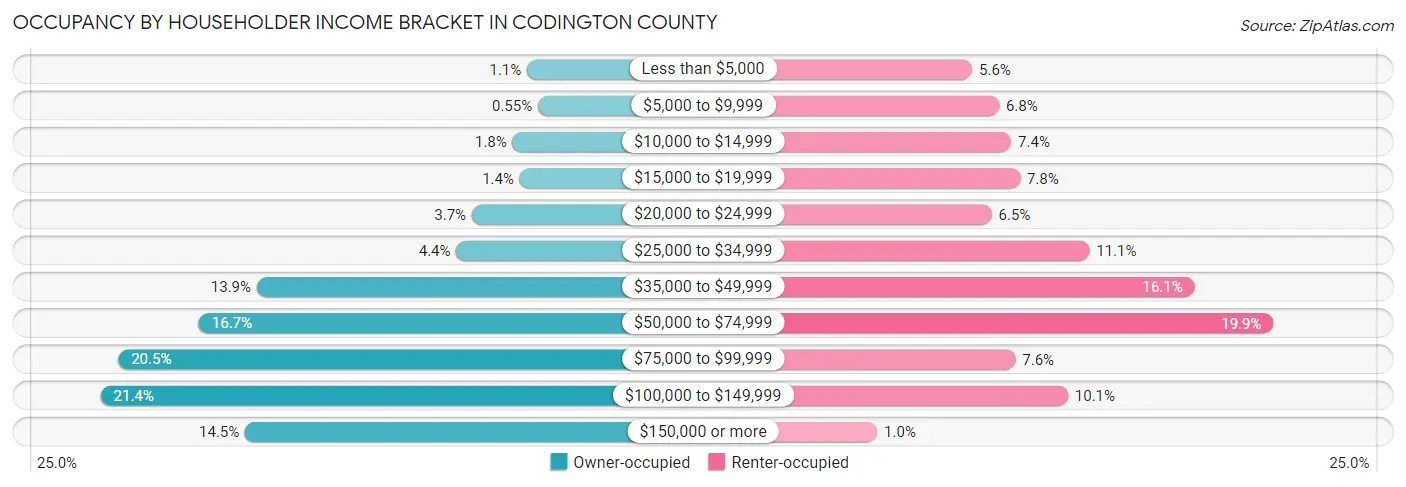
| Income Bracket | Owner-occupied | Renter-occupied |
| Less than $5,000 | 87 (1.1%) | 222 (5.6%) |
| $5,000 to $9,999 | 45 (0.5%) | 273 (6.8%) |
| $10,000 to $14,999 | 144 (1.8%) | 296 (7.4%) |
| $15,000 to $19,999 | 116 (1.4%) | 313 (7.8%) |
| $20,000 to $24,999 | 302 (3.7%) | 259 (6.5%) |
| $25,000 to $34,999 | 363 (4.4%) | 445 (11.1%) |
| $35,000 to $49,999 | 1,139 (13.9%) | 645 (16.1%) |
| $50,000 to $74,999 | 1,364 (16.7%) | 795 (19.9%) |
| $75,000 to $99,999 | 1,678 (20.5%) | 304 (7.6%) |
| $100,000 to $149,999 | 1,746 (21.4%) | 404 (10.1%) |
| $150,000 or more | 1,184 (14.5%) | 41 (1.0%) |
| Total | 8,168 (100.0%) | 3,997 (100.0%) |
Monthly Housing Cost Tiers in Codington County
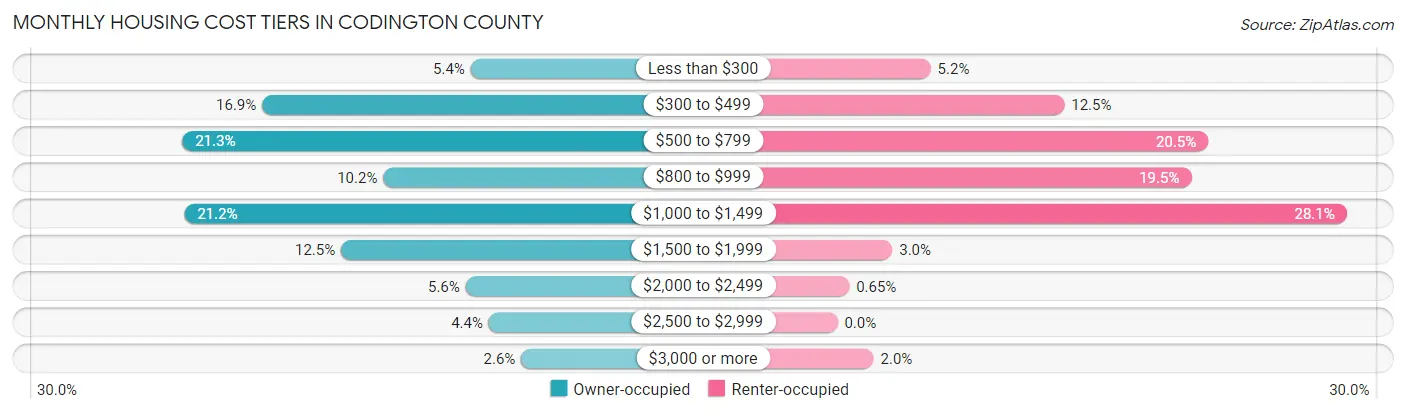
| Monthly Cost | Owner-occupied | Renter-occupied |
| Less than $300 | 438 (5.4%) | 206 (5.1%) |
| $300 to $499 | 1,379 (16.9%) | 501 (12.5%) |
| $500 to $799 | 1,739 (21.3%) | 818 (20.5%) |
| $800 to $999 | 832 (10.2%) | 781 (19.5%) |
| $1,000 to $1,499 | 1,730 (21.2%) | 1,124 (28.1%) |
| $1,500 to $1,999 | 1,023 (12.5%) | 121 (3.0%) |
| $2,000 to $2,499 | 461 (5.6%) | 26 (0.6%) |
| $2,500 to $2,999 | 356 (4.4%) | 0 (0.0%) |
| $3,000 or more | 210 (2.6%) | 80 (2.0%) |
| Total | 8,168 (100.0%) | 3,997 (100.0%) |
Physical Housing Characteristics in Codington County
Housing Structures in Codington County
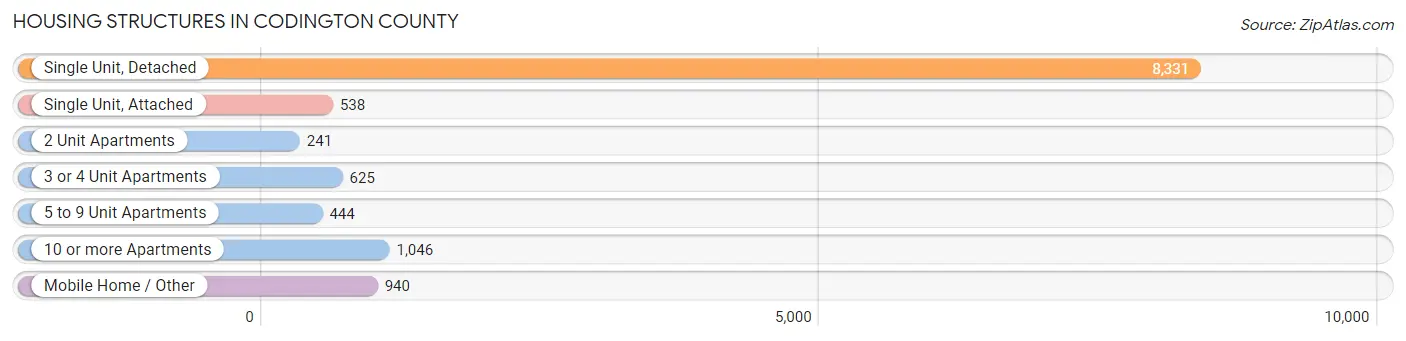
| Structure Type | # Housing Units | % Housing Units |
| Single Unit, Detached | 8,331 | 68.5% |
| Single Unit, Attached | 538 | 4.4% |
| 2 Unit Apartments | 241 | 2.0% |
| 3 or 4 Unit Apartments | 625 | 5.1% |
| 5 to 9 Unit Apartments | 444 | 3.6% |
| 10 or more Apartments | 1,046 | 8.6% |
| Mobile Home / Other | 940 | 7.7% |
| Total | 12,165 | 100.0% |
Housing Structures by Occupancy in Codington County
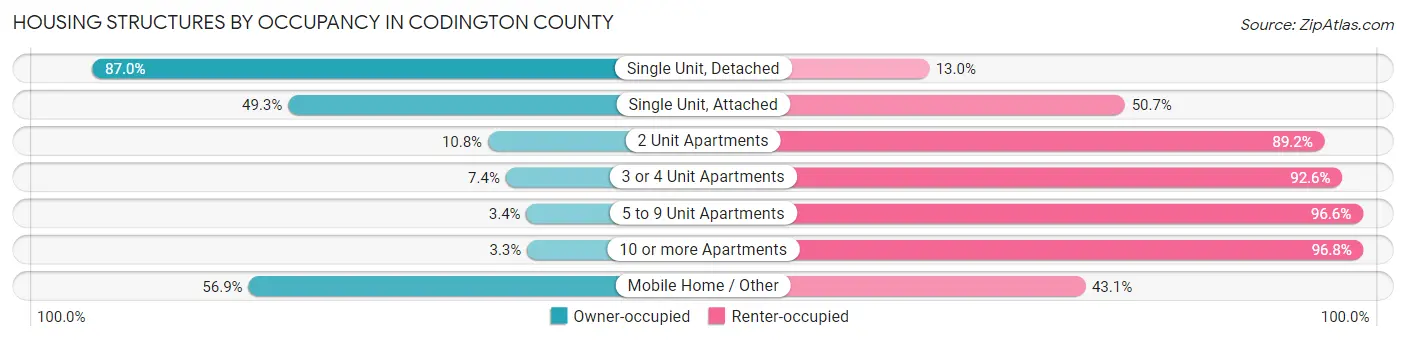
| Structure Type | Owner-occupied | Renter-occupied |
| Single Unit, Detached | 7,247 (87.0%) | 1,084 (13.0%) |
| Single Unit, Attached | 265 (49.3%) | 273 (50.7%) |
| 2 Unit Apartments | 26 (10.8%) | 215 (89.2%) |
| 3 or 4 Unit Apartments | 46 (7.4%) | 579 (92.6%) |
| 5 to 9 Unit Apartments | 15 (3.4%) | 429 (96.6%) |
| 10 or more Apartments | 34 (3.3%) | 1,012 (96.8%) |
| Mobile Home / Other | 535 (56.9%) | 405 (43.1%) |
| Total | 8,168 (67.1%) | 3,997 (32.9%) |
Housing Structures by Number of Rooms in Codington County
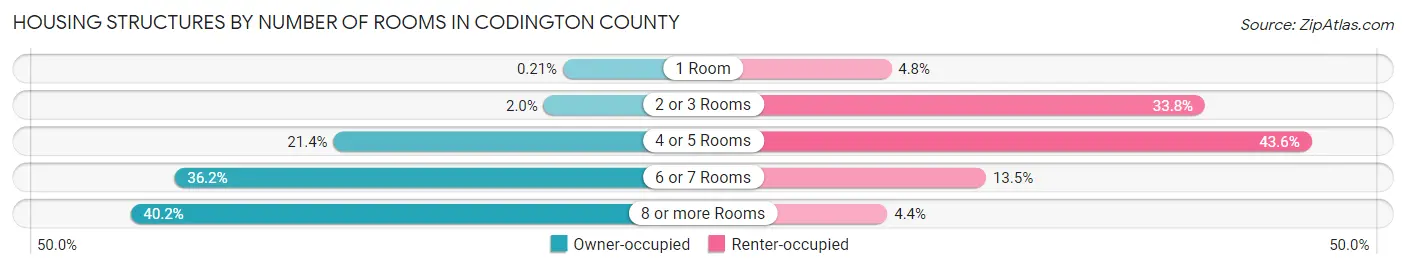
| Number of Rooms | Owner-occupied | Renter-occupied |
| 1 Room | 17 (0.2%) | 190 (4.8%) |
| 2 or 3 Rooms | 163 (2.0%) | 1,349 (33.8%) |
| 4 or 5 Rooms | 1,751 (21.4%) | 1,743 (43.6%) |
| 6 or 7 Rooms | 2,953 (36.1%) | 540 (13.5%) |
| 8 or more Rooms | 3,284 (40.2%) | 175 (4.4%) |
| Total | 8,168 (100.0%) | 3,997 (100.0%) |
Housing Structure by Heating Type in Codington County
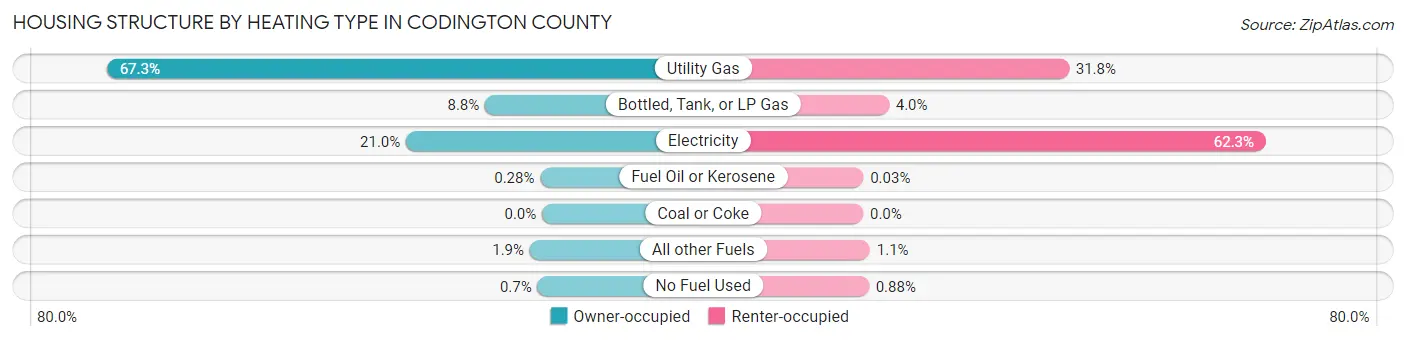
| Heating Type | Owner-occupied | Renter-occupied |
| Utility Gas | 5,497 (67.3%) | 1,271 (31.8%) |
| Bottled, Tank, or LP Gas | 720 (8.8%) | 159 (4.0%) |
| Electricity | 1,717 (21.0%) | 2,489 (62.3%) |
| Fuel Oil or Kerosene | 23 (0.3%) | 1 (0.0%) |
| Coal or Coke | 0 (0.0%) | 0 (0.0%) |
| All other Fuels | 154 (1.9%) | 42 (1.1%) |
| No Fuel Used | 57 (0.7%) | 35 (0.9%) |
| Total | 8,168 (100.0%) | 3,997 (100.0%) |
Household Vehicle Usage in Codington County
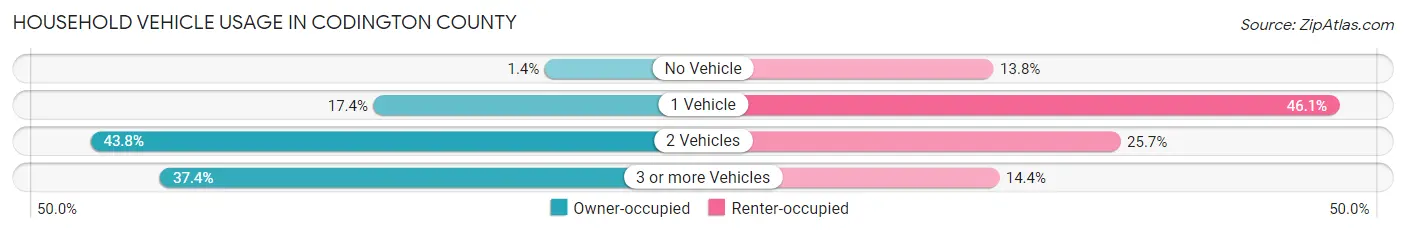
| Vehicles per Household | Owner-occupied | Renter-occupied |
| No Vehicle | 115 (1.4%) | 553 (13.8%) |
| 1 Vehicle | 1,421 (17.4%) | 1,843 (46.1%) |
| 2 Vehicles | 3,581 (43.8%) | 1,027 (25.7%) |
| 3 or more Vehicles | 3,051 (37.3%) | 574 (14.4%) |
| Total | 8,168 (100.0%) | 3,997 (100.0%) |
Real Estate & Mortgages in Codington County
Real Estate and Mortgage Overview in Codington County
| Characteristic | Without Mortgage | With Mortgage |
| Housing Units | 3,612 | 4,556 |
| Median Property Value | $192,600 | $221,000 |
| Median Household Income | $58,870 | $823 |
| Monthly Housing Costs | $502 | $210 |
| Real Estate Taxes | $2,262 | $170 |
Property Value by Mortgage Status in Codington County
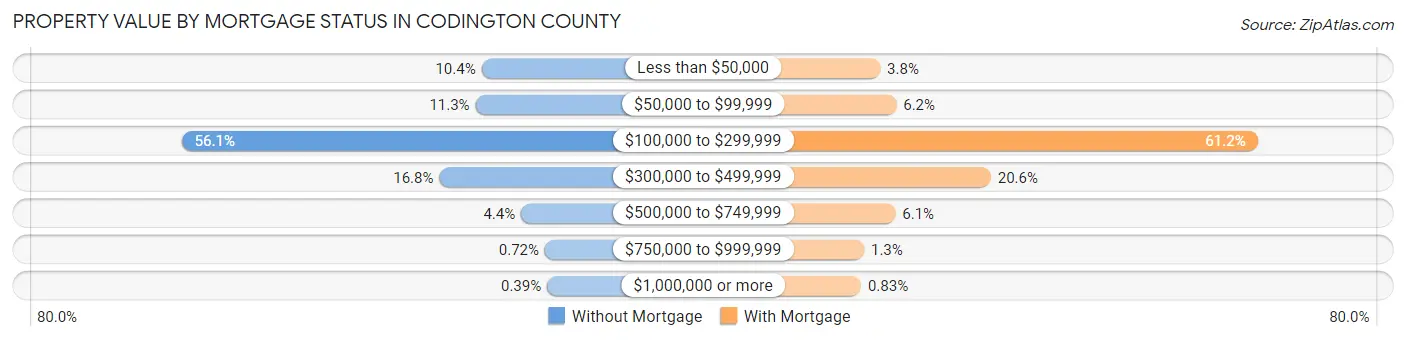
| Property Value | Without Mortgage | With Mortgage |
| Less than $50,000 | 375 (10.4%) | 171 (3.7%) |
| $50,000 to $99,999 | 408 (11.3%) | 283 (6.2%) |
| $100,000 to $299,999 | 2,025 (56.1%) | 2,790 (61.2%) |
| $300,000 to $499,999 | 607 (16.8%) | 939 (20.6%) |
| $500,000 to $749,999 | 157 (4.3%) | 276 (6.1%) |
| $750,000 to $999,999 | 26 (0.7%) | 59 (1.3%) |
| $1,000,000 or more | 14 (0.4%) | 38 (0.8%) |
| Total | 3,612 (100.0%) | 4,556 (100.0%) |
Household Income by Mortgage Status in Codington County
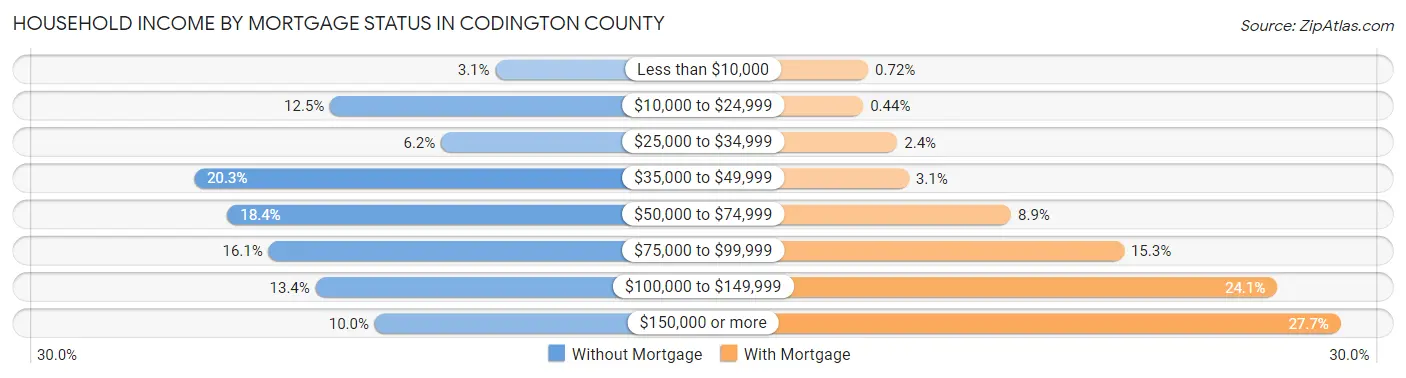
| Household Income | Without Mortgage | With Mortgage |
| Less than $10,000 | 112 (3.1%) | 33 (0.7%) |
| $10,000 to $24,999 | 453 (12.5%) | 20 (0.4%) |
| $25,000 to $34,999 | 224 (6.2%) | 109 (2.4%) |
| $35,000 to $49,999 | 734 (20.3%) | 139 (3.0%) |
| $50,000 to $74,999 | 665 (18.4%) | 405 (8.9%) |
| $75,000 to $99,999 | 580 (16.1%) | 699 (15.3%) |
| $100,000 to $149,999 | 483 (13.4%) | 1,098 (24.1%) |
| $150,000 or more | 361 (10.0%) | 1,263 (27.7%) |
| Total | 3,612 (100.0%) | 4,556 (100.0%) |
Property Value to Household Income Ratio in Codington County
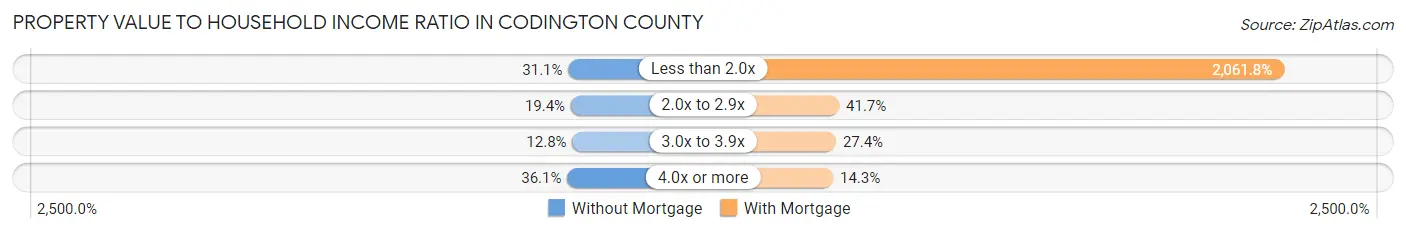
| Value-to-Income Ratio | Without Mortgage | With Mortgage |
| Less than 2.0x | 1,122 (31.1%) | 93,937 (2,061.8%) |
| 2.0x to 2.9x | 702 (19.4%) | 1,899 (41.7%) |
| 3.0x to 3.9x | 463 (12.8%) | 1,248 (27.4%) |
| 4.0x or more | 1,305 (36.1%) | 653 (14.3%) |
| Total | 3,612 (100.0%) | 4,556 (100.0%) |
Real Estate Taxes by Mortgage Status in Codington County
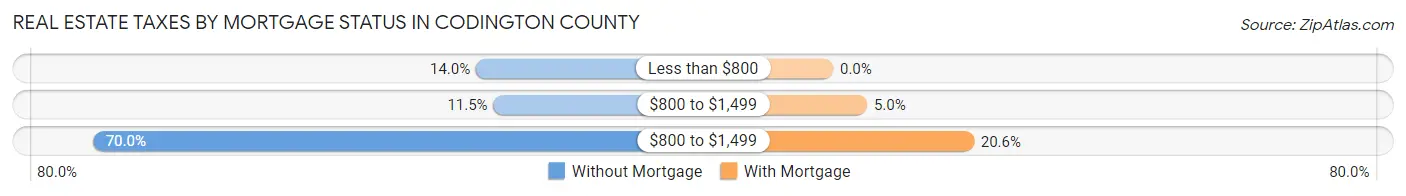
| Property Taxes | Without Mortgage | With Mortgage |
| Less than $800 | 507 (14.0%) | 0 (0.0%) |
| $800 to $1,499 | 415 (11.5%) | 226 (5.0%) |
| $800 to $1,499 | 2,530 (70.0%) | 937 (20.6%) |
| Total | 3,612 (100.0%) | 4,556 (100.0%) |
Health & Disability in Codington County
Health Insurance Coverage by Age in Codington County
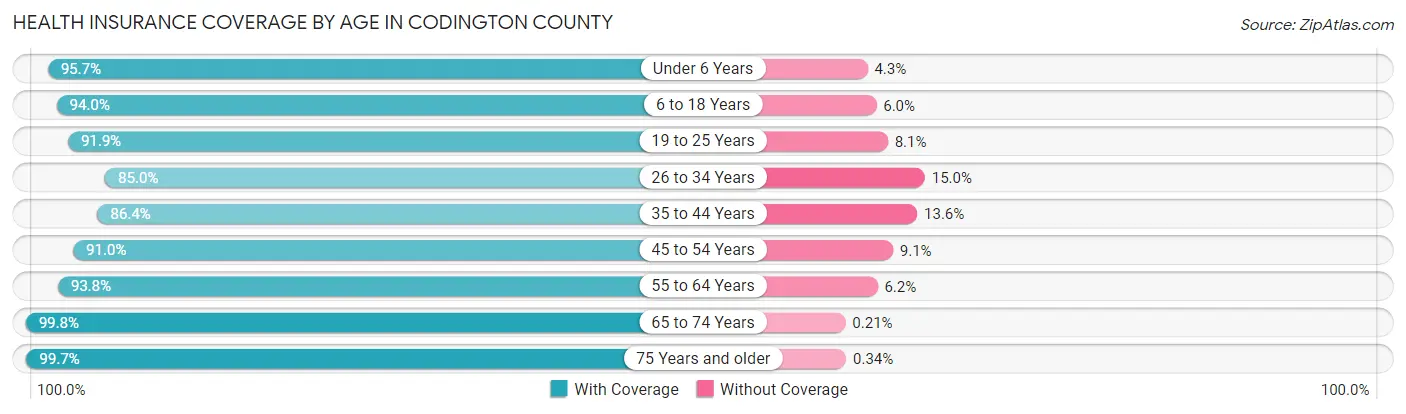
| Age Bracket | With Coverage | Without Coverage |
| Under 6 Years | 1,840 (95.7%) | 83 (4.3%) |
| 6 to 18 Years | 4,824 (94.0%) | 306 (6.0%) |
| 19 to 25 Years | 2,261 (91.9%) | 199 (8.1%) |
| 26 to 34 Years | 2,518 (85.0%) | 445 (15.0%) |
| 35 to 44 Years | 3,028 (86.4%) | 476 (13.6%) |
| 45 to 54 Years | 2,923 (90.9%) | 291 (9.0%) |
| 55 to 64 Years | 3,609 (93.8%) | 238 (6.2%) |
| 65 to 74 Years | 2,882 (99.8%) | 6 (0.2%) |
| 75 Years and older | 2,071 (99.7%) | 7 (0.3%) |
| Total | 25,956 (92.7%) | 2,051 (7.3%) |
Health Insurance Coverage by Citizenship Status in Codington County
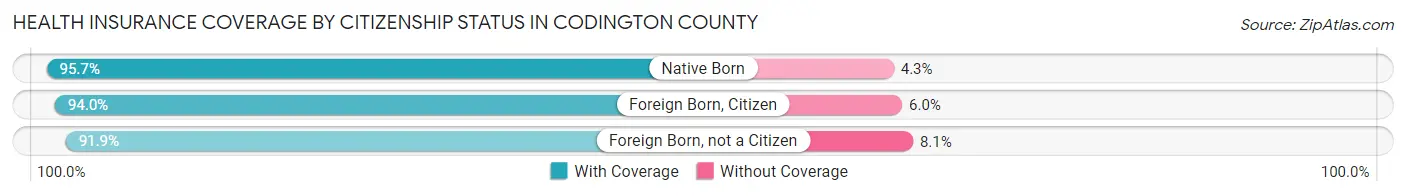
| Citizenship Status | With Coverage | Without Coverage |
| Native Born | 1,840 (95.7%) | 83 (4.3%) |
| Foreign Born, Citizen | 4,824 (94.0%) | 306 (6.0%) |
| Foreign Born, not a Citizen | 2,261 (91.9%) | 199 (8.1%) |
Health Insurance Coverage by Household Income in Codington County
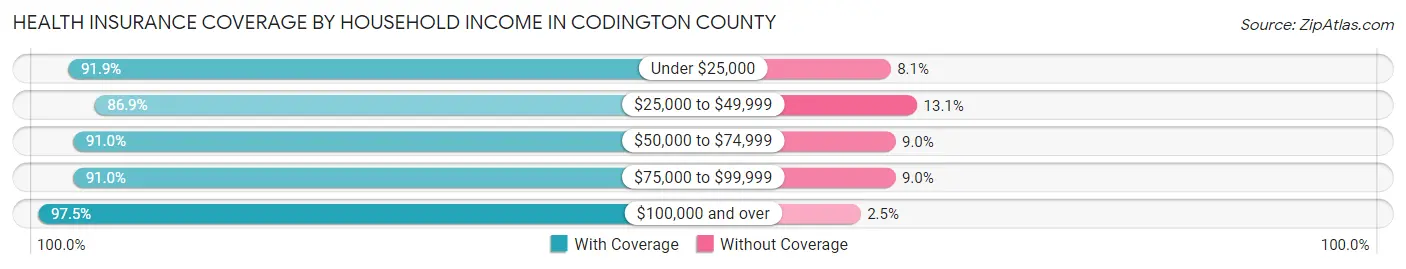
| Household Income | With Coverage | Without Coverage |
| Under $25,000 | 2,781 (91.9%) | 246 (8.1%) |
| $25,000 to $49,999 | 3,995 (86.9%) | 601 (13.1%) |
| $50,000 to $74,999 | 4,316 (91.0%) | 429 (9.0%) |
| $75,000 to $99,999 | 4,819 (91.0%) | 478 (9.0%) |
| $100,000 and over | 9,846 (97.5%) | 254 (2.5%) |
Public vs Private Health Insurance Coverage by Age in Codington County
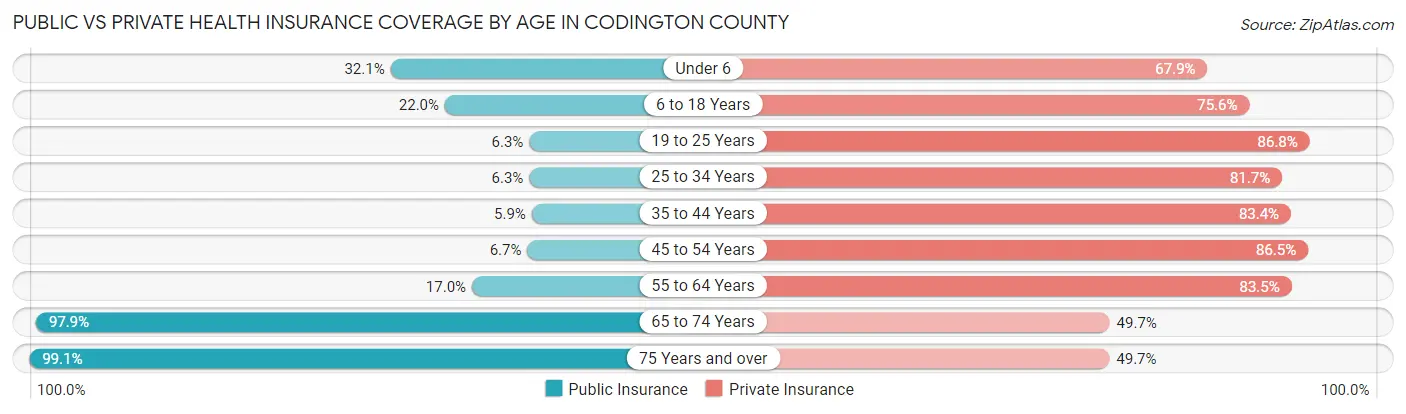
| Age Bracket | Public Insurance | Private Insurance |
| Under 6 | 617 (32.1%) | 1,305 (67.9%) |
| 6 to 18 Years | 1,128 (22.0%) | 3,880 (75.6%) |
| 19 to 25 Years | 156 (6.3%) | 2,136 (86.8%) |
| 25 to 34 Years | 188 (6.3%) | 2,421 (81.7%) |
| 35 to 44 Years | 206 (5.9%) | 2,921 (83.4%) |
| 45 to 54 Years | 215 (6.7%) | 2,781 (86.5%) |
| 55 to 64 Years | 653 (17.0%) | 3,211 (83.5%) |
| 65 to 74 Years | 2,828 (97.9%) | 1,436 (49.7%) |
| 75 Years and over | 2,060 (99.1%) | 1,032 (49.7%) |
| Total | 8,051 (28.7%) | 21,123 (75.4%) |
Disability Status by Sex by Age in Codington County
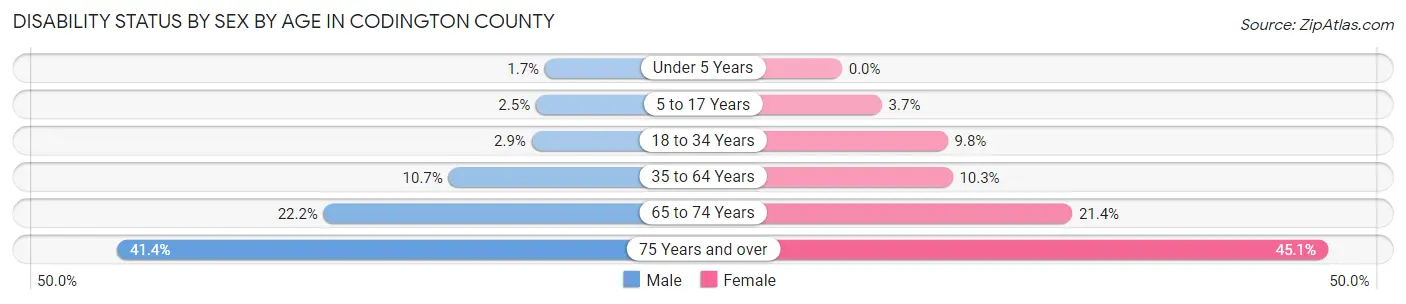
| Age Bracket | Male | Female |
| Under 5 Years | 13 (1.7%) | 0 (0.0%) |
| 5 to 17 Years | 65 (2.5%) | 95 (3.7%) |
| 18 to 34 Years | 91 (2.9%) | 267 (9.8%) |
| 35 to 64 Years | 580 (10.6%) | 526 (10.3%) |
| 65 to 74 Years | 331 (22.2%) | 299 (21.4%) |
| 75 Years and over | 362 (41.4%) | 543 (45.1%) |
Disability Class by Sex by Age in Codington County
Disability Class: Hearing Difficulty
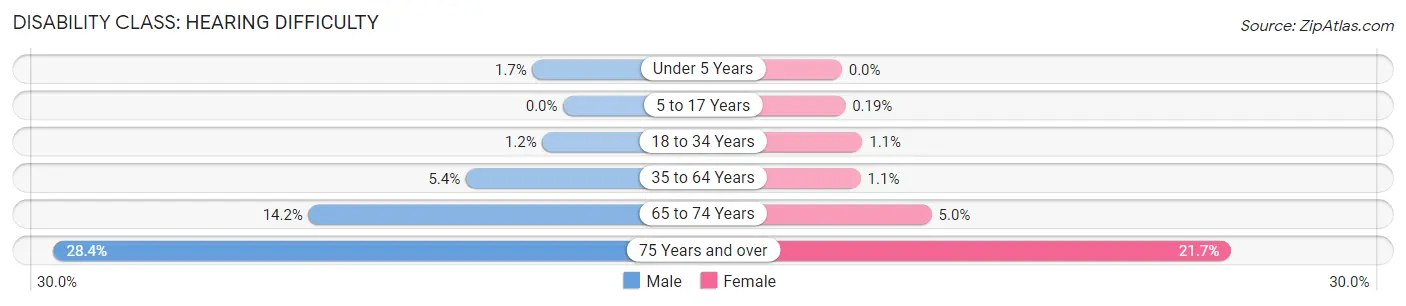
| Age Bracket | Male | Female |
| Under 5 Years | 13 (1.7%) | 0 (0.0%) |
| 5 to 17 Years | 0 (0.0%) | 5 (0.2%) |
| 18 to 34 Years | 36 (1.2%) | 31 (1.1%) |
| 35 to 64 Years | 295 (5.4%) | 54 (1.1%) |
| 65 to 74 Years | 211 (14.2%) | 70 (5.0%) |
| 75 Years and over | 248 (28.4%) | 261 (21.7%) |
Disability Class: Vision Difficulty
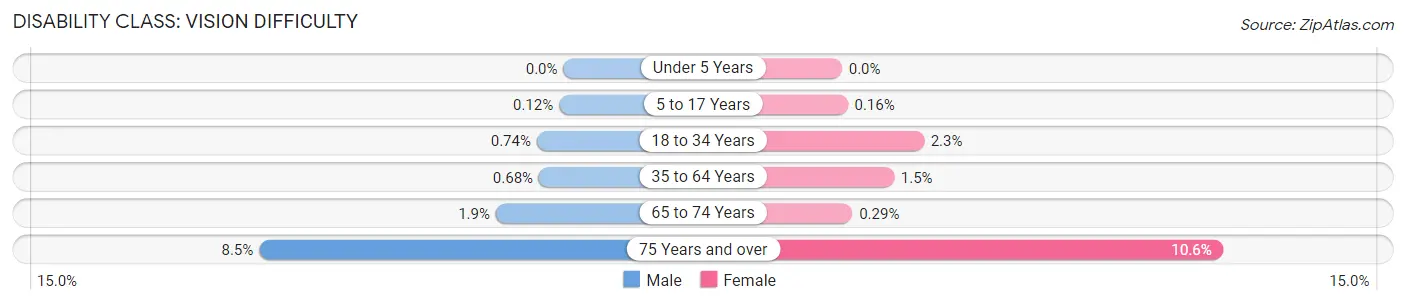
| Age Bracket | Male | Female |
| Under 5 Years | 0 (0.0%) | 0 (0.0%) |
| 5 to 17 Years | 3 (0.1%) | 4 (0.2%) |
| 18 to 34 Years | 23 (0.7%) | 62 (2.3%) |
| 35 to 64 Years | 37 (0.7%) | 74 (1.5%) |
| 65 to 74 Years | 28 (1.9%) | 4 (0.3%) |
| 75 Years and over | 74 (8.5%) | 128 (10.6%) |
Disability Class: Cognitive Difficulty
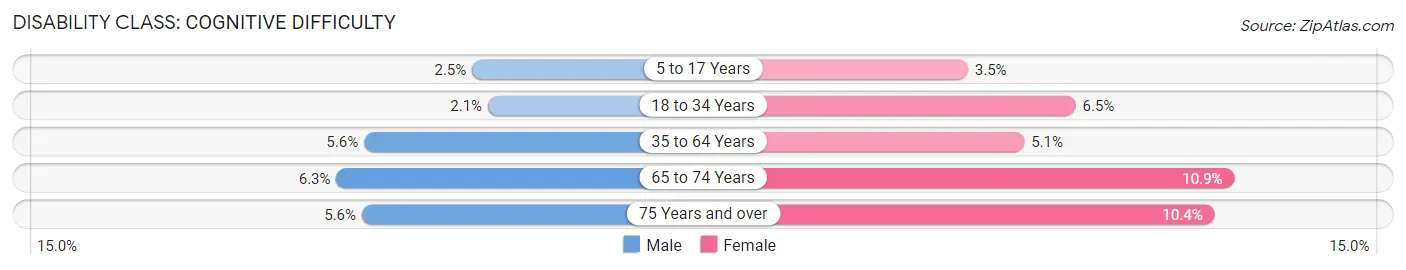
| Age Bracket | Male | Female |
| 5 to 17 Years | 65 (2.5%) | 90 (3.5%) |
| 18 to 34 Years | 65 (2.1%) | 177 (6.5%) |
| 35 to 64 Years | 302 (5.6%) | 260 (5.1%) |
| 65 to 74 Years | 94 (6.3%) | 153 (10.9%) |
| 75 Years and over | 49 (5.6%) | 125 (10.4%) |
Disability Class: Ambulatory Difficulty
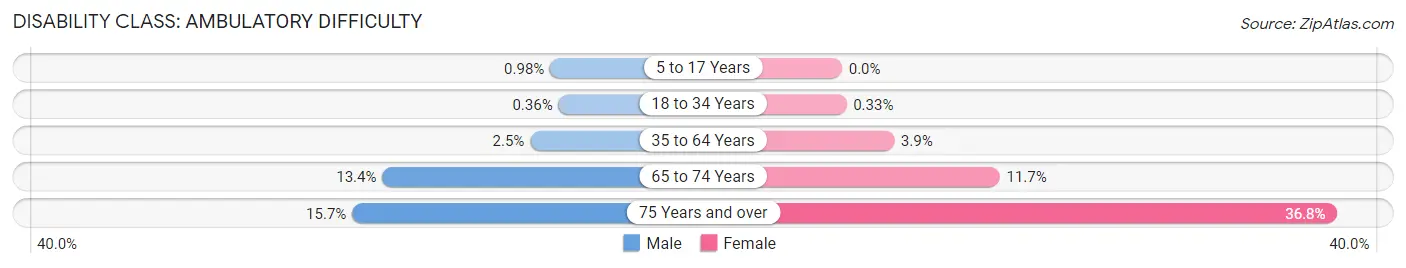
| Age Bracket | Male | Female |
| 5 to 17 Years | 25 (1.0%) | 0 (0.0%) |
| 18 to 34 Years | 11 (0.4%) | 9 (0.3%) |
| 35 to 64 Years | 134 (2.5%) | 198 (3.9%) |
| 65 to 74 Years | 200 (13.4%) | 164 (11.7%) |
| 75 Years and over | 137 (15.7%) | 443 (36.8%) |
Disability Class: Self-Care Difficulty
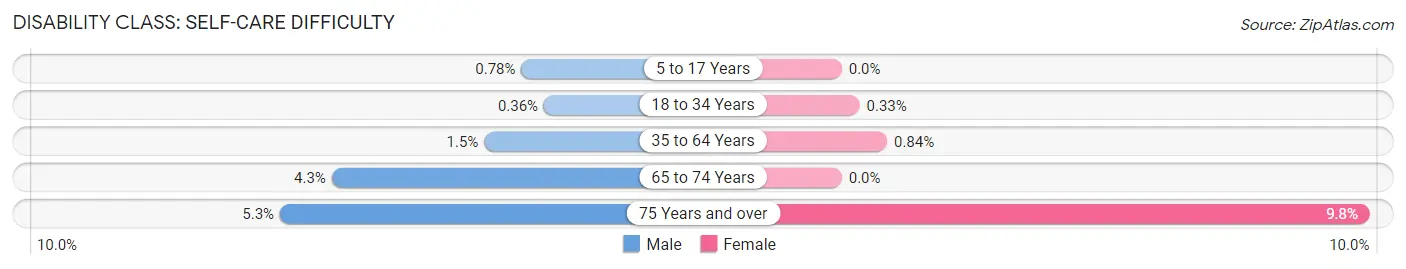
| Age Bracket | Male | Female |
| 5 to 17 Years | 20 (0.8%) | 0 (0.0%) |
| 18 to 34 Years | 11 (0.4%) | 9 (0.3%) |
| 35 to 64 Years | 80 (1.5%) | 43 (0.8%) |
| 65 to 74 Years | 64 (4.3%) | 0 (0.0%) |
| 75 Years and over | 46 (5.3%) | 118 (9.8%) |
Technology Access in Codington County
Computing Device Access in Codington County
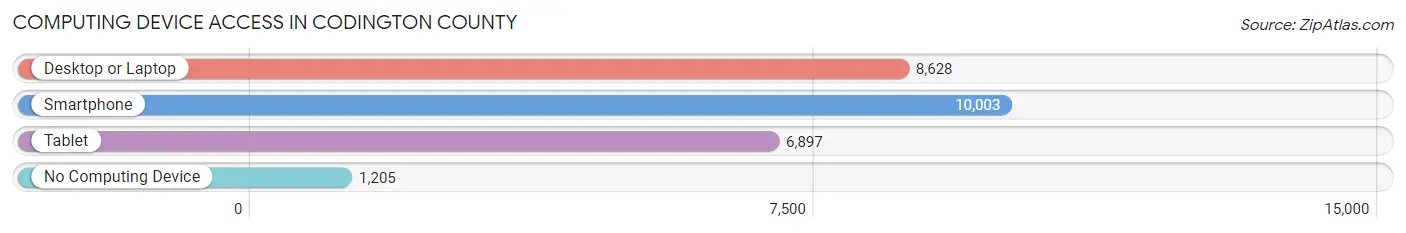
| Device Type | # Households | % Households |
| Desktop or Laptop | 8,628 | 70.9% |
| Smartphone | 10,003 | 82.2% |
| Tablet | 6,897 | 56.7% |
| No Computing Device | 1,205 | 9.9% |
| Total | 12,165 | 100.0% |
Internet Access in Codington County
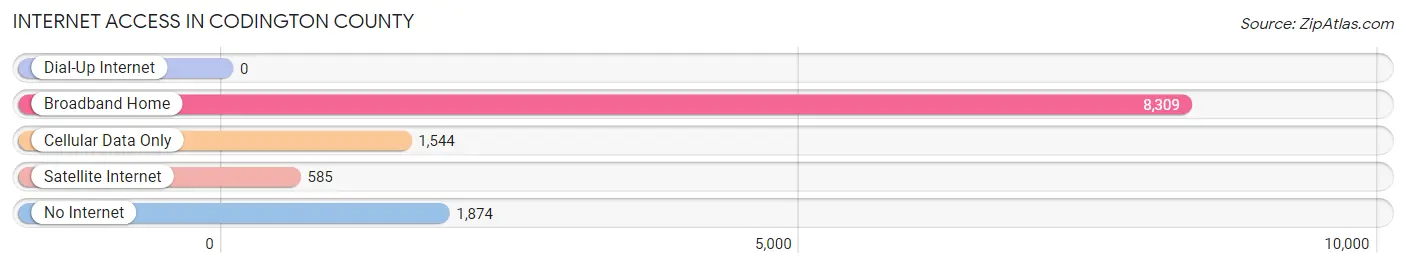
| Internet Type | # Households | % Households |
| Dial-Up Internet | 0 | 0.0% |
| Broadband Home | 8,309 | 68.3% |
| Cellular Data Only | 1,544 | 12.7% |
| Satellite Internet | 585 | 4.8% |
| No Internet | 1,874 | 15.4% |
| Total | 12,165 | 100.0% |
Codington County Summary
Codington County, South Dakota is located in the northeastern part of the state and is part of the Watertown, South Dakota, Micropolitan Statistical Area. The county was established in 1873 and named after William Codington, a former territorial governor of Dakota Territory. As of the 2010 census, the population was 27,227, making it the fourth most populous county in South Dakota.
Geography
Codington County is located in the northeastern part of South Dakota, bordered by Grant County to the north, Deuel County to the east, Hamlin County to the south, and Clark County to the west. The county covers an area of 845 square miles and is mostly flat, with some rolling hills in the western part of the county. The county is drained by the Big Sioux River, which flows through the county from north to south. The county is also home to several lakes, including Lake Kampeska, Lake Pelican, and Lake Poinsett.
Climate
Codington County has a humid continental climate, with cold winters and hot, humid summers. The average annual temperature is 45°F, with an average high of 57°F in July and an average low of 33°F in January. The average annual precipitation is 22 inches, with the most precipitation occurring in June and July.
Demographics
As of the 2010 census, there were 27,227 people, 10,845 households, and 7,541 families living in Codington County. The population density was 32.2 people per square mile. The racial makeup of the county was 94.3% White, 0.7% African American, 0.5% Native American, 0.5% Asian, 0.1% Pacific Islander, 2.7% from other races, and 1.2% from two or more races. Hispanic or Latino of any race were 4.7% of the population.
The median income for a household in the county was $45,945, and the median income for a family was $54,945. The per capita income for the county was $21,945. About 8.2% of families and 11.2% of the population were below the poverty line, including 14.2% of those under age 18 and 8.2% of those age 65 or over.
Economy
Codington County's economy is largely based on agriculture, with corn, soybeans, and wheat being the main crops. The county is also home to several manufacturing companies, including John Deere, 3M, and Tyson Foods. The county is also home to several retail stores, including Walmart, Target, and Kohl's.
The county is served by the Watertown Regional Airport, which offers daily flights to Minneapolis, Chicago, and Denver. The county is also served by several major highways, including Interstate 29, US Highway 212, and US Highway 81.
Conclusion
Codington County, South Dakota is a rural county located in the northeastern part of the state. The county is home to 27,227 people, and the economy is largely based on agriculture and manufacturing. The county is served by the Watertown Regional Airport and several major highways, making it an ideal location for businesses and residents alike.
Common Questions
What is the Total Population of Codington County?
Total Population of Codington County is 28,402.
What is the Total Male Population of Codington County?
Total Male Population of Codington County is 14,365.
What is the Total Female Population of Codington County?
Total Female Population of Codington County is 14,037.
What is the Ratio of Males per 100 Females in Codington County?
There are 102.34 Males per 100 Females in Codington County.
What is the Ratio of Females per 100 Males in Codington County?
There are 97.72 Females per 100 Males in Codington County.
What is the Median Population Age in Codington County?
Median Population Age in Codington County is 39.6 Years.
What is the Average Family Size in Codington County
Average Family Size in Codington County is 2.9 People.
What is the Average Household Size in Codington County
Average Household Size in Codington County is 2.3 People.
What is Per Capita Income in Codington County?
Per Capita income in Codington County is $36,016.
What is the Median Family Income in Codington County?
Median Family Income in Codington County is $88,199.
What is the Median Household income in Codington County?
Median Household Income in Codington County is $65,747.
What is Income or Wage Gap in Codington County?
Income or Wage Gap in Codington County is 35.9%.
Women in Codington County earn 64.1 cents for every dollar earned by a man.
What is Family Income Deficit in Codington County?
Family Income Deficit in Codington County is $11,134.
Families that are below poverty line in Codington County earn $11,134 less on average than the poverty threshold level.
What is Inequality or Gini Index in Codington County?
Inequality or Gini Index in Codington County is 0.43.
How Large is the Labor Force in Codington County?
There are 15,677 People in the Labor Forcein in Codington County.
What is the Percentage of People in the Labor Force in Codington County?
69.1% of People are in the Labor Force in Codington County.
What is the Unemployment Rate in Codington County?
Unemployment Rate in Codington County is 1.5%.