Clay County, SD
Clay County Map
Clay County Overview
14,953
TOTAL POPULATION
7,362
MALE POPULATION
7,591
FEMALE POPULATION
96.98
MALES / 100 FEMALES
103.11
FEMALES / 100 MALES
24.6
MEDIAN AGE
2.9
AVG FAMILY SIZE
2.3
AVG HOUSEHOLD SIZE
$30,033
PER CAPITA INCOME
$89,497
AVG FAMILY INCOME
$55,963
AVG HOUSEHOLD INCOME
40.3%
WAGE / INCOME GAP [ % ]
59.7¢/ $1
WAGE / INCOME GAP [ $ ]
$14,672
FAMILY INCOME DEFICIT
0.48
INEQUALITY / GINI INDEX
8,540
LABOR FORCE [ PEOPLE ]
67.6%
PERCENT IN LABOR FORCE
8.2%
UNEMPLOYMENT RATE
Clay County Area Codes
Race in Clay County
The most populous races in Clay County are White / Caucasian (12,973 | 86.8%), Two or more Races (562 | 3.8%), and Native / Alaskan (496 | 3.3%).
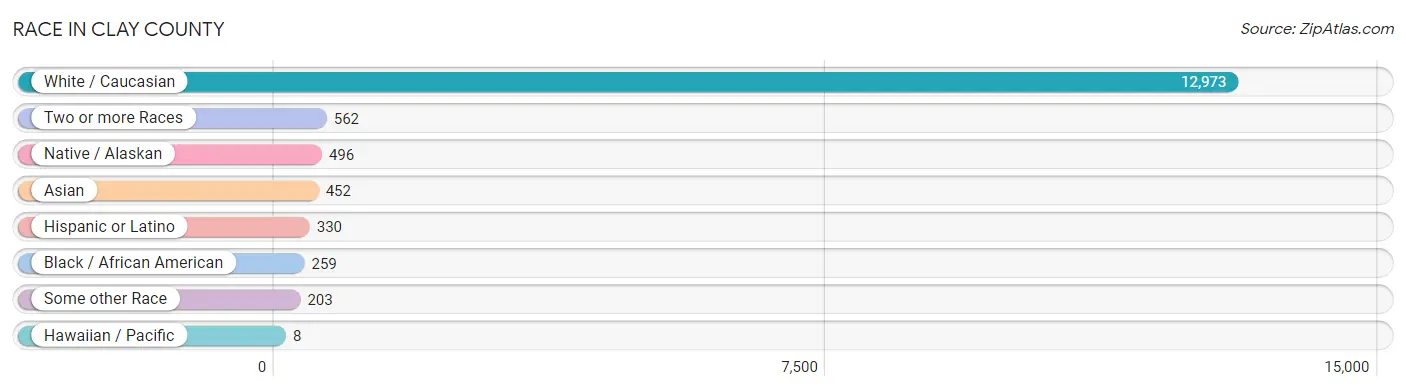
| Race | # Population | % Population |
| Asian | 452 | 3.0% |
| Black / African American | 259 | 1.7% |
| Hawaiian / Pacific | 8 | 0.1% |
| Hispanic or Latino | 330 | 2.2% |
| Native / Alaskan | 496 | 3.3% |
| White / Caucasian | 12,973 | 86.8% |
| Two or more Races | 562 | 3.8% |
| Some other Race | 203 | 1.4% |
| Total | 14,953 | 100.0% |
Ancestry in Clay County
The most populous ancestries reported in Clay County are German (5,251 | 35.1%), Irish (2,077 | 13.9%), Norwegian (1,488 | 10.0%), English (1,036 | 6.9%), and Danish (529 | 3.5%), together accounting for 69.4% of all Clay County residents.
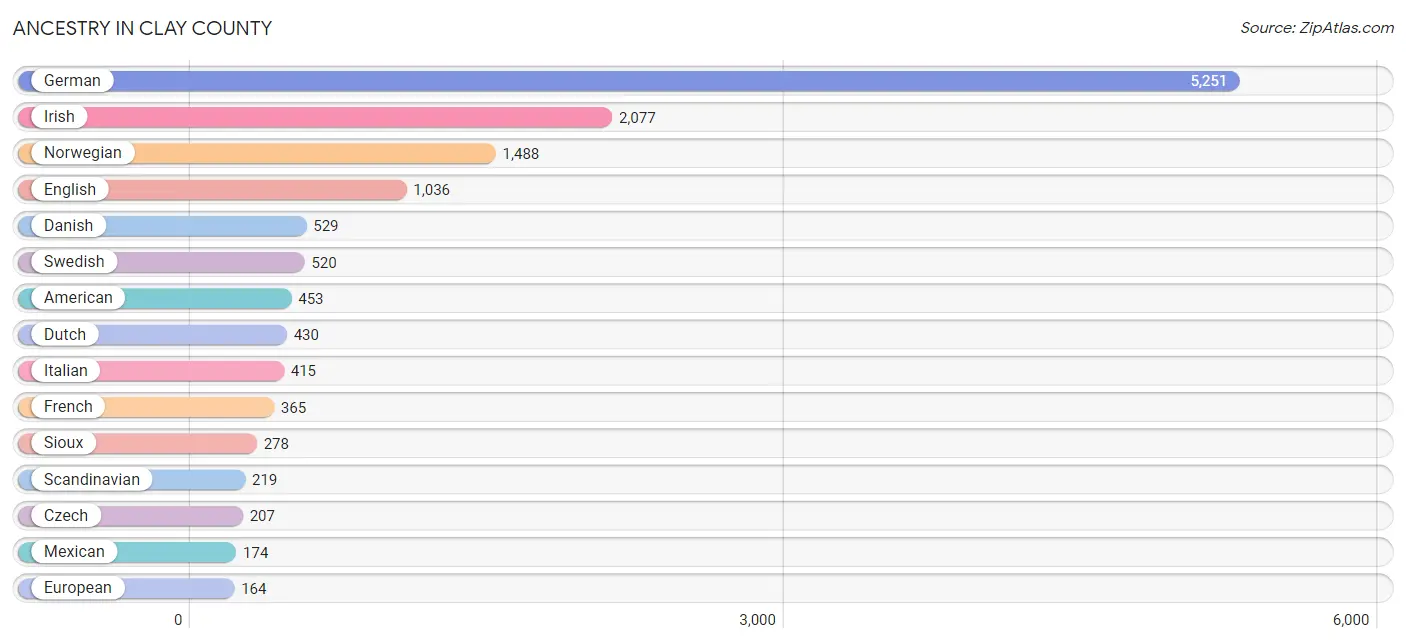
| Ancestry | # Population | % Population |
| African | 15 | 0.1% |
| American | 453 | 3.0% |
| Arab | 83 | 0.6% |
| Austrian | 4 | 0.0% |
| Belgian | 24 | 0.2% |
| Belizean | 4 | 0.0% |
| Brazilian | 2 | 0.0% |
| British | 35 | 0.2% |
| Burmese | 12 | 0.1% |
| Central American | 120 | 0.8% |
| Central American Indian | 19 | 0.1% |
| Cherokee | 75 | 0.5% |
| Chippewa | 17 | 0.1% |
| Choctaw | 17 | 0.1% |
| Cuban | 4 | 0.0% |
| Czech | 207 | 1.4% |
| Danish | 529 | 3.5% |
| Dutch | 430 | 2.9% |
| English | 1,036 | 6.9% |
| Ethiopian | 10 | 0.1% |
| European | 164 | 1.1% |
| Finnish | 60 | 0.4% |
| French | 365 | 2.4% |
| French Canadian | 65 | 0.4% |
| German | 5,251 | 35.1% |
| Greek | 60 | 0.4% |
| Guatemalan | 3 | 0.0% |
| Haitian | 37 | 0.3% |
| Indian (Asian) | 150 | 1.0% |
| Irish | 2,077 | 13.9% |
| Iroquois | 27 | 0.2% |
| Israeli | 12 | 0.1% |
| Italian | 415 | 2.8% |
| Korean | 16 | 0.1% |
| Lebanese | 12 | 0.1% |
| Luxembourger | 38 | 0.3% |
| Malaysian | 5 | 0.0% |
| Mexican | 174 | 1.2% |
| Native Hawaiian | 3 | 0.0% |
| Nicaraguan | 117 | 0.8% |
| Nigerian | 21 | 0.1% |
| Northern European | 20 | 0.1% |
| Norwegian | 1,488 | 10.0% |
| Peruvian | 23 | 0.2% |
| Polish | 84 | 0.6% |
| Portuguese | 34 | 0.2% |
| Puerto Rican | 4 | 0.0% |
| Romanian | 8 | 0.1% |
| Russian | 68 | 0.4% |
| Samoan | 4 | 0.0% |
| Scandinavian | 219 | 1.5% |
| Scotch-Irish | 158 | 1.1% |
| Scottish | 156 | 1.0% |
| Sioux | 278 | 1.9% |
| Slovak | 22 | 0.2% |
| South African | 25 | 0.2% |
| South American | 23 | 0.2% |
| Sri Lankan | 72 | 0.5% |
| Subsaharan African | 82 | 0.5% |
| Sudanese | 11 | 0.1% |
| Swedish | 520 | 3.5% |
| Swiss | 38 | 0.3% |
| Thai | 120 | 0.8% |
| Tongan | 8 | 0.1% |
| Ukrainian | 38 | 0.3% |
| Welsh | 99 | 0.7% |
| Yugoslavian | 149 | 1.0% | View All 67 Rows |
Immigrants in Clay County
The most numerous immigrant groups reported in Clay County came from Asia (320 | 2.1%), Eastern Asia (152 | 1.0%), China (144 | 1.0%), Latin America (110 | 0.7%), and South Eastern Asia (87 | 0.6%), together accounting for 5.4% of all Clay County residents.
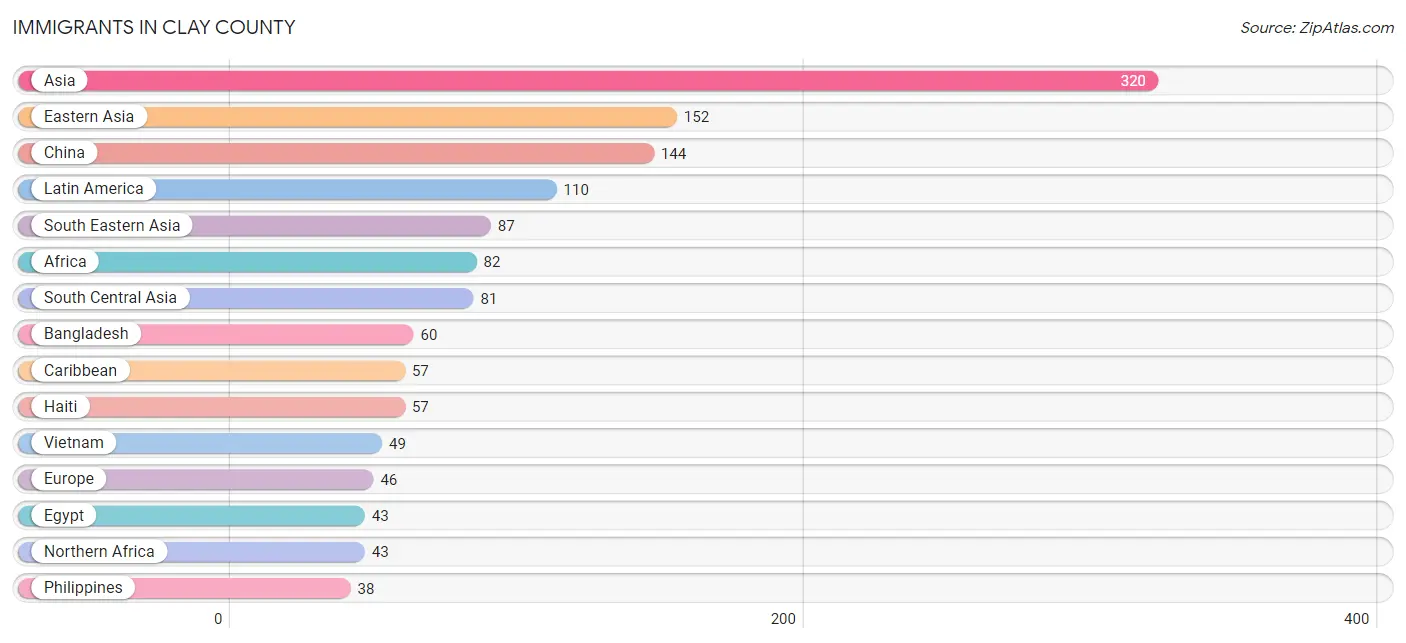
| Immigration Origin | # Population | % Population |
| Africa | 82 | 0.5% |
| Asia | 320 | 2.1% |
| Bangladesh | 60 | 0.4% |
| Belize | 22 | 0.2% |
| Canada | 23 | 0.2% |
| Caribbean | 57 | 0.4% |
| Central America | 30 | 0.2% |
| China | 144 | 1.0% |
| Eastern Africa | 4 | 0.0% |
| Eastern Asia | 152 | 1.0% |
| Eastern Europe | 24 | 0.2% |
| Egypt | 43 | 0.3% |
| England | 3 | 0.0% |
| Ethiopia | 4 | 0.0% |
| Europe | 46 | 0.3% |
| Germany | 15 | 0.1% |
| Haiti | 57 | 0.4% |
| India | 18 | 0.1% |
| Korea | 8 | 0.1% |
| Latin America | 110 | 0.7% |
| Liberia | 1 | 0.0% |
| Mexico | 8 | 0.1% |
| Nepal | 3 | 0.0% |
| Netherlands | 4 | 0.0% |
| Nigeria | 21 | 0.1% |
| Northern Africa | 43 | 0.3% |
| Northern Europe | 3 | 0.0% |
| Peru | 23 | 0.2% |
| Philippines | 38 | 0.3% |
| South Africa | 2 | 0.0% |
| South America | 23 | 0.2% |
| South Central Asia | 81 | 0.5% |
| South Eastern Asia | 87 | 0.6% |
| Vietnam | 49 | 0.3% |
| Western Africa | 33 | 0.2% |
| Western Europe | 19 | 0.1% | View All 36 Rows |
Sex and Age in Clay County
Sex and Age in Clay County
The most populous age groups in Clay County are 20 to 24 Years (1,271 | 17.3%) for men and 20 to 24 Years (1,941 | 25.6%) for women.
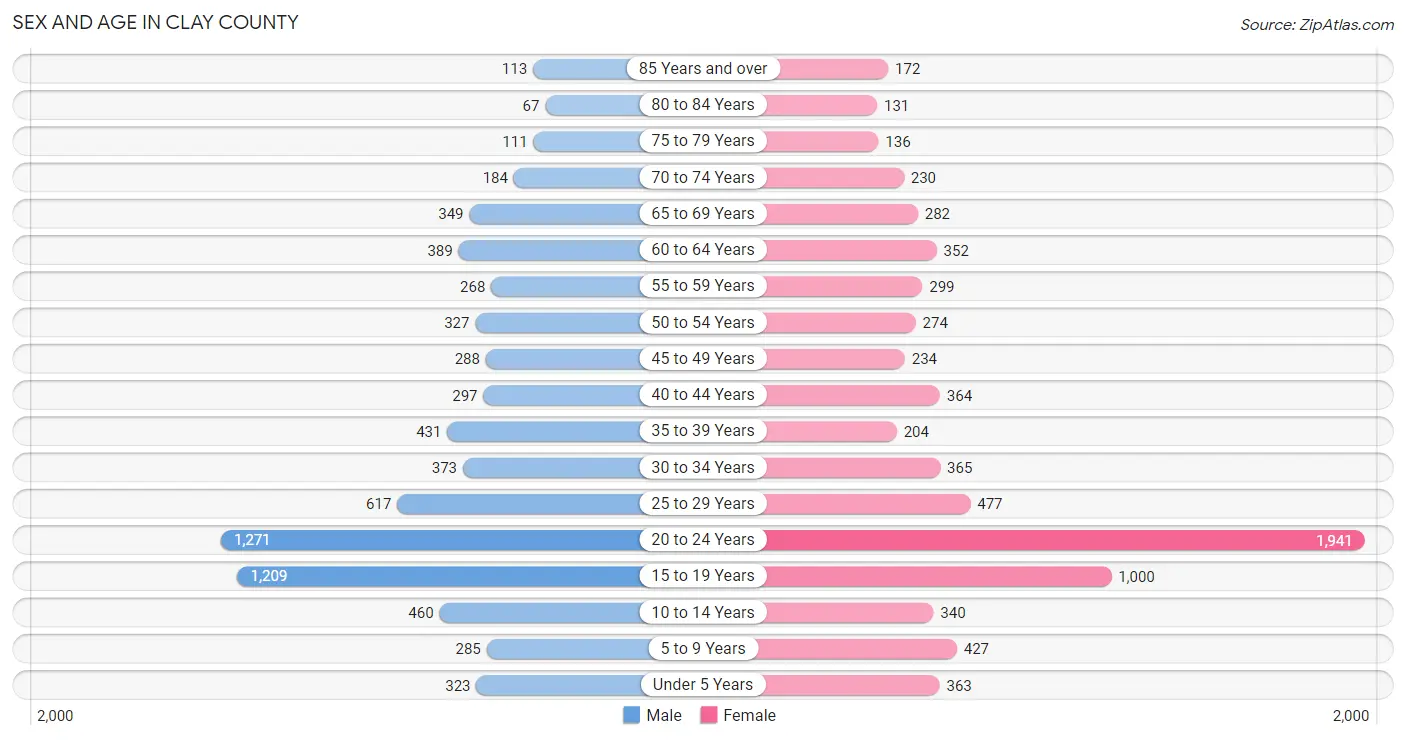
| Age Bracket | Male | Female |
| Under 5 Years | 323 (4.4%) | 363 (4.8%) |
| 5 to 9 Years | 285 (3.9%) | 427 (5.6%) |
| 10 to 14 Years | 460 (6.2%) | 340 (4.5%) |
| 15 to 19 Years | 1,209 (16.4%) | 1,000 (13.2%) |
| 20 to 24 Years | 1,271 (17.3%) | 1,941 (25.6%) |
| 25 to 29 Years | 617 (8.4%) | 477 (6.3%) |
| 30 to 34 Years | 373 (5.1%) | 365 (4.8%) |
| 35 to 39 Years | 431 (5.9%) | 204 (2.7%) |
| 40 to 44 Years | 297 (4.0%) | 364 (4.8%) |
| 45 to 49 Years | 288 (3.9%) | 234 (3.1%) |
| 50 to 54 Years | 327 (4.4%) | 274 (3.6%) |
| 55 to 59 Years | 268 (3.6%) | 299 (3.9%) |
| 60 to 64 Years | 389 (5.3%) | 352 (4.6%) |
| 65 to 69 Years | 349 (4.7%) | 282 (3.7%) |
| 70 to 74 Years | 184 (2.5%) | 230 (3.0%) |
| 75 to 79 Years | 111 (1.5%) | 136 (1.8%) |
| 80 to 84 Years | 67 (0.9%) | 131 (1.7%) |
| 85 Years and over | 113 (1.5%) | 172 (2.3%) |
| Total | 7,362 (100.0%) | 7,591 (100.0%) |
Families and Households in Clay County
Median Family Size in Clay County
The median family size in Clay County is 2.89 persons per family, with married-couple families (2,062 | 75.8%) accounting for the largest median family size of 2.91 persons per family. On the other hand, single female/mother families (425 | 15.6%) represent the smallest median family size with 2.79 persons per family.
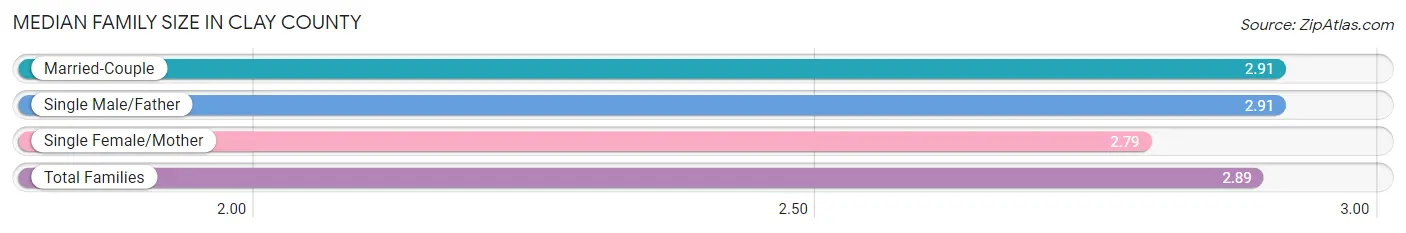
| Family Type | # Families | Family Size |
| Married-Couple | 2,062 (75.8%) | 2.91 |
| Single Male/Father | 234 (8.6%) | 2.91 |
| Single Female/Mother | 425 (15.6%) | 2.79 |
| Total Families | 2,721 (100.0%) | 2.89 |
Median Household Size in Clay County
The median household size in Clay County is 2.33 persons per household, with single female/mother households (425 | 7.9%) accounting for the largest median household size of 3.6 persons per household. non-family households (2,695 | 49.8%) represent the smallest median household size with 1.59 persons per household.
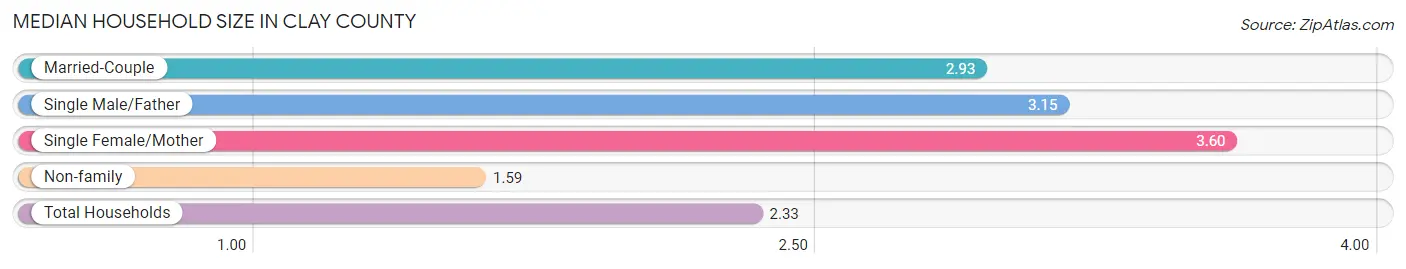
| Household Type | # Households | Household Size |
| Married-Couple | 2,062 (38.1%) | 2.93 |
| Single Male/Father | 234 (4.3%) | 3.15 |
| Single Female/Mother | 425 (7.9%) | 3.60 |
| Non-family | 2,695 (49.8%) | 1.59 |
| Total Households | 5,416 (100.0%) | 2.33 |
Household Size by Marriage Status in Clay County
Out of a total of 5,416 households in Clay County, 2,721 (50.2%) are family households, while 2,695 (49.8%) are nonfamily households. The most numerous type of family households are 2-person households, comprising 1,162, and the most common type of nonfamily households are 1-person households, comprising 1,856.
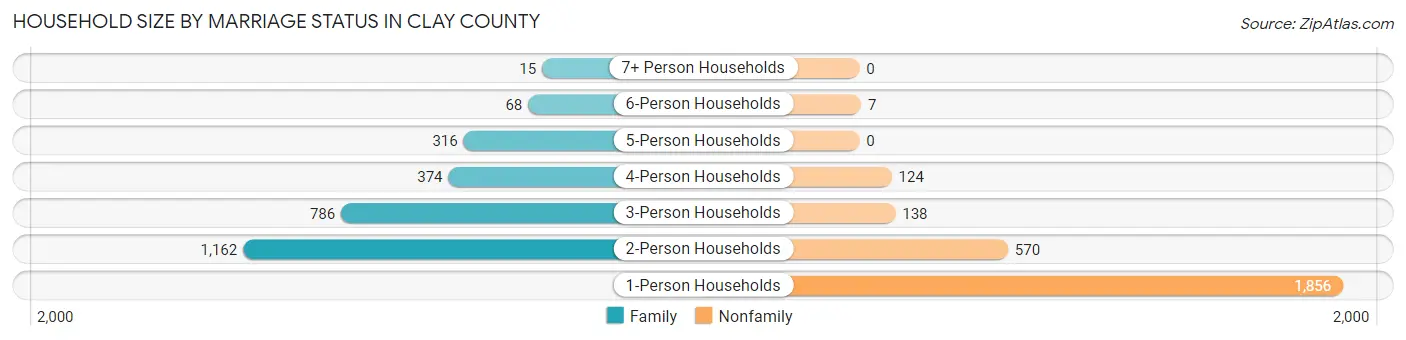
| Household Size | Family Households | Nonfamily Households |
| 1-Person Households | - | 1,856 (34.3%) |
| 2-Person Households | 1,162 (21.4%) | 570 (10.5%) |
| 3-Person Households | 786 (14.5%) | 138 (2.5%) |
| 4-Person Households | 374 (6.9%) | 124 (2.3%) |
| 5-Person Households | 316 (5.8%) | 0 (0.0%) |
| 6-Person Households | 68 (1.3%) | 7 (0.1%) |
| 7+ Person Households | 15 (0.3%) | 0 (0.0%) |
| Total | 2,721 (50.2%) | 2,695 (49.8%) |
Female Fertility in Clay County
Fertility by Age in Clay County
Average fertility rate in Clay County is 35.0 births per 1,000 women. Women in the age bracket of 35 to 50 years have the highest fertility rate with 60.0 births per 1,000 women. Women in the age bracket of 20 to 34 years acount for 63.7% of all women with births.
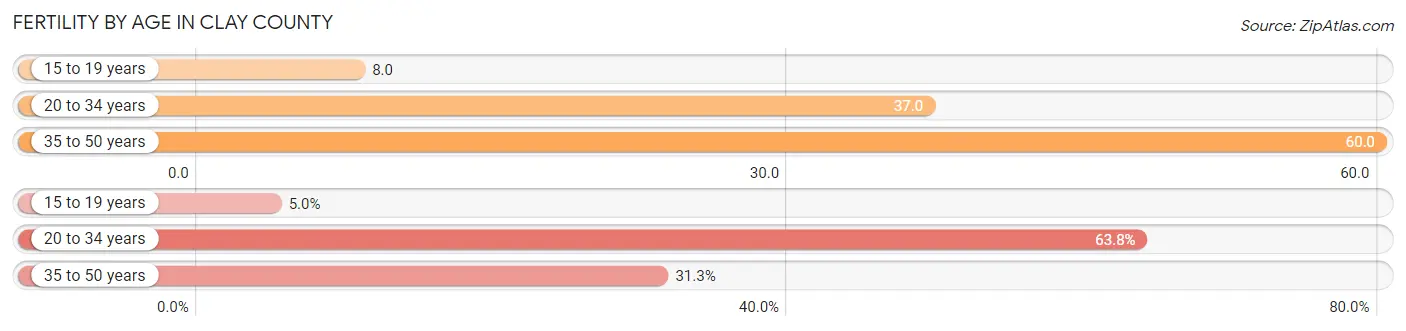
| Age Bracket | Women with Births | Births / 1,000 Women |
| 15 to 19 years | 8 (5.0%) | 8.0 |
| 20 to 34 years | 102 (63.7%) | 37.0 |
| 35 to 50 years | 50 (31.2%) | 60.0 |
| Total | 160 (100.0%) | 35.0 |
Fertility by Age by Marriage Status in Clay County
54.4% of women with births (160) in Clay County are married. The highest percentage of unmarried women with births falls into 15 to 19 years age bracket with 100.0% of them unmarried at the time of birth, while the lowest percentage of unmarried women with births belong to 20 to 34 years age bracket with 38.2% of them unmarried.
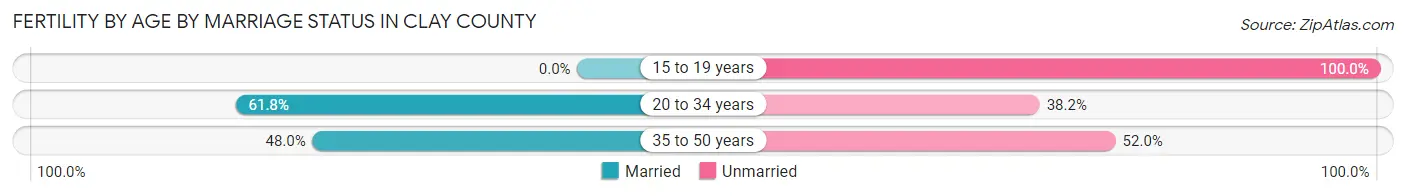
| Age Bracket | Married | Unmarried |
| 15 to 19 years | 0 (0.0%) | 8 (100.0%) |
| 20 to 34 years | 63 (61.8%) | 39 (38.2%) |
| 35 to 50 years | 24 (48.0%) | 26 (52.0%) |
| Total | 87 (54.4%) | 73 (45.6%) |
Fertility by Education in Clay County
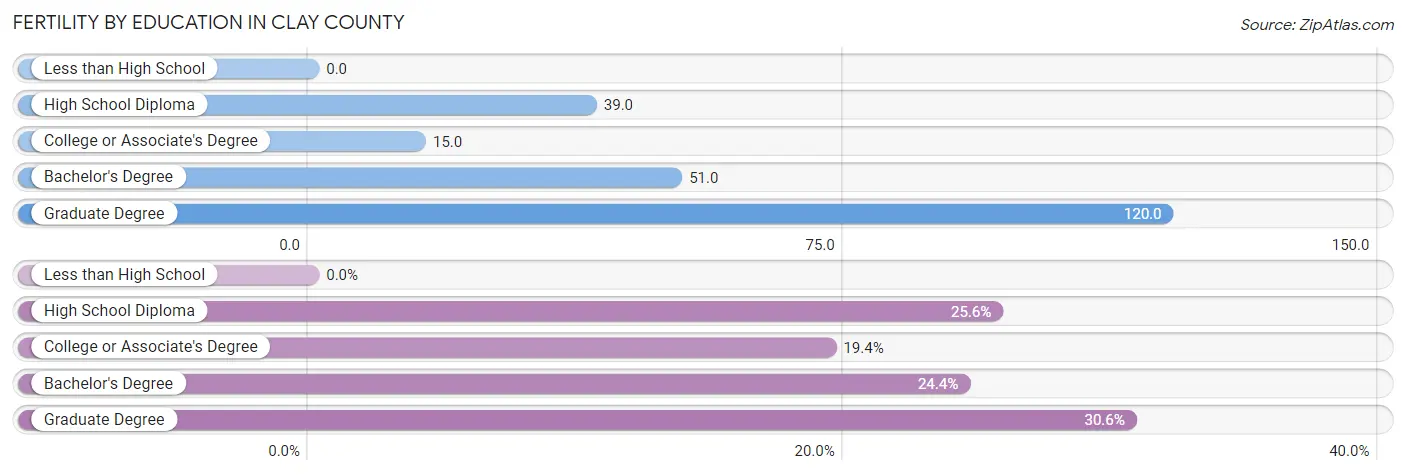
| Educational Attainment | Women with Births | Births / 1,000 Women |
| Less than High School | 0 (0.0%) | 0.0 |
| High School Diploma | 41 (25.6%) | 39.0 |
| College or Associate's Degree | 31 (19.4%) | 15.0 |
| Bachelor's Degree | 39 (24.4%) | 51.0 |
| Graduate Degree | 49 (30.6%) | 120.0 |
| Total | 160 (100.0%) | 35.0 |
Fertility by Education by Marriage Status in Clay County
45.6% of women with births in Clay County are unmarried. Women with the educational attainment of graduate degree are most likely to be married with 100.0% of them married at childbirth, while women with the educational attainment of high school diploma are least likely to be married with 100.0% of them unmarried at childbirth.
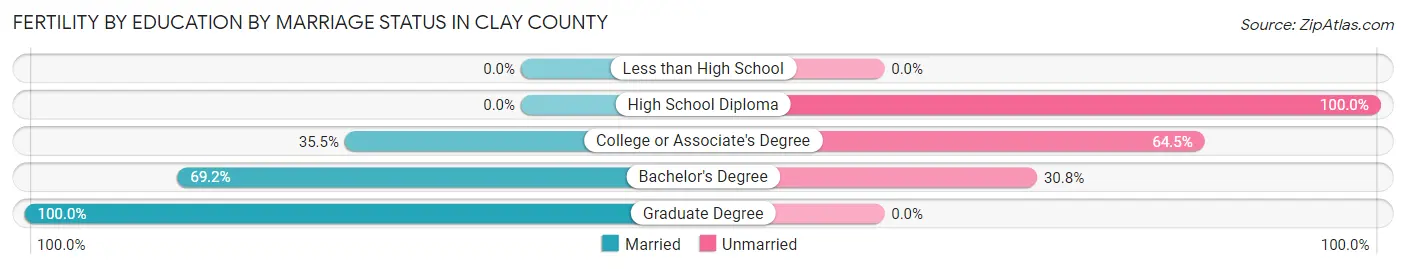
| Educational Attainment | Married | Unmarried |
| Less than High School | 0 (0.0%) | 0 (0.0%) |
| High School Diploma | 0 (0.0%) | 41 (100.0%) |
| College or Associate's Degree | 11 (35.5%) | 20 (64.5%) |
| Bachelor's Degree | 27 (69.2%) | 12 (30.8%) |
| Graduate Degree | 49 (100.0%) | 0 (0.0%) |
| Total | 87 (54.4%) | 73 (45.6%) |
Income in Clay County
Income Overview in Clay County
Per Capita Income in Clay County is $30,033, while median incomes of families and households are $89,497 and $55,963 respectively.
| Characteristic | Number | Measure |
| Per Capita Income | 14,953 | $30,033 |
| Median Family Income | 2,721 | $89,497 |
| Mean Family Income | 2,721 | $107,157 |
| Median Household Income | 5,416 | $55,963 |
| Mean Household Income | 5,416 | $78,261 |
| Income Deficit | 2,721 | $14,672 |
| Wage / Income Gap (%) | 14,953 | 40.28% |
| Wage / Income Gap ($) | 14,953 | 59.72¢ per $1 |
| Gini / Inequality Index | 14,953 | 0.48 |
Earnings by Sex in Clay County
Average Earnings in Clay County are $22,296, $26,389 for men and $15,759 for women, a difference of 40.3%.
| Sex | Number | Average Earnings |
| Male | 4,910 (49.5%) | $26,389 |
| Female | 5,004 (50.5%) | $15,759 |
| Total | 9,914 (100.0%) | $22,296 |
Earnings by Sex by Income Bracket in Clay County
The most common earnings brackets in Clay County are $2,500 to $4,999 for men (545 | 11.1%) and $2,500 to $4,999 for women (627 | 12.5%).
| Income | Male | Female |
| $2,499 or less | 311 (6.3%) | 568 (11.4%) |
| $2,500 to $4,999 | 545 (11.1%) | 627 (12.5%) |
| $5,000 to $7,499 | 373 (7.6%) | 377 (7.5%) |
| $7,500 to $9,999 | 346 (7.0%) | 534 (10.7%) |
| $10,000 to $12,499 | 174 (3.5%) | 225 (4.5%) |
| $12,500 to $14,999 | 122 (2.5%) | 110 (2.2%) |
| $15,000 to $17,499 | 68 (1.4%) | 201 (4.0%) |
| $17,500 to $19,999 | 54 (1.1%) | 74 (1.5%) |
| $20,000 to $22,499 | 125 (2.5%) | 145 (2.9%) |
| $22,500 to $24,999 | 277 (5.6%) | 253 (5.1%) |
| $25,000 to $29,999 | 190 (3.9%) | 281 (5.6%) |
| $30,000 to $34,999 | 170 (3.5%) | 233 (4.7%) |
| $35,000 to $39,999 | 160 (3.3%) | 269 (5.4%) |
| $40,000 to $44,999 | 280 (5.7%) | 220 (4.4%) |
| $45,000 to $49,999 | 244 (5.0%) | 61 (1.2%) |
| $50,000 to $54,999 | 219 (4.5%) | 140 (2.8%) |
| $55,000 to $64,999 | 288 (5.9%) | 246 (4.9%) |
| $65,000 to $74,999 | 203 (4.1%) | 106 (2.1%) |
| $75,000 to $99,999 | 331 (6.7%) | 234 (4.7%) |
| $100,000+ | 430 (8.8%) | 100 (2.0%) |
| Total | 4,910 (100.0%) | 5,004 (100.0%) |
Earnings by Sex by Educational Attainment in Clay County
Average earnings in Clay County are $50,407 for men and $35,551 for women, a difference of 29.5%. Men with an educational attainment of graduate degree enjoy the highest average annual earnings of $61,667, while those with less than high school education earn the least with $40,395. Women with an educational attainment of graduate degree earn the most with the average annual earnings of $59,089, while those with high school diploma education have the smallest earnings of $22,375.
| Educational Attainment | Male Income | Female Income |
| Less than High School | $40,395 | $29,046 |
| High School Diploma | $43,514 | $22,375 |
| College or Associate's Degree | $53,983 | $34,035 |
| Bachelor's Degree | $49,426 | $42,560 |
| Graduate Degree | $61,667 | $59,089 |
| Total | $50,407 | $35,551 |
Family Income in Clay County
Family Income Brackets in Clay County
According to the Clay County family income data, there are 623 families falling into the $100,000 to $149,999 income range, which is the most common income bracket and makes up 22.9% of all families. Conversely, the $15,000 to $24,999 income bracket is the least frequent group with only 38 families (1.4%) belonging to this category.
| Income Bracket | # Families | % Families |
| Less than $10,000 | 114 | 4.2% |
| $10,000 to $14,999 | 60 | 2.2% |
| $15,000 to $24,999 | 38 | 1.4% |
| $25,000 to $34,999 | 190 | 7.0% |
| $35,000 to $49,999 | 190 | 7.0% |
| $50,000 to $74,999 | 501 | 18.4% |
| $75,000 to $99,999 | 471 | 17.3% |
| $100,000 to $149,999 | 623 | 22.9% |
| $150,000 to $199,999 | 288 | 10.6% |
| $200,000+ | 242 | 8.9% |
Family Income by Famaliy Size in Clay County
5-person families (197 | 7.2%) account for the highest median family income in Clay County with $180,369 per family, while 2-person families (1,307 | 48.0%) have the highest median income of $45,146 per family member.
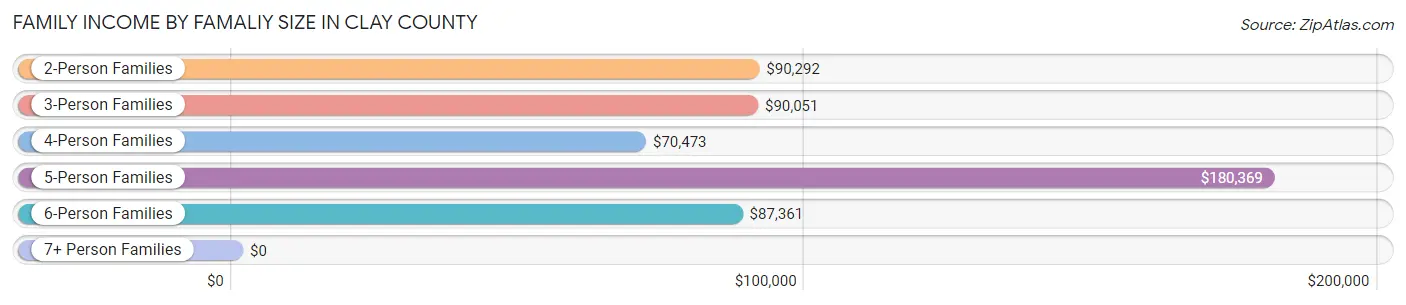
| Income Bracket | # Families | Median Income |
| 2-Person Families | 1,307 (48.0%) | $90,292 |
| 3-Person Families | 736 (27.1%) | $90,051 |
| 4-Person Families | 398 (14.6%) | $70,473 |
| 5-Person Families | 197 (7.2%) | $180,369 |
| 6-Person Families | 68 (2.5%) | $87,361 |
| 7+ Person Families | 15 (0.5%) | $0 |
| Total | 2,721 (100.0%) | $89,497 |
Family Income by Number of Earners in Clay County
The median family income in Clay County is $89,497, with families comprising 3+ earners (152) having the highest median family income of $104,797, while families with no earners (367) have the lowest median family income of $41,563, accounting for 5.6% and 13.5% of families, respectively.
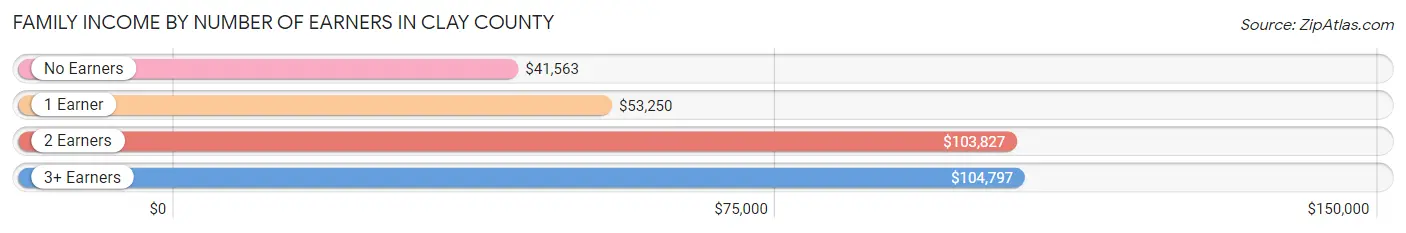
| Number of Earners | # Families | Median Income |
| No Earners | 367 (13.5%) | $41,563 |
| 1 Earner | 804 (29.5%) | $53,250 |
| 2 Earners | 1,398 (51.4%) | $103,827 |
| 3+ Earners | 152 (5.6%) | $104,797 |
| Total | 2,721 (100.0%) | $89,497 |
Household Income in Clay County
Household Income Brackets in Clay County
With 823 households falling in the category, the $50,000 to $74,999 income range is the most frequent in Clay County, accounting for 15.2% of all households. In contrast, only 276 households (5.1%) fall into the $10,000 to $14,999 income bracket, making it the least populous group.
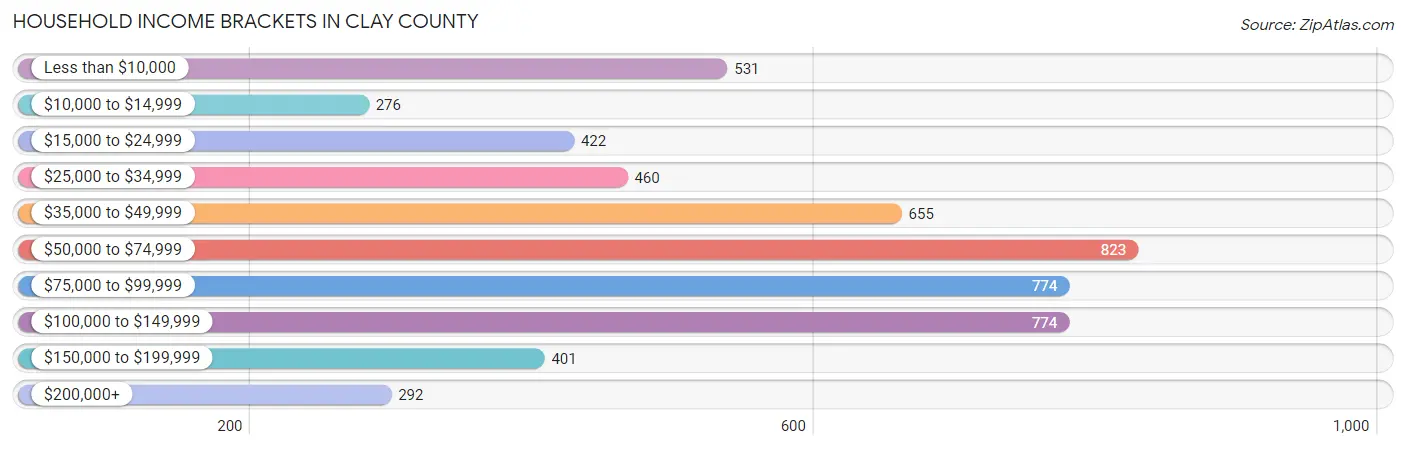
| Income Bracket | # Households | % Households |
| Less than $10,000 | 531 | 9.8% |
| $10,000 to $14,999 | 276 | 5.1% |
| $15,000 to $24,999 | 422 | 7.8% |
| $25,000 to $34,999 | 460 | 8.5% |
| $35,000 to $49,999 | 655 | 12.1% |
| $50,000 to $74,999 | 823 | 15.2% |
| $75,000 to $99,999 | 774 | 14.3% |
| $100,000 to $149,999 | 774 | 14.3% |
| $150,000 to $199,999 | 401 | 7.4% |
| $200,000+ | 292 | 5.4% |
Household Income by Householder Age in Clay County
The median household income in Clay County is $55,963, with the highest median household income of $93,663 found in the 45 to 64 years age bracket for the primary householder. A total of 1,458 households (26.9%) fall into this category. Meanwhile, the 15 to 24 years age bracket for the primary householder has the lowest median household income of $23,854, with 1,142 households (21.1%) in this group.
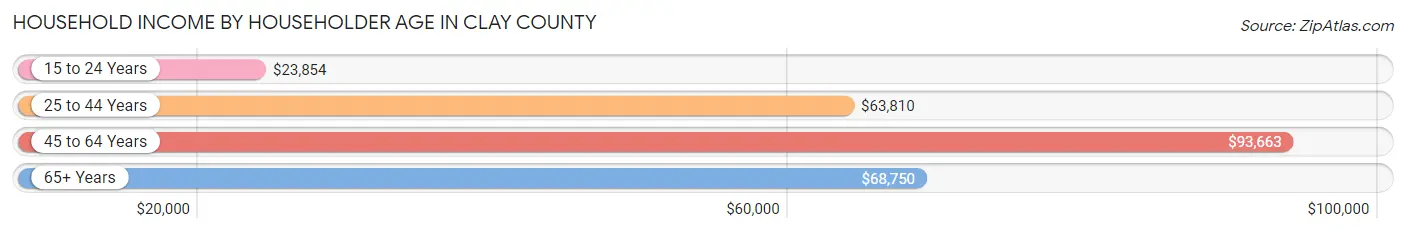
| Income Bracket | # Households | Median Income |
| 15 to 24 Years | 1,142 (21.1%) | $23,854 |
| 25 to 44 Years | 1,786 (33.0%) | $63,810 |
| 45 to 64 Years | 1,458 (26.9%) | $93,663 |
| 65+ Years | 1,030 (19.0%) | $68,750 |
| Total | 5,416 (100.0%) | $55,963 |
Poverty in Clay County
Income Below Poverty by Sex and Age in Clay County
With 19.0% poverty level for males and 23.4% for females among the residents of Clay County, 18 to 24 year old males and 18 to 24 year old females are the most vulnerable to poverty, with 644 males (46.0%) and 969 females (60.2%) in their respective age groups living below the poverty level.
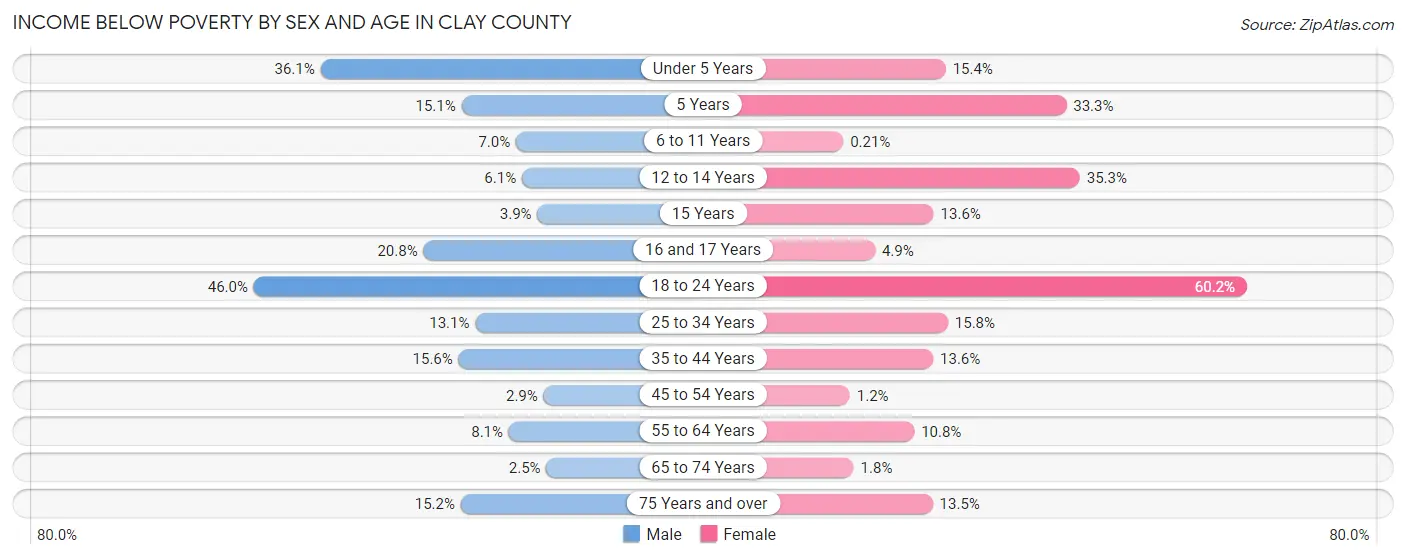
| Age Bracket | Male | Female |
| Under 5 Years | 115 (36.0%) | 56 (15.4%) |
| 5 Years | 13 (15.1%) | 13 (33.3%) |
| 6 to 11 Years | 23 (7.0%) | 1 (0.2%) |
| 12 to 14 Years | 17 (6.1%) | 82 (35.3%) |
| 15 Years | 3 (3.8%) | 6 (13.6%) |
| 16 and 17 Years | 27 (20.8%) | 6 (4.9%) |
| 18 to 24 Years | 644 (46.0%) | 969 (60.2%) |
| 25 to 34 Years | 128 (13.1%) | 132 (15.8%) |
| 35 to 44 Years | 111 (15.5%) | 77 (13.6%) |
| 45 to 54 Years | 18 (2.9%) | 6 (1.2%) |
| 55 to 64 Years | 53 (8.1%) | 70 (10.7%) |
| 65 to 74 Years | 13 (2.5%) | 9 (1.8%) |
| 75 Years and over | 39 (15.2%) | 39 (13.5%) |
| Total | 1,204 (19.0%) | 1,466 (23.4%) |
Income Above Poverty by Sex and Age in Clay County
According to the poverty statistics in Clay County, males aged 65 to 74 years and females aged 6 to 11 years are the age groups that are most secure financially, with 97.5% of males and 99.8% of females in these age groups living above the poverty line.
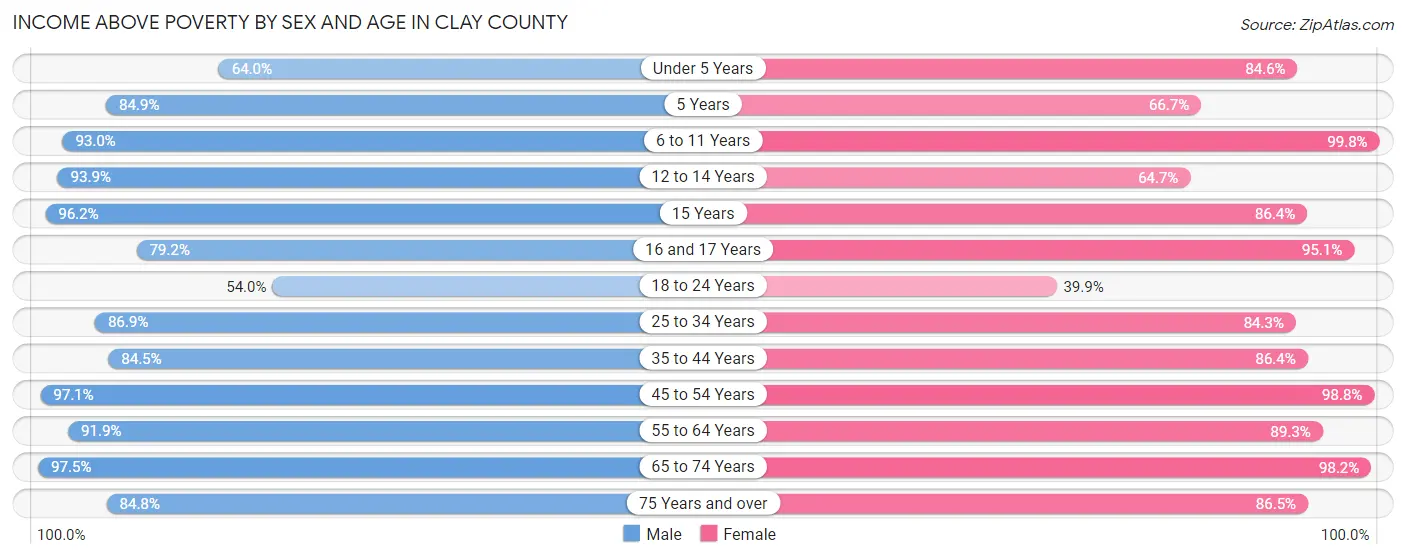
| Age Bracket | Male | Female |
| Under 5 Years | 204 (63.9%) | 307 (84.6%) |
| 5 Years | 73 (84.9%) | 26 (66.7%) |
| 6 to 11 Years | 304 (93.0%) | 483 (99.8%) |
| 12 to 14 Years | 260 (93.9%) | 150 (64.7%) |
| 15 Years | 75 (96.2%) | 38 (86.4%) |
| 16 and 17 Years | 103 (79.2%) | 116 (95.1%) |
| 18 to 24 Years | 757 (54.0%) | 642 (39.9%) |
| 25 to 34 Years | 851 (86.9%) | 706 (84.3%) |
| 35 to 44 Years | 603 (84.5%) | 491 (86.4%) |
| 45 to 54 Years | 596 (97.1%) | 500 (98.8%) |
| 55 to 64 Years | 602 (91.9%) | 581 (89.2%) |
| 65 to 74 Years | 504 (97.5%) | 503 (98.2%) |
| 75 Years and over | 217 (84.8%) | 250 (86.5%) |
| Total | 5,149 (81.0%) | 4,793 (76.6%) |
Income Below Poverty Among Married-Couple Families in Clay County
The poverty statistics for married-couple families in Clay County show that 3.0% or 62 of the total 2,062 families live below the poverty line. Families with 5 or more children have the highest poverty rate of 60.0%, comprising of 9 families. On the other hand, families with 3 or 4 children have the lowest poverty rate of 0.0%, which includes 0 families.
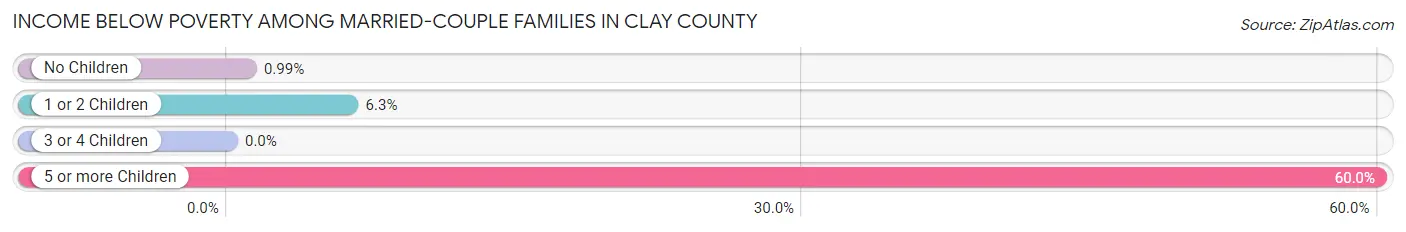
| Children | Above Poverty | Below Poverty |
| No Children | 1,195 (99.0%) | 12 (1.0%) |
| 1 or 2 Children | 610 (93.7%) | 41 (6.3%) |
| 3 or 4 Children | 189 (100.0%) | 0 (0.0%) |
| 5 or more Children | 6 (40.0%) | 9 (60.0%) |
| Total | 2,000 (97.0%) | 62 (3.0%) |
Income Below Poverty Among Single-Parent Households in Clay County
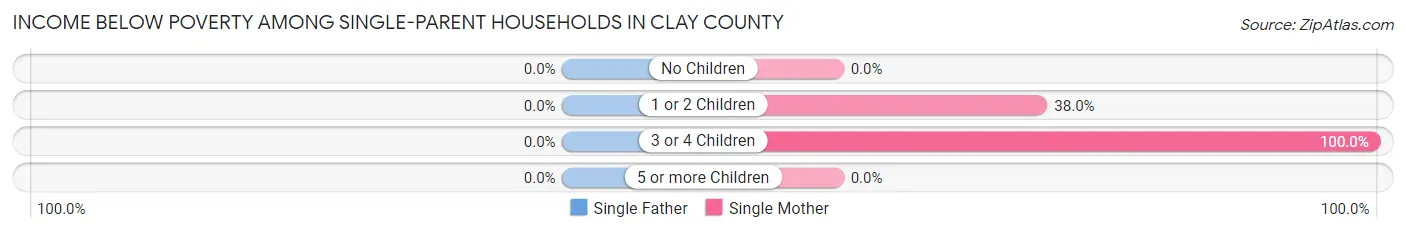
| Children | Single Father | Single Mother |
| No Children | 0 (0.0%) | 0 (0.0%) |
| 1 or 2 Children | 0 (0.0%) | 115 (38.0%) |
| 3 or 4 Children | 0 (0.0%) | 16 (100.0%) |
| 5 or more Children | 0 (0.0%) | 0 (0.0%) |
| Total | 0 (0.0%) | 131 (30.8%) |
Income Below Poverty Among Married-Couple vs Single-Parent Households in Clay County
The poverty data for Clay County shows that 62 of the married-couple family households (3.0%) and 131 of the single-parent households (19.9%) are living below the poverty level. Within the married-couple family households, those with 5 or more children have the highest poverty rate, with 9 households (60.0%) falling below the poverty line. Among the single-parent households, those with 1 or 2 children have the highest poverty rate, with 115 household (29.3%) living below poverty.
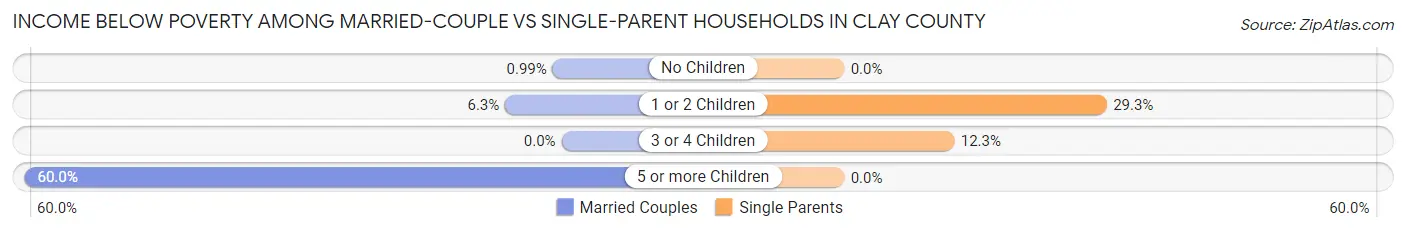
| Children | Married-Couple Families | Single-Parent Households |
| No Children | 12 (1.0%) | 0 (0.0%) |
| 1 or 2 Children | 41 (6.3%) | 115 (29.3%) |
| 3 or 4 Children | 0 (0.0%) | 16 (12.3%) |
| 5 or more Children | 9 (60.0%) | 0 (0.0%) |
| Total | 62 (3.0%) | 131 (19.9%) |
Employment Characteristics in Clay County
Employment by Class of Employer in Clay County
Among the 7,330 employed individuals in Clay County, private company employees (3,712 | 50.6%), state government employees (1,417 | 19.3%), and not-for-profit organizations (1,003 | 13.7%) make up the most common classes of employment.
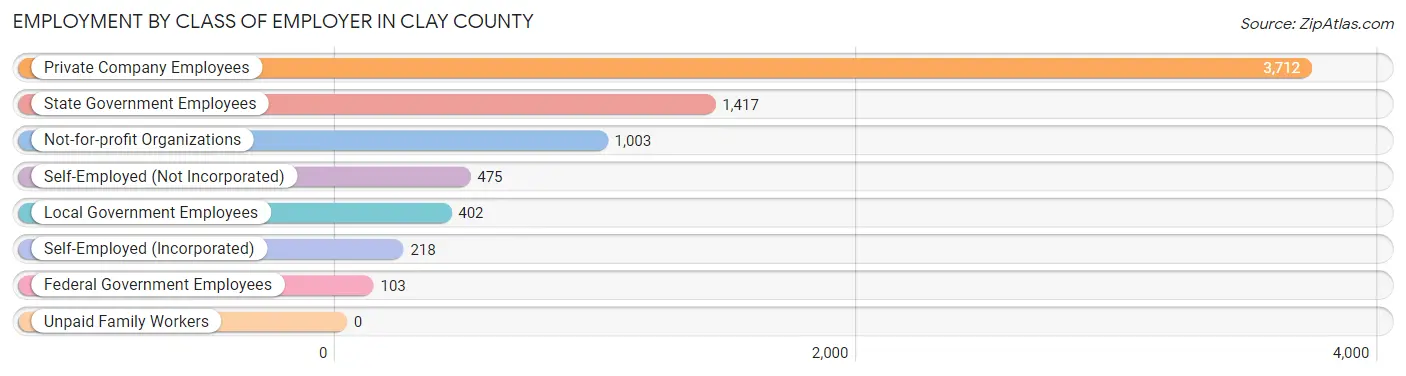
| Employer Class | # Employees | % Employees |
| Private Company Employees | 3,712 | 50.6% |
| Self-Employed (Incorporated) | 218 | 3.0% |
| Self-Employed (Not Incorporated) | 475 | 6.5% |
| Not-for-profit Organizations | 1,003 | 13.7% |
| Local Government Employees | 402 | 5.5% |
| State Government Employees | 1,417 | 19.3% |
| Federal Government Employees | 103 | 1.4% |
| Unpaid Family Workers | 0 | 0.0% |
| Total | 7,330 | 100.0% |
Employment Status by Age in Clay County
According to the labor force statistics for Clay County, out of the total population over 16 years of age (12,633), 67.6% or 8,540 individuals are in the labor force, with 8.2% or 700 of them unemployed. The age group with the highest labor force participation rate is 45 to 54 years, with 87.1% or 978 individuals in the labor force. Within the labor force, the 16 to 19 years age range has the highest percentage of unemployed individuals, with 31.2% or 452 of them being unemployed.
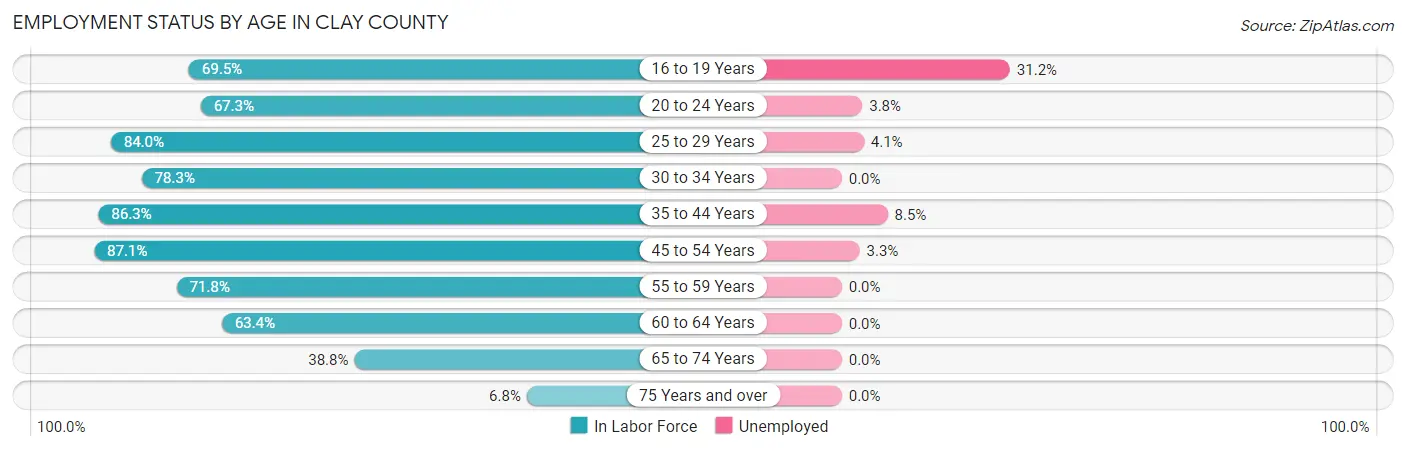
| Age Bracket | In Labor Force | Unemployed |
| 16 to 19 Years | 1,450 (69.5%) | 452 (31.2%) |
| 20 to 24 Years | 2,162 (67.3%) | 82 (3.8%) |
| 25 to 29 Years | 919 (84.0%) | 38 (4.1%) |
| 30 to 34 Years | 578 (78.3%) | 0 (0.0%) |
| 35 to 44 Years | 1,118 (86.3%) | 95 (8.5%) |
| 45 to 54 Years | 978 (87.1%) | 32 (3.3%) |
| 55 to 59 Years | 407 (71.8%) | 0 (0.0%) |
| 60 to 64 Years | 470 (63.4%) | 0 (0.0%) |
| 65 to 74 Years | 405 (38.8%) | 0 (0.0%) |
| 75 Years and over | 50 (6.8%) | 0 (0.0%) |
| Total | 8,540 (67.6%) | 700 (8.2%) |
Employment Status by Educational Attainment in Clay County
According to labor force statistics for Clay County, 80.4% of individuals (4,469) out of the total population between 25 and 64 years of age (5,559) are in the labor force, with 3.7% or 165 of them being unemployed. The group with the highest labor force participation rate are those with the educational attainment of bachelor's degree or higher, with 88.9% or 2,186 individuals in the labor force. Within the labor force, individuals with high school diploma education have the highest percentage of unemployment, with 8.3% or 90 of them being unemployed.
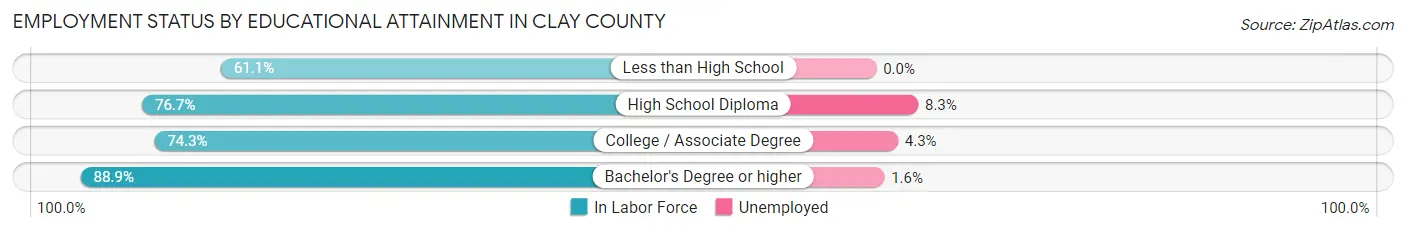
| Educational Attainment | In Labor Force | Unemployed |
| Less than High School | 243 (61.1%) | 0 (0.0%) |
| High School Diploma | 1,085 (76.7%) | 117 (8.3%) |
| College / Associate Degree | 957 (74.3%) | 55 (4.3%) |
| Bachelor's Degree or higher | 2,186 (88.9%) | 39 (1.6%) |
| Total | 4,469 (80.4%) | 206 (3.7%) |
Employment Occupations by Sex in Clay County
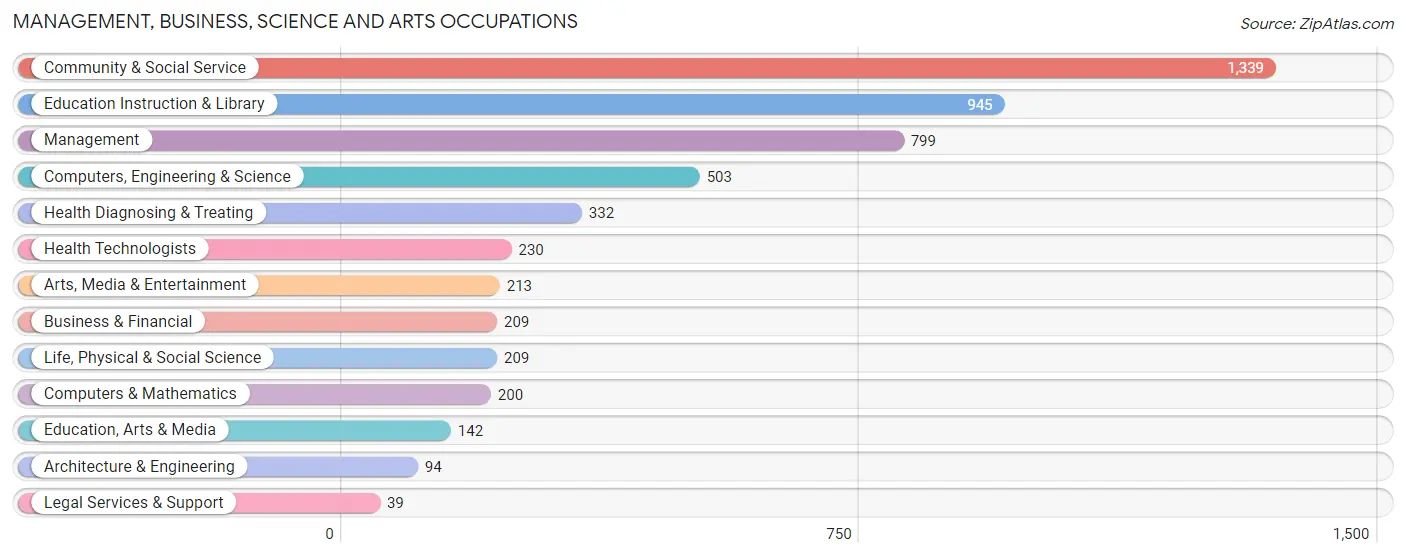
Management, Business, Science and Arts Occupations
The most common Management, Business, Science and Arts occupations in Clay County are Community & Social Service (1,339 | 17.2%), Education Instruction & Library (945 | 12.1%), Management (799 | 10.2%), Computers, Engineering & Science (503 | 6.4%), and Health Diagnosing & Treating (332 | 4.3%).
Management, Business, Science and Arts Occupations by Sex
Within the Management, Business, Science and Arts occupations in Clay County, the most male-oriented occupations are Computers & Mathematics (77.5%), Life, Physical & Social Science (65.1%), and Computers, Engineering & Science (64.8%), while the most female-oriented occupations are Health Technologists (88.3%), Health Diagnosing & Treating (81.3%), and Legal Services & Support (74.4%).
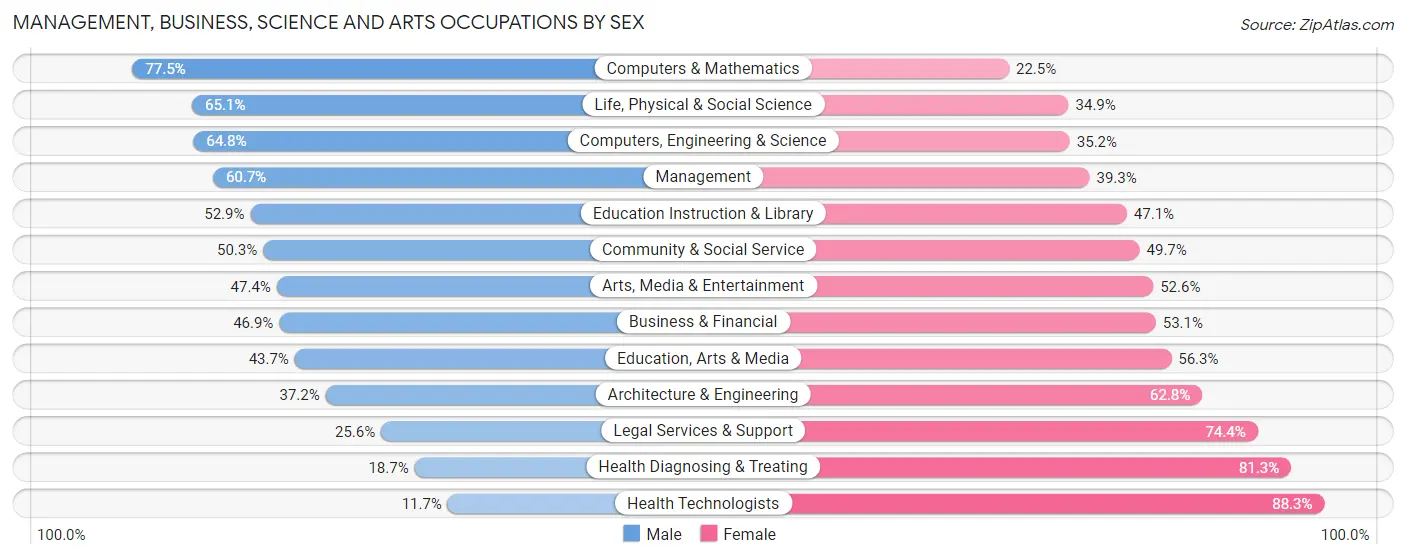
| Occupation | Male | Female |
| Management | 485 (60.7%) | 314 (39.3%) |
| Business & Financial | 98 (46.9%) | 111 (53.1%) |
| Computers, Engineering & Science | 326 (64.8%) | 177 (35.2%) |
| Computers & Mathematics | 155 (77.5%) | 45 (22.5%) |
| Architecture & Engineering | 35 (37.2%) | 59 (62.8%) |
| Life, Physical & Social Science | 136 (65.1%) | 73 (34.9%) |
| Community & Social Service | 673 (50.3%) | 666 (49.7%) |
| Education, Arts & Media | 62 (43.7%) | 80 (56.3%) |
| Legal Services & Support | 10 (25.6%) | 29 (74.4%) |
| Education Instruction & Library | 500 (52.9%) | 445 (47.1%) |
| Arts, Media & Entertainment | 101 (47.4%) | 112 (52.6%) |
| Health Diagnosing & Treating | 62 (18.7%) | 270 (81.3%) |
| Health Technologists | 27 (11.7%) | 203 (88.3%) |
| Total (Category) | 1,644 (51.7%) | 1,538 (48.3%) |
| Total (Overall) | 3,882 (49.7%) | 3,927 (50.3%) |
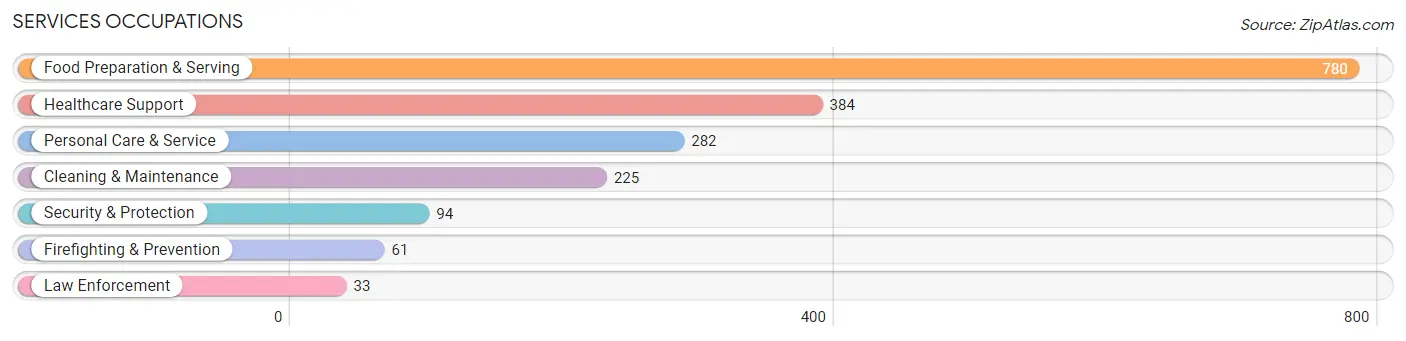
Services Occupations
The most common Services occupations in Clay County are Food Preparation & Serving (780 | 10.0%), Healthcare Support (384 | 4.9%), Personal Care & Service (282 | 3.6%), Cleaning & Maintenance (225 | 2.9%), and Security & Protection (94 | 1.2%).
Services Occupations by Sex
Within the Services occupations in Clay County, the most male-oriented occupations are Law Enforcement (100.0%), Security & Protection (75.5%), and Firefighting & Prevention (62.3%), while the most female-oriented occupations are Healthcare Support (94.8%), Personal Care & Service (76.6%), and Food Preparation & Serving (49.0%).
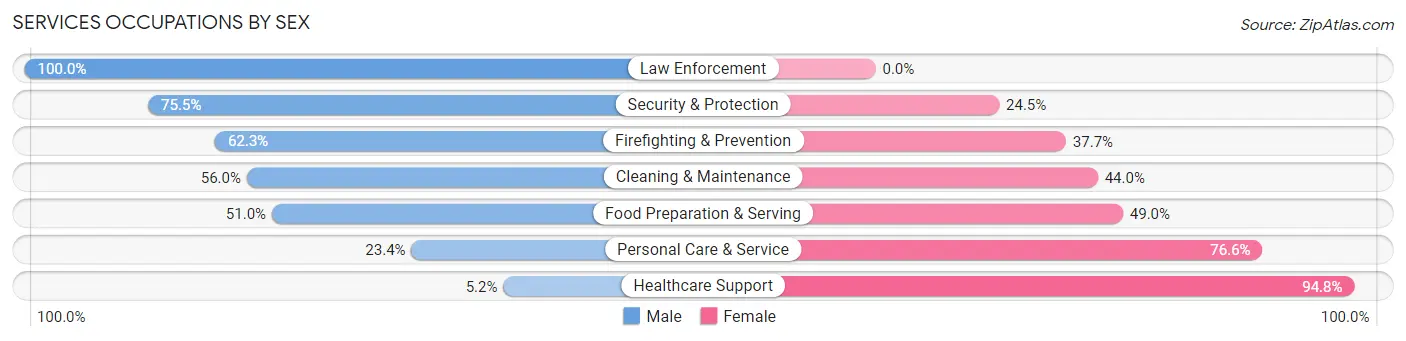
| Occupation | Male | Female |
| Healthcare Support | 20 (5.2%) | 364 (94.8%) |
| Security & Protection | 71 (75.5%) | 23 (24.5%) |
| Firefighting & Prevention | 38 (62.3%) | 23 (37.7%) |
| Law Enforcement | 33 (100.0%) | 0 (0.0%) |
| Food Preparation & Serving | 398 (51.0%) | 382 (49.0%) |
| Cleaning & Maintenance | 126 (56.0%) | 99 (44.0%) |
| Personal Care & Service | 66 (23.4%) | 216 (76.6%) |
| Total (Category) | 681 (38.6%) | 1,084 (61.4%) |
| Total (Overall) | 3,882 (49.7%) | 3,927 (50.3%) |
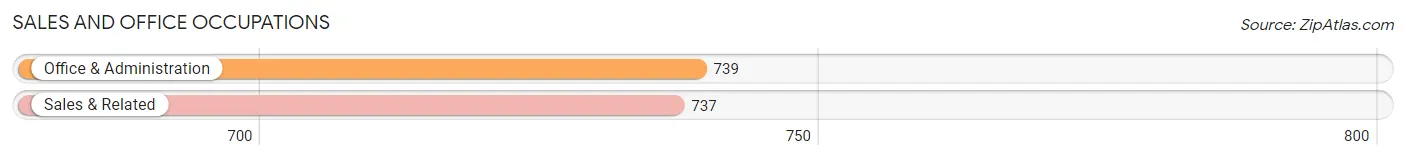
Sales and Office Occupations
The most common Sales and Office occupations in Clay County are Office & Administration (739 | 9.5%), and Sales & Related (737 | 9.4%).
Sales and Office Occupations by Sex
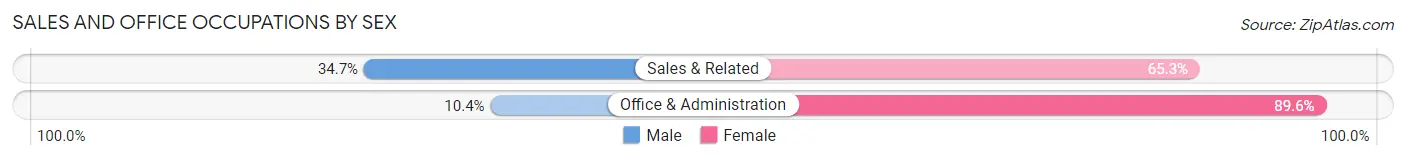
| Occupation | Male | Female |
| Sales & Related | 256 (34.7%) | 481 (65.3%) |
| Office & Administration | 77 (10.4%) | 662 (89.6%) |
| Total (Category) | 333 (22.6%) | 1,143 (77.4%) |
| Total (Overall) | 3,882 (49.7%) | 3,927 (50.3%) |
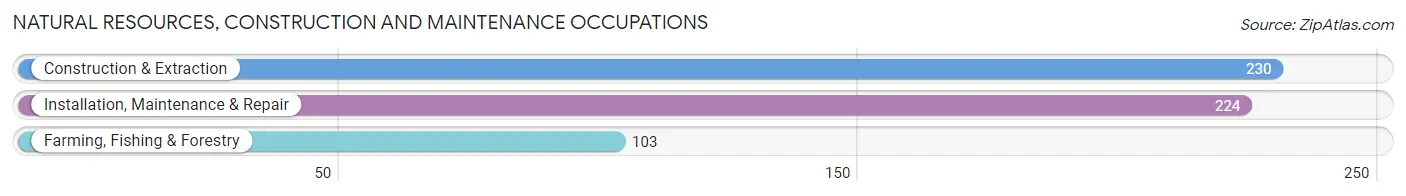
Natural Resources, Construction and Maintenance Occupations
The most common Natural Resources, Construction and Maintenance occupations in Clay County are Construction & Extraction (230 | 2.9%), Installation, Maintenance & Repair (224 | 2.9%), and Farming, Fishing & Forestry (103 | 1.3%).
Natural Resources, Construction and Maintenance Occupations by Sex
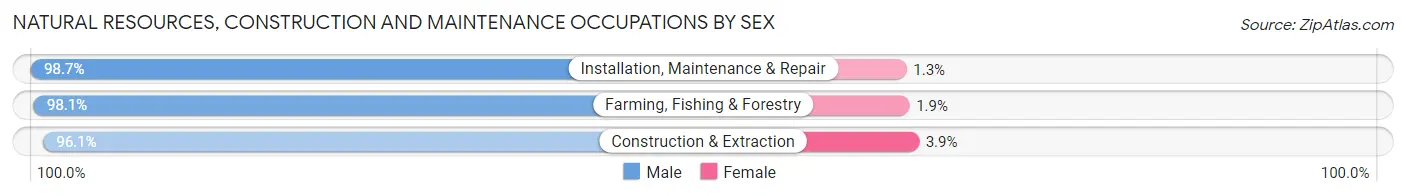
| Occupation | Male | Female |
| Farming, Fishing & Forestry | 101 (98.1%) | 2 (1.9%) |
| Construction & Extraction | 221 (96.1%) | 9 (3.9%) |
| Installation, Maintenance & Repair | 221 (98.7%) | 3 (1.3%) |
| Total (Category) | 543 (97.5%) | 14 (2.5%) |
| Total (Overall) | 3,882 (49.7%) | 3,927 (50.3%) |
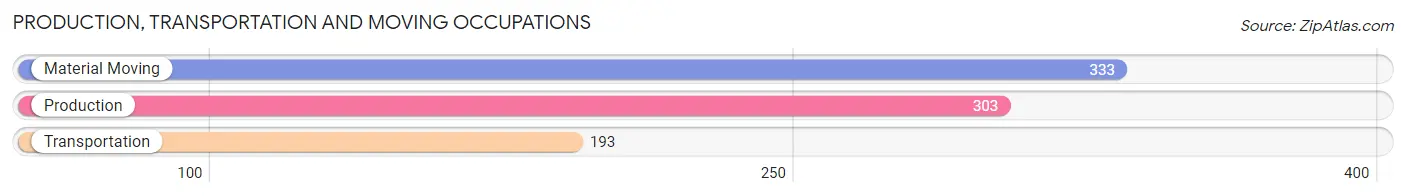
Production, Transportation and Moving Occupations
The most common Production, Transportation and Moving occupations in Clay County are Material Moving (333 | 4.3%), Production (303 | 3.9%), and Transportation (193 | 2.5%).
Production, Transportation and Moving Occupations by Sex
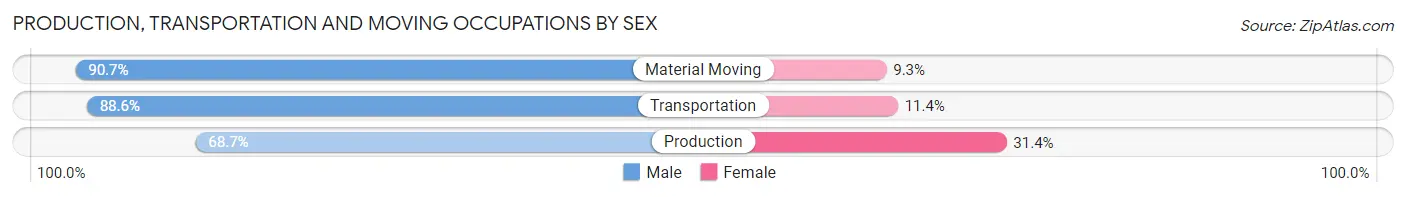
| Occupation | Male | Female |
| Production | 208 (68.6%) | 95 (31.4%) |
| Transportation | 171 (88.6%) | 22 (11.4%) |
| Material Moving | 302 (90.7%) | 31 (9.3%) |
| Total (Category) | 681 (82.2%) | 148 (17.8%) |
| Total (Overall) | 3,882 (49.7%) | 3,927 (50.3%) |
Employment Industries by Sex in Clay County
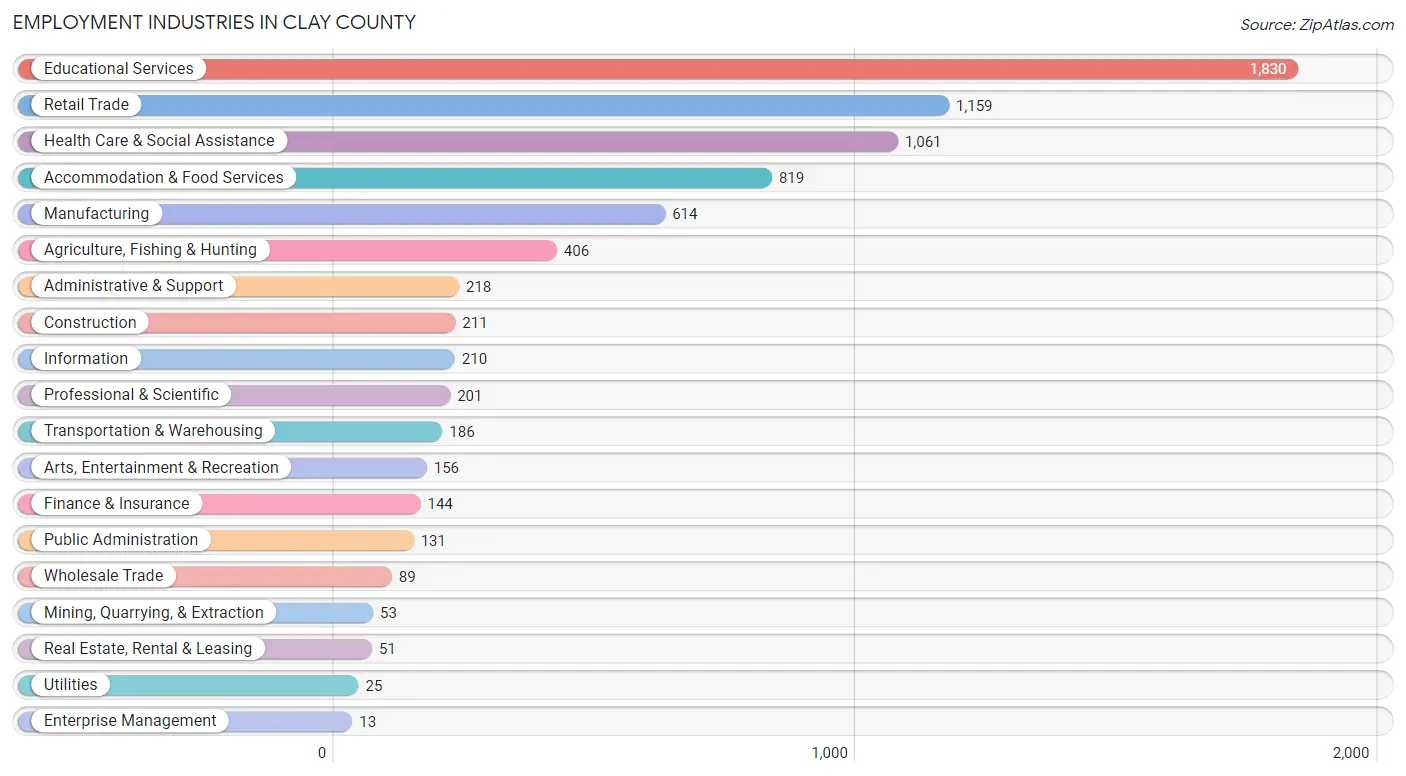
Employment Industries in Clay County
The major employment industries in Clay County include Educational Services (1,830 | 23.4%), Retail Trade (1,159 | 14.8%), Health Care & Social Assistance (1,061 | 13.6%), Accommodation & Food Services (819 | 10.5%), and Manufacturing (614 | 7.9%).
Employment Industries by Sex in Clay County
The Clay County industries that see more men than women are Utilities (100.0%), Enterprise Management (100.0%), and Agriculture, Fishing & Hunting (91.9%), whereas the industries that tend to have a higher number of women are Finance & Insurance (79.9%), Health Care & Social Assistance (79.6%), and Real Estate, Rental & Leasing (64.7%).
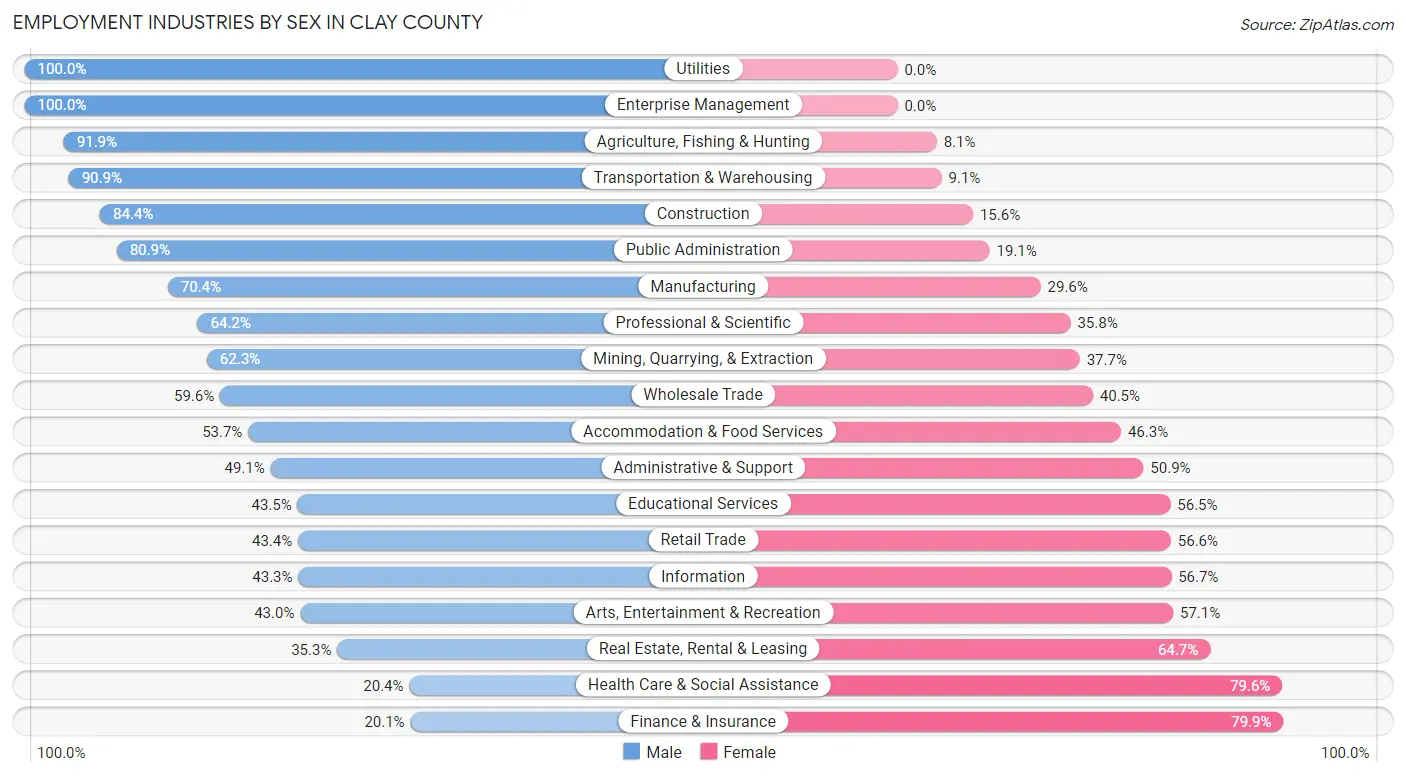
| Industry | Male | Female |
| Agriculture, Fishing & Hunting | 373 (91.9%) | 33 (8.1%) |
| Mining, Quarrying, & Extraction | 33 (62.3%) | 20 (37.7%) |
| Construction | 178 (84.4%) | 33 (15.6%) |
| Manufacturing | 432 (70.4%) | 182 (29.6%) |
| Wholesale Trade | 53 (59.6%) | 36 (40.5%) |
| Retail Trade | 503 (43.4%) | 656 (56.6%) |
| Transportation & Warehousing | 169 (90.9%) | 17 (9.1%) |
| Utilities | 25 (100.0%) | 0 (0.0%) |
| Information | 91 (43.3%) | 119 (56.7%) |
| Finance & Insurance | 29 (20.1%) | 115 (79.9%) |
| Real Estate, Rental & Leasing | 18 (35.3%) | 33 (64.7%) |
| Professional & Scientific | 129 (64.2%) | 72 (35.8%) |
| Enterprise Management | 13 (100.0%) | 0 (0.0%) |
| Administrative & Support | 107 (49.1%) | 111 (50.9%) |
| Educational Services | 796 (43.5%) | 1,034 (56.5%) |
| Health Care & Social Assistance | 216 (20.4%) | 845 (79.6%) |
| Arts, Entertainment & Recreation | 67 (42.9%) | 89 (57.1%) |
| Accommodation & Food Services | 440 (53.7%) | 379 (46.3%) |
| Public Administration | 106 (80.9%) | 25 (19.1%) |
| Total | 3,882 (49.7%) | 3,927 (50.3%) |
Education in Clay County
School Enrollment in Clay County
The most common levels of schooling among the 6,579 students in Clay County are college / undergraduate (3,795 | 57.7%), middle school (645 | 9.8%), and high school (623 | 9.5%).
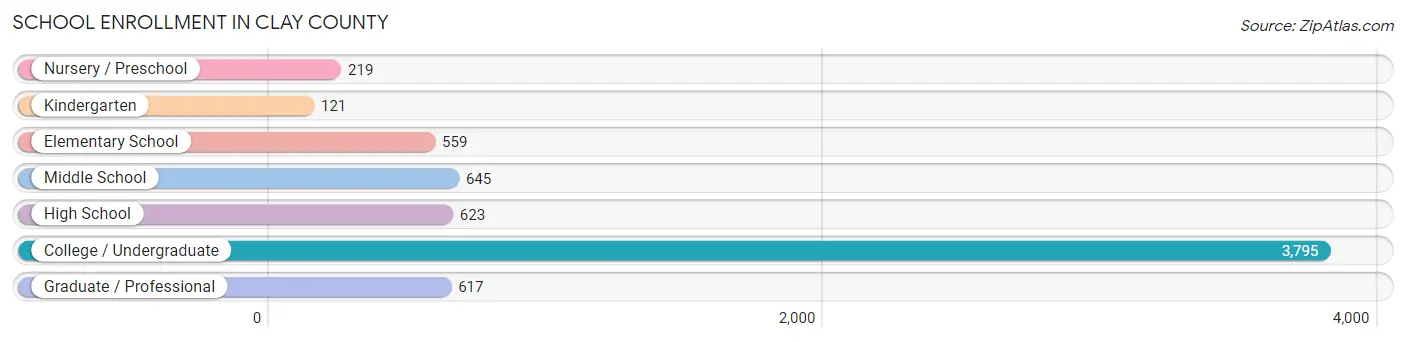
| School Level | # Students | % Students |
| Nursery / Preschool | 219 | 3.3% |
| Kindergarten | 121 | 1.8% |
| Elementary School | 559 | 8.5% |
| Middle School | 645 | 9.8% |
| High School | 623 | 9.5% |
| College / Undergraduate | 3,795 | 57.7% |
| Graduate / Professional | 617 | 9.4% |
| Total | 6,579 | 100.0% |
School Enrollment by Age by Funding Source in Clay County
Out of a total of 6,579 students who are enrolled in schools in Clay County, 368 (5.6%) attend a private institution, while the remaining 6,211 (94.4%) are enrolled in public schools. The age group of 35 years and over has the highest likelihood of being enrolled in private schools, with 53 (28.3% in the age bracket) enrolled. Conversely, the age group of 10 to 14 year olds has the lowest likelihood of being enrolled in a private school, with 788 (98.6% in the age bracket) attending a public institution.
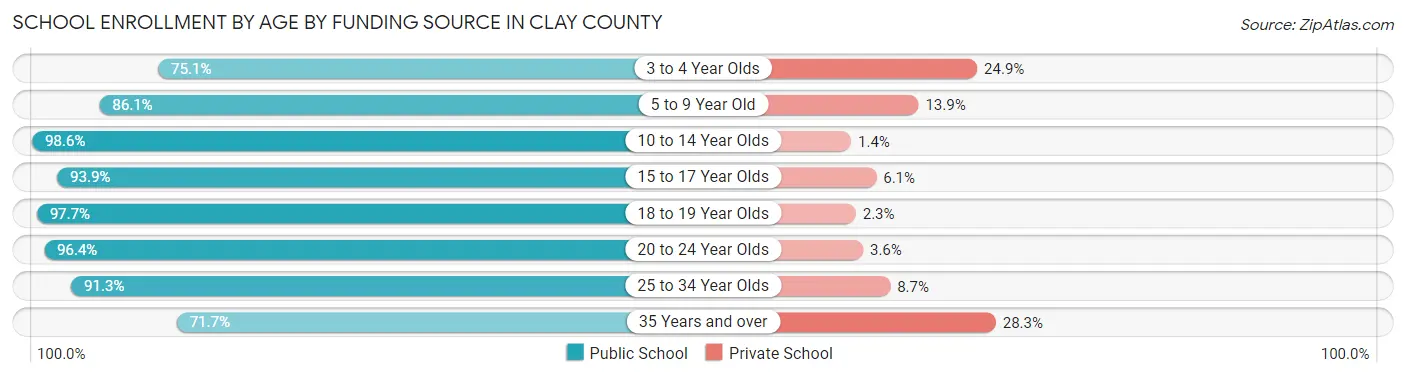
| Age Bracket | Public School | Private School |
| 3 to 4 Year Olds | 130 (75.1%) | 43 (24.9%) |
| 5 to 9 Year Old | 568 (86.1%) | 92 (13.9%) |
| 10 to 14 Year Olds | 788 (98.6%) | 11 (1.4%) |
| 15 to 17 Year Olds | 356 (93.9%) | 23 (6.1%) |
| 18 to 19 Year Olds | 1,597 (97.7%) | 37 (2.3%) |
| 20 to 24 Year Olds | 2,481 (96.4%) | 93 (3.6%) |
| 25 to 34 Year Olds | 158 (91.3%) | 15 (8.7%) |
| 35 Years and over | 134 (71.7%) | 53 (28.3%) |
| Total | 6,211 (94.4%) | 368 (5.6%) |
Educational Attainment by Field of Study in Clay County
Education (539 | 16.3%), business (499 | 15.1%), science & technology (467 | 14.2%), bio, nature & agricultural (344 | 10.4%), and arts & humanities (253 | 7.7%) are the most common fields of study among 3,298 individuals in Clay County who have obtained a bachelor's degree or higher.
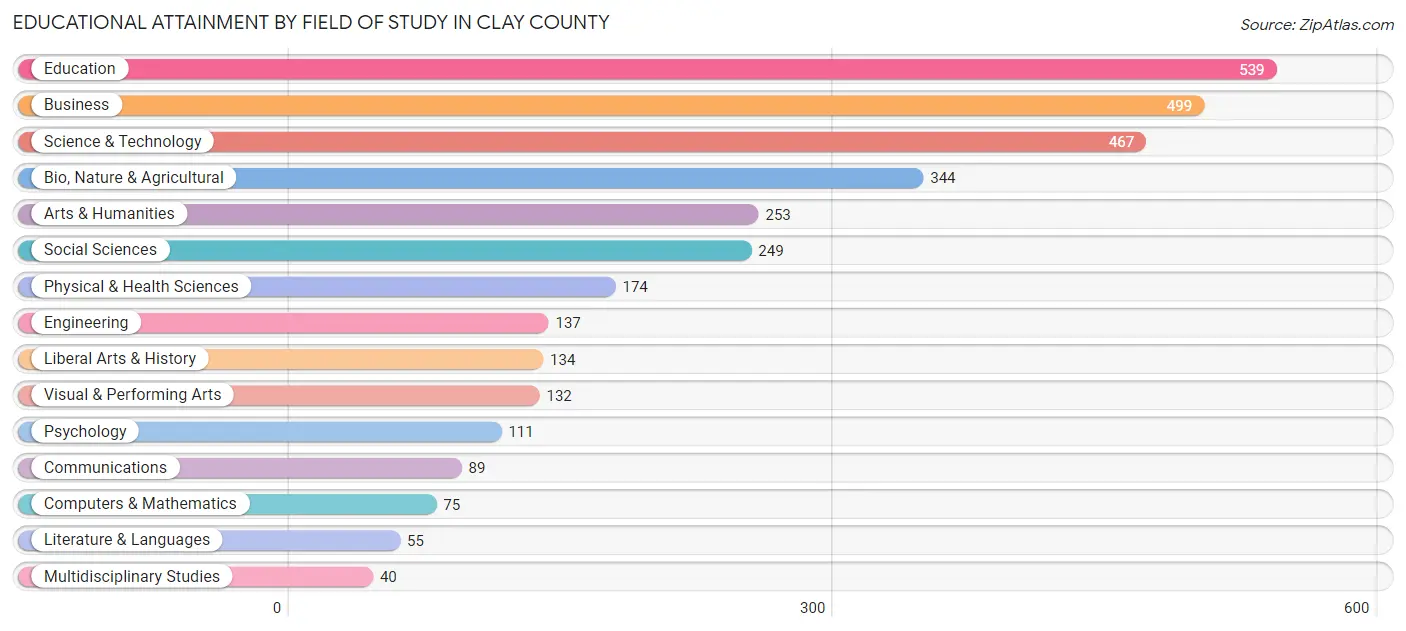
| Field of Study | # Graduates | % Graduates |
| Computers & Mathematics | 75 | 2.3% |
| Bio, Nature & Agricultural | 344 | 10.4% |
| Physical & Health Sciences | 174 | 5.3% |
| Psychology | 111 | 3.4% |
| Social Sciences | 249 | 7.5% |
| Engineering | 137 | 4.2% |
| Multidisciplinary Studies | 40 | 1.2% |
| Science & Technology | 467 | 14.2% |
| Business | 499 | 15.1% |
| Education | 539 | 16.3% |
| Literature & Languages | 55 | 1.7% |
| Liberal Arts & History | 134 | 4.1% |
| Visual & Performing Arts | 132 | 4.0% |
| Communications | 89 | 2.7% |
| Arts & Humanities | 253 | 7.7% |
| Total | 3,298 | 100.0% |
Transportation & Commute in Clay County
Vehicle Availability by Sex in Clay County
The most prevalent vehicle ownership categories in Clay County are males with 2 vehicles (1,241, accounting for 37.6%) and females with 2 vehicles (854, making up 39.5%).
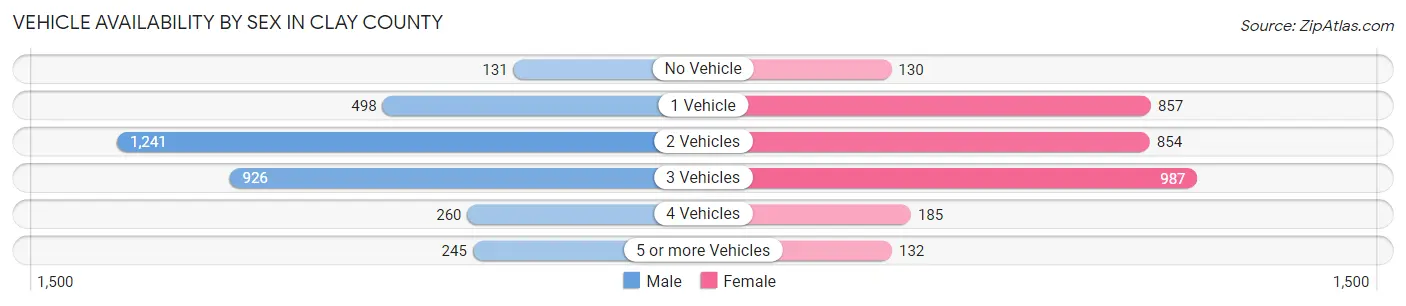
| Vehicles Available | Male | Female |
| No Vehicle | 131 (4.0%) | 130 (4.1%) |
| 1 Vehicle | 498 (15.1%) | 857 (27.3%) |
| 2 Vehicles | 1,241 (37.6%) | 854 (27.2%) |
| 3 Vehicles | 926 (28.1%) | 987 (31.4%) |
| 4 Vehicles | 260 (7.9%) | 185 (5.9%) |
| 5 or more Vehicles | 245 (7.4%) | 132 (4.2%) |
| Total | 3,301 (100.0%) | 3,145 (100.0%) |
Commute Time in Clay County
The most frequently occuring commute durations in Clay County are 5 to 9 minutes (2,309 commuters, 34.1%), 10 to 14 minutes (1,234 commuters, 18.2%), and less than 5 minutes (905 commuters, 13.4%).
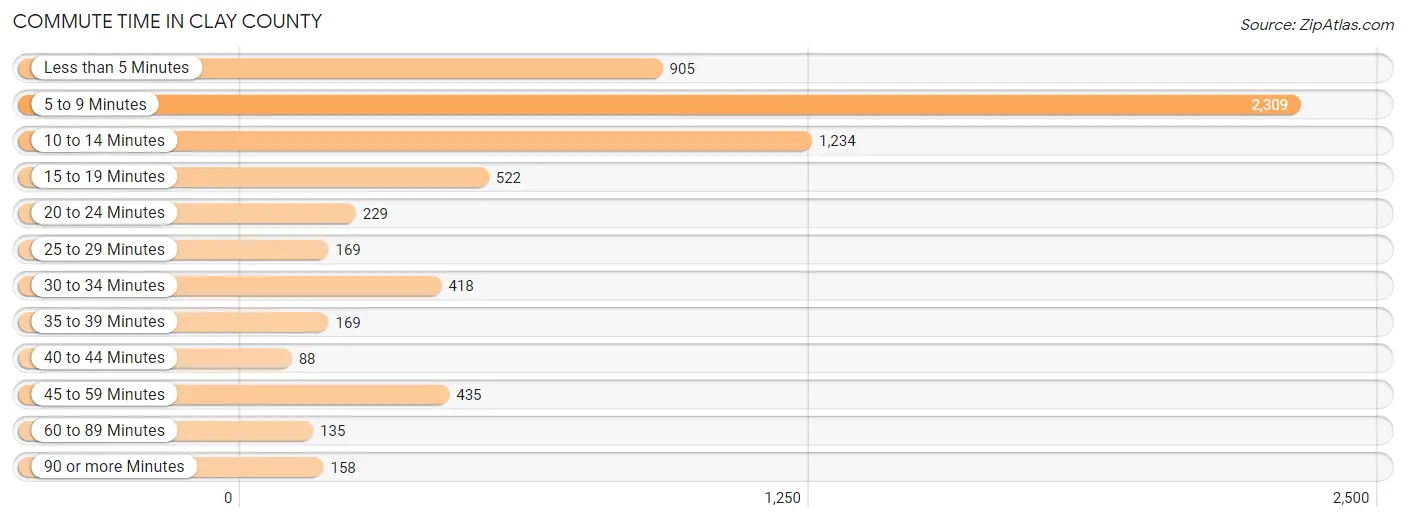
| Commute Time | # Commuters | % Commuters |
| Less than 5 Minutes | 905 | 13.4% |
| 5 to 9 Minutes | 2,309 | 34.1% |
| 10 to 14 Minutes | 1,234 | 18.2% |
| 15 to 19 Minutes | 522 | 7.7% |
| 20 to 24 Minutes | 229 | 3.4% |
| 25 to 29 Minutes | 169 | 2.5% |
| 30 to 34 Minutes | 418 | 6.2% |
| 35 to 39 Minutes | 169 | 2.5% |
| 40 to 44 Minutes | 88 | 1.3% |
| 45 to 59 Minutes | 435 | 6.4% |
| 60 to 89 Minutes | 135 | 2.0% |
| 90 or more Minutes | 158 | 2.3% |
Commute Time by Sex in Clay County
The most common commute times in Clay County are 5 to 9 minutes (1,150 commuters, 34.5%) for males and 5 to 9 minutes (1,159 commuters, 33.7%) for females.
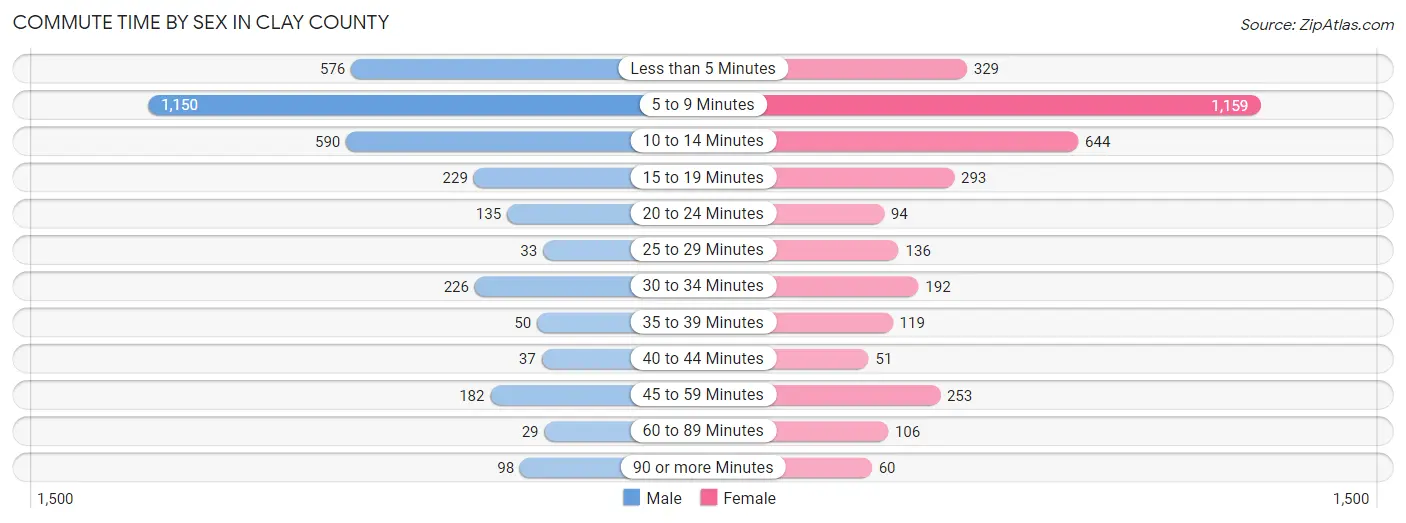
| Commute Time | Male | Female |
| Less than 5 Minutes | 576 (17.3%) | 329 (9.6%) |
| 5 to 9 Minutes | 1,150 (34.5%) | 1,159 (33.7%) |
| 10 to 14 Minutes | 590 (17.7%) | 644 (18.7%) |
| 15 to 19 Minutes | 229 (6.9%) | 293 (8.5%) |
| 20 to 24 Minutes | 135 (4.1%) | 94 (2.7%) |
| 25 to 29 Minutes | 33 (1.0%) | 136 (4.0%) |
| 30 to 34 Minutes | 226 (6.8%) | 192 (5.6%) |
| 35 to 39 Minutes | 50 (1.5%) | 119 (3.5%) |
| 40 to 44 Minutes | 37 (1.1%) | 51 (1.5%) |
| 45 to 59 Minutes | 182 (5.5%) | 253 (7.4%) |
| 60 to 89 Minutes | 29 (0.9%) | 106 (3.1%) |
| 90 or more Minutes | 98 (2.9%) | 60 (1.8%) |
Time of Departure to Work by Sex in Clay County
The most frequent times of departure to work in Clay County are 8:00 AM to 8:29 AM (518, 15.5%) for males and 7:30 AM to 7:59 AM (707, 20.6%) for females.
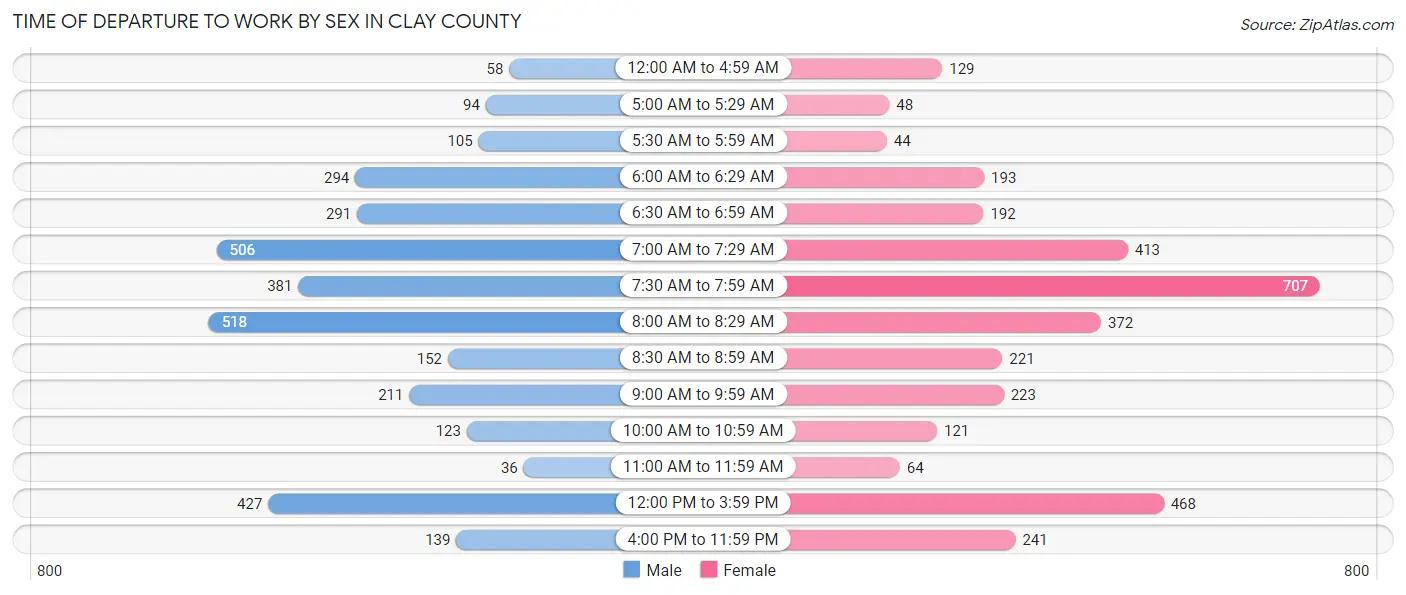
| Time of Departure | Male | Female |
| 12:00 AM to 4:59 AM | 58 (1.7%) | 129 (3.7%) |
| 5:00 AM to 5:29 AM | 94 (2.8%) | 48 (1.4%) |
| 5:30 AM to 5:59 AM | 105 (3.2%) | 44 (1.3%) |
| 6:00 AM to 6:29 AM | 294 (8.8%) | 193 (5.6%) |
| 6:30 AM to 6:59 AM | 291 (8.7%) | 192 (5.6%) |
| 7:00 AM to 7:29 AM | 506 (15.2%) | 413 (12.0%) |
| 7:30 AM to 7:59 AM | 381 (11.4%) | 707 (20.6%) |
| 8:00 AM to 8:29 AM | 518 (15.5%) | 372 (10.8%) |
| 8:30 AM to 8:59 AM | 152 (4.6%) | 221 (6.4%) |
| 9:00 AM to 9:59 AM | 211 (6.3%) | 223 (6.5%) |
| 10:00 AM to 10:59 AM | 123 (3.7%) | 121 (3.5%) |
| 11:00 AM to 11:59 AM | 36 (1.1%) | 64 (1.9%) |
| 12:00 PM to 3:59 PM | 427 (12.8%) | 468 (13.6%) |
| 4:00 PM to 11:59 PM | 139 (4.2%) | 241 (7.0%) |
| Total | 3,335 (100.0%) | 3,436 (100.0%) |
Housing Occupancy in Clay County
Occupancy by Ownership in Clay County
Of the total 5,416 dwellings in Clay County, owner-occupied units account for 2,767 (51.1%), while renter-occupied units make up 2,649 (48.9%).
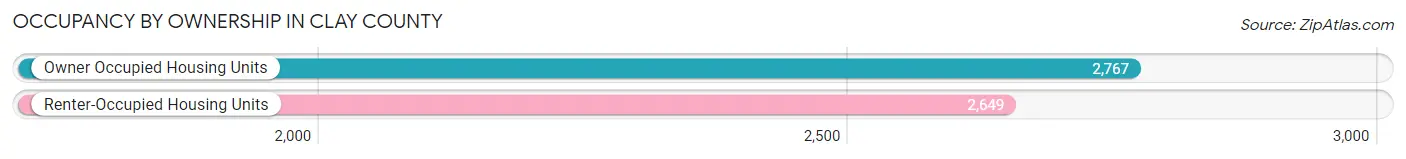
| Occupancy | # Housing Units | % Housing Units |
| Owner Occupied Housing Units | 2,767 | 51.1% |
| Renter-Occupied Housing Units | 2,649 | 48.9% |
| Total Occupied Housing Units | 5,416 | 100.0% |
Occupancy by Household Size in Clay County
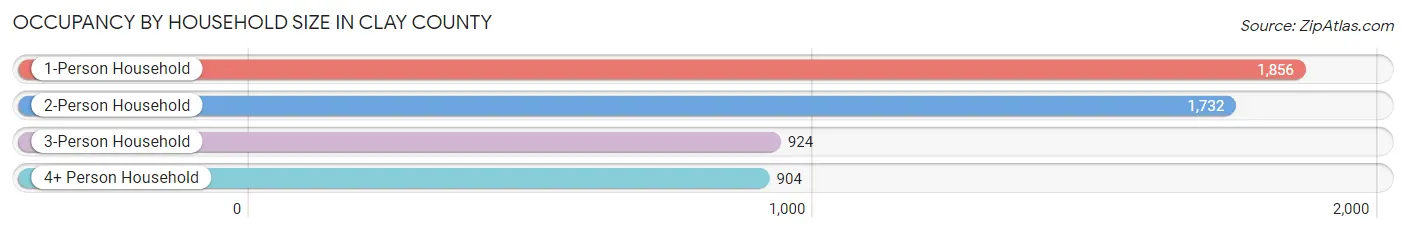
| Household Size | # Housing Units | % Housing Units |
| 1-Person Household | 1,856 | 34.3% |
| 2-Person Household | 1,732 | 32.0% |
| 3-Person Household | 924 | 17.1% |
| 4+ Person Household | 904 | 16.7% |
| Total Housing Units | 5,416 | 100.0% |
Occupancy by Ownership by Household Size in Clay County
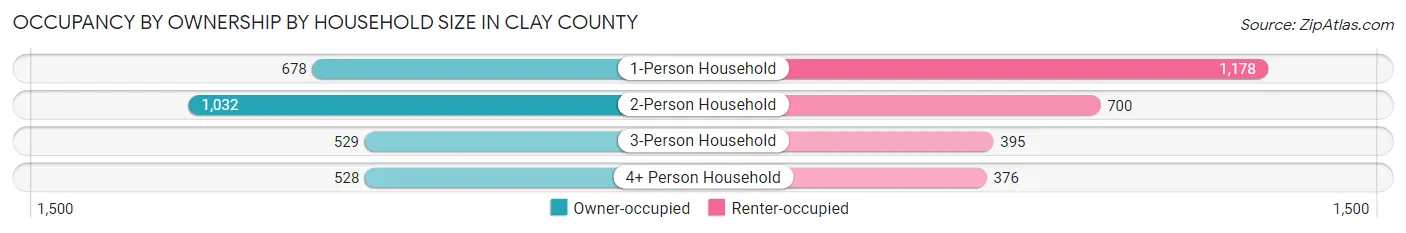
| Household Size | Owner-occupied | Renter-occupied |
| 1-Person Household | 678 (36.5%) | 1,178 (63.5%) |
| 2-Person Household | 1,032 (59.6%) | 700 (40.4%) |
| 3-Person Household | 529 (57.3%) | 395 (42.7%) |
| 4+ Person Household | 528 (58.4%) | 376 (41.6%) |
| Total Housing Units | 2,767 (51.1%) | 2,649 (48.9%) |
Occupancy by Educational Attainment in Clay County
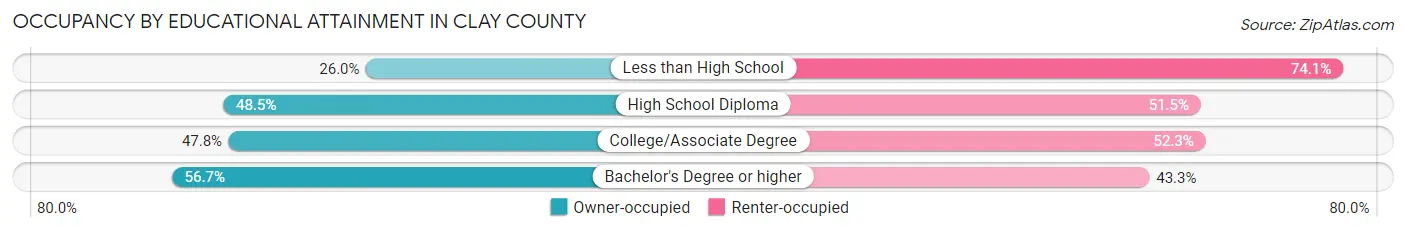
| Household Size | Owner-occupied | Renter-occupied |
| Less than High School | 48 (26.0%) | 137 (74.1%) |
| High School Diploma | 624 (48.5%) | 662 (51.5%) |
| College/Associate Degree | 754 (47.7%) | 825 (52.2%) |
| Bachelor's Degree or higher | 1,341 (56.7%) | 1,025 (43.3%) |
Occupancy by Age of Householder in Clay County
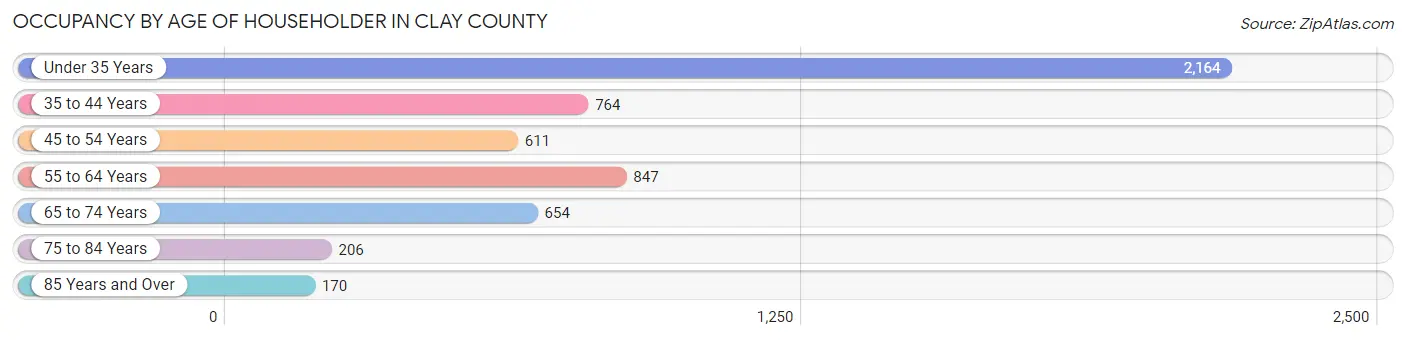
| Age Bracket | # Households | % Households |
| Under 35 Years | 2,164 | 40.0% |
| 35 to 44 Years | 764 | 14.1% |
| 45 to 54 Years | 611 | 11.3% |
| 55 to 64 Years | 847 | 15.6% |
| 65 to 74 Years | 654 | 12.1% |
| 75 to 84 Years | 206 | 3.8% |
| 85 Years and Over | 170 | 3.1% |
| Total | 5,416 | 100.0% |
Housing Finances in Clay County
Median Income by Occupancy in Clay County
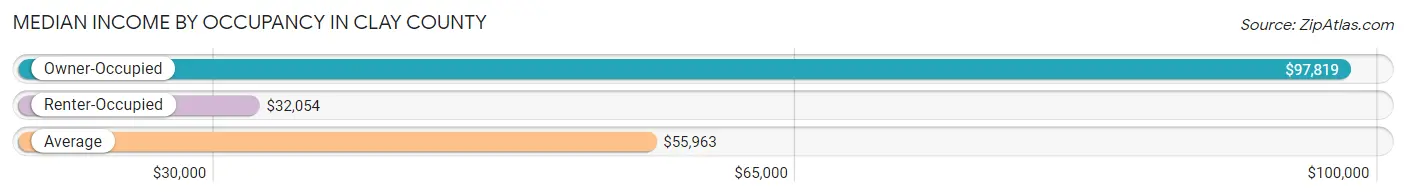
| Occupancy Type | # Households | Median Income |
| Owner-Occupied | 2,767 (51.1%) | $97,819 |
| Renter-Occupied | 2,649 (48.9%) | $32,054 |
| Average | 5,416 (100.0%) | $55,963 |
Occupancy by Householder Income Bracket in Clay County
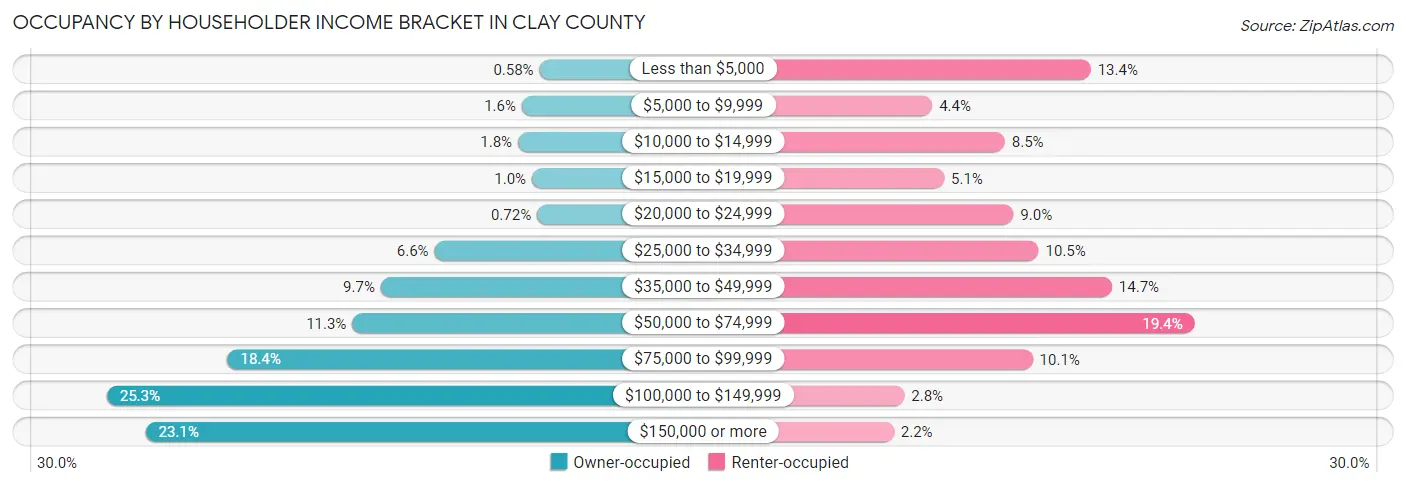
| Income Bracket | Owner-occupied | Renter-occupied |
| Less than $5,000 | 16 (0.6%) | 356 (13.4%) |
| $5,000 to $9,999 | 44 (1.6%) | 116 (4.4%) |
| $10,000 to $14,999 | 50 (1.8%) | 226 (8.5%) |
| $15,000 to $19,999 | 28 (1.0%) | 134 (5.1%) |
| $20,000 to $24,999 | 20 (0.7%) | 239 (9.0%) |
| $25,000 to $34,999 | 182 (6.6%) | 277 (10.5%) |
| $35,000 to $49,999 | 267 (9.7%) | 388 (14.6%) |
| $50,000 to $74,999 | 312 (11.3%) | 513 (19.4%) |
| $75,000 to $99,999 | 509 (18.4%) | 268 (10.1%) |
| $100,000 to $149,999 | 700 (25.3%) | 74 (2.8%) |
| $150,000 or more | 639 (23.1%) | 58 (2.2%) |
| Total | 2,767 (100.0%) | 2,649 (100.0%) |
Monthly Housing Cost Tiers in Clay County
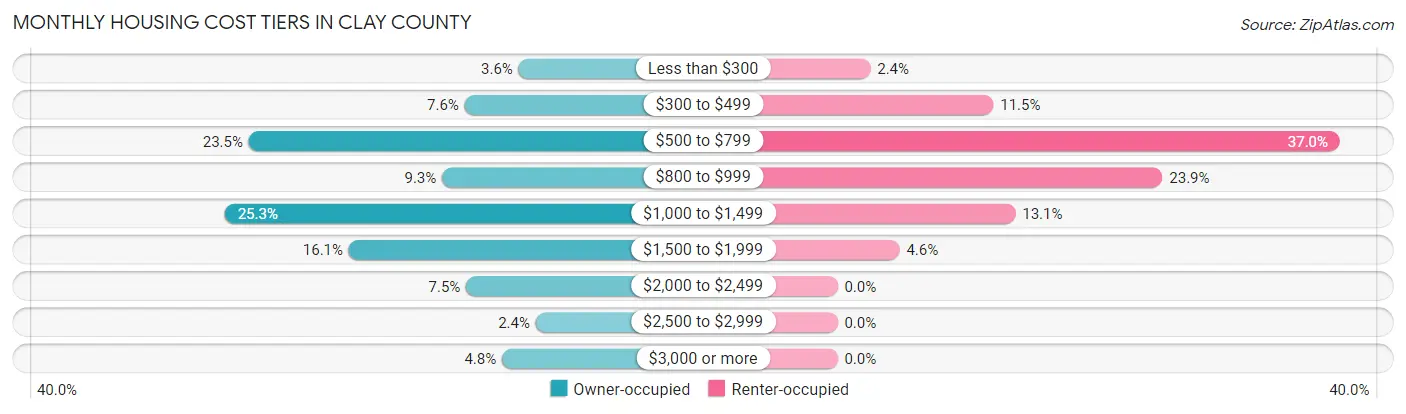
| Monthly Cost | Owner-occupied | Renter-occupied |
| Less than $300 | 100 (3.6%) | 64 (2.4%) |
| $300 to $499 | 210 (7.6%) | 304 (11.5%) |
| $500 to $799 | 650 (23.5%) | 980 (37.0%) |
| $800 to $999 | 256 (9.2%) | 634 (23.9%) |
| $1,000 to $1,499 | 699 (25.3%) | 347 (13.1%) |
| $1,500 to $1,999 | 446 (16.1%) | 121 (4.6%) |
| $2,000 to $2,499 | 207 (7.5%) | 0 (0.0%) |
| $2,500 to $2,999 | 65 (2.4%) | 0 (0.0%) |
| $3,000 or more | 134 (4.8%) | 0 (0.0%) |
| Total | 2,767 (100.0%) | 2,649 (100.0%) |
Physical Housing Characteristics in Clay County
Housing Structures in Clay County
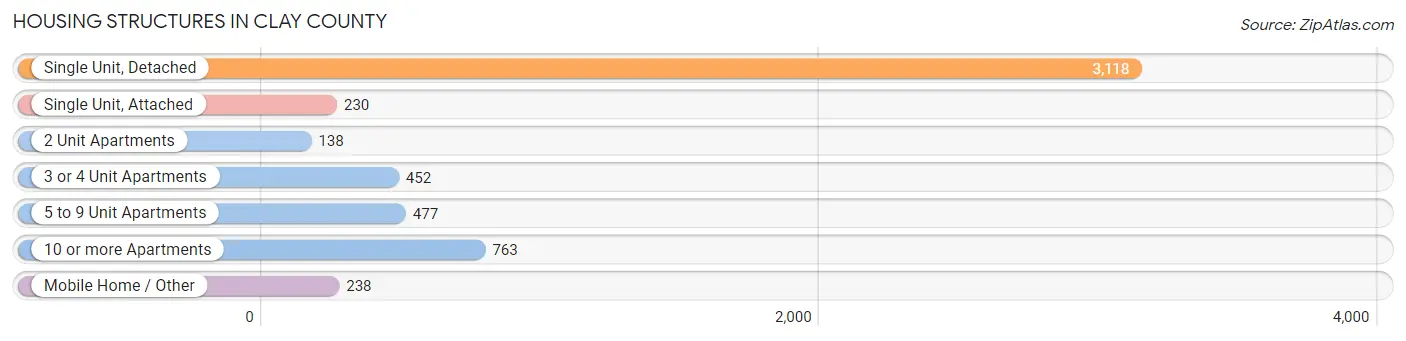
| Structure Type | # Housing Units | % Housing Units |
| Single Unit, Detached | 3,118 | 57.6% |
| Single Unit, Attached | 230 | 4.3% |
| 2 Unit Apartments | 138 | 2.5% |
| 3 or 4 Unit Apartments | 452 | 8.4% |
| 5 to 9 Unit Apartments | 477 | 8.8% |
| 10 or more Apartments | 763 | 14.1% |
| Mobile Home / Other | 238 | 4.4% |
| Total | 5,416 | 100.0% |
Housing Structures by Occupancy in Clay County
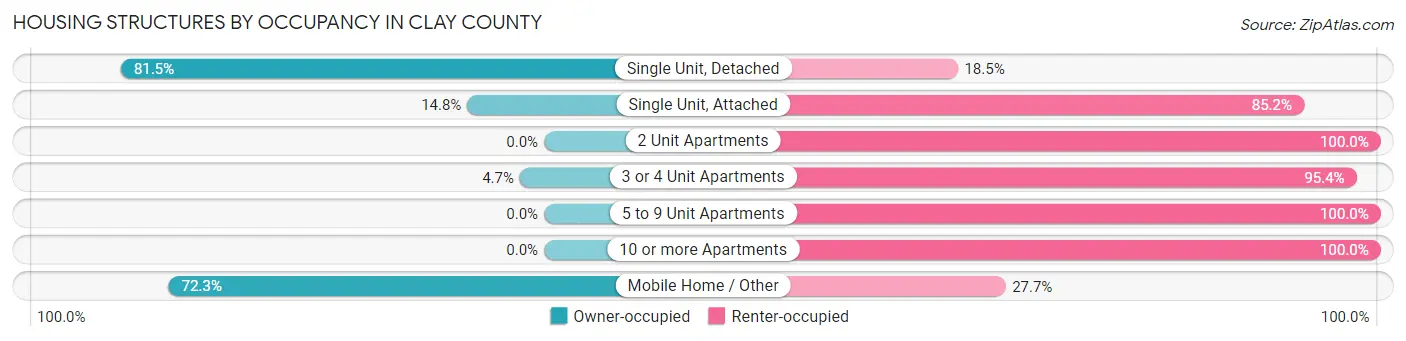
| Structure Type | Owner-occupied | Renter-occupied |
| Single Unit, Detached | 2,540 (81.5%) | 578 (18.5%) |
| Single Unit, Attached | 34 (14.8%) | 196 (85.2%) |
| 2 Unit Apartments | 0 (0.0%) | 138 (100.0%) |
| 3 or 4 Unit Apartments | 21 (4.6%) | 431 (95.4%) |
| 5 to 9 Unit Apartments | 0 (0.0%) | 477 (100.0%) |
| 10 or more Apartments | 0 (0.0%) | 763 (100.0%) |
| Mobile Home / Other | 172 (72.3%) | 66 (27.7%) |
| Total | 2,767 (51.1%) | 2,649 (48.9%) |
Housing Structures by Number of Rooms in Clay County
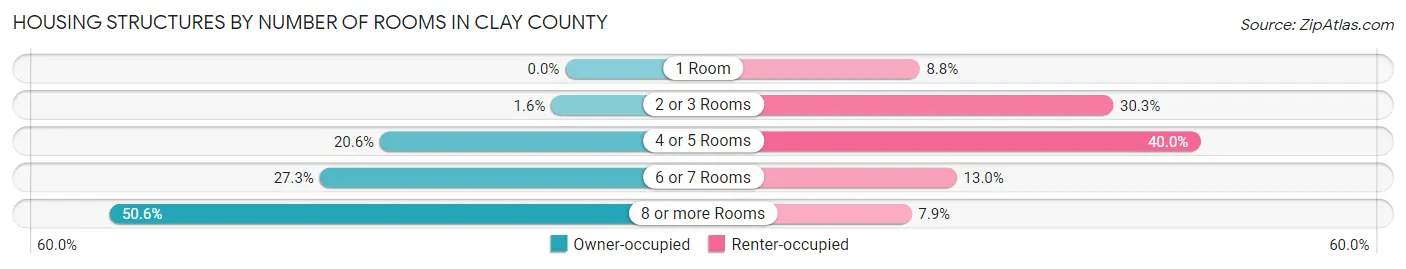
| Number of Rooms | Owner-occupied | Renter-occupied |
| 1 Room | 0 (0.0%) | 234 (8.8%) |
| 2 or 3 Rooms | 43 (1.5%) | 803 (30.3%) |
| 4 or 5 Rooms | 569 (20.6%) | 1,059 (40.0%) |
| 6 or 7 Rooms | 754 (27.3%) | 343 (13.0%) |
| 8 or more Rooms | 1,401 (50.6%) | 210 (7.9%) |
| Total | 2,767 (100.0%) | 2,649 (100.0%) |
Housing Structure by Heating Type in Clay County
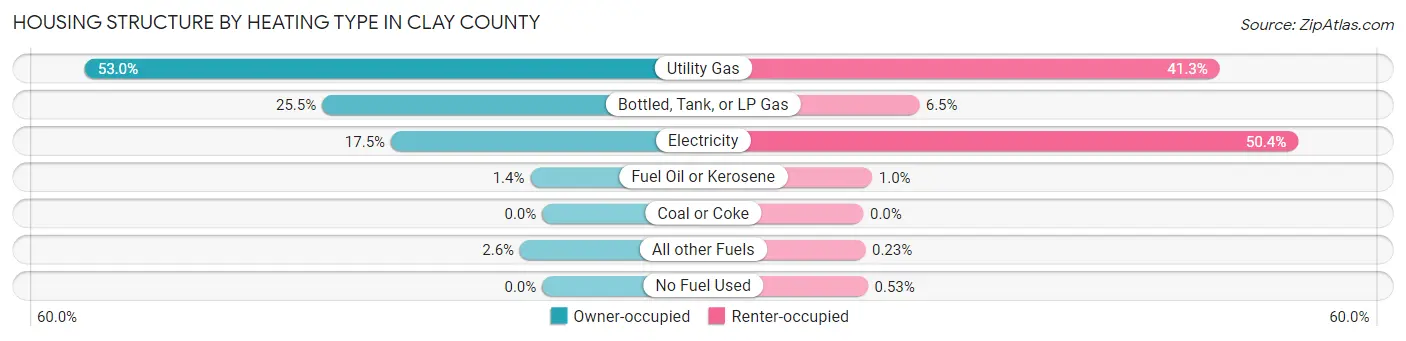
| Heating Type | Owner-occupied | Renter-occupied |
| Utility Gas | 1,467 (53.0%) | 1,095 (41.3%) |
| Bottled, Tank, or LP Gas | 706 (25.5%) | 171 (6.5%) |
| Electricity | 485 (17.5%) | 1,336 (50.4%) |
| Fuel Oil or Kerosene | 38 (1.4%) | 27 (1.0%) |
| Coal or Coke | 0 (0.0%) | 0 (0.0%) |
| All other Fuels | 71 (2.6%) | 6 (0.2%) |
| No Fuel Used | 0 (0.0%) | 14 (0.5%) |
| Total | 2,767 (100.0%) | 2,649 (100.0%) |
Household Vehicle Usage in Clay County
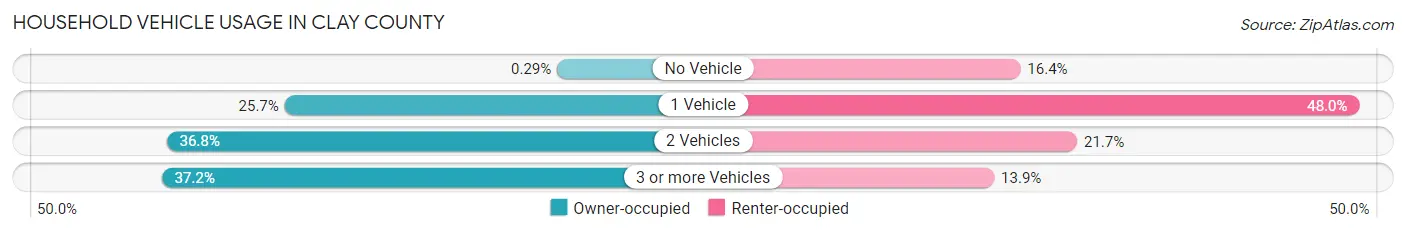
| Vehicles per Household | Owner-occupied | Renter-occupied |
| No Vehicle | 8 (0.3%) | 434 (16.4%) |
| 1 Vehicle | 712 (25.7%) | 1,272 (48.0%) |
| 2 Vehicles | 1,017 (36.7%) | 574 (21.7%) |
| 3 or more Vehicles | 1,030 (37.2%) | 369 (13.9%) |
| Total | 2,767 (100.0%) | 2,649 (100.0%) |
Real Estate & Mortgages in Clay County
Real Estate and Mortgage Overview in Clay County
| Characteristic | Without Mortgage | With Mortgage |
| Housing Units | 1,174 | 1,593 |
| Median Property Value | $165,900 | $234,500 |
| Median Household Income | $86,500 | $401 |
| Monthly Housing Costs | $647 | $134 |
| Real Estate Taxes | $2,734 | $26 |
Property Value by Mortgage Status in Clay County
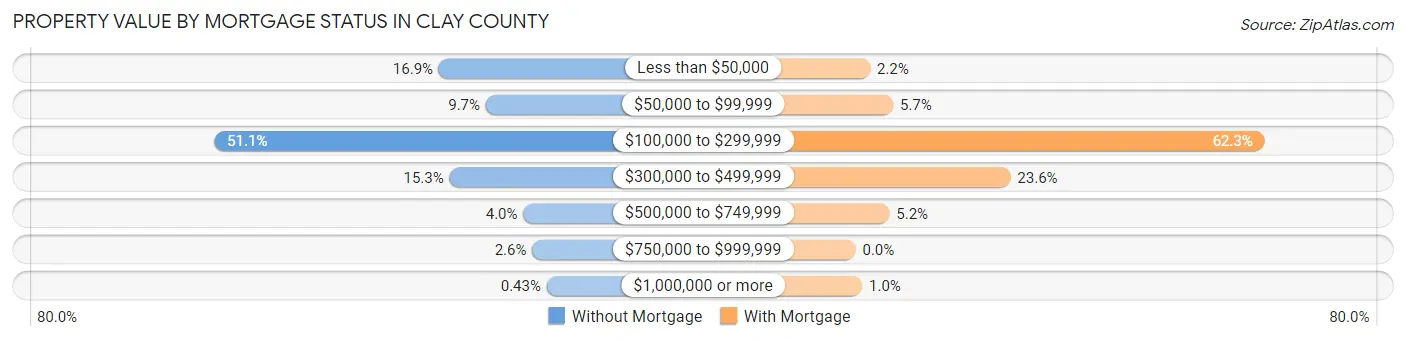
| Property Value | Without Mortgage | With Mortgage |
| Less than $50,000 | 198 (16.9%) | 35 (2.2%) |
| $50,000 to $99,999 | 114 (9.7%) | 91 (5.7%) |
| $100,000 to $299,999 | 600 (51.1%) | 993 (62.3%) |
| $300,000 to $499,999 | 179 (15.2%) | 376 (23.6%) |
| $500,000 to $749,999 | 47 (4.0%) | 82 (5.1%) |
| $750,000 to $999,999 | 31 (2.6%) | 0 (0.0%) |
| $1,000,000 or more | 5 (0.4%) | 16 (1.0%) |
| Total | 1,174 (100.0%) | 1,593 (100.0%) |
Household Income by Mortgage Status in Clay County
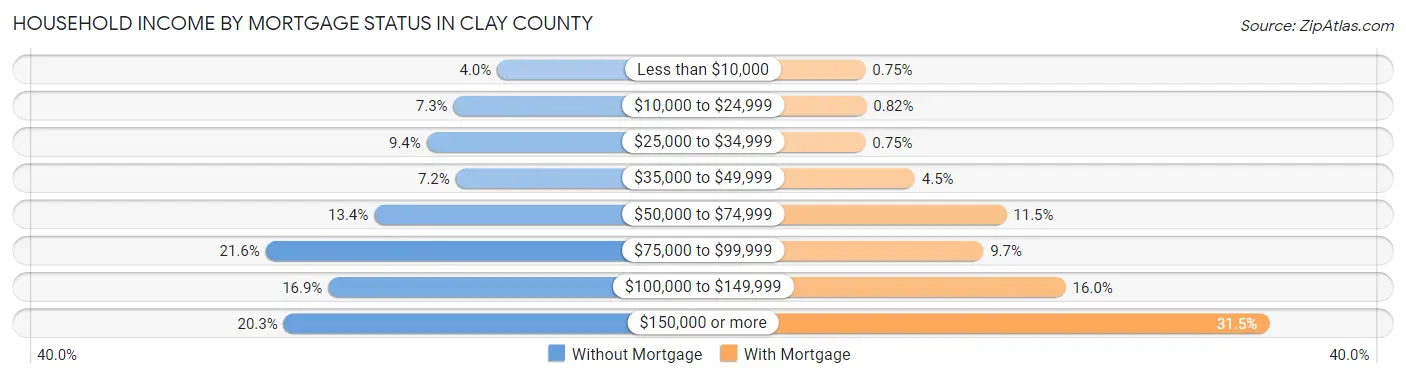
| Household Income | Without Mortgage | With Mortgage |
| Less than $10,000 | 47 (4.0%) | 12 (0.7%) |
| $10,000 to $24,999 | 86 (7.3%) | 13 (0.8%) |
| $25,000 to $34,999 | 110 (9.4%) | 12 (0.7%) |
| $35,000 to $49,999 | 84 (7.2%) | 72 (4.5%) |
| $50,000 to $74,999 | 157 (13.4%) | 183 (11.5%) |
| $75,000 to $99,999 | 254 (21.6%) | 155 (9.7%) |
| $100,000 to $149,999 | 198 (16.9%) | 255 (16.0%) |
| $150,000 or more | 238 (20.3%) | 502 (31.5%) |
| Total | 1,174 (100.0%) | 1,593 (100.0%) |
Property Value to Household Income Ratio in Clay County
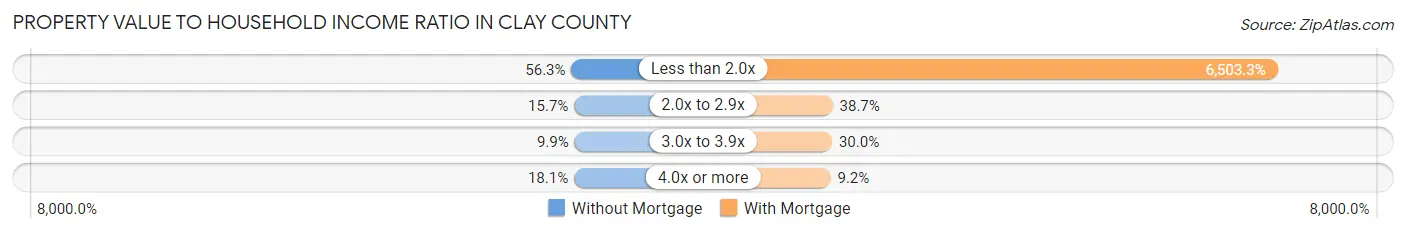
| Value-to-Income Ratio | Without Mortgage | With Mortgage |
| Less than 2.0x | 661 (56.3%) | 103,598 (6,503.3%) |
| 2.0x to 2.9x | 184 (15.7%) | 616 (38.7%) |
| 3.0x to 3.9x | 116 (9.9%) | 478 (30.0%) |
| 4.0x or more | 213 (18.1%) | 146 (9.2%) |
| Total | 1,174 (100.0%) | 1,593 (100.0%) |
Real Estate Taxes by Mortgage Status in Clay County
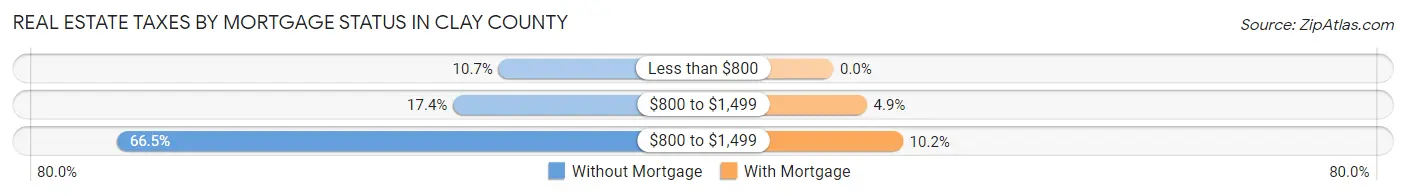
| Property Taxes | Without Mortgage | With Mortgage |
| Less than $800 | 126 (10.7%) | 0 (0.0%) |
| $800 to $1,499 | 204 (17.4%) | 78 (4.9%) |
| $800 to $1,499 | 781 (66.5%) | 162 (10.2%) |
| Total | 1,174 (100.0%) | 1,593 (100.0%) |
Health & Disability in Clay County
Health Insurance Coverage by Age in Clay County
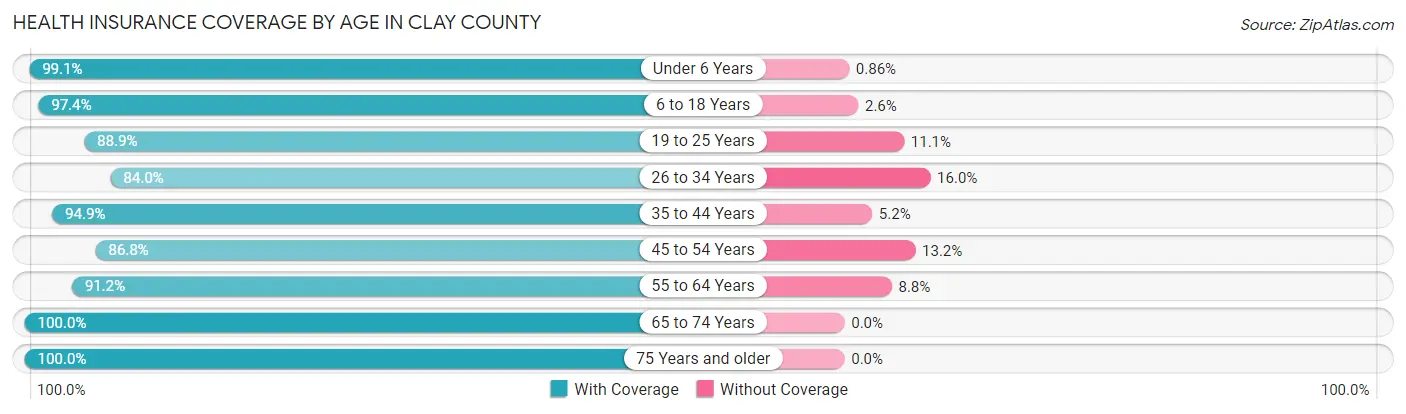
| Age Bracket | With Coverage | Without Coverage |
| Under 6 Years | 804 (99.1%) | 7 (0.9%) |
| 6 to 18 Years | 2,362 (97.4%) | 62 (2.6%) |
| 19 to 25 Years | 4,111 (88.9%) | 514 (11.1%) |
| 26 to 34 Years | 1,296 (84.0%) | 247 (16.0%) |
| 35 to 44 Years | 1,216 (94.9%) | 66 (5.1%) |
| 45 to 54 Years | 972 (86.8%) | 148 (13.2%) |
| 55 to 64 Years | 1,191 (91.2%) | 115 (8.8%) |
| 65 to 74 Years | 1,029 (100.0%) | 0 (0.0%) |
| 75 Years and older | 545 (100.0%) | 0 (0.0%) |
| Total | 13,526 (92.1%) | 1,159 (7.9%) |
Health Insurance Coverage by Citizenship Status in Clay County
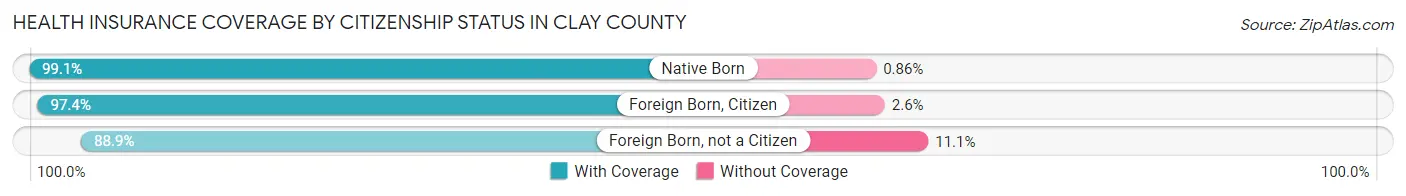
| Citizenship Status | With Coverage | Without Coverage |
| Native Born | 804 (99.1%) | 7 (0.9%) |
| Foreign Born, Citizen | 2,362 (97.4%) | 62 (2.6%) |
| Foreign Born, not a Citizen | 4,111 (88.9%) | 514 (11.1%) |
Health Insurance Coverage by Household Income in Clay County
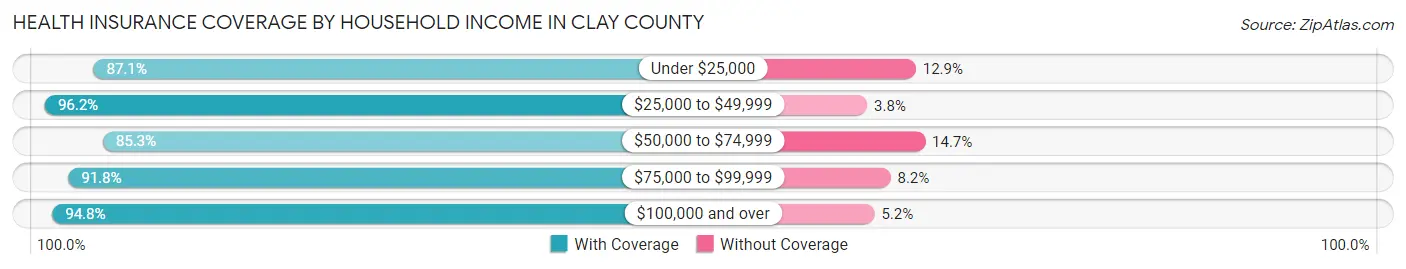
| Household Income | With Coverage | Without Coverage |
| Under $25,000 | 1,845 (87.1%) | 274 (12.9%) |
| $25,000 to $49,999 | 2,167 (96.2%) | 86 (3.8%) |
| $50,000 to $74,999 | 1,948 (85.3%) | 335 (14.7%) |
| $75,000 to $99,999 | 1,668 (91.8%) | 149 (8.2%) |
| $100,000 and over | 3,906 (94.8%) | 214 (5.2%) |
Public vs Private Health Insurance Coverage by Age in Clay County
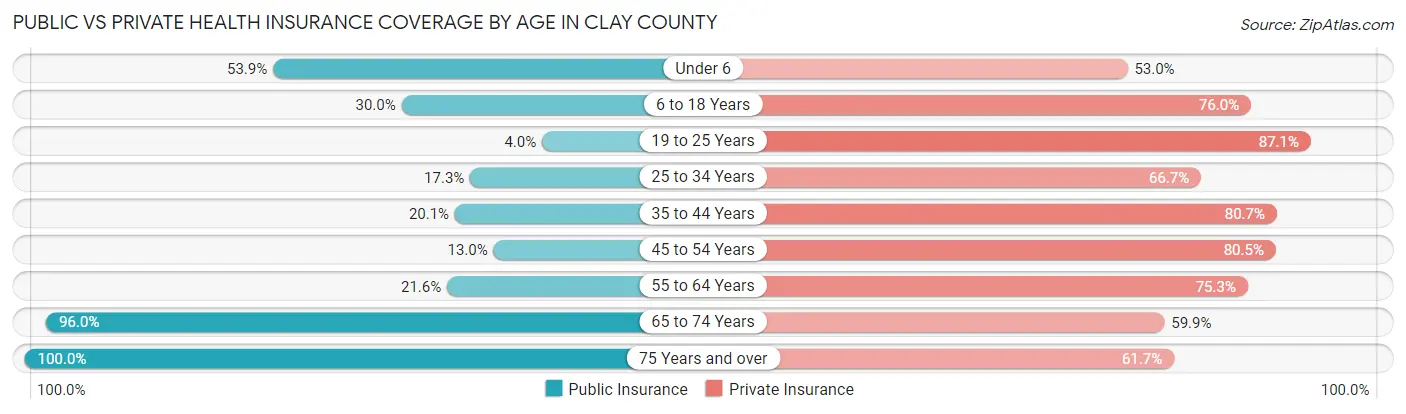
| Age Bracket | Public Insurance | Private Insurance |
| Under 6 | 437 (53.9%) | 430 (53.0%) |
| 6 to 18 Years | 728 (30.0%) | 1,841 (75.9%) |
| 19 to 25 Years | 183 (4.0%) | 4,026 (87.1%) |
| 25 to 34 Years | 267 (17.3%) | 1,029 (66.7%) |
| 35 to 44 Years | 258 (20.1%) | 1,035 (80.7%) |
| 45 to 54 Years | 145 (13.0%) | 902 (80.5%) |
| 55 to 64 Years | 282 (21.6%) | 984 (75.3%) |
| 65 to 74 Years | 988 (96.0%) | 616 (59.9%) |
| 75 Years and over | 545 (100.0%) | 336 (61.7%) |
| Total | 3,833 (26.1%) | 11,199 (76.3%) |
Disability Status by Sex by Age in Clay County
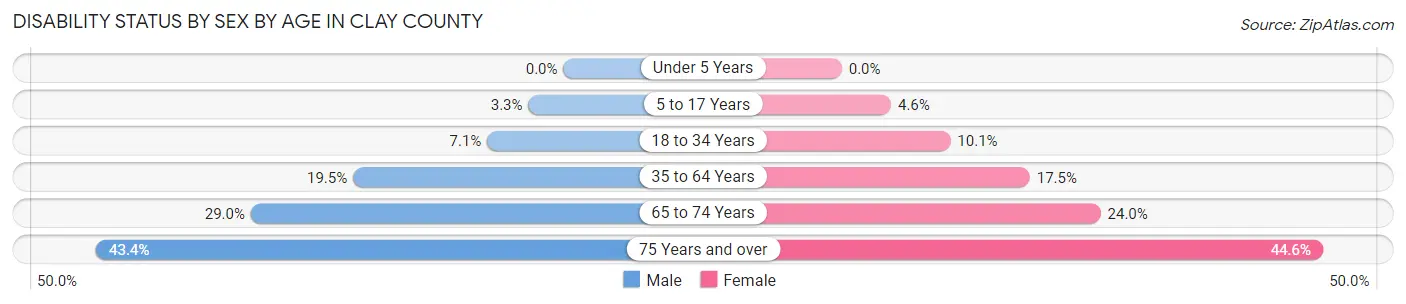
| Age Bracket | Male | Female |
| Under 5 Years | 0 (0.0%) | 0 (0.0%) |
| 5 to 17 Years | 31 (3.3%) | 43 (4.6%) |
| 18 to 34 Years | 228 (7.1%) | 363 (10.1%) |
| 35 to 64 Years | 387 (19.5%) | 301 (17.4%) |
| 65 to 74 Years | 150 (29.0%) | 123 (24.0%) |
| 75 Years and over | 111 (43.4%) | 129 (44.6%) |
Disability Class by Sex by Age in Clay County
Disability Class: Hearing Difficulty
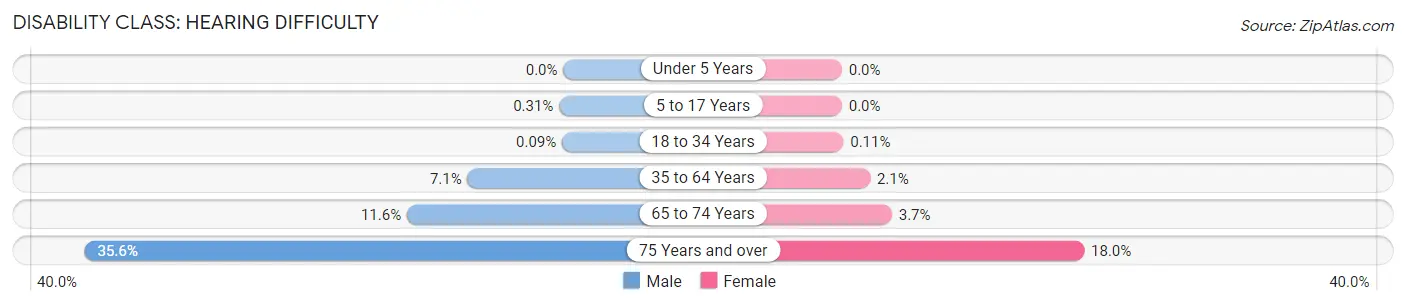
| Age Bracket | Male | Female |
| Under 5 Years | 0 (0.0%) | 0 (0.0%) |
| 5 to 17 Years | 3 (0.3%) | 0 (0.0%) |
| 18 to 34 Years | 3 (0.1%) | 4 (0.1%) |
| 35 to 64 Years | 141 (7.1%) | 36 (2.1%) |
| 65 to 74 Years | 60 (11.6%) | 19 (3.7%) |
| 75 Years and over | 91 (35.5%) | 52 (18.0%) |
Disability Class: Vision Difficulty
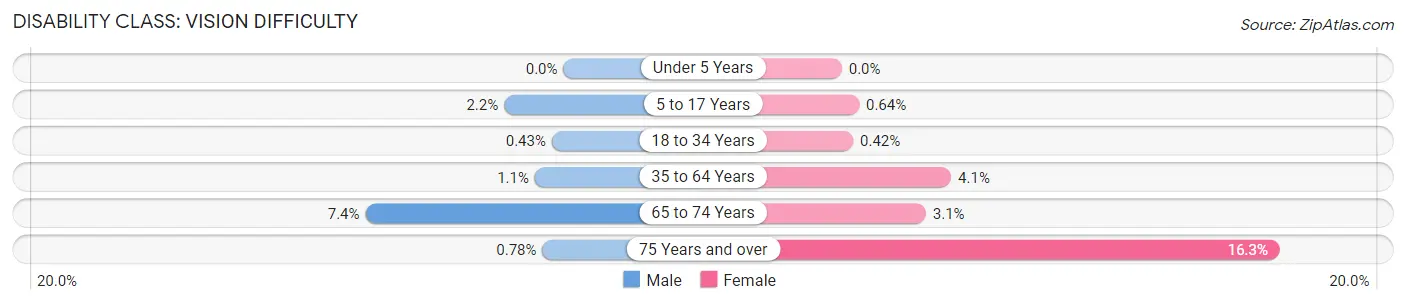
| Age Bracket | Male | Female |
| Under 5 Years | 0 (0.0%) | 0 (0.0%) |
| 5 to 17 Years | 21 (2.2%) | 6 (0.6%) |
| 18 to 34 Years | 14 (0.4%) | 15 (0.4%) |
| 35 to 64 Years | 21 (1.1%) | 70 (4.1%) |
| 65 to 74 Years | 38 (7.3%) | 16 (3.1%) |
| 75 Years and over | 2 (0.8%) | 47 (16.3%) |
Disability Class: Cognitive Difficulty
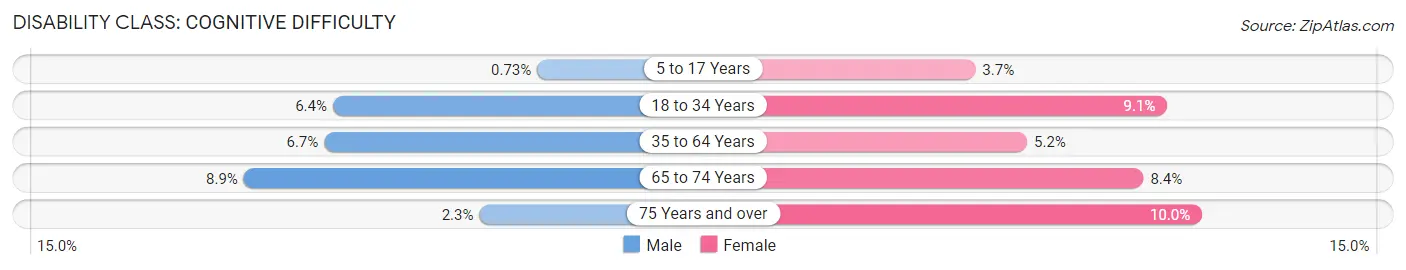
| Age Bracket | Male | Female |
| 5 to 17 Years | 7 (0.7%) | 35 (3.7%) |
| 18 to 34 Years | 207 (6.4%) | 326 (9.1%) |
| 35 to 64 Years | 132 (6.7%) | 89 (5.2%) |
| 65 to 74 Years | 46 (8.9%) | 43 (8.4%) |
| 75 Years and over | 6 (2.3%) | 29 (10.0%) |
Disability Class: Ambulatory Difficulty
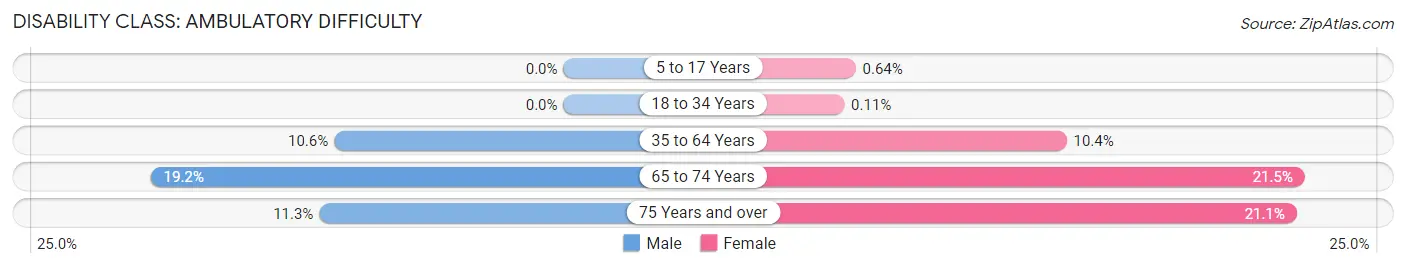
| Age Bracket | Male | Female |
| 5 to 17 Years | 0 (0.0%) | 6 (0.6%) |
| 18 to 34 Years | 0 (0.0%) | 4 (0.1%) |
| 35 to 64 Years | 211 (10.6%) | 180 (10.4%) |
| 65 to 74 Years | 99 (19.2%) | 110 (21.5%) |
| 75 Years and over | 29 (11.3%) | 61 (21.1%) |
Disability Class: Self-Care Difficulty
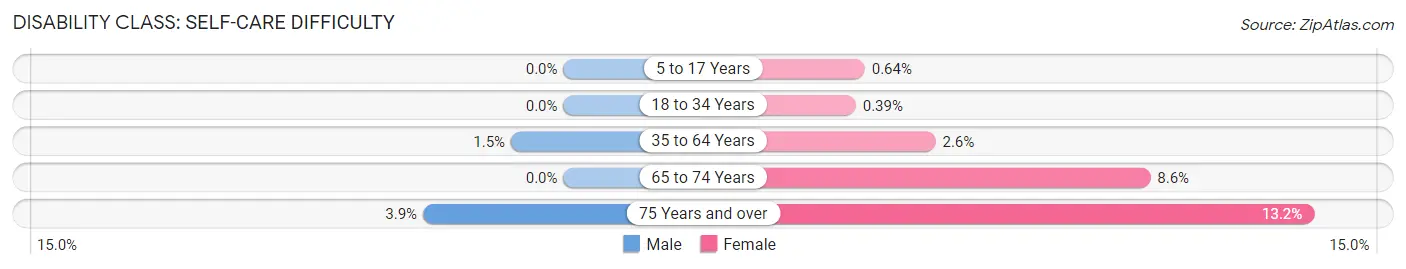
| Age Bracket | Male | Female |
| 5 to 17 Years | 0 (0.0%) | 6 (0.6%) |
| 18 to 34 Years | 0 (0.0%) | 14 (0.4%) |
| 35 to 64 Years | 29 (1.5%) | 45 (2.6%) |
| 65 to 74 Years | 0 (0.0%) | 44 (8.6%) |
| 75 Years and over | 10 (3.9%) | 38 (13.2%) |
Technology Access in Clay County
Computing Device Access in Clay County
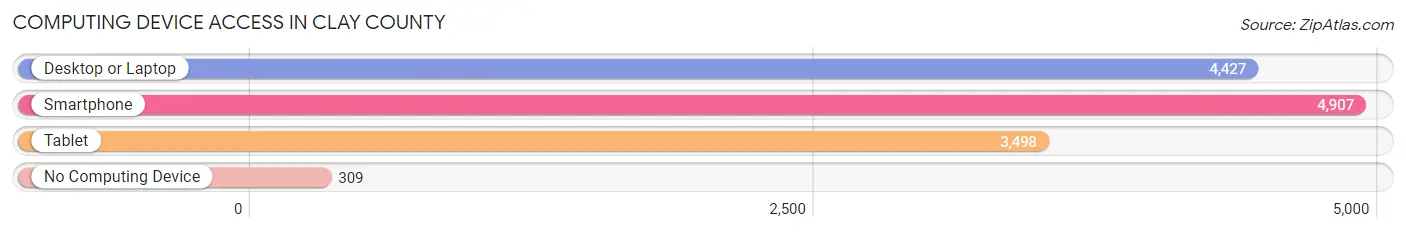
| Device Type | # Households | % Households |
| Desktop or Laptop | 4,427 | 81.7% |
| Smartphone | 4,907 | 90.6% |
| Tablet | 3,498 | 64.6% |
| No Computing Device | 309 | 5.7% |
| Total | 5,416 | 100.0% |
Internet Access in Clay County
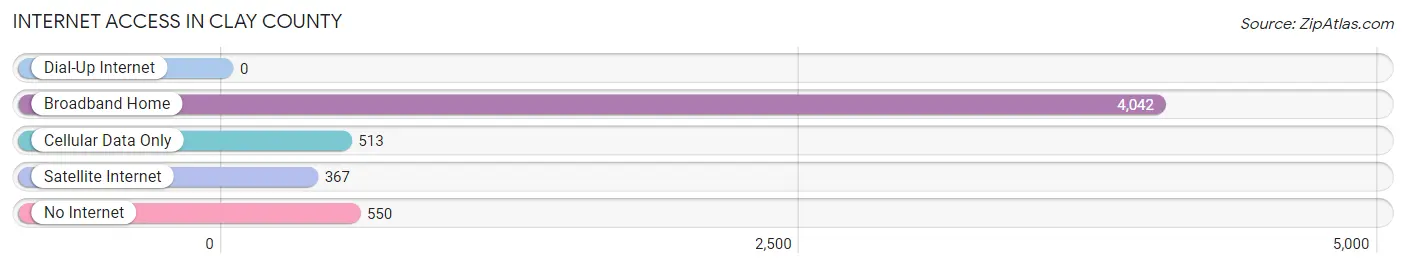
| Internet Type | # Households | % Households |
| Dial-Up Internet | 0 | 0.0% |
| Broadband Home | 4,042 | 74.6% |
| Cellular Data Only | 513 | 9.5% |
| Satellite Internet | 367 | 6.8% |
| No Internet | 550 | 10.2% |
| Total | 5,416 | 100.0% |
Clay County Summary
Clay County, South Dakota is located in the southeastern corner of the state and is bordered by the states of Minnesota and Iowa. It is the fifth-largest county in South Dakota, with an area of 1,068 square miles. As of the 2010 census, the population was 13,945, making it the fourth-most populous county in the state.
The county was established in 1873 and named after Henry Clay, a prominent statesman from Kentucky. The county seat is Vermillion, which is also the home of the University of South Dakota.
Geography
Clay County is located in the southeastern corner of South Dakota, and is bordered by the states of Minnesota and Iowa. It is the fifth-largest county in the state, with an area of 1,068 square miles. The county is mostly rural, with the majority of the population living in small towns and villages. The terrain is mostly flat, with rolling hills in the western part of the county. The Vermillion River runs through the county, and there are several small lakes and ponds scattered throughout the area.
The climate of Clay County is typical of the Great Plains, with hot summers and cold winters. The average annual temperature is 48°F, and the average annual precipitation is 22 inches.
Economy
The economy of Clay County is largely based on agriculture. The county is home to several large farms, and the majority of the population is employed in the agricultural sector. The county is also home to several small businesses, including retail stores, restaurants, and service providers.
The University of South Dakota is located in Vermillion, and is a major employer in the county. The university provides jobs for faculty, staff, and students, and also contributes to the local economy through its research and development activities.
Demographics
As of the 2010 census, the population of Clay County was 13,945. The racial makeup of the county was 94.3% White, 2.2% Native American, 0.7% Asian, 0.5% Black or African American, 0.1% Pacific Islander, and 1.2% from two or more races. Hispanic or Latino of any race were 2.2% of the population.
The median income for a household in the county was $45,945, and the median income for a family was $54,945. The per capita income for the county was $21,945. About 8.3% of families and 11.2% of the population were below the poverty line, including 14.2% of those under age 18 and 8.2% of those age 65 or over.
Conclusion
Clay County, South Dakota is a rural county located in the southeastern corner of the state. It is the fifth-largest county in South Dakota, with an area of 1,068 square miles. The county is mostly rural, with the majority of the population living in small towns and villages. The economy of Clay County is largely based on agriculture, and the University of South Dakota is a major employer in the county. As of the 2010 census, the population of Clay County was 13,945. The median income for a household in the county was $45,945, and the median income for a family was $54,945.
Common Questions
What is the Total Population of Clay County?
Total Population of Clay County is 14,953.
What is the Total Male Population of Clay County?
Total Male Population of Clay County is 7,362.
What is the Total Female Population of Clay County?
Total Female Population of Clay County is 7,591.
What is the Ratio of Males per 100 Females in Clay County?
There are 96.98 Males per 100 Females in Clay County.
What is the Ratio of Females per 100 Males in Clay County?
There are 103.11 Females per 100 Males in Clay County.
What is the Median Population Age in Clay County?
Median Population Age in Clay County is 24.6 Years.
What is the Average Family Size in Clay County
Average Family Size in Clay County is 2.9 People.
What is the Average Household Size in Clay County
Average Household Size in Clay County is 2.3 People.
What is Per Capita Income in Clay County?
Per Capita income in Clay County is $30,033.
What is the Median Family Income in Clay County?
Median Family Income in Clay County is $89,497.
What is the Median Household income in Clay County?
Median Household Income in Clay County is $55,963.
What is Income or Wage Gap in Clay County?
Income or Wage Gap in Clay County is 40.3%.
Women in Clay County earn 59.7 cents for every dollar earned by a man.
What is Family Income Deficit in Clay County?
Family Income Deficit in Clay County is $14,672.
Families that are below poverty line in Clay County earn $14,672 less on average than the poverty threshold level.
What is Inequality or Gini Index in Clay County?
Inequality or Gini Index in Clay County is 0.48.
How Large is the Labor Force in Clay County?
There are 8,540 People in the Labor Forcein in Clay County.
What is the Percentage of People in the Labor Force in Clay County?
67.6% of People are in the Labor Force in Clay County.
What is the Unemployment Rate in Clay County?
Unemployment Rate in Clay County is 8.2%.