Clark County, SD
Clark County Map

Clark County Overview
3,837
TOTAL POPULATION
1,957
MALE POPULATION
1,880
FEMALE POPULATION
104.10
MALES / 100 FEMALES
96.07
FEMALES / 100 MALES
41.2
MEDIAN AGE
3.5
AVG FAMILY SIZE
2.7
AVG HOUSEHOLD SIZE
$35,573
PER CAPITA INCOME
$75,000
AVG FAMILY INCOME
$59,340
AVG HOUSEHOLD INCOME
35.0%
WAGE / INCOME GAP [ % ]
65.0¢/ $1
WAGE / INCOME GAP [ $ ]
0.50
INEQUALITY / GINI INDEX
1,663
LABOR FORCE [ PEOPLE ]
59.0%
PERCENT IN LABOR FORCE
5.3%
UNEMPLOYMENT RATE
Clark County Area Codes
Race in Clark County
The most populous races in Clark County are White / Caucasian (3,559 | 92.7%), Two or more Races (174 | 4.5%), and Hispanic or Latino (157 | 4.1%).

| Race | # Population | % Population |
| Asian | 18 | 0.5% |
| Black / African American | 21 | 0.5% |
| Hawaiian / Pacific | 0 | 0.0% |
| Hispanic or Latino | 157 | 4.1% |
| Native / Alaskan | 3 | 0.1% |
| White / Caucasian | 3,559 | 92.7% |
| Two or more Races | 174 | 4.5% |
| Some other Race | 62 | 1.6% |
| Total | 3,837 | 100.0% |
Ancestry in Clark County
The most populous ancestries reported in Clark County are German (1,533 | 40.0%), Norwegian (822 | 21.4%), English (365 | 9.5%), Irish (346 | 9.0%), and Swedish (174 | 4.5%), together accounting for 84.4% of all Clark County residents.

| Ancestry | # Population | % Population |
| American | 83 | 2.2% |
| Arab | 22 | 0.6% |
| Belgian | 32 | 0.8% |
| British | 2 | 0.1% |
| Burmese | 8 | 0.2% |
| Canadian | 2 | 0.1% |
| Czech | 14 | 0.4% |
| Danish | 56 | 1.5% |
| Dutch | 166 | 4.3% |
| Egyptian | 21 | 0.5% |
| English | 365 | 9.5% |
| European | 30 | 0.8% |
| Finnish | 161 | 4.2% |
| French | 84 | 2.2% |
| French Canadian | 5 | 0.1% |
| German | 1,533 | 40.0% |
| Hungarian | 2 | 0.1% |
| Irish | 346 | 9.0% |
| Italian | 7 | 0.2% |
| Korean | 6 | 0.2% |
| Lithuanian | 9 | 0.2% |
| Mexican | 119 | 3.1% |
| New Zealander | 6 | 0.2% |
| Norwegian | 822 | 21.4% |
| Polish | 39 | 1.0% |
| Portuguese | 3 | 0.1% |
| Puerto Rican | 19 | 0.5% |
| Russian | 11 | 0.3% |
| Scandinavian | 30 | 0.8% |
| Scotch-Irish | 12 | 0.3% |
| Scottish | 25 | 0.6% |
| Sioux | 65 | 1.7% |
| South African | 10 | 0.3% |
| Spaniard | 2 | 0.1% |
| Spanish | 1 | 0.0% |
| Sri Lankan | 4 | 0.1% |
| Subsaharan African | 11 | 0.3% |
| Swedish | 174 | 4.5% |
| Swiss | 17 | 0.4% |
| Ugandan | 1 | 0.0% |
| Ukrainian | 51 | 1.3% |
| Yugoslavian | 33 | 0.9% | View All 42 Rows |
Immigrants in Clark County
The most numerous immigrant groups reported in Clark County came from Central America (53 | 1.4%), Latin America (53 | 1.4%), Mexico (53 | 1.4%), Asia (14 | 0.4%), and Eastern Asia (8 | 0.2%), together accounting for 4.7% of all Clark County residents.

| Immigration Origin | # Population | % Population |
| Africa | 3 | 0.1% |
| Asia | 14 | 0.4% |
| Canada | 2 | 0.1% |
| Central America | 53 | 1.4% |
| Eastern Africa | 1 | 0.0% |
| Eastern Asia | 8 | 0.2% |
| Eastern Europe | 2 | 0.1% |
| Europe | 5 | 0.1% |
| Korea | 8 | 0.2% |
| Latin America | 53 | 1.4% |
| Mexico | 53 | 1.4% |
| Philippines | 6 | 0.2% |
| Russia | 2 | 0.1% |
| South Africa | 2 | 0.1% |
| South Eastern Asia | 6 | 0.2% |
| Switzerland | 3 | 0.1% |
| Uganda | 1 | 0.0% |
| Western Europe | 3 | 0.1% | View All 18 Rows |
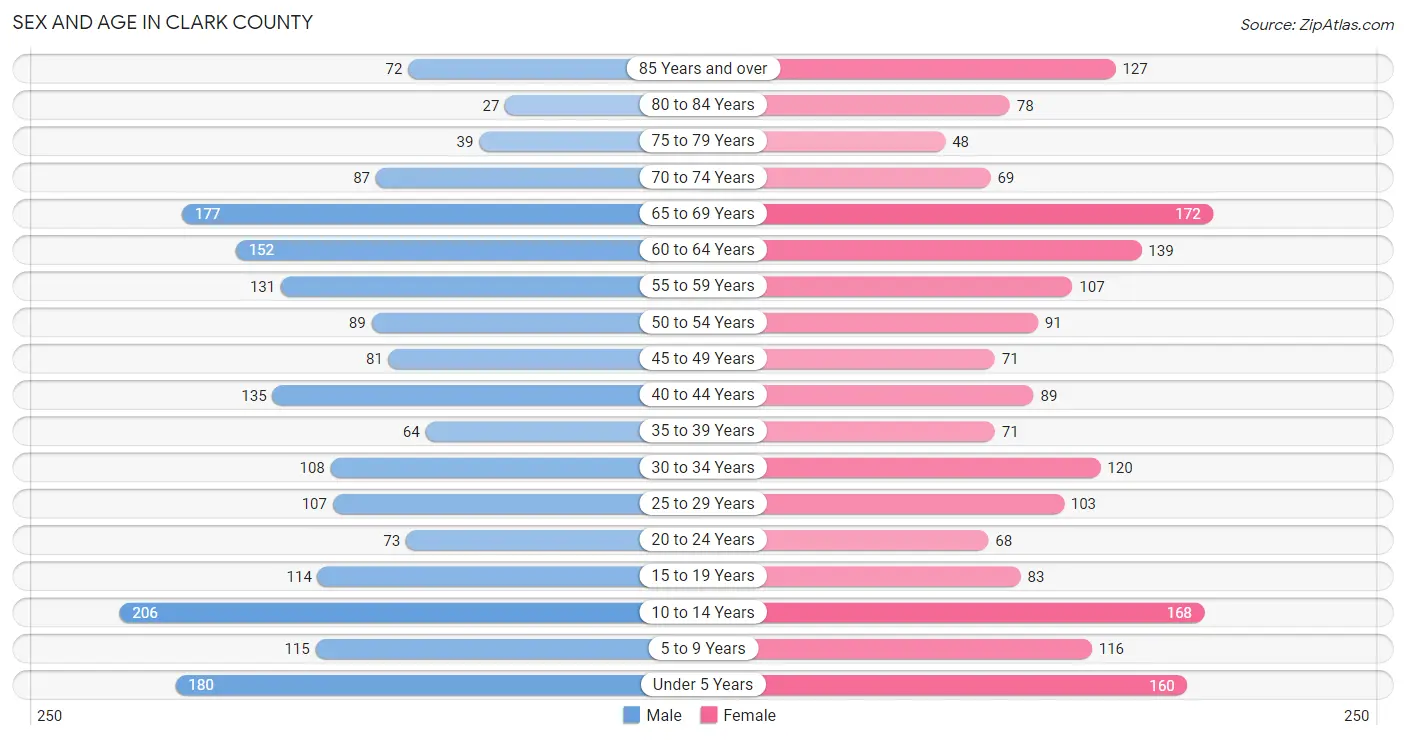
Sex and Age in Clark County
Sex and Age in Clark County
The most populous age groups in Clark County are 10 to 14 Years (206 | 10.5%) for men and 65 to 69 Years (172 | 9.1%) for women.
| Age Bracket | Male | Female |
| Under 5 Years | 180 (9.2%) | 160 (8.5%) |
| 5 to 9 Years | 115 (5.9%) | 116 (6.2%) |
| 10 to 14 Years | 206 (10.5%) | 168 (8.9%) |
| 15 to 19 Years | 114 (5.8%) | 83 (4.4%) |
| 20 to 24 Years | 73 (3.7%) | 68 (3.6%) |
| 25 to 29 Years | 107 (5.5%) | 103 (5.5%) |
| 30 to 34 Years | 108 (5.5%) | 120 (6.4%) |
| 35 to 39 Years | 64 (3.3%) | 71 (3.8%) |
| 40 to 44 Years | 135 (6.9%) | 89 (4.7%) |
| 45 to 49 Years | 81 (4.1%) | 71 (3.8%) |
| 50 to 54 Years | 89 (4.5%) | 91 (4.8%) |
| 55 to 59 Years | 131 (6.7%) | 107 (5.7%) |
| 60 to 64 Years | 152 (7.8%) | 139 (7.4%) |
| 65 to 69 Years | 177 (9.0%) | 172 (9.1%) |
| 70 to 74 Years | 87 (4.4%) | 69 (3.7%) |
| 75 to 79 Years | 39 (2.0%) | 48 (2.5%) |
| 80 to 84 Years | 27 (1.4%) | 78 (4.2%) |
| 85 Years and over | 72 (3.7%) | 127 (6.8%) |
| Total | 1,957 (100.0%) | 1,880 (100.0%) |
Families and Households in Clark County
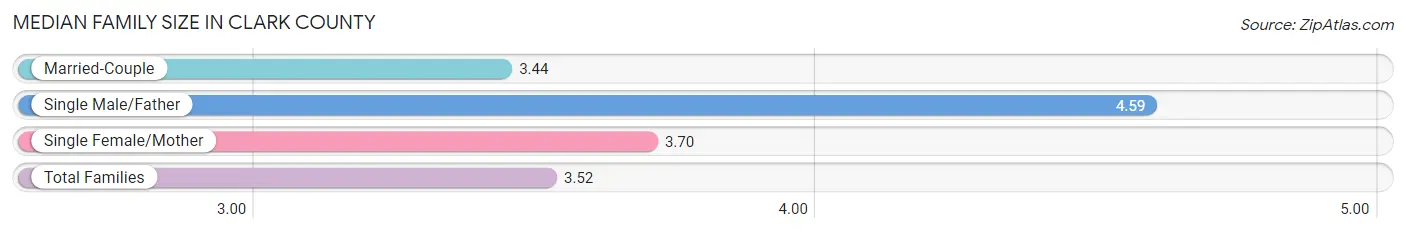
Median Family Size in Clark County
The median family size in Clark County is 3.52 persons per family, with single male/father families (46 | 5.3%) accounting for the largest median family size of 4.59 persons per family. On the other hand, married-couple families (749 | 86.9%) represent the smallest median family size with 3.44 persons per family.
| Family Type | # Families | Family Size |
| Married-Couple | 749 (86.9%) | 3.44 |
| Single Male/Father | 46 (5.3%) | 4.59 |
| Single Female/Mother | 67 (7.8%) | 3.70 |
| Total Families | 862 (100.0%) | 3.52 |
Median Household Size in Clark County
The median household size in Clark County is 2.73 persons per household, with single male/father households (46 | 3.4%) accounting for the largest median household size of 4.91 persons per household. non-family households (498 | 36.6%) represent the smallest median household size with 1.27 persons per household.

| Household Type | # Households | Household Size |
| Married-Couple | 749 (55.1%) | 3.44 |
| Single Male/Father | 46 (3.4%) | 4.91 |
| Single Female/Mother | 67 (4.9%) | 4.18 |
| Non-family | 498 (36.6%) | 1.27 |
| Total Households | 1,360 (100.0%) | 2.73 |
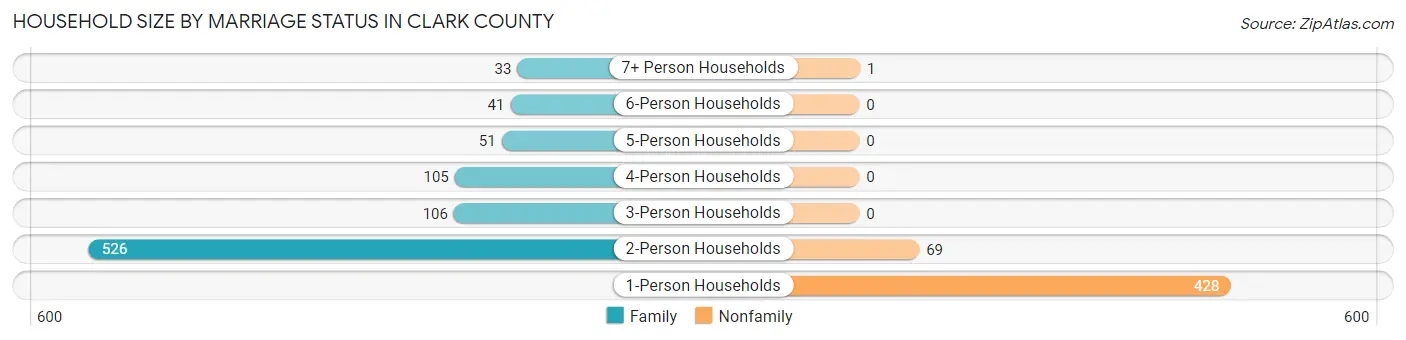
Household Size by Marriage Status in Clark County
Out of a total of 1,360 households in Clark County, 862 (63.4%) are family households, while 498 (36.6%) are nonfamily households. The most numerous type of family households are 2-person households, comprising 526, and the most common type of nonfamily households are 1-person households, comprising 428.
| Household Size | Family Households | Nonfamily Households |
| 1-Person Households | - | 428 (31.5%) |
| 2-Person Households | 526 (38.7%) | 69 (5.1%) |
| 3-Person Households | 106 (7.8%) | 0 (0.0%) |
| 4-Person Households | 105 (7.7%) | 0 (0.0%) |
| 5-Person Households | 51 (3.7%) | 0 (0.0%) |
| 6-Person Households | 41 (3.0%) | 0 (0.0%) |
| 7+ Person Households | 33 (2.4%) | 1 (0.1%) |
| Total | 862 (63.4%) | 498 (36.6%) |
Female Fertility in Clark County
Fertility by Age in Clark County
Average fertility rate in Clark County is 103.0 births per 1,000 women. Women in the age bracket of 20 to 34 years have the highest fertility rate with 210.0 births per 1,000 women. Women in the age bracket of 20 to 34 years acount for 95.3% of all women with births.

| Age Bracket | Women with Births | Births / 1,000 Women |
| 15 to 19 years | 0 (0.0%) | 0.0 |
| 20 to 34 years | 61 (95.3%) | 210.0 |
| 35 to 50 years | 3 (4.7%) | 12.0 |
| Total | 64 (100.0%) | 103.0 |
Fertility by Age by Marriage Status in Clark County

| Age Bracket | Married | Unmarried |
| 15 to 19 years | 0 (0.0%) | 0 (0.0%) |
| 20 to 34 years | 61 (100.0%) | 0 (0.0%) |
| 35 to 50 years | 3 (100.0%) | 0 (0.0%) |
| Total | 64 (100.0%) | 0 (0.0%) |
Fertility by Education in Clark County

| Educational Attainment | Women with Births | Births / 1,000 Women |
| Less than High School | 0 (0.0%) | 0.0 |
| High School Diploma | 5 (7.8%) | 27.0 |
| College or Associate's Degree | 41 (64.1%) | 204.0 |
| Bachelor's Degree | 12 (18.8%) | 105.0 |
| Graduate Degree | 6 (9.4%) | 316.0 |
| Total | 64 (100.0%) | 103.0 |
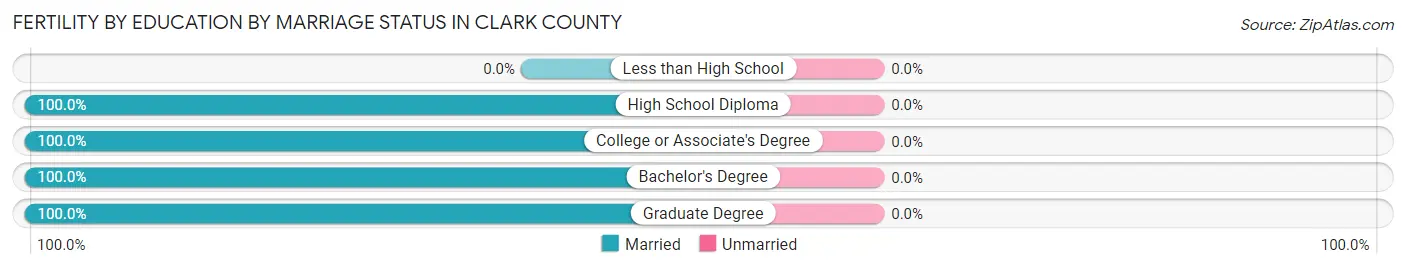
Fertility by Education by Marriage Status in Clark County
| Educational Attainment | Married | Unmarried |
| Less than High School | 0 (0.0%) | 0 (0.0%) |
| High School Diploma | 5 (100.0%) | 0 (0.0%) |
| College or Associate's Degree | 41 (100.0%) | 0 (0.0%) |
| Bachelor's Degree | 12 (100.0%) | 0 (0.0%) |
| Graduate Degree | 6 (100.0%) | 0 (0.0%) |
| Total | 64 (100.0%) | 0 (0.0%) |
Income in Clark County
Income Overview in Clark County
Per Capita Income in Clark County is $35,573, while median incomes of families and households are $75,000 and $59,340 respectively.
| Characteristic | Number | Measure |
| Per Capita Income | 3,837 | $35,573 |
| Median Family Income | 862 | $75,000 |
| Mean Family Income | 862 | $112,062 |
| Median Household Income | 1,360 | $59,340 |
| Mean Household Income | 1,360 | $92,044 |
| Income Deficit | 862 | $0 |
| Wage / Income Gap (%) | 3,837 | 35.02% |
| Wage / Income Gap ($) | 3,837 | 64.98¢ per $1 |
| Gini / Inequality Index | 3,837 | 0.50 |
Earnings by Sex in Clark County
Average Earnings in Clark County are $32,886, $41,969 for men and $27,273 for women, a difference of 35.0%.

| Sex | Number | Average Earnings |
| Male | 1,039 (56.9%) | $41,969 |
| Female | 786 (43.1%) | $27,273 |
| Total | 1,825 (100.0%) | $32,886 |
Earnings by Sex by Income Bracket in Clark County
The most common earnings brackets in Clark County are $100,000+ for men (137 | 13.2%) and $25,000 to $29,999 for women (107 | 13.6%).

| Income | Male | Female |
| $2,499 or less | 37 (3.6%) | 74 (9.4%) |
| $2,500 to $4,999 | 75 (7.2%) | 26 (3.3%) |
| $5,000 to $7,499 | 31 (3.0%) | 29 (3.7%) |
| $7,500 to $9,999 | 15 (1.4%) | 7 (0.9%) |
| $10,000 to $12,499 | 43 (4.1%) | 33 (4.2%) |
| $12,500 to $14,999 | 6 (0.6%) | 4 (0.5%) |
| $15,000 to $17,499 | 22 (2.1%) | 40 (5.1%) |
| $17,500 to $19,999 | 23 (2.2%) | 18 (2.3%) |
| $20,000 to $22,499 | 12 (1.1%) | 42 (5.3%) |
| $22,500 to $24,999 | 71 (6.8%) | 80 (10.2%) |
| $25,000 to $29,999 | 38 (3.7%) | 107 (13.6%) |
| $30,000 to $34,999 | 53 (5.1%) | 84 (10.7%) |
| $35,000 to $39,999 | 62 (6.0%) | 18 (2.3%) |
| $40,000 to $44,999 | 67 (6.5%) | 45 (5.7%) |
| $45,000 to $49,999 | 58 (5.6%) | 41 (5.2%) |
| $50,000 to $54,999 | 48 (4.6%) | 23 (2.9%) |
| $55,000 to $64,999 | 100 (9.6%) | 46 (5.9%) |
| $65,000 to $74,999 | 42 (4.0%) | 16 (2.0%) |
| $75,000 to $99,999 | 99 (9.5%) | 13 (1.7%) |
| $100,000+ | 137 (13.2%) | 40 (5.1%) |
| Total | 1,039 (100.0%) | 786 (100.0%) |
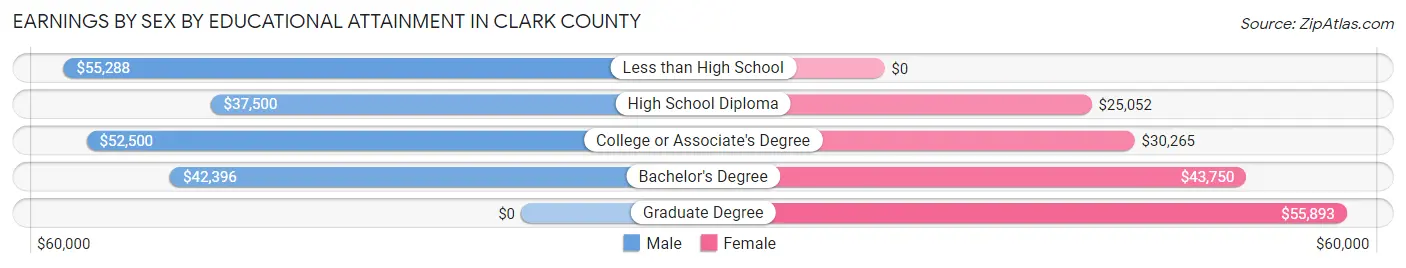
Earnings by Sex by Educational Attainment in Clark County
Average earnings in Clark County are $43,194 for men and $28,750 for women, a difference of 33.4%. Men with an educational attainment of less than high school enjoy the highest average annual earnings of $55,288, while those with high school diploma education earn the least with $37,500. Women with an educational attainment of graduate degree earn the most with the average annual earnings of $55,893, while those with high school diploma education have the smallest earnings of $25,052.
| Educational Attainment | Male Income | Female Income |
| Less than High School | $55,288 | $0 |
| High School Diploma | $37,500 | $25,052 |
| College or Associate's Degree | $52,500 | $30,265 |
| Bachelor's Degree | $42,396 | $43,750 |
| Graduate Degree | - | - |
| Total | $43,194 | $28,750 |
Family Income in Clark County
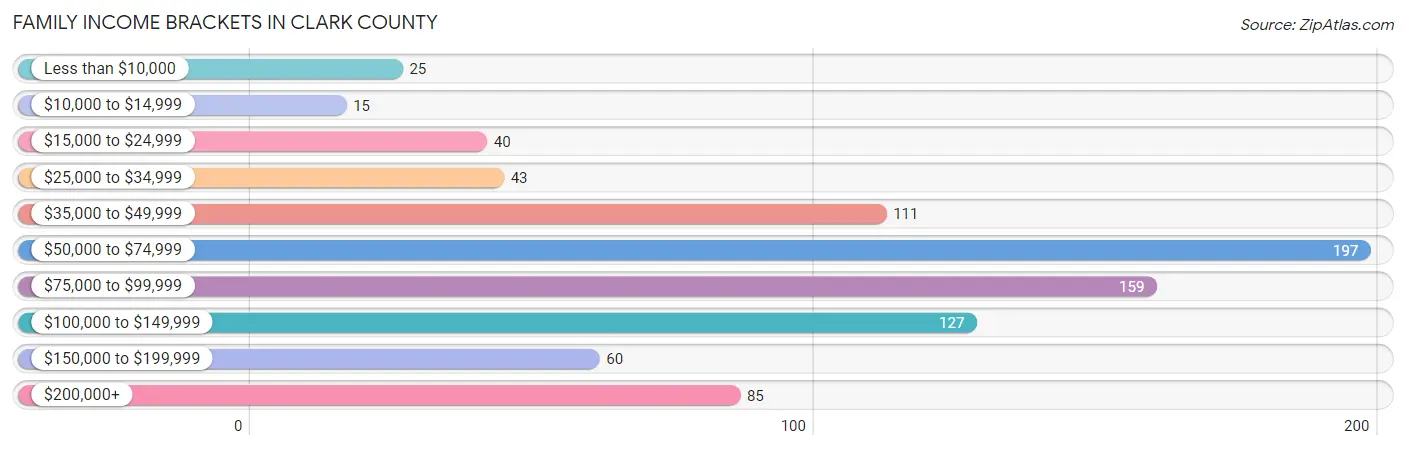
Family Income Brackets in Clark County
According to the Clark County family income data, there are 197 families falling into the $50,000 to $74,999 income range, which is the most common income bracket and makes up 22.9% of all families. Conversely, the $10,000 to $14,999 income bracket is the least frequent group with only 15 families (1.7%) belonging to this category.
| Income Bracket | # Families | % Families |
| Less than $10,000 | 25 | 2.9% |
| $10,000 to $14,999 | 15 | 1.7% |
| $15,000 to $24,999 | 40 | 4.6% |
| $25,000 to $34,999 | 43 | 5.0% |
| $35,000 to $49,999 | 111 | 12.9% |
| $50,000 to $74,999 | 197 | 22.9% |
| $75,000 to $99,999 | 159 | 18.4% |
| $100,000 to $149,999 | 127 | 14.7% |
| $150,000 to $199,999 | 60 | 7.0% |
| $200,000+ | 85 | 9.9% |
Family Income by Famaliy Size in Clark County
4-person families (102 | 11.8%) account for the highest median family income in Clark County with $113,571 per family, while 2-person families (543 | 63.0%) have the highest median income of $30,491 per family member.

| Income Bracket | # Families | Median Income |
| 2-Person Families | 543 (63.0%) | $60,982 |
| 3-Person Families | 102 (11.8%) | $88,750 |
| 4-Person Families | 102 (11.8%) | $113,571 |
| 5-Person Families | 51 (5.9%) | $94,250 |
| 6-Person Families | 32 (3.7%) | $0 |
| 7+ Person Families | 32 (3.7%) | $58,333 |
| Total | 862 (100.0%) | $75,000 |
Family Income by Number of Earners in Clark County
The median family income in Clark County is $75,000, with families comprising 3+ earners (65) having the highest median family income of $119,904, while families with no earners (105) have the lowest median family income of $32,917, accounting for 7.5% and 12.2% of families, respectively.

| Number of Earners | # Families | Median Income |
| No Earners | 105 (12.2%) | $32,917 |
| 1 Earner | 252 (29.2%) | $64,773 |
| 2 Earners | 440 (51.0%) | $81,667 |
| 3+ Earners | 65 (7.5%) | $119,904 |
| Total | 862 (100.0%) | $75,000 |
Household Income in Clark County
Household Income Brackets in Clark County
With 273 households falling in the category, the $50,000 to $74,999 income range is the most frequent in Clark County, accounting for 20.1% of all households. In contrast, only 57 households (4.2%) fall into the $10,000 to $14,999 income bracket, making it the least populous group.

| Income Bracket | # Households | % Households |
| Less than $10,000 | 58 | 4.3% |
| $10,000 to $14,999 | 57 | 4.2% |
| $15,000 to $24,999 | 107 | 7.9% |
| $25,000 to $34,999 | 125 | 9.2% |
| $35,000 to $49,999 | 200 | 14.7% |
| $50,000 to $74,999 | 273 | 20.1% |
| $75,000 to $99,999 | 182 | 13.4% |
| $100,000 to $149,999 | 192 | 14.1% |
| $150,000 to $199,999 | 67 | 4.9% |
| $200,000+ | 98 | 7.2% |
Household Income by Householder Age in Clark County
The median household income in Clark County is $59,340, with the highest median household income of $75,000 found in the 25 to 44 years age bracket for the primary householder. A total of 352 households (25.9%) fall into this category. Meanwhile, the 15 to 24 years age bracket for the primary householder has the lowest median household income of $45,526, with 50 households (3.7%) in this group.

| Income Bracket | # Households | Median Income |
| 15 to 24 Years | 50 (3.7%) | $45,526 |
| 25 to 44 Years | 352 (25.9%) | $75,000 |
| 45 to 64 Years | 453 (33.3%) | $60,417 |
| 65+ Years | 505 (37.1%) | $50,417 |
| Total | 1,360 (100.0%) | $59,340 |
Poverty in Clark County
Income Below Poverty by Sex and Age in Clark County
With 8.3% poverty level for males and 10.6% for females among the residents of Clark County, 35 to 44 year old males and 18 to 24 year old females are the most vulnerable to poverty, with 46 males (23.1%) and 30 females (33.3%) in their respective age groups living below the poverty level.

| Age Bracket | Male | Female |
| Under 5 Years | 8 (4.5%) | 19 (11.9%) |
| 5 Years | 3 (12.5%) | 0 (0.0%) |
| 6 to 11 Years | 14 (9.2%) | 4 (3.0%) |
| 12 to 14 Years | 0 (0.0%) | 0 (0.0%) |
| 15 Years | 0 (0.0%) | 0 (0.0%) |
| 16 and 17 Years | 0 (0.0%) | 7 (24.1%) |
| 18 to 24 Years | 4 (3.9%) | 30 (33.3%) |
| 25 to 34 Years | 25 (11.6%) | 12 (5.4%) |
| 35 to 44 Years | 46 (23.1%) | 24 (15.0%) |
| 45 to 54 Years | 11 (6.6%) | 28 (17.3%) |
| 55 to 64 Years | 22 (7.8%) | 11 (4.5%) |
| 65 to 74 Years | 14 (5.4%) | 23 (9.8%) |
| 75 Years and over | 10 (7.6%) | 36 (17.4%) |
| Total | 157 (8.3%) | 194 (10.6%) |
Income Above Poverty by Sex and Age in Clark County
According to the poverty statistics in Clark County, males aged 12 to 14 years and females aged 5 years are the age groups that are most secure financially, with 100.0% of males and 100.0% of females in these age groups living above the poverty line.

| Age Bracket | Male | Female |
| Under 5 Years | 170 (95.5%) | 141 (88.1%) |
| 5 Years | 21 (87.5%) | 31 (100.0%) |
| 6 to 11 Years | 138 (90.8%) | 128 (97.0%) |
| 12 to 14 Years | 100 (100.0%) | 121 (100.0%) |
| 15 Years | 41 (100.0%) | 32 (100.0%) |
| 16 and 17 Years | 44 (100.0%) | 22 (75.9%) |
| 18 to 24 Years | 98 (96.1%) | 60 (66.7%) |
| 25 to 34 Years | 190 (88.4%) | 209 (94.6%) |
| 35 to 44 Years | 153 (76.9%) | 136 (85.0%) |
| 45 to 54 Years | 157 (93.4%) | 134 (82.7%) |
| 55 to 64 Years | 261 (92.2%) | 231 (95.5%) |
| 65 to 74 Years | 247 (94.6%) | 213 (90.2%) |
| 75 Years and over | 122 (92.4%) | 171 (82.6%) |
| Total | 1,742 (91.7%) | 1,629 (89.4%) |
Income Below Poverty Among Married-Couple Families in Clark County
The poverty statistics for married-couple families in Clark County show that 4.8% or 36 of the total 749 families live below the poverty line. Families with 5 or more children have the highest poverty rate of 7.7%, comprising of 2 families. On the other hand, families with 1 or 2 children have the lowest poverty rate of 0.0%, which includes 0 families.

| Children | Above Poverty | Below Poverty |
| No Children | 468 (93.2%) | 34 (6.8%) |
| 1 or 2 Children | 167 (100.0%) | 0 (0.0%) |
| 3 or 4 Children | 54 (100.0%) | 0 (0.0%) |
| 5 or more Children | 24 (92.3%) | 2 (7.7%) |
| Total | 713 (95.2%) | 36 (4.8%) |
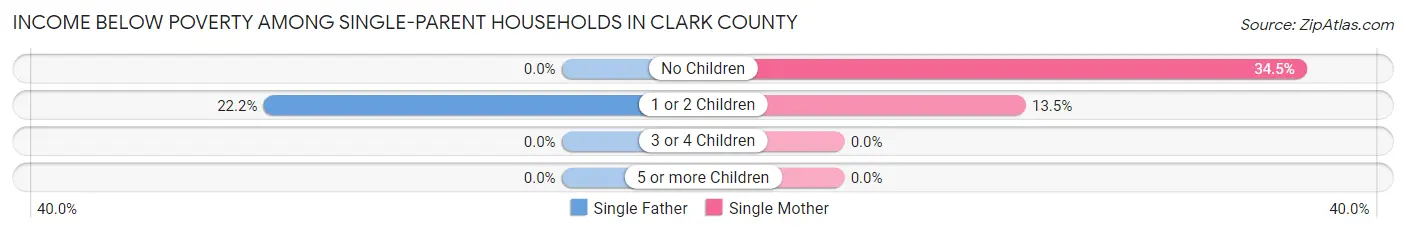
Income Below Poverty Among Single-Parent Households in Clark County
According to the poverty data in Clark County, 13.0% or 6 single-father households and 22.4% or 15 single-mother households are living below the poverty line. Among single-father households, those with 1 or 2 children have the highest poverty rate, with 6 households (22.2%) experiencing poverty. Likewise, among single-mother households, those with no children have the highest poverty rate, with 10 households (34.5%) falling below the poverty line.
| Children | Single Father | Single Mother |
| No Children | 0 (0.0%) | 10 (34.5%) |
| 1 or 2 Children | 6 (22.2%) | 5 (13.5%) |
| 3 or 4 Children | 0 (0.0%) | 0 (0.0%) |
| 5 or more Children | 0 (0.0%) | 0 (0.0%) |
| Total | 6 (13.0%) | 15 (22.4%) |
Income Below Poverty Among Married-Couple vs Single-Parent Households in Clark County
The poverty data for Clark County shows that 36 of the married-couple family households (4.8%) and 21 of the single-parent households (18.6%) are living below the poverty level. Within the married-couple family households, those with 5 or more children have the highest poverty rate, with 2 households (7.7%) falling below the poverty line. Among the single-parent households, those with no children have the highest poverty rate, with 10 household (20.8%) living below poverty.

| Children | Married-Couple Families | Single-Parent Households |
| No Children | 34 (6.8%) | 10 (20.8%) |
| 1 or 2 Children | 0 (0.0%) | 11 (17.2%) |
| 3 or 4 Children | 0 (0.0%) | 0 (0.0%) |
| 5 or more Children | 2 (7.7%) | 0 (0.0%) |
| Total | 36 (4.8%) | 21 (18.6%) |
Employment Characteristics in Clark County
Employment by Class of Employer in Clark County
Among the 1,525 employed individuals in Clark County, private company employees (734 | 48.1%), self-employed (not incorporated) (367 | 24.1%), and local government employees (124 | 8.1%) make up the most common classes of employment.

| Employer Class | # Employees | % Employees |
| Private Company Employees | 734 | 48.1% |
| Self-Employed (Incorporated) | 119 | 7.8% |
| Self-Employed (Not Incorporated) | 367 | 24.1% |
| Not-for-profit Organizations | 95 | 6.2% |
| Local Government Employees | 124 | 8.1% |
| State Government Employees | 55 | 3.6% |
| Federal Government Employees | 28 | 1.8% |
| Unpaid Family Workers | 3 | 0.2% |
| Total | 1,525 | 100.0% |
Employment Status by Age in Clark County
According to the labor force statistics for Clark County, out of the total population over 16 years of age (2,819), 59.0% or 1,663 individuals are in the labor force, with 5.3% or 88 of them unemployed. The age group with the highest labor force participation rate is 25 to 29 years, with 89.5% or 188 individuals in the labor force. Within the labor force, the 30 to 34 years age range has the highest percentage of unemployed individuals, with 18.4% or 35 of them being unemployed.

| Age Bracket | In Labor Force | Unemployed |
| 16 to 19 Years | 43 (34.7%) | 3 (7.0%) |
| 20 to 24 Years | 101 (71.6%) | 7 (6.9%) |
| 25 to 29 Years | 188 (89.5%) | 0 (0.0%) |
| 30 to 34 Years | 190 (83.3%) | 35 (18.4%) |
| 35 to 44 Years | 273 (76.0%) | 5 (1.8%) |
| 45 to 54 Years | 271 (81.6%) | 21 (7.7%) |
| 55 to 59 Years | 166 (69.7%) | 3 (1.8%) |
| 60 to 64 Years | 204 (70.1%) | 15 (7.4%) |
| 65 to 74 Years | 207 (41.0%) | 0 (0.0%) |
| 75 Years and over | 21 (5.4%) | 0 (0.0%) |
| Total | 1,663 (59.0%) | 88 (5.3%) |
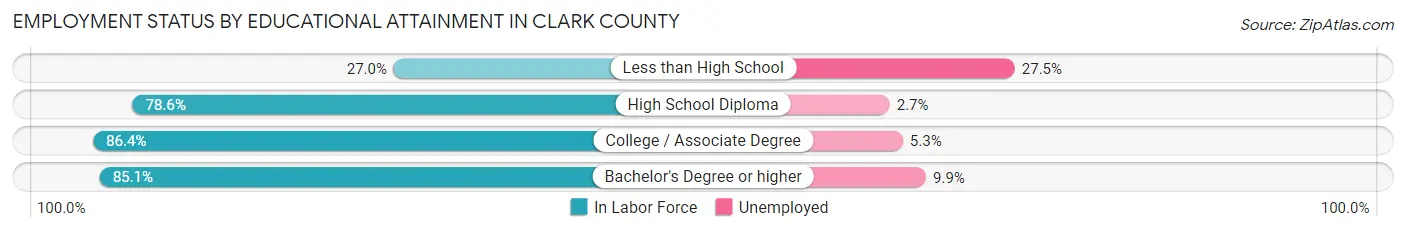
Employment Status by Educational Attainment in Clark County
According to labor force statistics for Clark County, 77.9% of individuals (1,292) out of the total population between 25 and 64 years of age (1,658) are in the labor force, with 6.1% or 79 of them being unemployed. The group with the highest labor force participation rate are those with the educational attainment of college / associate degree, with 86.4% or 452 individuals in the labor force. Within the labor force, individuals with less than high school education have the highest percentage of unemployment, with 27.5% or 11 of them being unemployed.
| Educational Attainment | In Labor Force | Unemployed |
| Less than High School | 40 (27.0%) | 41 (27.5%) |
| High School Diploma | 486 (78.6%) | 17 (2.7%) |
| College / Associate Degree | 452 (86.4%) | 28 (5.3%) |
| Bachelor's Degree or higher | 314 (85.1%) | 37 (9.9%) |
| Total | 1,292 (77.9%) | 101 (6.1%) |
Employment Occupations by Sex in Clark County
Management, Business, Science and Arts Occupations
The most common Management, Business, Science and Arts occupations in Clark County are Management (392 | 24.9%), Community & Social Service (142 | 9.0%), Education Instruction & Library (93 | 5.9%), Health Diagnosing & Treating (48 | 3.0%), and Business & Financial (44 | 2.8%).

Management, Business, Science and Arts Occupations by Sex
Within the Management, Business, Science and Arts occupations in Clark County, the most male-oriented occupations are Architecture & Engineering (100.0%), Arts, Media & Entertainment (96.7%), and Management (85.0%), while the most female-oriented occupations are Legal Services & Support (100.0%), Health Diagnosing & Treating (95.8%), and Health Technologists (91.3%).

| Occupation | Male | Female |
| Management | 333 (85.0%) | 59 (15.0%) |
| Business & Financial | 22 (50.0%) | 22 (50.0%) |
| Computers, Engineering & Science | 20 (71.4%) | 8 (28.6%) |
| Computers & Mathematics | 9 (60.0%) | 6 (40.0%) |
| Architecture & Engineering | 7 (100.0%) | 0 (0.0%) |
| Life, Physical & Social Science | 4 (66.7%) | 2 (33.3%) |
| Community & Social Service | 50 (35.2%) | 92 (64.8%) |
| Education, Arts & Media | 2 (20.0%) | 8 (80.0%) |
| Legal Services & Support | 0 (0.0%) | 9 (100.0%) |
| Education Instruction & Library | 19 (20.4%) | 74 (79.6%) |
| Arts, Media & Entertainment | 29 (96.7%) | 1 (3.3%) |
| Health Diagnosing & Treating | 2 (4.2%) | 46 (95.8%) |
| Health Technologists | 2 (8.7%) | 21 (91.3%) |
| Total (Category) | 427 (65.3%) | 227 (34.7%) |
| Total (Overall) | 897 (57.0%) | 678 (43.0%) |
Services Occupations
The most common Services occupations in Clark County are Cleaning & Maintenance (84 | 5.3%), Food Preparation & Serving (78 | 5.0%), Healthcare Support (51 | 3.2%), Personal Care & Service (34 | 2.2%), and Security & Protection (12 | 0.8%).

Services Occupations by Sex
Within the Services occupations in Clark County, the most male-oriented occupations are Security & Protection (100.0%), Firefighting & Prevention (100.0%), and Law Enforcement (100.0%), while the most female-oriented occupations are Food Preparation & Serving (91.0%), Healthcare Support (86.3%), and Personal Care & Service (76.5%).

| Occupation | Male | Female |
| Healthcare Support | 7 (13.7%) | 44 (86.3%) |
| Security & Protection | 12 (100.0%) | 0 (0.0%) |
| Firefighting & Prevention | 3 (100.0%) | 0 (0.0%) |
| Law Enforcement | 9 (100.0%) | 0 (0.0%) |
| Food Preparation & Serving | 7 (9.0%) | 71 (91.0%) |
| Cleaning & Maintenance | 38 (45.2%) | 46 (54.8%) |
| Personal Care & Service | 8 (23.5%) | 26 (76.5%) |
| Total (Category) | 72 (27.8%) | 187 (72.2%) |
| Total (Overall) | 897 (57.0%) | 678 (43.0%) |
Sales and Office Occupations
The most common Sales and Office occupations in Clark County are Office & Administration (191 | 12.1%), and Sales & Related (109 | 6.9%).

Sales and Office Occupations by Sex

| Occupation | Male | Female |
| Sales & Related | 43 (39.5%) | 66 (60.6%) |
| Office & Administration | 46 (24.1%) | 145 (75.9%) |
| Total (Category) | 89 (29.7%) | 211 (70.3%) |
| Total (Overall) | 897 (57.0%) | 678 (43.0%) |
Natural Resources, Construction and Maintenance Occupations
The most common Natural Resources, Construction and Maintenance occupations in Clark County are Farming, Fishing & Forestry (107 | 6.8%), Construction & Extraction (81 | 5.1%), and Installation, Maintenance & Repair (7 | 0.4%).

Natural Resources, Construction and Maintenance Occupations by Sex

| Occupation | Male | Female |
| Farming, Fishing & Forestry | 85 (79.4%) | 22 (20.6%) |
| Construction & Extraction | 79 (97.5%) | 2 (2.5%) |
| Installation, Maintenance & Repair | 7 (100.0%) | 0 (0.0%) |
| Total (Category) | 171 (87.7%) | 24 (12.3%) |
| Total (Overall) | 897 (57.0%) | 678 (43.0%) |
Production, Transportation and Moving Occupations
The most common Production, Transportation and Moving occupations in Clark County are Production (75 | 4.8%), Transportation (61 | 3.9%), and Material Moving (31 | 2.0%).

Production, Transportation and Moving Occupations by Sex

| Occupation | Male | Female |
| Production | 60 (80.0%) | 15 (20.0%) |
| Transportation | 55 (90.2%) | 6 (9.8%) |
| Material Moving | 23 (74.2%) | 8 (25.8%) |
| Total (Category) | 138 (82.6%) | 29 (17.4%) |
| Total (Overall) | 897 (57.0%) | 678 (43.0%) |
Employment Industries by Sex in Clark County
Employment Industries in Clark County
The major employment industries in Clark County include Agriculture, Fishing & Hunting (480 | 30.5%), Educational Services (131 | 8.3%), Retail Trade (126 | 8.0%), Health Care & Social Assistance (111 | 7.0%), and Construction (105 | 6.7%).

Employment Industries by Sex in Clark County
The Clark County industries that see more men than women are Mining, Quarrying, & Extraction (100.0%), Arts, Entertainment & Recreation (100.0%), and Construction (88.6%), whereas the industries that tend to have a higher number of women are Information (100.0%), Professional & Scientific (100.0%), and Health Care & Social Assistance (97.3%).

| Industry | Male | Female |
| Agriculture, Fishing & Hunting | 402 (83.8%) | 78 (16.3%) |
| Mining, Quarrying, & Extraction | 18 (100.0%) | 0 (0.0%) |
| Construction | 93 (88.6%) | 12 (11.4%) |
| Manufacturing | 49 (75.4%) | 16 (24.6%) |
| Wholesale Trade | 49 (75.4%) | 16 (24.6%) |
| Retail Trade | 37 (29.4%) | 89 (70.6%) |
| Transportation & Warehousing | 62 (75.6%) | 20 (24.4%) |
| Utilities | 5 (62.5%) | 3 (37.5%) |
| Information | 0 (0.0%) | 2 (100.0%) |
| Finance & Insurance | 10 (18.5%) | 44 (81.5%) |
| Real Estate, Rental & Leasing | 0 (0.0%) | 0 (0.0%) |
| Professional & Scientific | 0 (0.0%) | 51 (100.0%) |
| Enterprise Management | 0 (0.0%) | 0 (0.0%) |
| Administrative & Support | 27 (84.4%) | 5 (15.6%) |
| Educational Services | 37 (28.2%) | 94 (71.8%) |
| Health Care & Social Assistance | 3 (2.7%) | 108 (97.3%) |
| Arts, Entertainment & Recreation | 29 (100.0%) | 0 (0.0%) |
| Accommodation & Food Services | 18 (24.7%) | 55 (75.3%) |
| Public Administration | 26 (42.6%) | 35 (57.4%) |
| Total | 897 (57.0%) | 678 (43.0%) |
Education in Clark County
School Enrollment in Clark County
The most common levels of schooling among the 803 students in Clark County are middle school (262 | 32.6%), high school (214 | 26.7%), and elementary school (177 | 22.0%).
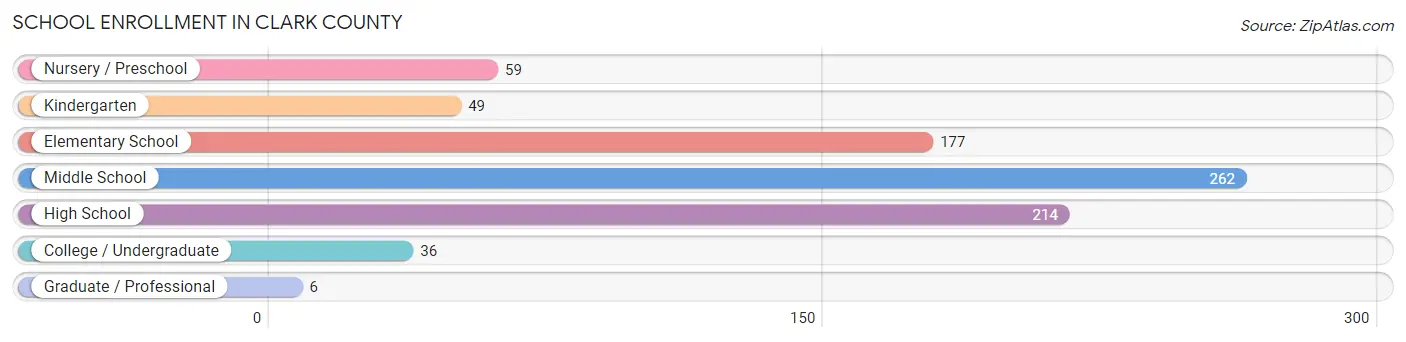
| School Level | # Students | % Students |
| Nursery / Preschool | 59 | 7.3% |
| Kindergarten | 49 | 6.1% |
| Elementary School | 177 | 22.0% |
| Middle School | 262 | 32.6% |
| High School | 214 | 26.7% |
| College / Undergraduate | 36 | 4.5% |
| Graduate / Professional | 6 | 0.7% |
| Total | 803 | 100.0% |
School Enrollment by Age by Funding Source in Clark County
Out of a total of 803 students who are enrolled in schools in Clark County, 55 (6.8%) attend a private institution, while the remaining 748 (93.2%) are enrolled in public schools. The age group of 35 years and over has the highest likelihood of being enrolled in private schools, with 15 (75.0% in the age bracket) enrolled. Conversely, the age group of 3 to 4 year olds has the lowest likelihood of being enrolled in a private school, with 22 (100.0% in the age bracket) attending a public institution.

| Age Bracket | Public School | Private School |
| 3 to 4 Year Olds | 22 (100.0%) | 0 (0.0%) |
| 5 to 9 Year Old | 204 (94.0%) | 13 (6.0%) |
| 10 to 14 Year Olds | 333 (93.8%) | 22 (6.2%) |
| 15 to 17 Year Olds | 134 (97.8%) | 3 (2.2%) |
| 18 to 19 Year Olds | 29 (100.0%) | 0 (0.0%) |
| 20 to 24 Year Olds | 13 (86.7%) | 2 (13.3%) |
| 25 to 34 Year Olds | 8 (100.0%) | 0 (0.0%) |
| 35 Years and over | 5 (25.0%) | 15 (75.0%) |
| Total | 748 (93.2%) | 55 (6.8%) |
Educational Attainment by Field of Study in Clark County
Education (146 | 29.1%), bio, nature & agricultural (87 | 17.4%), business (63 | 12.6%), communications (41 | 8.2%), and computers & mathematics (34 | 6.8%) are the most common fields of study among 501 individuals in Clark County who have obtained a bachelor's degree or higher.

| Field of Study | # Graduates | % Graduates |
| Computers & Mathematics | 34 | 6.8% |
| Bio, Nature & Agricultural | 87 | 17.4% |
| Physical & Health Sciences | 19 | 3.8% |
| Psychology | 10 | 2.0% |
| Social Sciences | 21 | 4.2% |
| Engineering | 8 | 1.6% |
| Multidisciplinary Studies | 2 | 0.4% |
| Science & Technology | 32 | 6.4% |
| Business | 63 | 12.6% |
| Education | 146 | 29.1% |
| Literature & Languages | 8 | 1.6% |
| Liberal Arts & History | 7 | 1.4% |
| Visual & Performing Arts | 3 | 0.6% |
| Communications | 41 | 8.2% |
| Arts & Humanities | 20 | 4.0% |
| Total | 501 | 100.0% |
Transportation & Commute in Clark County
Vehicle Availability by Sex in Clark County
The most prevalent vehicle ownership categories in Clark County are males with 2 vehicles (250, accounting for 29.2%) and females with 2 vehicles (188, making up 37.4%).
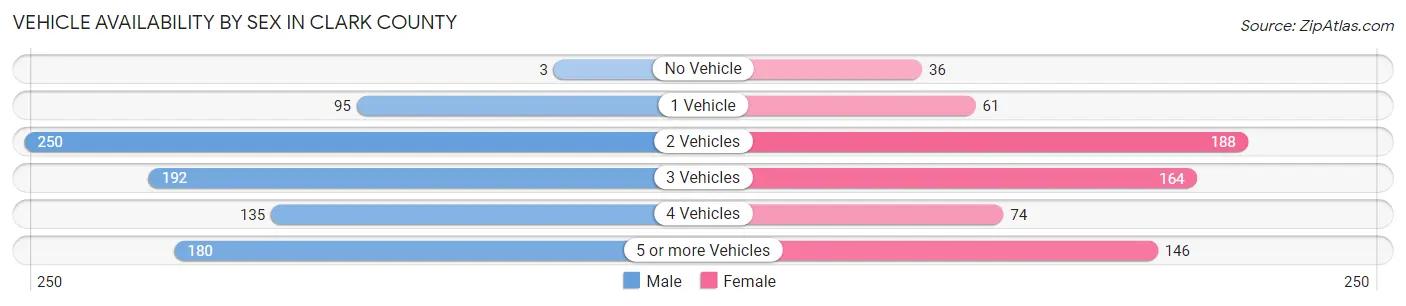
| Vehicles Available | Male | Female |
| No Vehicle | 3 (0.4%) | 36 (5.4%) |
| 1 Vehicle | 95 (11.1%) | 61 (9.1%) |
| 2 Vehicles | 250 (29.2%) | 188 (28.1%) |
| 3 Vehicles | 192 (22.5%) | 164 (24.5%) |
| 4 Vehicles | 135 (15.8%) | 74 (11.1%) |
| 5 or more Vehicles | 180 (21.0%) | 146 (21.8%) |
| Total | 855 (100.0%) | 669 (100.0%) |
Commute Time in Clark County
The most frequently occuring commute durations in Clark County are 5 to 9 minutes (257 commuters, 20.8%), less than 5 minutes (203 commuters, 16.4%), and 15 to 19 minutes (142 commuters, 11.5%).

| Commute Time | # Commuters | % Commuters |
| Less than 5 Minutes | 203 | 16.4% |
| 5 to 9 Minutes | 257 | 20.8% |
| 10 to 14 Minutes | 114 | 9.2% |
| 15 to 19 Minutes | 142 | 11.5% |
| 20 to 24 Minutes | 98 | 7.9% |
| 25 to 29 Minutes | 57 | 4.6% |
| 30 to 34 Minutes | 104 | 8.4% |
| 35 to 39 Minutes | 81 | 6.6% |
| 40 to 44 Minutes | 43 | 3.5% |
| 45 to 59 Minutes | 84 | 6.8% |
| 60 to 89 Minutes | 26 | 2.1% |
| 90 or more Minutes | 28 | 2.3% |
Commute Time by Sex in Clark County
The most common commute times in Clark County are less than 5 minutes (126 commuters, 20.4%) for males and 5 to 9 minutes (133 commuters, 21.5%) for females.

| Commute Time | Male | Female |
| Less than 5 Minutes | 126 (20.4%) | 77 (12.5%) |
| 5 to 9 Minutes | 124 (20.0%) | 133 (21.5%) |
| 10 to 14 Minutes | 33 (5.3%) | 81 (13.1%) |
| 15 to 19 Minutes | 74 (11.9%) | 68 (11.0%) |
| 20 to 24 Minutes | 52 (8.4%) | 46 (7.4%) |
| 25 to 29 Minutes | 9 (1.5%) | 48 (7.8%) |
| 30 to 34 Minutes | 71 (11.5%) | 33 (5.3%) |
| 35 to 39 Minutes | 28 (4.5%) | 53 (8.6%) |
| 40 to 44 Minutes | 30 (4.9%) | 13 (2.1%) |
| 45 to 59 Minutes | 35 (5.7%) | 49 (7.9%) |
| 60 to 89 Minutes | 14 (2.3%) | 12 (1.9%) |
| 90 or more Minutes | 23 (3.7%) | 5 (0.8%) |
Time of Departure to Work by Sex in Clark County
The most frequent times of departure to work in Clark County are 6:00 AM to 6:29 AM (97, 15.7%) for males and 7:30 AM to 7:59 AM (126, 20.4%) for females.
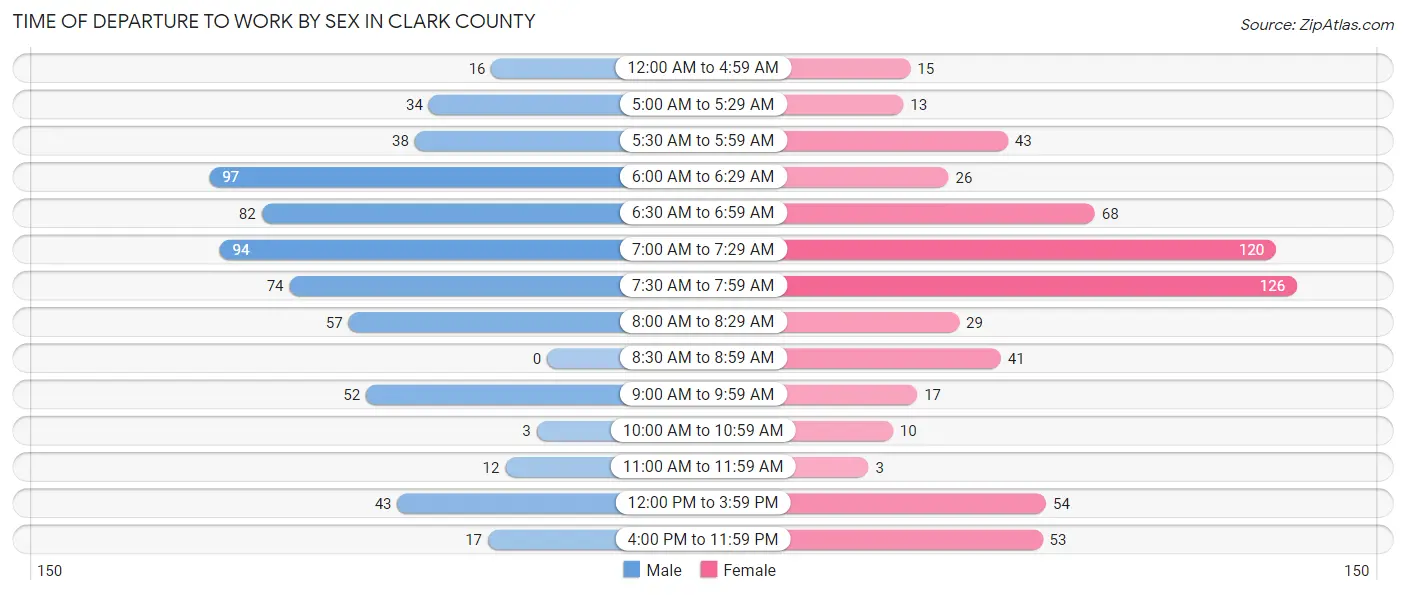
| Time of Departure | Male | Female |
| 12:00 AM to 4:59 AM | 16 (2.6%) | 15 (2.4%) |
| 5:00 AM to 5:29 AM | 34 (5.5%) | 13 (2.1%) |
| 5:30 AM to 5:59 AM | 38 (6.1%) | 43 (7.0%) |
| 6:00 AM to 6:29 AM | 97 (15.7%) | 26 (4.2%) |
| 6:30 AM to 6:59 AM | 82 (13.3%) | 68 (11.0%) |
| 7:00 AM to 7:29 AM | 94 (15.2%) | 120 (19.4%) |
| 7:30 AM to 7:59 AM | 74 (11.9%) | 126 (20.4%) |
| 8:00 AM to 8:29 AM | 57 (9.2%) | 29 (4.7%) |
| 8:30 AM to 8:59 AM | 0 (0.0%) | 41 (6.6%) |
| 9:00 AM to 9:59 AM | 52 (8.4%) | 17 (2.8%) |
| 10:00 AM to 10:59 AM | 3 (0.5%) | 10 (1.6%) |
| 11:00 AM to 11:59 AM | 12 (1.9%) | 3 (0.5%) |
| 12:00 PM to 3:59 PM | 43 (7.0%) | 54 (8.7%) |
| 4:00 PM to 11:59 PM | 17 (2.8%) | 53 (8.6%) |
| Total | 619 (100.0%) | 618 (100.0%) |
Housing Occupancy in Clark County
Occupancy by Ownership in Clark County
Of the total 1,360 dwellings in Clark County, owner-occupied units account for 1,092 (80.3%), while renter-occupied units make up 268 (19.7%).

| Occupancy | # Housing Units | % Housing Units |
| Owner Occupied Housing Units | 1,092 | 80.3% |
| Renter-Occupied Housing Units | 268 | 19.7% |
| Total Occupied Housing Units | 1,360 | 100.0% |
Occupancy by Household Size in Clark County

| Household Size | # Housing Units | % Housing Units |
| 1-Person Household | 428 | 31.5% |
| 2-Person Household | 595 | 43.8% |
| 3-Person Household | 106 | 7.8% |
| 4+ Person Household | 231 | 17.0% |
| Total Housing Units | 1,360 | 100.0% |
Occupancy by Ownership by Household Size in Clark County

| Household Size | Owner-occupied | Renter-occupied |
| 1-Person Household | 280 (65.4%) | 148 (34.6%) |
| 2-Person Household | 534 (89.7%) | 61 (10.2%) |
| 3-Person Household | 74 (69.8%) | 32 (30.2%) |
| 4+ Person Household | 204 (88.3%) | 27 (11.7%) |
| Total Housing Units | 1,092 (80.3%) | 268 (19.7%) |
Occupancy by Educational Attainment in Clark County

| Household Size | Owner-occupied | Renter-occupied |
| Less than High School | 48 (82.8%) | 10 (17.2%) |
| High School Diploma | 471 (87.2%) | 69 (12.8%) |
| College/Associate Degree | 361 (74.7%) | 122 (25.3%) |
| Bachelor's Degree or higher | 212 (76.0%) | 67 (24.0%) |
Occupancy by Age of Householder in Clark County
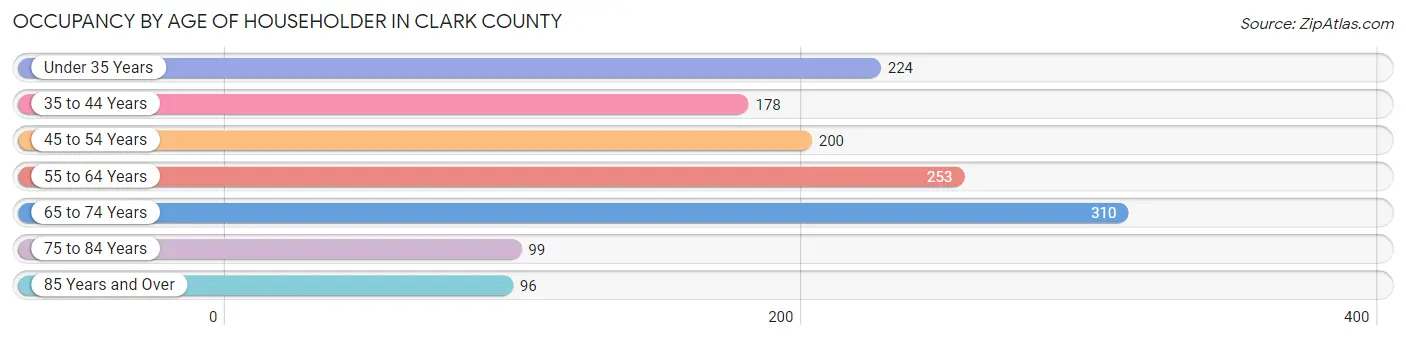
| Age Bracket | # Households | % Households |
| Under 35 Years | 224 | 16.5% |
| 35 to 44 Years | 178 | 13.1% |
| 45 to 54 Years | 200 | 14.7% |
| 55 to 64 Years | 253 | 18.6% |
| 65 to 74 Years | 310 | 22.8% |
| 75 to 84 Years | 99 | 7.3% |
| 85 Years and Over | 96 | 7.1% |
| Total | 1,360 | 100.0% |
Housing Finances in Clark County
Median Income by Occupancy in Clark County

| Occupancy Type | # Households | Median Income |
| Owner-Occupied | 1,092 (80.3%) | $60,694 |
| Renter-Occupied | 268 (19.7%) | $47,083 |
| Average | 1,360 (100.0%) | $59,340 |
Occupancy by Householder Income Bracket in Clark County
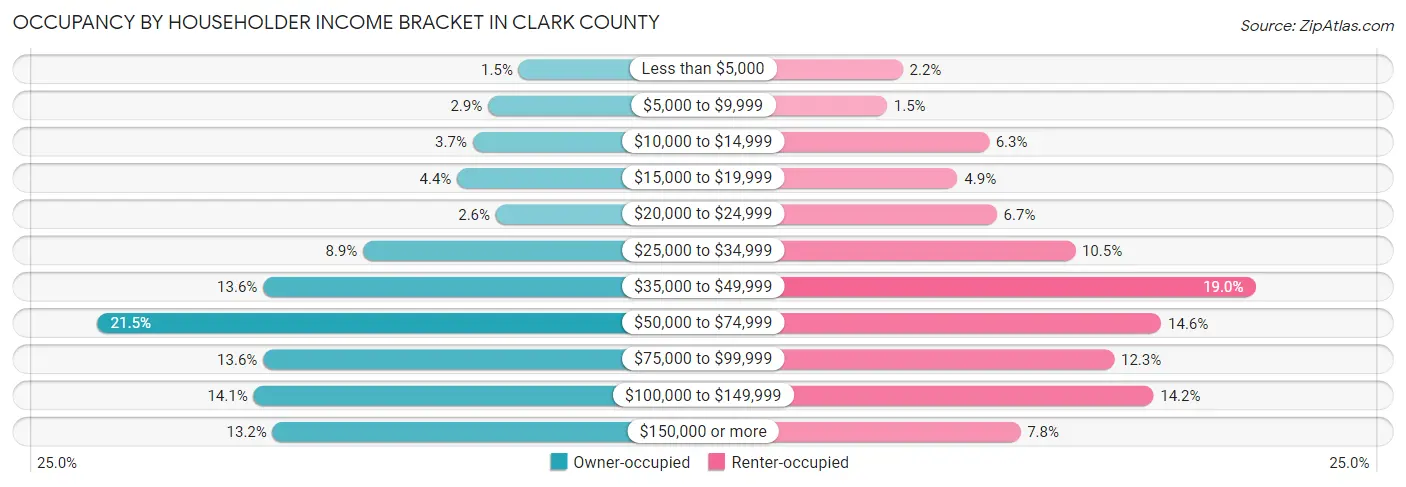
| Income Bracket | Owner-occupied | Renter-occupied |
| Less than $5,000 | 16 (1.5%) | 6 (2.2%) |
| $5,000 to $9,999 | 32 (2.9%) | 4 (1.5%) |
| $10,000 to $14,999 | 40 (3.7%) | 17 (6.3%) |
| $15,000 to $19,999 | 48 (4.4%) | 13 (4.9%) |
| $20,000 to $24,999 | 28 (2.6%) | 18 (6.7%) |
| $25,000 to $34,999 | 97 (8.9%) | 28 (10.4%) |
| $35,000 to $49,999 | 149 (13.6%) | 51 (19.0%) |
| $50,000 to $74,999 | 235 (21.5%) | 39 (14.5%) |
| $75,000 to $99,999 | 149 (13.6%) | 33 (12.3%) |
| $100,000 to $149,999 | 154 (14.1%) | 38 (14.2%) |
| $150,000 or more | 144 (13.2%) | 21 (7.8%) |
| Total | 1,092 (100.0%) | 268 (100.0%) |
Monthly Housing Cost Tiers in Clark County
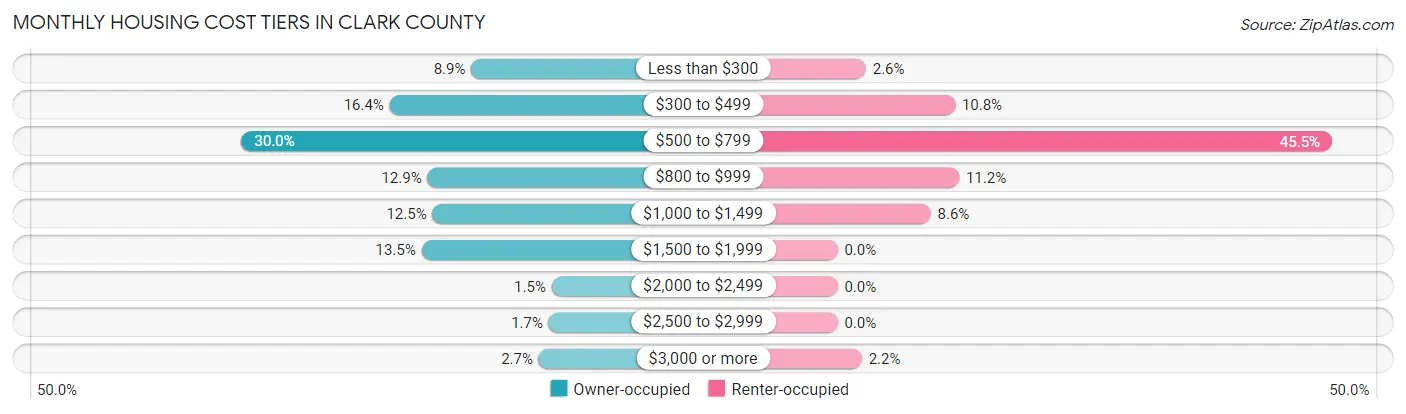
| Monthly Cost | Owner-occupied | Renter-occupied |
| Less than $300 | 97 (8.9%) | 7 (2.6%) |
| $300 to $499 | 179 (16.4%) | 29 (10.8%) |
| $500 to $799 | 328 (30.0%) | 122 (45.5%) |
| $800 to $999 | 141 (12.9%) | 30 (11.2%) |
| $1,000 to $1,499 | 136 (12.4%) | 23 (8.6%) |
| $1,500 to $1,999 | 147 (13.5%) | 0 (0.0%) |
| $2,000 to $2,499 | 16 (1.5%) | 0 (0.0%) |
| $2,500 to $2,999 | 19 (1.7%) | 0 (0.0%) |
| $3,000 or more | 29 (2.7%) | 6 (2.2%) |
| Total | 1,092 (100.0%) | 268 (100.0%) |
Physical Housing Characteristics in Clark County
Housing Structures in Clark County

| Structure Type | # Housing Units | % Housing Units |
| Single Unit, Detached | 1,187 | 87.3% |
| Single Unit, Attached | 1 | 0.1% |
| 2 Unit Apartments | 3 | 0.2% |
| 3 or 4 Unit Apartments | 34 | 2.5% |
| 5 to 9 Unit Apartments | 26 | 1.9% |
| 10 or more Apartments | 36 | 2.6% |
| Mobile Home / Other | 73 | 5.4% |
| Total | 1,360 | 100.0% |
Housing Structures by Occupancy in Clark County

| Structure Type | Owner-occupied | Renter-occupied |
| Single Unit, Detached | 1,017 (85.7%) | 170 (14.3%) |
| Single Unit, Attached | 1 (100.0%) | 0 (0.0%) |
| 2 Unit Apartments | 0 (0.0%) | 3 (100.0%) |
| 3 or 4 Unit Apartments | 6 (17.6%) | 28 (82.4%) |
| 5 to 9 Unit Apartments | 0 (0.0%) | 26 (100.0%) |
| 10 or more Apartments | 0 (0.0%) | 36 (100.0%) |
| Mobile Home / Other | 68 (93.1%) | 5 (6.9%) |
| Total | 1,092 (80.3%) | 268 (19.7%) |
Housing Structures by Number of Rooms in Clark County

| Number of Rooms | Owner-occupied | Renter-occupied |
| 1 Room | 1 (0.1%) | 23 (8.6%) |
| 2 or 3 Rooms | 16 (1.5%) | 38 (14.2%) |
| 4 or 5 Rooms | 205 (18.8%) | 91 (34.0%) |
| 6 or 7 Rooms | 447 (40.9%) | 62 (23.1%) |
| 8 or more Rooms | 423 (38.7%) | 54 (20.2%) |
| Total | 1,092 (100.0%) | 268 (100.0%) |
Housing Structure by Heating Type in Clark County

| Heating Type | Owner-occupied | Renter-occupied |
| Utility Gas | 393 (36.0%) | 76 (28.4%) |
| Bottled, Tank, or LP Gas | 381 (34.9%) | 60 (22.4%) |
| Electricity | 278 (25.5%) | 123 (45.9%) |
| Fuel Oil or Kerosene | 4 (0.4%) | 9 (3.4%) |
| Coal or Coke | 0 (0.0%) | 0 (0.0%) |
| All other Fuels | 34 (3.1%) | 0 (0.0%) |
| No Fuel Used | 2 (0.2%) | 0 (0.0%) |
| Total | 1,092 (100.0%) | 268 (100.0%) |
Household Vehicle Usage in Clark County
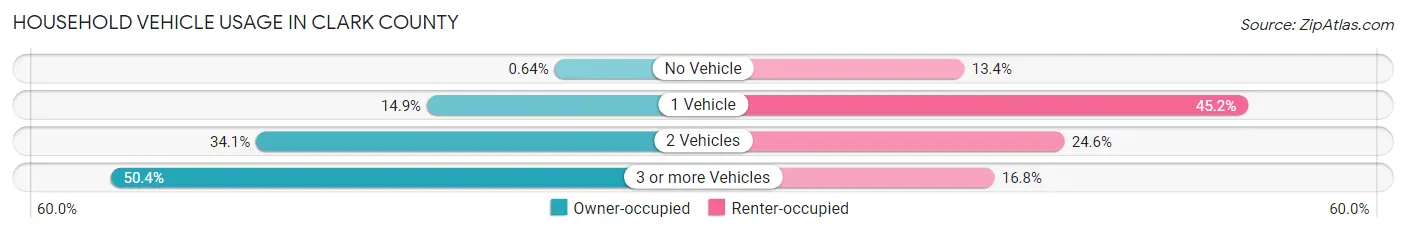
| Vehicles per Household | Owner-occupied | Renter-occupied |
| No Vehicle | 7 (0.6%) | 36 (13.4%) |
| 1 Vehicle | 163 (14.9%) | 121 (45.2%) |
| 2 Vehicles | 372 (34.1%) | 66 (24.6%) |
| 3 or more Vehicles | 550 (50.4%) | 45 (16.8%) |
| Total | 1,092 (100.0%) | 268 (100.0%) |
Real Estate & Mortgages in Clark County
Real Estate and Mortgage Overview in Clark County
| Characteristic | Without Mortgage | With Mortgage |
| Housing Units | 694 | 398 |
| Median Property Value | $123,200 | $148,900 |
| Median Household Income | $57,321 | $60 |
| Monthly Housing Costs | $560 | $27 |
| Real Estate Taxes | $1,239 | $4 |
Property Value by Mortgage Status in Clark County

| Property Value | Without Mortgage | With Mortgage |
| Less than $50,000 | 146 (21.0%) | 65 (16.3%) |
| $50,000 to $99,999 | 162 (23.3%) | 61 (15.3%) |
| $100,000 to $299,999 | 287 (41.3%) | 206 (51.8%) |
| $300,000 to $499,999 | 28 (4.0%) | 40 (10.1%) |
| $500,000 to $749,999 | 34 (4.9%) | 17 (4.3%) |
| $750,000 to $999,999 | 0 (0.0%) | 4 (1.0%) |
| $1,000,000 or more | 37 (5.3%) | 5 (1.3%) |
| Total | 694 (100.0%) | 398 (100.0%) |
Household Income by Mortgage Status in Clark County

| Household Income | Without Mortgage | With Mortgage |
| Less than $10,000 | 47 (6.8%) | 2 (0.5%) |
| $10,000 to $24,999 | 83 (12.0%) | 1 (0.3%) |
| $25,000 to $34,999 | 74 (10.7%) | 33 (8.3%) |
| $35,000 to $49,999 | 72 (10.4%) | 23 (5.8%) |
| $50,000 to $74,999 | 166 (23.9%) | 77 (19.4%) |
| $75,000 to $99,999 | 81 (11.7%) | 69 (17.3%) |
| $100,000 to $149,999 | 87 (12.5%) | 68 (17.1%) |
| $150,000 or more | 84 (12.1%) | 67 (16.8%) |
| Total | 694 (100.0%) | 398 (100.0%) |
Property Value to Household Income Ratio in Clark County

| Value-to-Income Ratio | Without Mortgage | With Mortgage |
| Less than 2.0x | 322 (46.4%) | 72,188 (18,137.7%) |
| 2.0x to 2.9x | 71 (10.2%) | 191 (48.0%) |
| 3.0x to 3.9x | 63 (9.1%) | 80 (20.1%) |
| 4.0x or more | 231 (33.3%) | 15 (3.8%) |
| Total | 694 (100.0%) | 398 (100.0%) |
Real Estate Taxes by Mortgage Status in Clark County

| Property Taxes | Without Mortgage | With Mortgage |
| Less than $800 | 237 (34.2%) | 0 (0.0%) |
| $800 to $1,499 | 165 (23.8%) | 133 (33.4%) |
| $800 to $1,499 | 281 (40.5%) | 79 (19.9%) |
| Total | 694 (100.0%) | 398 (100.0%) |
Health & Disability in Clark County
Health Insurance Coverage by Age in Clark County
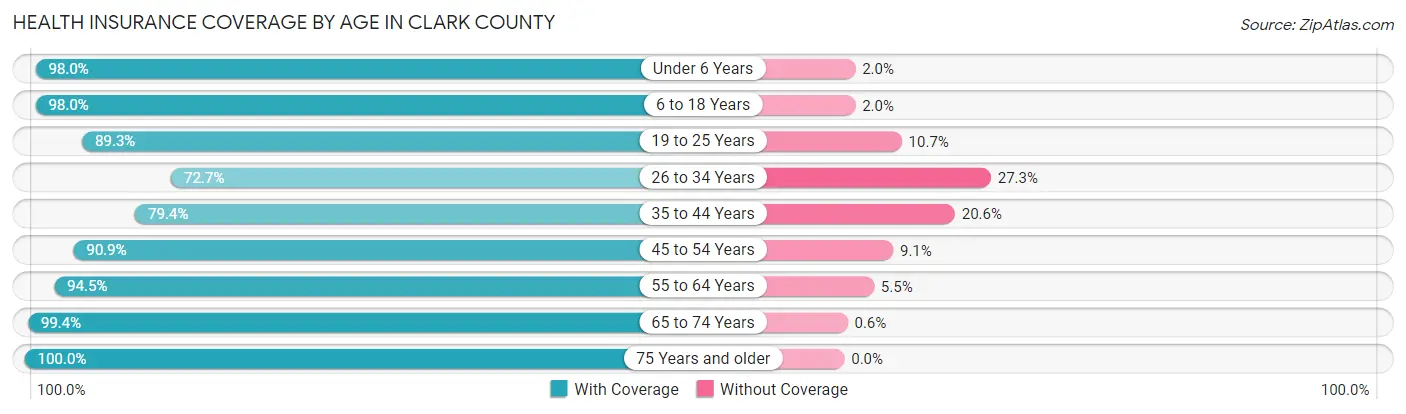
| Age Bracket | With Coverage | Without Coverage |
| Under 6 Years | 387 (98.0%) | 8 (2.0%) |
| 6 to 18 Years | 723 (98.0%) | 15 (2.0%) |
| 19 to 25 Years | 167 (89.3%) | 20 (10.7%) |
| 26 to 34 Years | 290 (72.7%) | 109 (27.3%) |
| 35 to 44 Years | 285 (79.4%) | 74 (20.6%) |
| 45 to 54 Years | 300 (90.9%) | 30 (9.1%) |
| 55 to 64 Years | 496 (94.5%) | 29 (5.5%) |
| 65 to 74 Years | 494 (99.4%) | 3 (0.6%) |
| 75 Years and older | 339 (100.0%) | 0 (0.0%) |
| Total | 3,481 (92.4%) | 288 (7.6%) |
Health Insurance Coverage by Citizenship Status in Clark County

| Citizenship Status | With Coverage | Without Coverage |
| Native Born | 387 (98.0%) | 8 (2.0%) |
| Foreign Born, Citizen | 723 (98.0%) | 15 (2.0%) |
| Foreign Born, not a Citizen | 167 (89.3%) | 20 (10.7%) |
Health Insurance Coverage by Household Income in Clark County
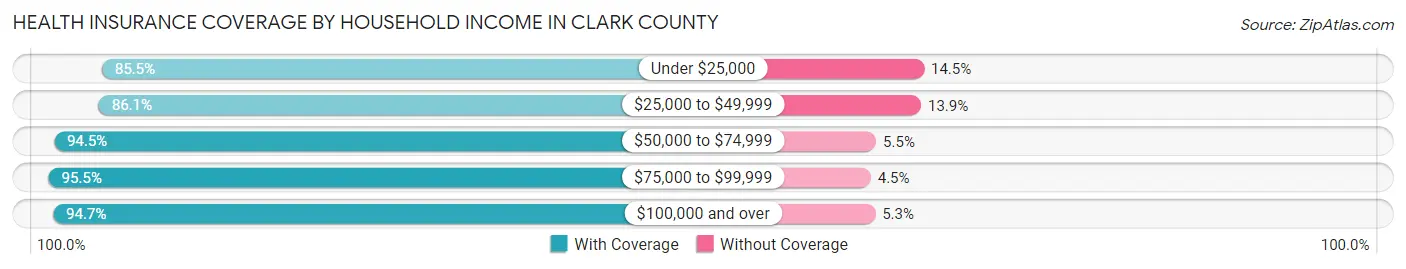
| Household Income | With Coverage | Without Coverage |
| Under $25,000 | 337 (85.5%) | 57 (14.5%) |
| $25,000 to $49,999 | 582 (86.1%) | 94 (13.9%) |
| $50,000 to $74,999 | 756 (94.5%) | 44 (5.5%) |
| $75,000 to $99,999 | 616 (95.5%) | 29 (4.5%) |
| $100,000 and over | 1,136 (94.7%) | 64 (5.3%) |
Public vs Private Health Insurance Coverage by Age in Clark County

| Age Bracket | Public Insurance | Private Insurance |
| Under 6 | 124 (31.4%) | 269 (68.1%) |
| 6 to 18 Years | 223 (30.2%) | 517 (70.1%) |
| 19 to 25 Years | 24 (12.8%) | 148 (79.1%) |
| 25 to 34 Years | 37 (9.3%) | 256 (64.2%) |
| 35 to 44 Years | 35 (9.8%) | 251 (69.9%) |
| 45 to 54 Years | 35 (10.6%) | 269 (81.5%) |
| 55 to 64 Years | 53 (10.1%) | 450 (85.7%) |
| 65 to 74 Years | 466 (93.8%) | 315 (63.4%) |
| 75 Years and over | 335 (98.8%) | 181 (53.4%) |
| Total | 1,332 (35.3%) | 2,656 (70.5%) |
Disability Status by Sex by Age in Clark County

| Age Bracket | Male | Female |
| Under 5 Years | 15 (8.3%) | 0 (0.0%) |
| 5 to 17 Years | 20 (4.9%) | 19 (5.5%) |
| 18 to 34 Years | 8 (2.5%) | 30 (9.7%) |
| 35 to 64 Years | 46 (7.1%) | 50 (8.9%) |
| 65 to 74 Years | 53 (20.3%) | 36 (15.2%) |
| 75 Years and over | 47 (35.6%) | 97 (46.9%) |
Disability Class by Sex by Age in Clark County
Disability Class: Hearing Difficulty
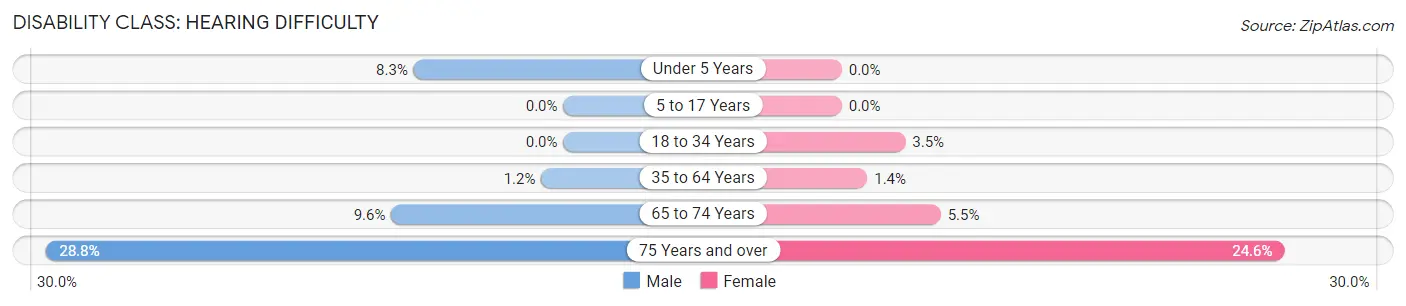
| Age Bracket | Male | Female |
| Under 5 Years | 15 (8.3%) | 0 (0.0%) |
| 5 to 17 Years | 0 (0.0%) | 0 (0.0%) |
| 18 to 34 Years | 0 (0.0%) | 11 (3.5%) |
| 35 to 64 Years | 8 (1.2%) | 8 (1.4%) |
| 65 to 74 Years | 25 (9.6%) | 13 (5.5%) |
| 75 Years and over | 38 (28.8%) | 51 (24.6%) |
Disability Class: Vision Difficulty

| Age Bracket | Male | Female |
| Under 5 Years | 0 (0.0%) | 0 (0.0%) |
| 5 to 17 Years | 0 (0.0%) | 0 (0.0%) |
| 18 to 34 Years | 1 (0.3%) | 0 (0.0%) |
| 35 to 64 Years | 9 (1.4%) | 4 (0.7%) |
| 65 to 74 Years | 0 (0.0%) | 23 (9.8%) |
| 75 Years and over | 8 (6.1%) | 22 (10.6%) |
Disability Class: Cognitive Difficulty

| Age Bracket | Male | Female |
| 5 to 17 Years | 20 (4.9%) | 19 (5.5%) |
| 18 to 34 Years | 7 (2.2%) | 15 (4.8%) |
| 35 to 64 Years | 17 (2.6%) | 14 (2.5%) |
| 65 to 74 Years | 0 (0.0%) | 3 (1.3%) |
| 75 Years and over | 6 (4.5%) | 21 (10.1%) |
Disability Class: Ambulatory Difficulty

| Age Bracket | Male | Female |
| 5 to 17 Years | 0 (0.0%) | 0 (0.0%) |
| 18 to 34 Years | 7 (2.2%) | 7 (2.2%) |
| 35 to 64 Years | 23 (3.5%) | 28 (5.0%) |
| 65 to 74 Years | 28 (10.7%) | 14 (5.9%) |
| 75 Years and over | 24 (18.2%) | 54 (26.1%) |
Disability Class: Self-Care Difficulty

| Age Bracket | Male | Female |
| 5 to 17 Years | 0 (0.0%) | 0 (0.0%) |
| 18 to 34 Years | 7 (2.2%) | 7 (2.2%) |
| 35 to 64 Years | 5 (0.8%) | 0 (0.0%) |
| 65 to 74 Years | 0 (0.0%) | 2 (0.9%) |
| 75 Years and over | 12 (9.1%) | 15 (7.2%) |
Technology Access in Clark County
Computing Device Access in Clark County

| Device Type | # Households | % Households |
| Desktop or Laptop | 1,061 | 78.0% |
| Smartphone | 1,075 | 79.0% |
| Tablet | 747 | 54.9% |
| No Computing Device | 126 | 9.3% |
| Total | 1,360 | 100.0% |
Internet Access in Clark County
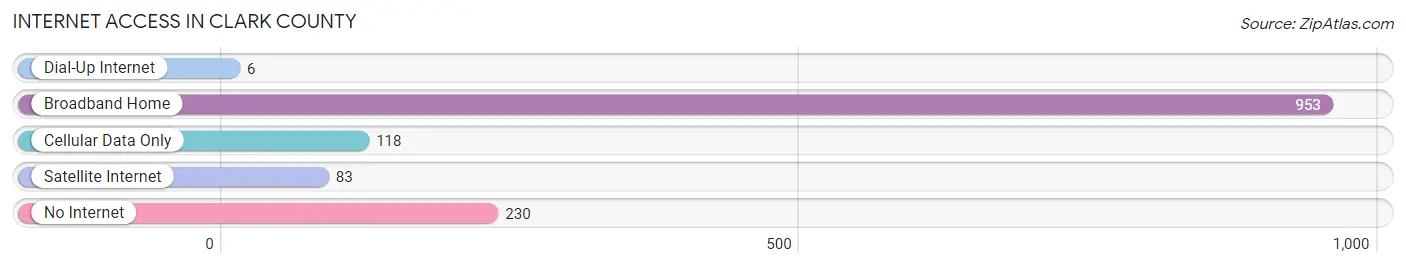
| Internet Type | # Households | % Households |
| Dial-Up Internet | 6 | 0.4% |
| Broadband Home | 953 | 70.1% |
| Cellular Data Only | 118 | 8.7% |
| Satellite Internet | 83 | 6.1% |
| No Internet | 230 | 16.9% |
| Total | 1,360 | 100.0% |
Clark County Summary
Clark County is located in the southeastern corner of South Dakota, and is bordered by the states of Minnesota and Iowa. The county seat is Clark, and the county was named after the explorer William Clark. The county has a total area of 576 square miles, and a population of 4,072 as of the 2010 census.
History
The area that is now Clark County was first settled by Native Americans, including the Dakota, Omaha, and Winnebago tribes. The first white settlers arrived in the area in the late 1800s, and the county was officially organized in 1873. The county was named after William Clark, the explorer who was part of the Lewis and Clark Expedition.
The county was largely agricultural in its early years, with settlers growing wheat, corn, and other crops. The county also had a thriving livestock industry, with cattle, sheep, and hogs being raised in the area. The county also had a number of small businesses, including general stores, blacksmiths, and other services.
Geography
Clark County is located in the southeastern corner of South Dakota, and is bordered by the states of Minnesota and Iowa. The county has a total area of 576 square miles, and is mostly flat, with some rolling hills in the northern part of the county. The county is drained by the Big Sioux River, which flows through the county from north to south.
The county has a variety of habitats, including prairies, wetlands, and woodlands. The county is home to a variety of wildlife, including white-tailed deer, wild turkeys, and a variety of waterfowl.
Economy
The economy of Clark County is largely based on agriculture, with wheat, corn, and soybeans being the main crops. The county also has a thriving livestock industry, with cattle, sheep, and hogs being raised in the area.
The county also has a number of small businesses, including general stores, restaurants, and other services. The county is also home to a number of manufacturing companies, including a furniture factory and a plastics factory.
Demographics
As of the 2010 census, the population of Clark County was 4,072. The population is largely white, with a small percentage of African Americans, Native Americans, and other races. The median household income in the county is $45,000, and the median home value is $125,000.
The county has a high rate of poverty, with nearly 20% of the population living below the poverty line. The unemployment rate in the county is also high, at 8.5%.
Conclusion
Clark County is a rural county located in the southeastern corner of South Dakota. The county has a population of 4,072, and is largely agricultural, with wheat, corn, and soybeans being the main crops. The county also has a thriving livestock industry, and a number of small businesses. The county has a high rate of poverty, and an unemployment rate of 8.5%.
Common Questions
What is the Total Population of Clark County?
Total Population of Clark County is 3,837.
What is the Total Male Population of Clark County?
Total Male Population of Clark County is 1,957.
What is the Total Female Population of Clark County?
Total Female Population of Clark County is 1,880.
What is the Ratio of Males per 100 Females in Clark County?
There are 104.10 Males per 100 Females in Clark County.
What is the Ratio of Females per 100 Males in Clark County?
There are 96.07 Females per 100 Males in Clark County.
What is the Median Population Age in Clark County?
Median Population Age in Clark County is 41.2 Years.
What is the Average Family Size in Clark County
Average Family Size in Clark County is 3.5 People.
What is the Average Household Size in Clark County
Average Household Size in Clark County is 2.7 People.
What is Per Capita Income in Clark County?
Per Capita income in Clark County is $35,573.
What is the Median Family Income in Clark County?
Median Family Income in Clark County is $75,000.
What is the Median Household income in Clark County?
Median Household Income in Clark County is $59,340.
What is Income or Wage Gap in Clark County?
Income or Wage Gap in Clark County is 35.0%.
Women in Clark County earn 65.0 cents for every dollar earned by a man.
What is Inequality or Gini Index in Clark County?
Inequality or Gini Index in Clark County is 0.50.
How Large is the Labor Force in Clark County?
There are 1,663 People in the Labor Forcein in Clark County.
What is the Percentage of People in the Labor Force in Clark County?
59.0% of People are in the Labor Force in Clark County.
What is the Unemployment Rate in Clark County?
Unemployment Rate in Clark County is 5.3%.