Charles Mix County, SD
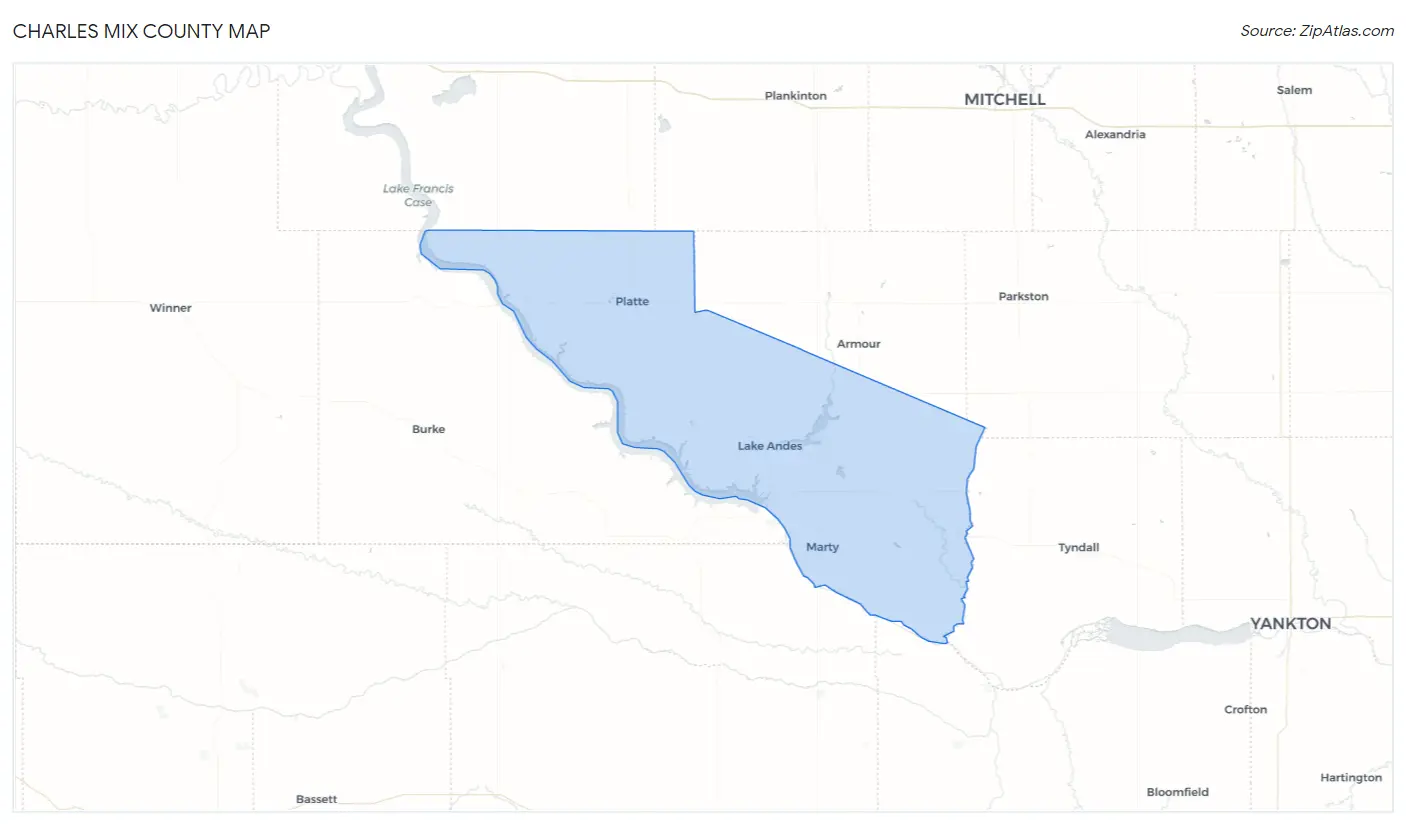
Charles Mix County Map
Charles Mix County Overview
9,302
TOTAL POPULATION
4,655
MALE POPULATION
4,647
FEMALE POPULATION
100.17
MALES / 100 FEMALES
99.83
FEMALES / 100 MALES
35.4
MEDIAN AGE
3.8
AVG FAMILY SIZE
3.0
AVG HOUSEHOLD SIZE
$27,034
PER CAPITA INCOME
$72,837
AVG FAMILY INCOME
$60,729
AVG HOUSEHOLD INCOME
27.2%
WAGE / INCOME GAP [ % ]
72.8¢/ $1
WAGE / INCOME GAP [ $ ]
$16,365
FAMILY INCOME DEFICIT
0.45
INEQUALITY / GINI INDEX
4,149
LABOR FORCE [ PEOPLE ]
61.2%
PERCENT IN LABOR FORCE
7.1%
UNEMPLOYMENT RATE
Charles Mix County Area Codes
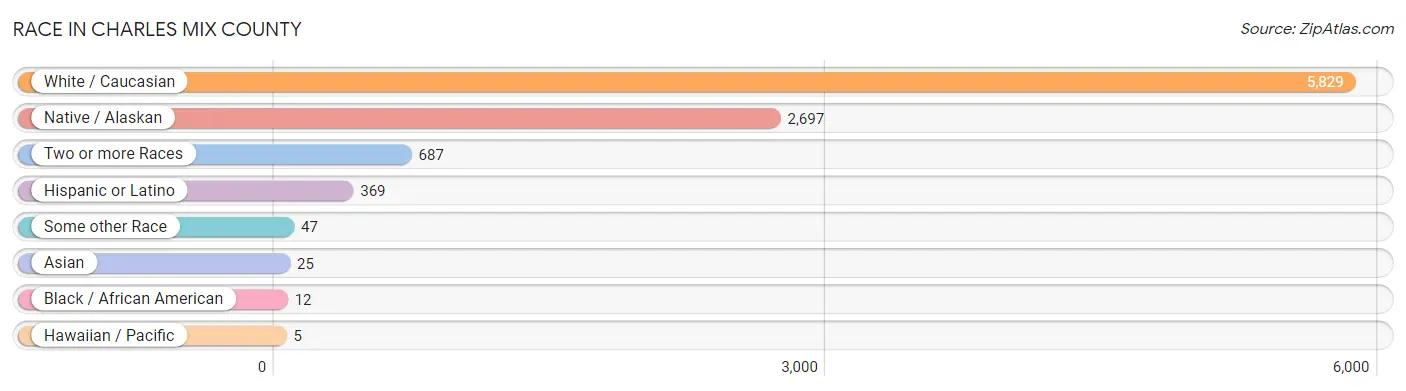
Race in Charles Mix County
The most populous races in Charles Mix County are White / Caucasian (5,829 | 62.7%), Native / Alaskan (2,697 | 29.0%), and Two or more Races (687 | 7.4%).
| Race | # Population | % Population |
| Asian | 25 | 0.3% |
| Black / African American | 12 | 0.1% |
| Hawaiian / Pacific | 5 | 0.1% |
| Hispanic or Latino | 369 | 4.0% |
| Native / Alaskan | 2,697 | 29.0% |
| White / Caucasian | 5,829 | 62.7% |
| Two or more Races | 687 | 7.4% |
| Some other Race | 47 | 0.5% |
| Total | 9,302 | 100.0% |
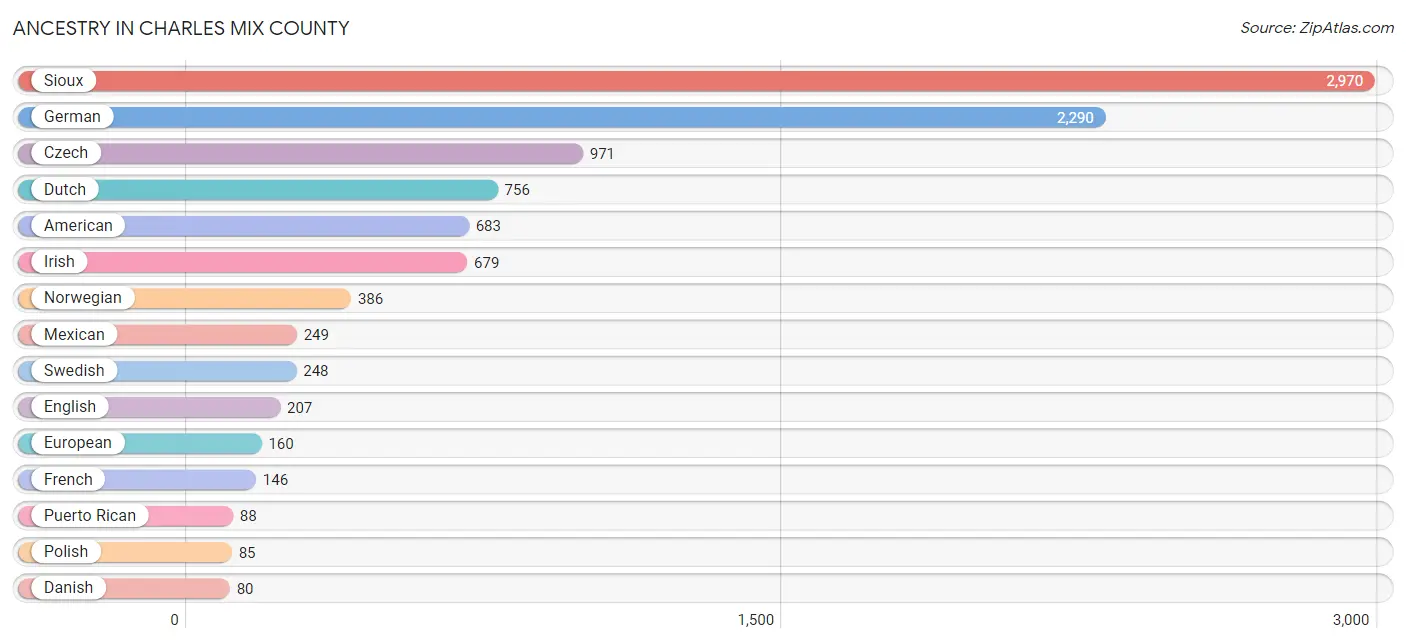
Ancestry in Charles Mix County
The most populous ancestries reported in Charles Mix County are Sioux (2,970 | 31.9%), German (2,290 | 24.6%), Czech (971 | 10.4%), Dutch (756 | 8.1%), and American (683 | 7.3%), together accounting for 82.5% of all Charles Mix County residents.
| Ancestry | # Population | % Population |
| American | 683 | 7.3% |
| Arab | 11 | 0.1% |
| Austrian | 4 | 0.0% |
| Belgian | 6 | 0.1% |
| British | 5 | 0.1% |
| Burmese | 10 | 0.1% |
| Canadian | 2 | 0.0% |
| Central American | 3 | 0.0% |
| Cherokee | 3 | 0.0% |
| Chippewa | 35 | 0.4% |
| Croatian | 2 | 0.0% |
| Cuban | 19 | 0.2% |
| Czech | 971 | 10.4% |
| Czechoslovakian | 41 | 0.4% |
| Danish | 80 | 0.9% |
| Dominican | 6 | 0.1% |
| Dutch | 756 | 8.1% |
| Eastern European | 20 | 0.2% |
| English | 207 | 2.2% |
| European | 160 | 1.7% |
| French | 146 | 1.6% |
| French Canadian | 40 | 0.4% |
| German | 2,290 | 24.6% |
| Guamanian / Chamorro | 5 | 0.1% |
| Guatemalan | 3 | 0.0% |
| Irish | 679 | 7.3% |
| Iroquois | 1 | 0.0% |
| Italian | 35 | 0.4% |
| Korean | 75 | 0.8% |
| Lebanese | 11 | 0.1% |
| Lithuanian | 12 | 0.1% |
| Mexican | 249 | 2.7% |
| Nigerian | 4 | 0.0% |
| Northern European | 2 | 0.0% |
| Norwegian | 386 | 4.2% |
| Polish | 85 | 0.9% |
| Portuguese | 4 | 0.0% |
| Puerto Rican | 88 | 0.9% |
| Russian | 18 | 0.2% |
| Scandinavian | 71 | 0.8% |
| Scotch-Irish | 35 | 0.4% |
| Scottish | 28 | 0.3% |
| Shoshone | 2 | 0.0% |
| Sioux | 2,970 | 31.9% |
| Sri Lankan | 5 | 0.1% |
| Subsaharan African | 7 | 0.1% |
| Sudanese | 3 | 0.0% |
| Swedish | 248 | 2.7% |
| Swiss | 51 | 0.5% |
| Syrian | 5 | 0.1% |
| Ukrainian | 40 | 0.4% |
| Welsh | 18 | 0.2% | View All 52 Rows |
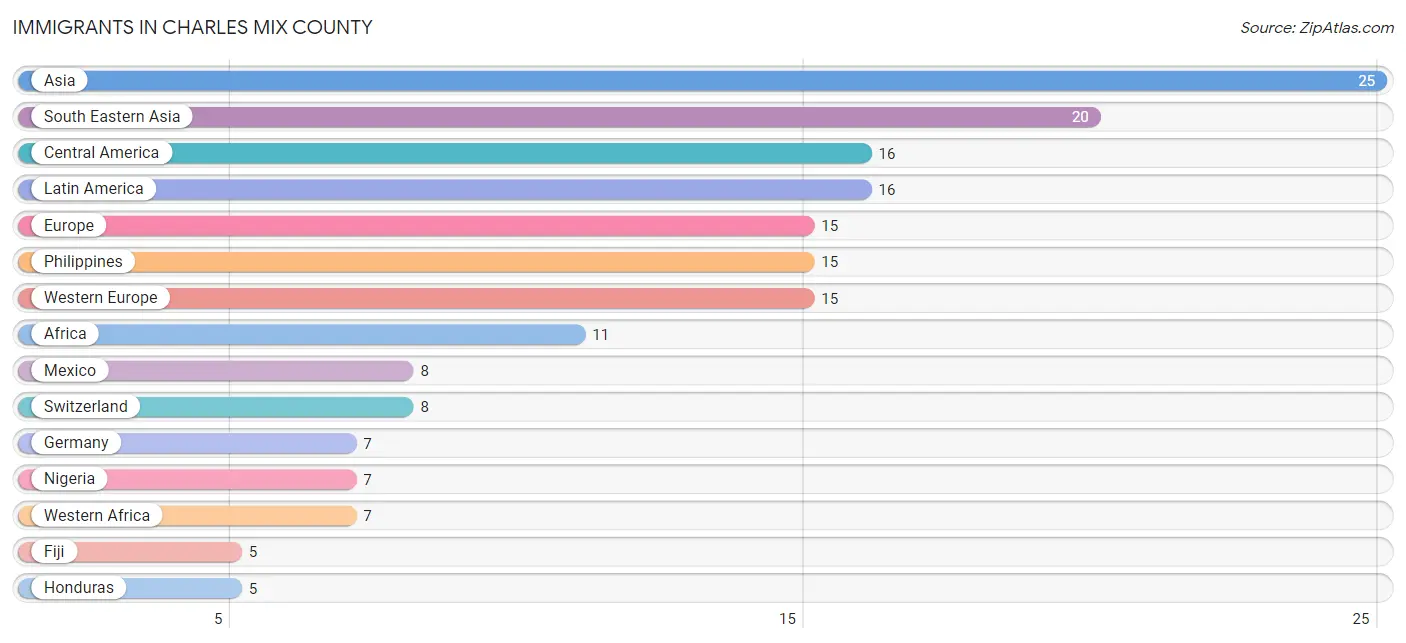
Immigrants in Charles Mix County
The most numerous immigrant groups reported in Charles Mix County came from Asia (25 | 0.3%), South Eastern Asia (20 | 0.2%), Central America (16 | 0.2%), Latin America (16 | 0.2%), and Europe (15 | 0.2%), together accounting for 1.0% of all Charles Mix County residents.
| Immigration Origin | # Population | % Population |
| Africa | 11 | 0.1% |
| Asia | 25 | 0.3% |
| Canada | 2 | 0.0% |
| Central America | 16 | 0.2% |
| Eastern Asia | 3 | 0.0% |
| Europe | 15 | 0.2% |
| Fiji | 5 | 0.1% |
| Germany | 7 | 0.1% |
| Guatemala | 3 | 0.0% |
| Honduras | 5 | 0.1% |
| India | 2 | 0.0% |
| Korea | 3 | 0.0% |
| Latin America | 16 | 0.2% |
| Mexico | 8 | 0.1% |
| Nigeria | 7 | 0.1% |
| Northern Africa | 3 | 0.0% |
| Oceania | 5 | 0.1% |
| Philippines | 15 | 0.2% |
| South Africa | 1 | 0.0% |
| South Central Asia | 2 | 0.0% |
| South Eastern Asia | 20 | 0.2% |
| Sudan | 3 | 0.0% |
| Switzerland | 8 | 0.1% |
| Vietnam | 5 | 0.1% |
| Western Africa | 7 | 0.1% |
| Western Europe | 15 | 0.2% | View All 26 Rows |
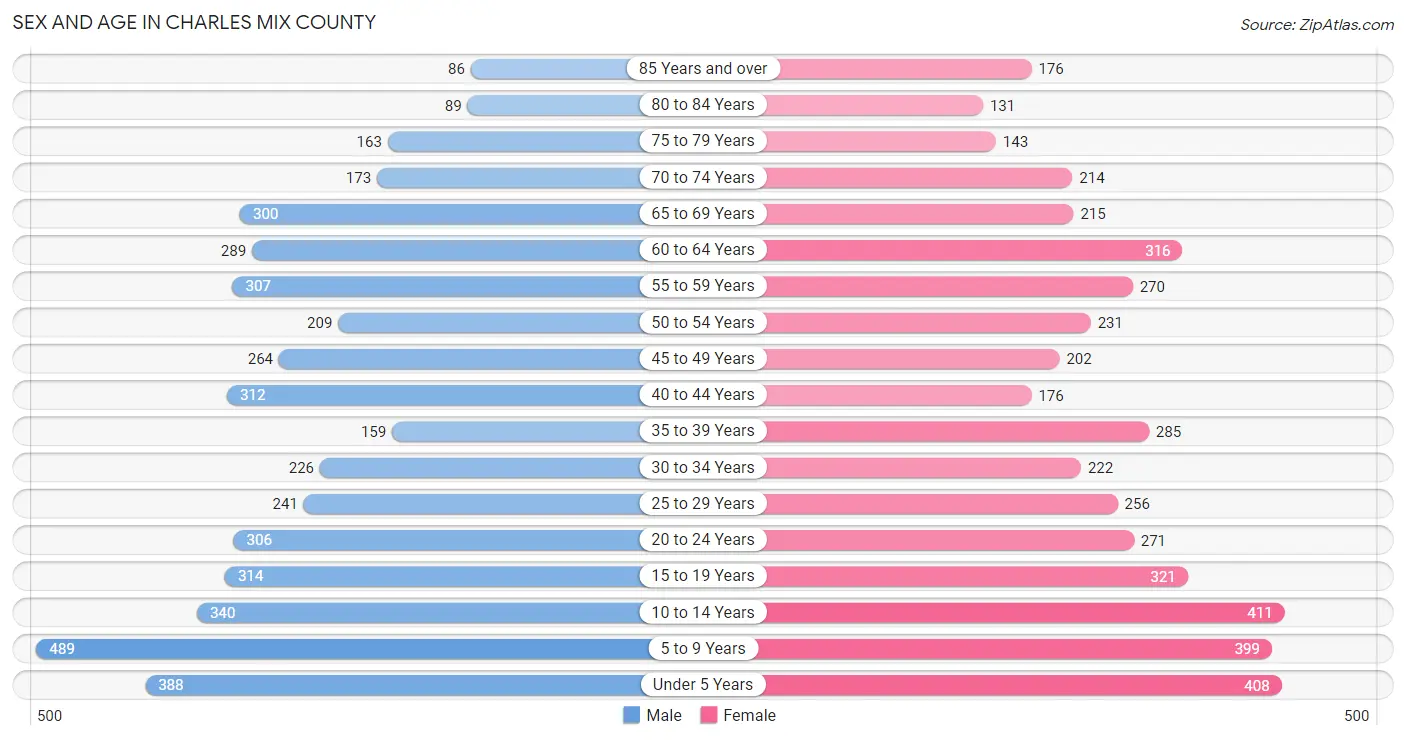
Sex and Age in Charles Mix County
Sex and Age in Charles Mix County
The most populous age groups in Charles Mix County are 5 to 9 Years (489 | 10.5%) for men and 10 to 14 Years (411 | 8.8%) for women.
| Age Bracket | Male | Female |
| Under 5 Years | 388 (8.3%) | 408 (8.8%) |
| 5 to 9 Years | 489 (10.5%) | 399 (8.6%) |
| 10 to 14 Years | 340 (7.3%) | 411 (8.8%) |
| 15 to 19 Years | 314 (6.8%) | 321 (6.9%) |
| 20 to 24 Years | 306 (6.6%) | 271 (5.8%) |
| 25 to 29 Years | 241 (5.2%) | 256 (5.5%) |
| 30 to 34 Years | 226 (4.9%) | 222 (4.8%) |
| 35 to 39 Years | 159 (3.4%) | 285 (6.1%) |
| 40 to 44 Years | 312 (6.7%) | 176 (3.8%) |
| 45 to 49 Years | 264 (5.7%) | 202 (4.3%) |
| 50 to 54 Years | 209 (4.5%) | 231 (5.0%) |
| 55 to 59 Years | 307 (6.6%) | 270 (5.8%) |
| 60 to 64 Years | 289 (6.2%) | 316 (6.8%) |
| 65 to 69 Years | 300 (6.4%) | 215 (4.6%) |
| 70 to 74 Years | 173 (3.7%) | 214 (4.6%) |
| 75 to 79 Years | 163 (3.5%) | 143 (3.1%) |
| 80 to 84 Years | 89 (1.9%) | 131 (2.8%) |
| 85 Years and over | 86 (1.8%) | 176 (3.8%) |
| Total | 4,655 (100.0%) | 4,647 (100.0%) |
Families and Households in Charles Mix County
Median Family Size in Charles Mix County
The median family size in Charles Mix County is 3.82 persons per family, with single female/mother families (311 | 15.6%) accounting for the largest median family size of 6.02 persons per family. On the other hand, married-couple families (1,496 | 75.1%) represent the smallest median family size with 3.33 persons per family.
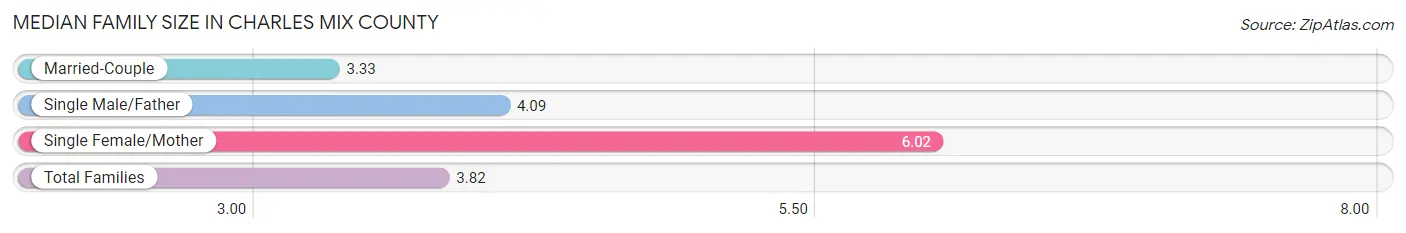
| Family Type | # Families | Family Size |
| Married-Couple | 1,496 (75.1%) | 3.33 |
| Single Male/Father | 186 (9.3%) | 4.09 |
| Single Female/Mother | 311 (15.6%) | 6.02 |
| Total Families | 1,993 (100.0%) | 3.82 |
Median Household Size in Charles Mix County
The median household size in Charles Mix County is 3.03 persons per household, with single female/mother households (311 | 10.5%) accounting for the largest median household size of 6.3 persons per household. non-family households (970 | 32.7%) represent the smallest median household size with 1.18 persons per household.
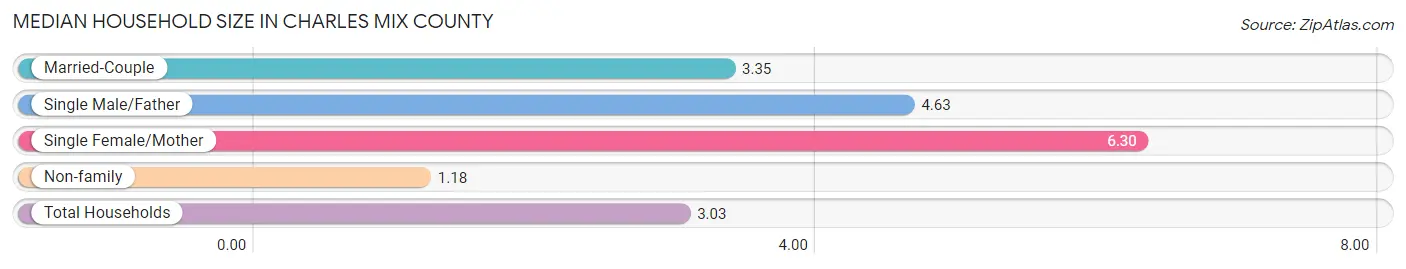
| Household Type | # Households | Household Size |
| Married-Couple | 1,496 (50.5%) | 3.35 |
| Single Male/Father | 186 (6.3%) | 4.63 |
| Single Female/Mother | 311 (10.5%) | 6.30 |
| Non-family | 970 (32.7%) | 1.18 |
| Total Households | 2,963 (100.0%) | 3.03 |
Household Size by Marriage Status in Charles Mix County
Out of a total of 2,963 households in Charles Mix County, 1,993 (67.3%) are family households, while 970 (32.7%) are nonfamily households. The most numerous type of family households are 2-person households, comprising 916, and the most common type of nonfamily households are 1-person households, comprising 878.
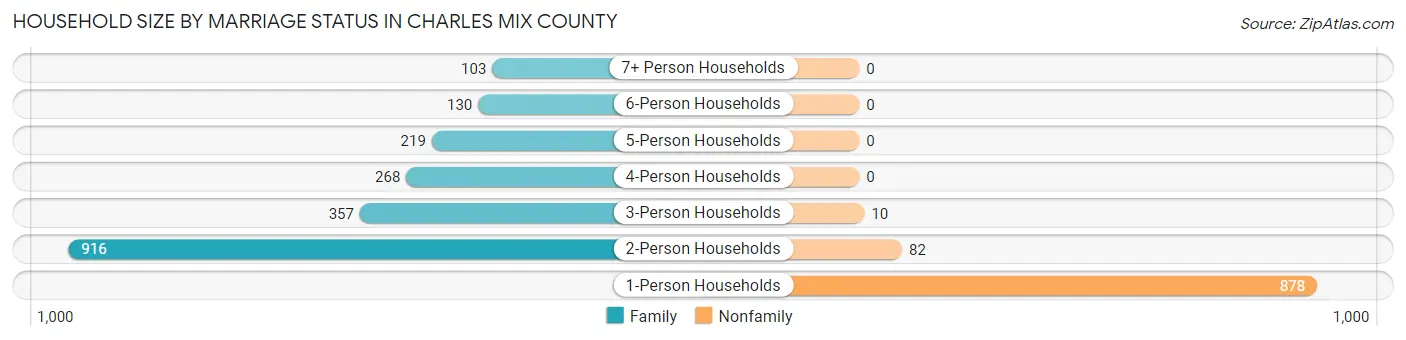
| Household Size | Family Households | Nonfamily Households |
| 1-Person Households | - | 878 (29.6%) |
| 2-Person Households | 916 (30.9%) | 82 (2.8%) |
| 3-Person Households | 357 (12.0%) | 10 (0.3%) |
| 4-Person Households | 268 (9.0%) | 0 (0.0%) |
| 5-Person Households | 219 (7.4%) | 0 (0.0%) |
| 6-Person Households | 130 (4.4%) | 0 (0.0%) |
| 7+ Person Households | 103 (3.5%) | 0 (0.0%) |
| Total | 1,993 (67.3%) | 970 (32.7%) |
Female Fertility in Charles Mix County
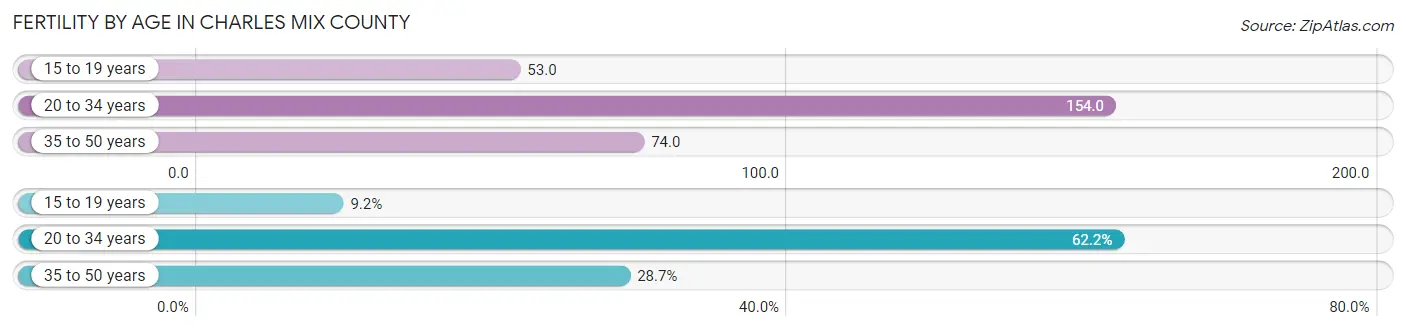
Fertility by Age in Charles Mix County
Average fertility rate in Charles Mix County is 104.0 births per 1,000 women. Women in the age bracket of 20 to 34 years have the highest fertility rate with 154.0 births per 1,000 women. Women in the age bracket of 20 to 34 years acount for 62.2% of all women with births.
| Age Bracket | Women with Births | Births / 1,000 Women |
| 15 to 19 years | 17 (9.2%) | 53.0 |
| 20 to 34 years | 115 (62.2%) | 154.0 |
| 35 to 50 years | 53 (28.6%) | 74.0 |
| Total | 185 (100.0%) | 104.0 |
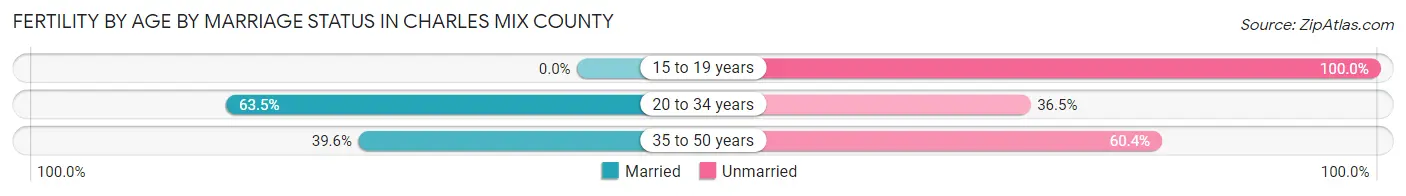
Fertility by Age by Marriage Status in Charles Mix County
50.8% of women with births (185) in Charles Mix County are married. The highest percentage of unmarried women with births falls into 15 to 19 years age bracket with 100.0% of them unmarried at the time of birth, while the lowest percentage of unmarried women with births belong to 20 to 34 years age bracket with 36.5% of them unmarried.
| Age Bracket | Married | Unmarried |
| 15 to 19 years | 0 (0.0%) | 17 (100.0%) |
| 20 to 34 years | 73 (63.5%) | 42 (36.5%) |
| 35 to 50 years | 21 (39.6%) | 32 (60.4%) |
| Total | 94 (50.8%) | 91 (49.2%) |
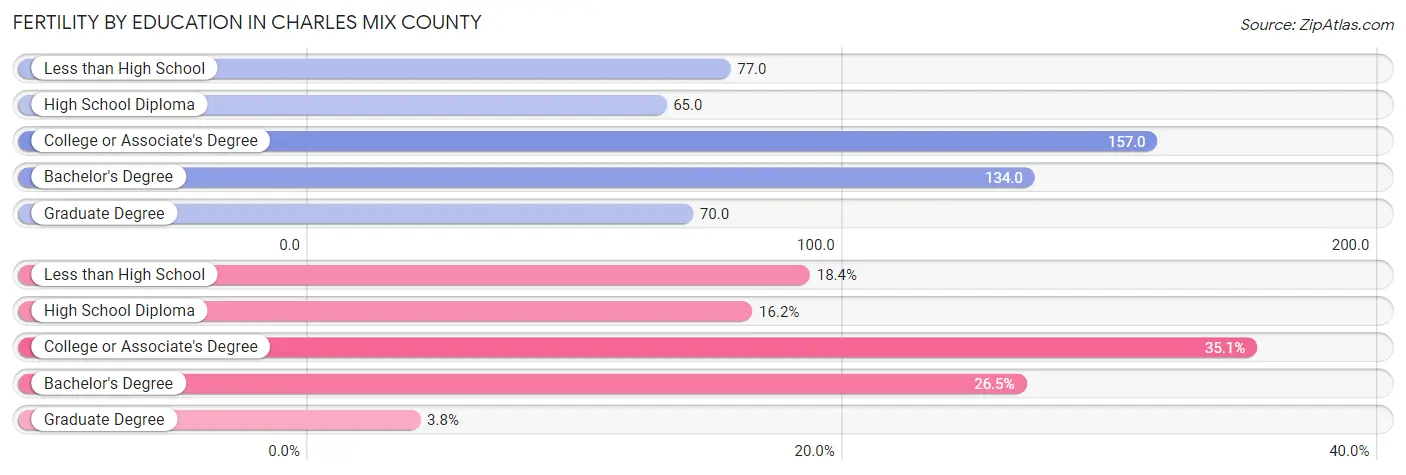
Fertility by Education in Charles Mix County
Average fertility rate in Charles Mix County is 104.0 births per 1,000 women. Women with the education attainment of college or associate's degree have the highest fertility rate of 157.0 births per 1,000 women, while women with the education attainment of high school diploma have the lowest fertility at 65.0 births per 1,000 women. Women with the education attainment of college or associate's degree represent 35.1% of all women with births.
| Educational Attainment | Women with Births | Births / 1,000 Women |
| Less than High School | 34 (18.4%) | 77.0 |
| High School Diploma | 30 (16.2%) | 65.0 |
| College or Associate's Degree | 65 (35.1%) | 157.0 |
| Bachelor's Degree | 49 (26.5%) | 134.0 |
| Graduate Degree | 7 (3.8%) | 70.0 |
| Total | 185 (100.0%) | 104.0 |
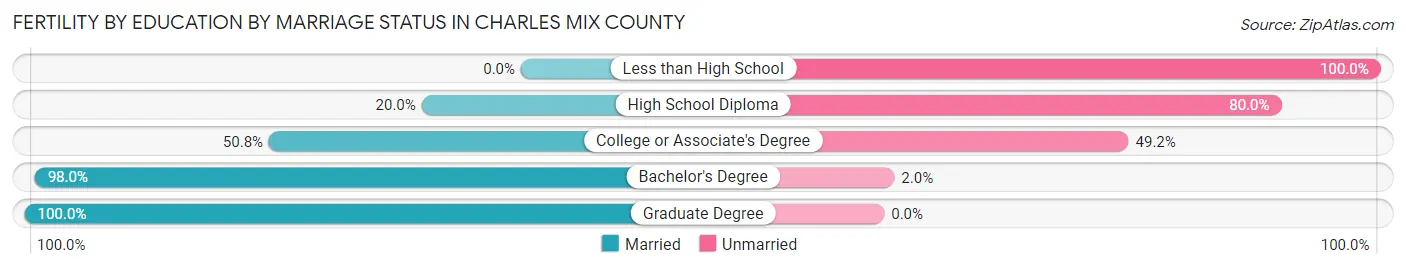
Fertility by Education by Marriage Status in Charles Mix County
49.2% of women with births in Charles Mix County are unmarried. Women with the educational attainment of graduate degree are most likely to be married with 100.0% of them married at childbirth, while women with the educational attainment of less than high school are least likely to be married with 100.0% of them unmarried at childbirth.
| Educational Attainment | Married | Unmarried |
| Less than High School | 0 (0.0%) | 34 (100.0%) |
| High School Diploma | 6 (20.0%) | 24 (80.0%) |
| College or Associate's Degree | 33 (50.8%) | 32 (49.2%) |
| Bachelor's Degree | 48 (98.0%) | 1 (2.0%) |
| Graduate Degree | 7 (100.0%) | 0 (0.0%) |
| Total | 94 (50.8%) | 91 (49.2%) |
Income in Charles Mix County
Income Overview in Charles Mix County
Per Capita Income in Charles Mix County is $27,034, while median incomes of families and households are $72,837 and $60,729 respectively.
| Characteristic | Number | Measure |
| Per Capita Income | 9,302 | $27,034 |
| Median Family Income | 1,993 | $72,837 |
| Mean Family Income | 1,993 | $89,034 |
| Median Household Income | 2,963 | $60,729 |
| Mean Household Income | 2,963 | $76,768 |
| Income Deficit | 1,993 | $16,365 |
| Wage / Income Gap (%) | 9,302 | 27.21% |
| Wage / Income Gap ($) | 9,302 | 72.79¢ per $1 |
| Gini / Inequality Index | 9,302 | 0.45 |
Earnings by Sex in Charles Mix County
Average Earnings in Charles Mix County are $33,917, $37,879 for men and $27,574 for women, a difference of 27.2%.
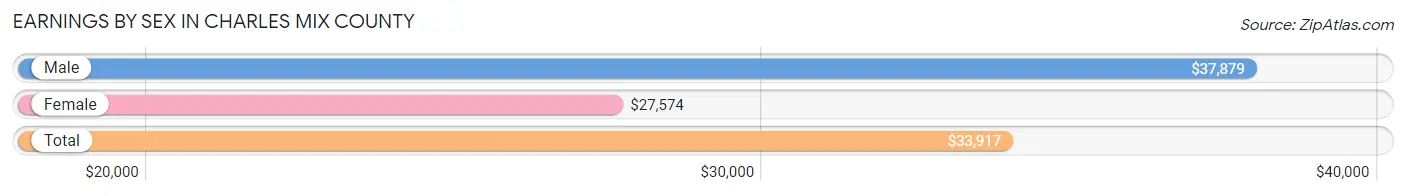
| Sex | Number | Average Earnings |
| Male | 2,339 (52.6%) | $37,879 |
| Female | 2,109 (47.4%) | $27,574 |
| Total | 4,448 (100.0%) | $33,917 |
Earnings by Sex by Income Bracket in Charles Mix County
The most common earnings brackets in Charles Mix County are $100,000+ for men (208 | 8.9%) and $2,499 or less for women (216 | 10.2%).
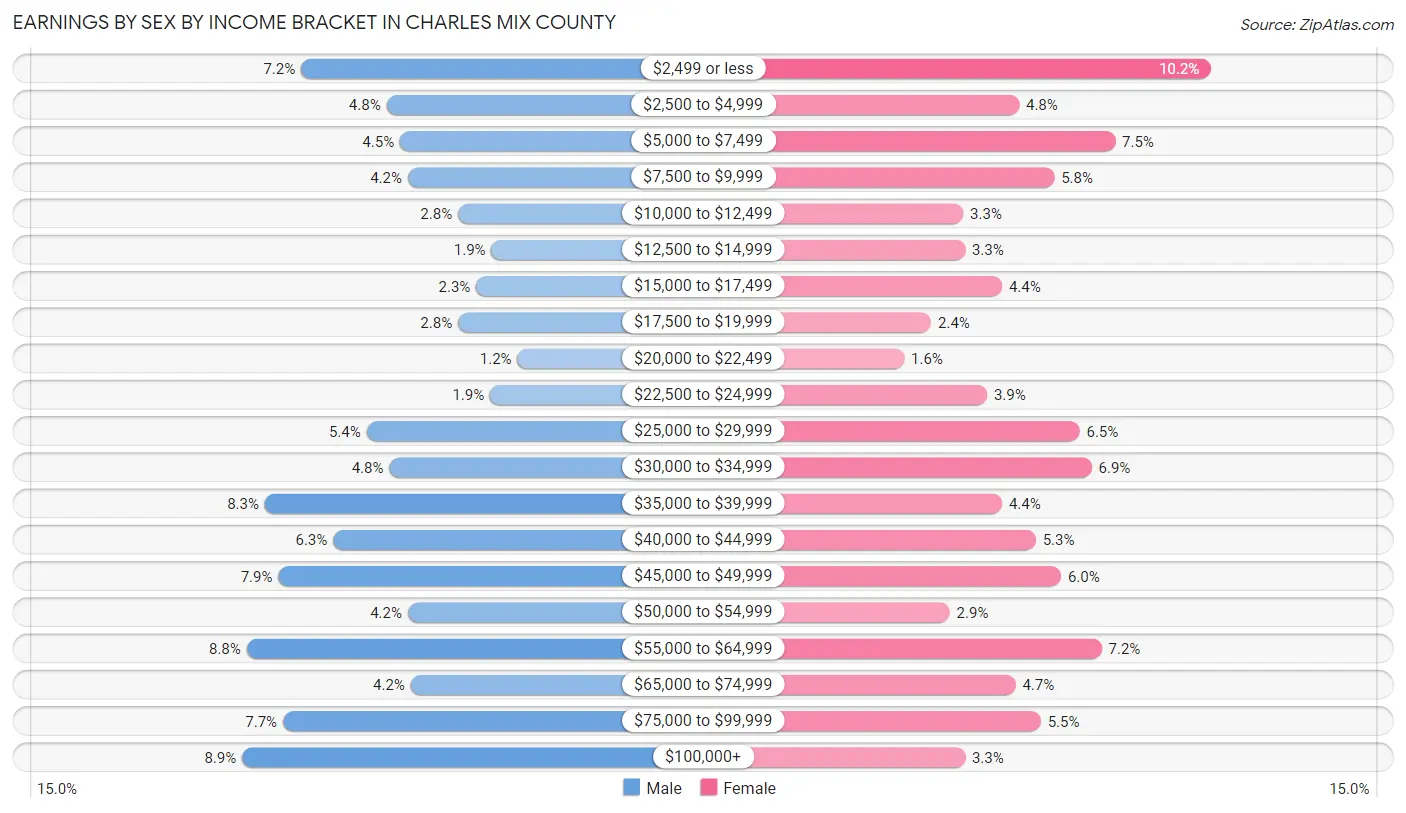
| Income | Male | Female |
| $2,499 or less | 169 (7.2%) | 216 (10.2%) |
| $2,500 to $4,999 | 113 (4.8%) | 102 (4.8%) |
| $5,000 to $7,499 | 104 (4.4%) | 159 (7.5%) |
| $7,500 to $9,999 | 99 (4.2%) | 123 (5.8%) |
| $10,000 to $12,499 | 66 (2.8%) | 69 (3.3%) |
| $12,500 to $14,999 | 44 (1.9%) | 70 (3.3%) |
| $15,000 to $17,499 | 54 (2.3%) | 92 (4.4%) |
| $17,500 to $19,999 | 66 (2.8%) | 50 (2.4%) |
| $20,000 to $22,499 | 27 (1.1%) | 34 (1.6%) |
| $22,500 to $24,999 | 45 (1.9%) | 83 (3.9%) |
| $25,000 to $29,999 | 126 (5.4%) | 138 (6.5%) |
| $30,000 to $34,999 | 111 (4.8%) | 145 (6.9%) |
| $35,000 to $39,999 | 193 (8.3%) | 92 (4.4%) |
| $40,000 to $44,999 | 148 (6.3%) | 112 (5.3%) |
| $45,000 to $49,999 | 184 (7.9%) | 127 (6.0%) |
| $50,000 to $54,999 | 99 (4.2%) | 61 (2.9%) |
| $55,000 to $64,999 | 205 (8.8%) | 151 (7.2%) |
| $65,000 to $74,999 | 97 (4.2%) | 100 (4.7%) |
| $75,000 to $99,999 | 181 (7.7%) | 115 (5.4%) |
| $100,000+ | 208 (8.9%) | 70 (3.3%) |
| Total | 2,339 (100.0%) | 2,109 (100.0%) |
Earnings by Sex by Educational Attainment in Charles Mix County
Average earnings in Charles Mix County are $42,466 for men and $33,186 for women, a difference of 21.8%. Men with an educational attainment of graduate degree enjoy the highest average annual earnings of $63,750, while those with less than high school education earn the least with $25,000. Women with an educational attainment of graduate degree earn the most with the average annual earnings of $59,135, while those with high school diploma education have the smallest earnings of $24,119.
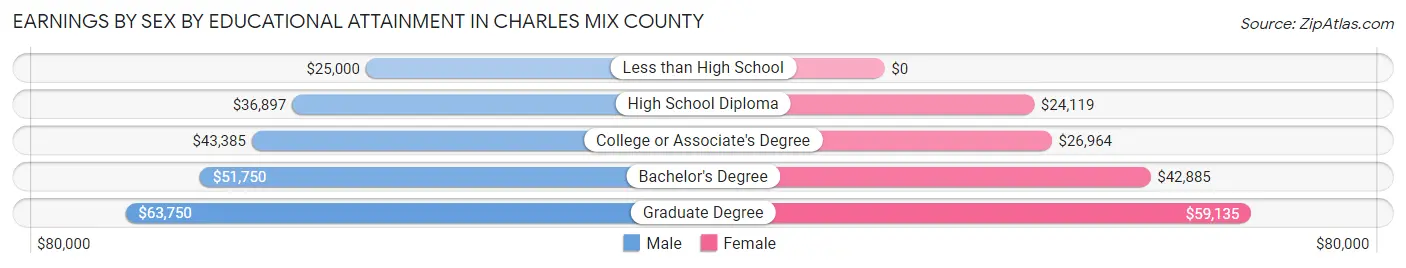
| Educational Attainment | Male Income | Female Income |
| Less than High School | $25,000 | $0 |
| High School Diploma | $36,897 | $24,119 |
| College or Associate's Degree | $43,385 | $26,964 |
| Bachelor's Degree | $51,750 | $42,885 |
| Graduate Degree | $63,750 | $59,135 |
| Total | $42,466 | $33,186 |
Family Income in Charles Mix County
Family Income Brackets in Charles Mix County
According to the Charles Mix County family income data, there are 403 families falling into the $50,000 to $74,999 income range, which is the most common income bracket and makes up 20.2% of all families. Conversely, the $200,000+ income bracket is the least frequent group with only 94 families (4.7%) belonging to this category.
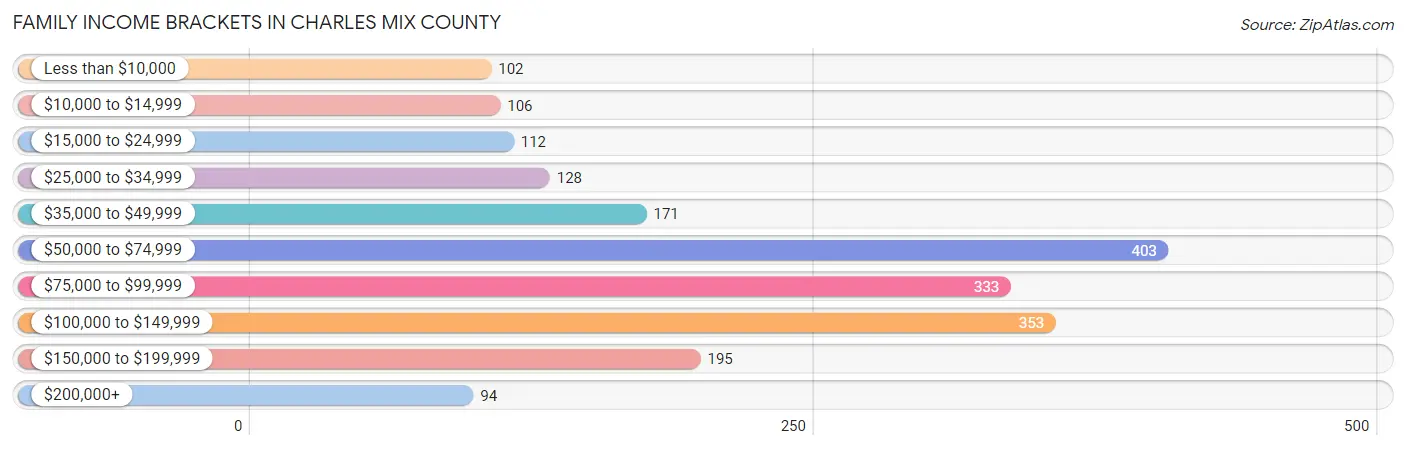
| Income Bracket | # Families | % Families |
| Less than $10,000 | 102 | 5.1% |
| $10,000 to $14,999 | 106 | 5.3% |
| $15,000 to $24,999 | 112 | 5.6% |
| $25,000 to $34,999 | 128 | 6.4% |
| $35,000 to $49,999 | 171 | 8.6% |
| $50,000 to $74,999 | 403 | 20.2% |
| $75,000 to $99,999 | 333 | 16.7% |
| $100,000 to $149,999 | 353 | 17.7% |
| $150,000 to $199,999 | 195 | 9.8% |
| $200,000+ | 94 | 4.7% |
Family Income by Famaliy Size in Charles Mix County
4-person families (277 | 13.9%) account for the highest median family income in Charles Mix County with $92,679 per family, while 2-person families (954 | 47.9%) have the highest median income of $39,000 per family member.
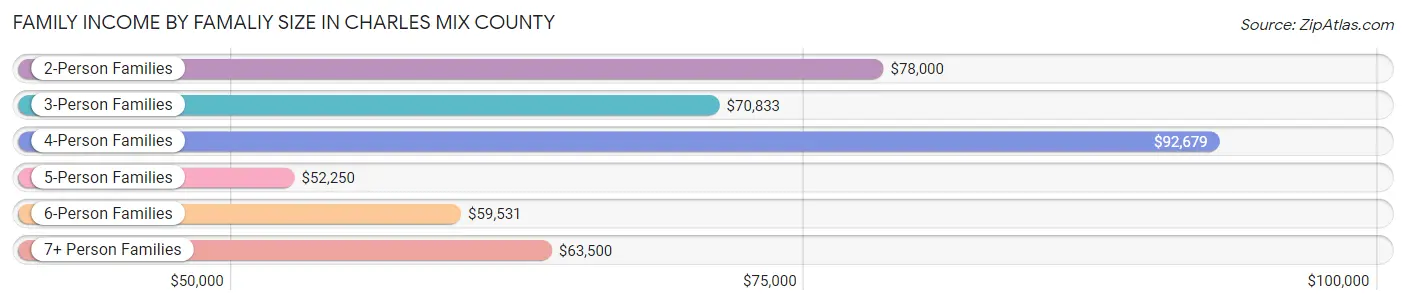
| Income Bracket | # Families | Median Income |
| 2-Person Families | 954 (47.9%) | $78,000 |
| 3-Person Families | 362 (18.2%) | $70,833 |
| 4-Person Families | 277 (13.9%) | $92,679 |
| 5-Person Families | 203 (10.2%) | $52,250 |
| 6-Person Families | 119 (6.0%) | $59,531 |
| 7+ Person Families | 78 (3.9%) | $63,500 |
| Total | 1,993 (100.0%) | $72,837 |
Family Income by Number of Earners in Charles Mix County
The median family income in Charles Mix County is $72,837, with families comprising 3+ earners (228) having the highest median family income of $99,167, while families with no earners (306) have the lowest median family income of $39,583, accounting for 11.4% and 15.3% of families, respectively.
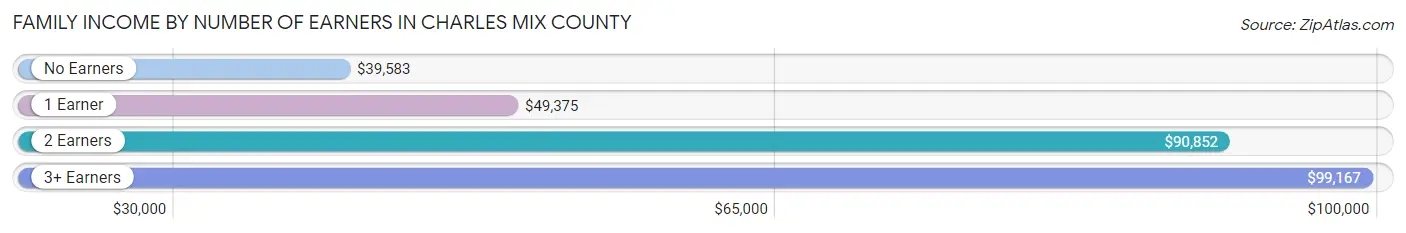
| Number of Earners | # Families | Median Income |
| No Earners | 306 (15.3%) | $39,583 |
| 1 Earner | 456 (22.9%) | $49,375 |
| 2 Earners | 1,003 (50.3%) | $90,852 |
| 3+ Earners | 228 (11.4%) | $99,167 |
| Total | 1,993 (100.0%) | $72,837 |
Household Income in Charles Mix County
Household Income Brackets in Charles Mix County
With 590 households falling in the category, the $50,000 to $74,999 income range is the most frequent in Charles Mix County, accounting for 19.9% of all households. In contrast, only 124 households (4.2%) fall into the $200,000+ income bracket, making it the least populous group.
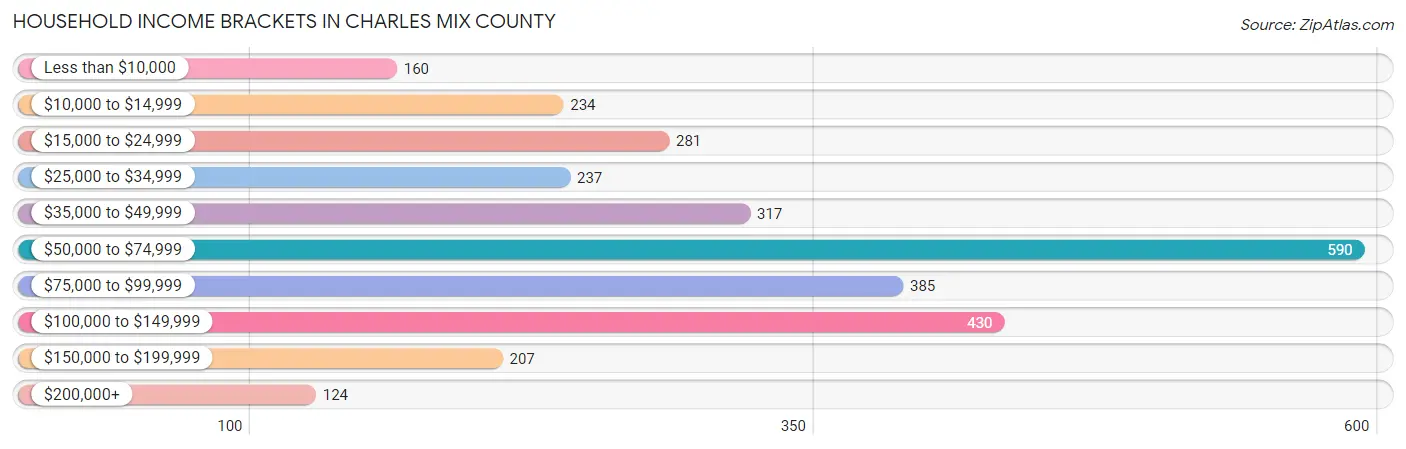
| Income Bracket | # Households | % Households |
| Less than $10,000 | 160 | 5.4% |
| $10,000 to $14,999 | 234 | 7.9% |
| $15,000 to $24,999 | 281 | 9.5% |
| $25,000 to $34,999 | 237 | 8.0% |
| $35,000 to $49,999 | 317 | 10.7% |
| $50,000 to $74,999 | 590 | 19.9% |
| $75,000 to $99,999 | 385 | 13.0% |
| $100,000 to $149,999 | 430 | 14.5% |
| $150,000 to $199,999 | 207 | 7.0% |
| $200,000+ | 124 | 4.2% |
Household Income by Householder Age in Charles Mix County
The median household income in Charles Mix County is $60,729, with the highest median household income of $68,875 found in the 45 to 64 years age bracket for the primary householder. A total of 1,053 households (35.5%) fall into this category. Meanwhile, the 15 to 24 years age bracket for the primary householder has the lowest median household income of $26,111, with 80 households (2.7%) in this group.
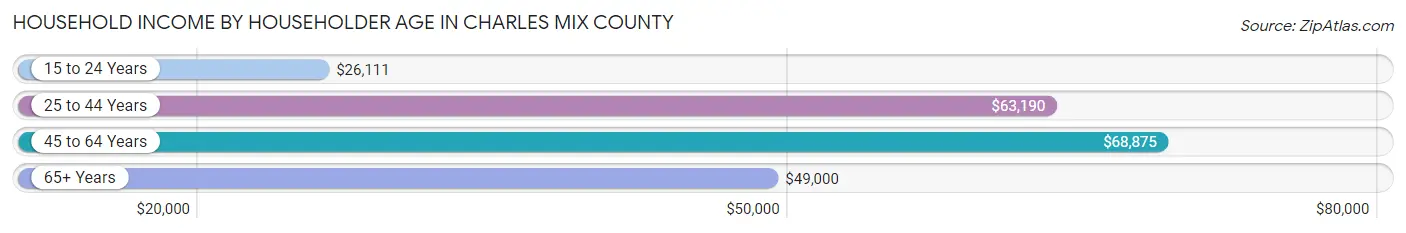
| Income Bracket | # Households | Median Income |
| 15 to 24 Years | 80 (2.7%) | $26,111 |
| 25 to 44 Years | 810 (27.3%) | $63,190 |
| 45 to 64 Years | 1,053 (35.5%) | $68,875 |
| 65+ Years | 1,020 (34.4%) | $49,000 |
| Total | 2,963 (100.0%) | $60,729 |
Poverty in Charles Mix County
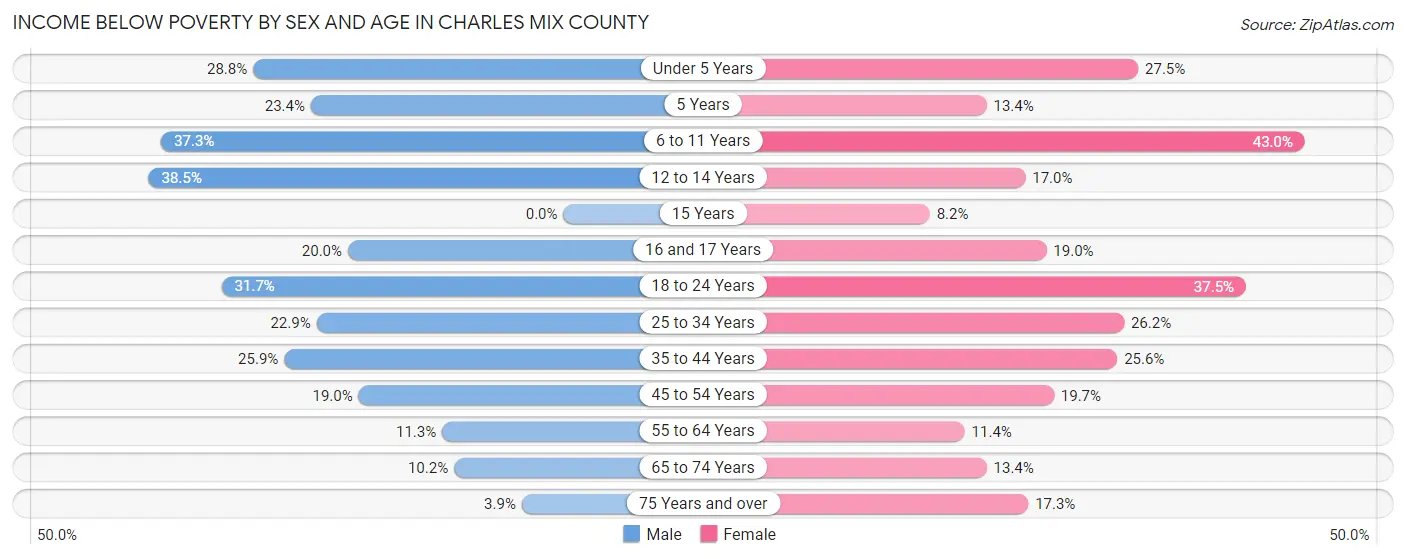
Income Below Poverty by Sex and Age in Charles Mix County
With 22.1% poverty level for males and 23.6% for females among the residents of Charles Mix County, 12 to 14 year old males and 6 to 11 year old females are the most vulnerable to poverty, with 72 males (38.5%) and 217 females (43.0%) in their respective age groups living below the poverty level.
| Age Bracket | Male | Female |
| Under 5 Years | 106 (28.8%) | 110 (27.5%) |
| 5 Years | 15 (23.4%) | 9 (13.4%) |
| 6 to 11 Years | 202 (37.3%) | 217 (43.0%) |
| 12 to 14 Years | 72 (38.5%) | 39 (17.0%) |
| 15 Years | 0 (0.0%) | 4 (8.2%) |
| 16 and 17 Years | 35 (20.0%) | 30 (19.0%) |
| 18 to 24 Years | 125 (31.7%) | 144 (37.5%) |
| 25 to 34 Years | 107 (22.9%) | 121 (26.2%) |
| 35 to 44 Years | 121 (25.9%) | 114 (25.6%) |
| 45 to 54 Years | 88 (19.0%) | 85 (19.7%) |
| 55 to 64 Years | 67 (11.3%) | 65 (11.4%) |
| 65 to 74 Years | 46 (10.2%) | 57 (13.4%) |
| 75 Years and over | 11 (3.9%) | 59 (17.3%) |
| Total | 995 (22.1%) | 1,054 (23.6%) |
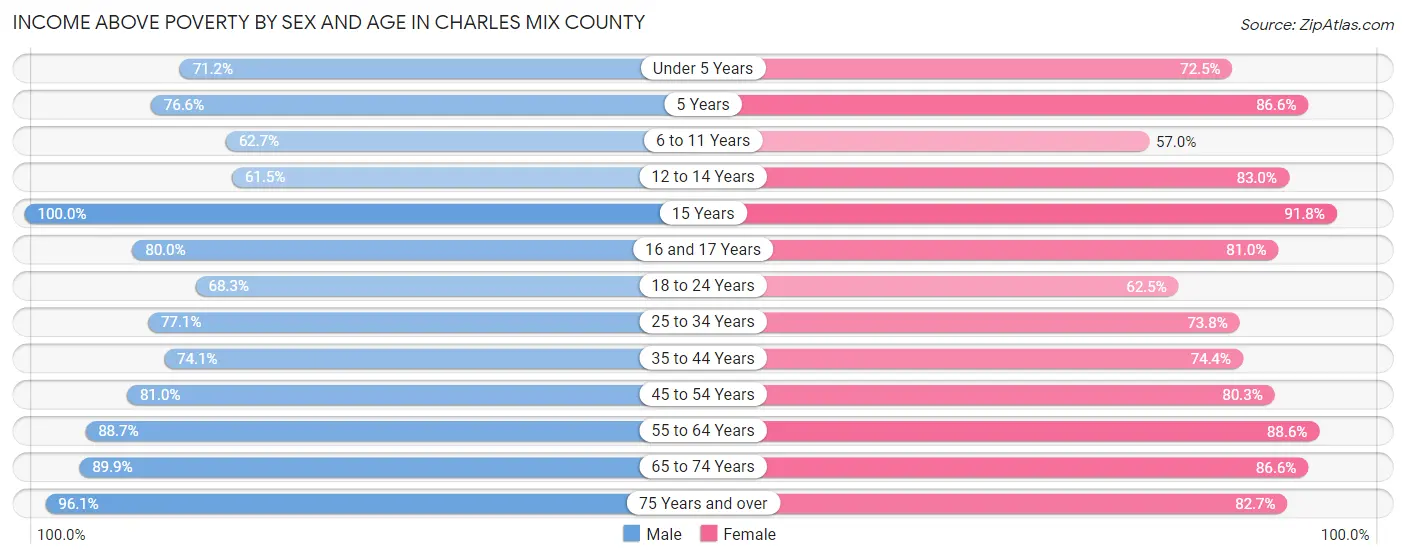
Income Above Poverty by Sex and Age in Charles Mix County
According to the poverty statistics in Charles Mix County, males aged 15 years and females aged 15 years are the age groups that are most secure financially, with 100.0% of males and 91.8% of females in these age groups living above the poverty line.
| Age Bracket | Male | Female |
| Under 5 Years | 262 (71.2%) | 290 (72.5%) |
| 5 Years | 49 (76.6%) | 58 (86.6%) |
| 6 to 11 Years | 339 (62.7%) | 288 (57.0%) |
| 12 to 14 Years | 115 (61.5%) | 190 (83.0%) |
| 15 Years | 35 (100.0%) | 45 (91.8%) |
| 16 and 17 Years | 140 (80.0%) | 128 (81.0%) |
| 18 to 24 Years | 269 (68.3%) | 240 (62.5%) |
| 25 to 34 Years | 360 (77.1%) | 341 (73.8%) |
| 35 to 44 Years | 346 (74.1%) | 332 (74.4%) |
| 45 to 54 Years | 375 (81.0%) | 347 (80.3%) |
| 55 to 64 Years | 528 (88.7%) | 505 (88.6%) |
| 65 to 74 Years | 407 (89.8%) | 367 (86.6%) |
| 75 Years and over | 274 (96.1%) | 282 (82.7%) |
| Total | 3,499 (77.9%) | 3,413 (76.4%) |
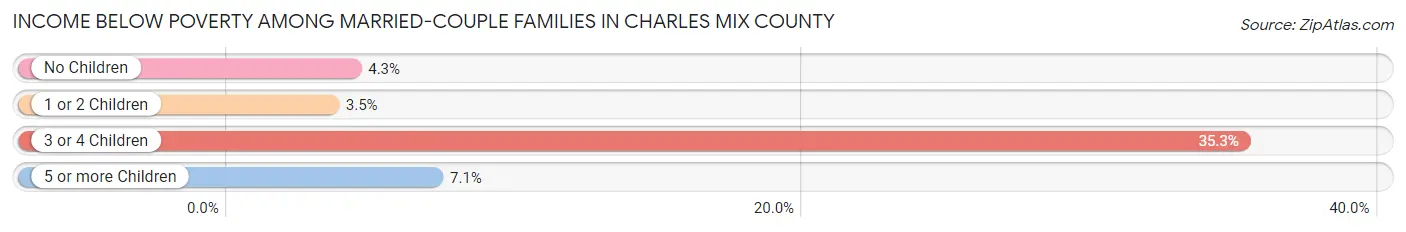
Income Below Poverty Among Married-Couple Families in Charles Mix County
The poverty statistics for married-couple families in Charles Mix County show that 7.7% or 115 of the total 1,496 families live below the poverty line. Families with 3 or 4 children have the highest poverty rate of 35.3%, comprising of 61 families. On the other hand, families with 1 or 2 children have the lowest poverty rate of 3.5%, which includes 14 families.
| Children | Above Poverty | Below Poverty |
| No Children | 871 (95.7%) | 39 (4.3%) |
| 1 or 2 Children | 385 (96.5%) | 14 (3.5%) |
| 3 or 4 Children | 112 (64.7%) | 61 (35.3%) |
| 5 or more Children | 13 (92.9%) | 1 (7.1%) |
| Total | 1,381 (92.3%) | 115 (7.7%) |
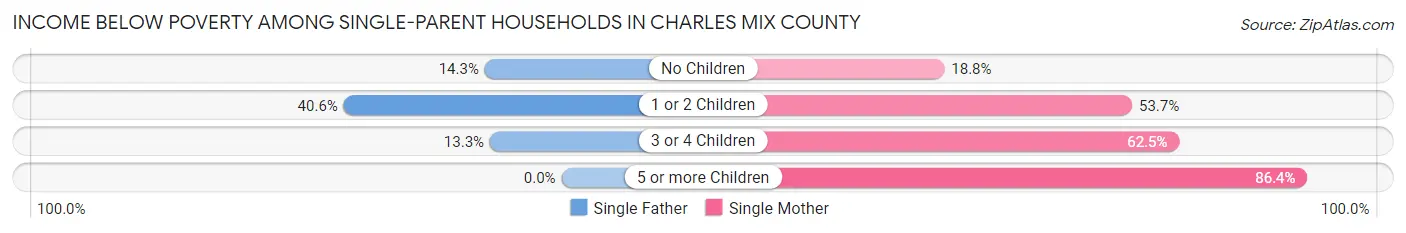
Income Below Poverty Among Single-Parent Households in Charles Mix County
According to the poverty data in Charles Mix County, 29.0% or 54 single-father households and 49.5% or 154 single-mother households are living below the poverty line. Among single-father households, those with 1 or 2 children have the highest poverty rate, with 43 households (40.6%) experiencing poverty. Likewise, among single-mother households, those with 5 or more children have the highest poverty rate, with 19 households (86.4%) falling below the poverty line.
| Children | Single Father | Single Mother |
| No Children | 5 (14.3%) | 15 (18.8%) |
| 1 or 2 Children | 43 (40.6%) | 65 (53.7%) |
| 3 or 4 Children | 6 (13.3%) | 55 (62.5%) |
| 5 or more Children | 0 (0.0%) | 19 (86.4%) |
| Total | 54 (29.0%) | 154 (49.5%) |
Income Below Poverty Among Married-Couple vs Single-Parent Households in Charles Mix County
The poverty data for Charles Mix County shows that 115 of the married-couple family households (7.7%) and 208 of the single-parent households (41.8%) are living below the poverty level. Within the married-couple family households, those with 3 or 4 children have the highest poverty rate, with 61 households (35.3%) falling below the poverty line. Among the single-parent households, those with 5 or more children have the highest poverty rate, with 19 household (86.4%) living below poverty.
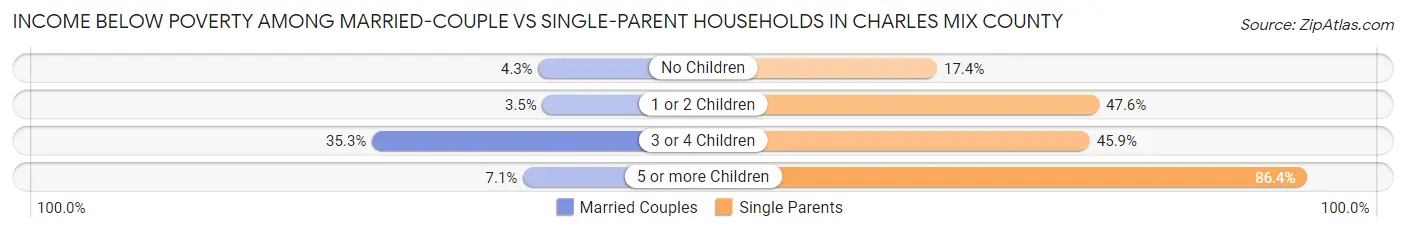
| Children | Married-Couple Families | Single-Parent Households |
| No Children | 39 (4.3%) | 20 (17.4%) |
| 1 or 2 Children | 14 (3.5%) | 108 (47.6%) |
| 3 or 4 Children | 61 (35.3%) | 61 (45.9%) |
| 5 or more Children | 1 (7.1%) | 19 (86.4%) |
| Total | 115 (7.7%) | 208 (41.8%) |
Employment Characteristics in Charles Mix County
Employment by Class of Employer in Charles Mix County
Among the 3,780 employed individuals in Charles Mix County, private company employees (1,561 | 41.3%), self-employed (not incorporated) (669 | 17.7%), and local government employees (420 | 11.1%) make up the most common classes of employment.
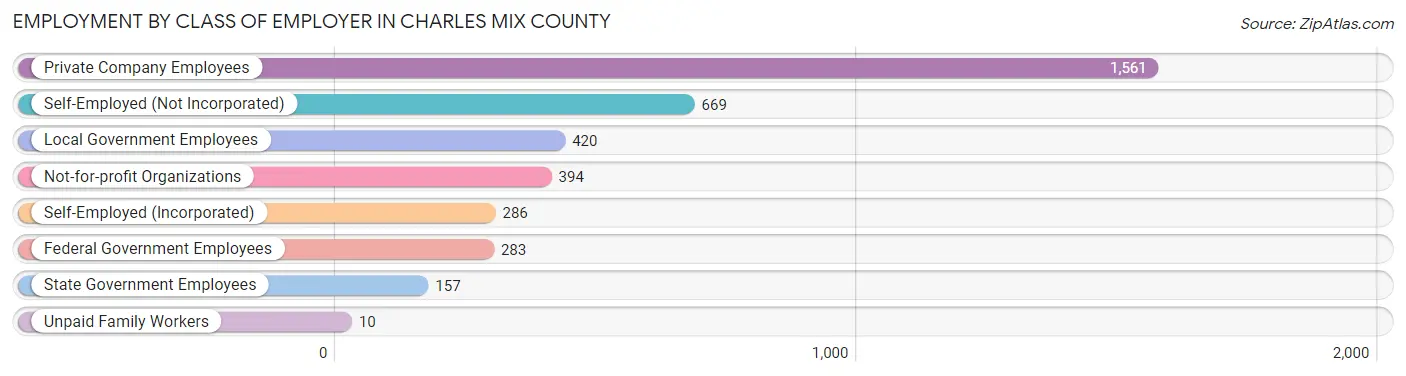
| Employer Class | # Employees | % Employees |
| Private Company Employees | 1,561 | 41.3% |
| Self-Employed (Incorporated) | 286 | 7.6% |
| Self-Employed (Not Incorporated) | 669 | 17.7% |
| Not-for-profit Organizations | 394 | 10.4% |
| Local Government Employees | 420 | 11.1% |
| State Government Employees | 157 | 4.2% |
| Federal Government Employees | 283 | 7.5% |
| Unpaid Family Workers | 10 | 0.3% |
| Total | 3,780 | 100.0% |
Employment Status by Age in Charles Mix County
According to the labor force statistics for Charles Mix County, out of the total population over 16 years of age (6,779), 61.2% or 4,149 individuals are in the labor force, with 7.1% or 295 of them unemployed. The age group with the highest labor force participation rate is 35 to 44 years, with 88.6% or 826 individuals in the labor force. Within the labor force, the 20 to 24 years age range has the highest percentage of unemployed individuals, with 27.9% or 94 of them being unemployed.
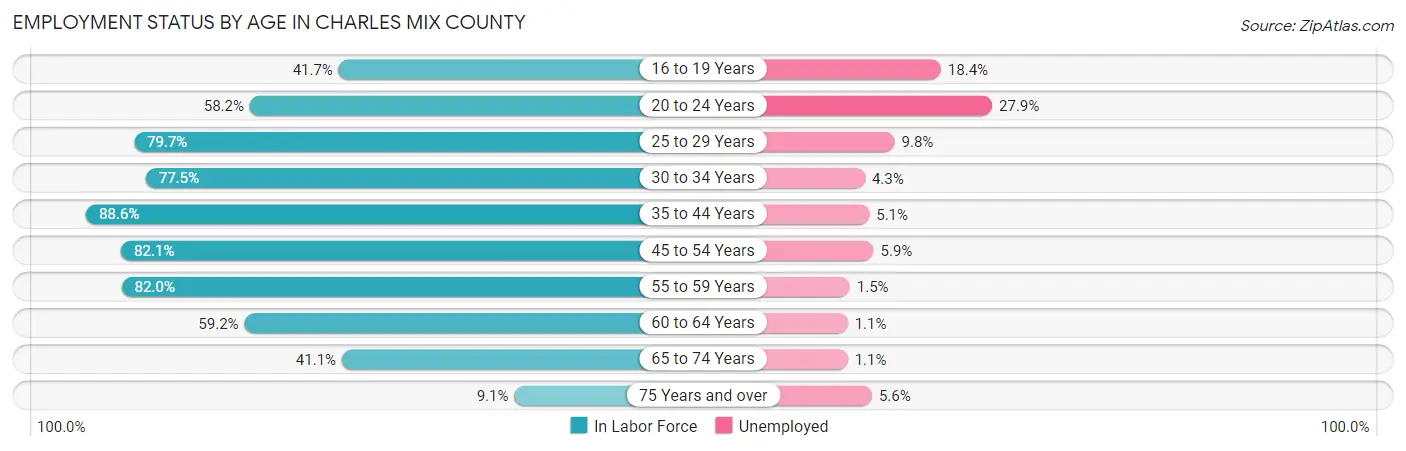
| Age Bracket | In Labor Force | Unemployed |
| 16 to 19 Years | 228 (41.7%) | 42 (18.4%) |
| 20 to 24 Years | 336 (58.2%) | 94 (27.9%) |
| 25 to 29 Years | 396 (79.7%) | 39 (9.8%) |
| 30 to 34 Years | 347 (77.5%) | 15 (4.3%) |
| 35 to 44 Years | 826 (88.6%) | 42 (5.1%) |
| 45 to 54 Years | 744 (82.1%) | 44 (5.9%) |
| 55 to 59 Years | 473 (82.0%) | 7 (1.5%) |
| 60 to 64 Years | 358 (59.2%) | 4 (1.1%) |
| 65 to 74 Years | 371 (41.1%) | 4 (1.1%) |
| 75 Years and over | 72 (9.1%) | 4 (5.6%) |
| Total | 4,149 (61.2%) | 295 (7.1%) |
Employment Status by Educational Attainment in Charles Mix County
According to labor force statistics for Charles Mix County, 79.3% of individuals (3,144) out of the total population between 25 and 64 years of age (3,965) are in the labor force, with 4.8% or 151 of them being unemployed. The group with the highest labor force participation rate are those with the educational attainment of bachelor's degree or higher, with 93.2% or 1,021 individuals in the labor force. Within the labor force, individuals with less than high school education have the highest percentage of unemployment, with 30.2% or 55 of them being unemployed.
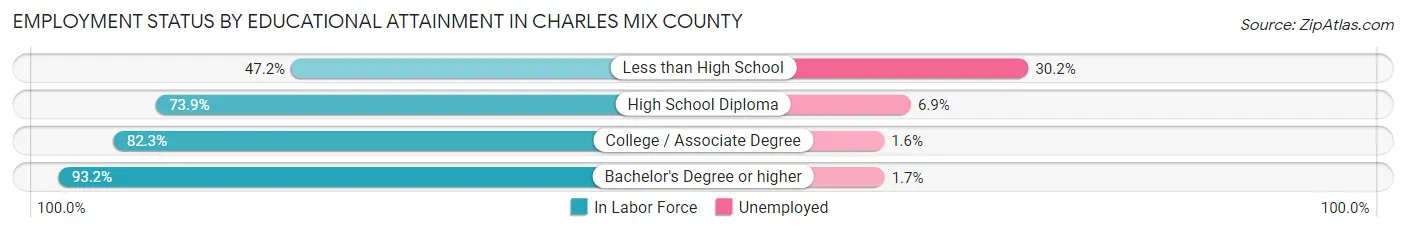
| Educational Attainment | In Labor Force | Unemployed |
| Less than High School | 182 (47.2%) | 117 (30.2%) |
| High School Diploma | 907 (73.9%) | 85 (6.9%) |
| College / Associate Degree | 1,034 (82.3%) | 20 (1.6%) |
| Bachelor's Degree or higher | 1,021 (93.2%) | 19 (1.7%) |
| Total | 3,144 (79.3%) | 190 (4.8%) |
Employment Occupations by Sex in Charles Mix County
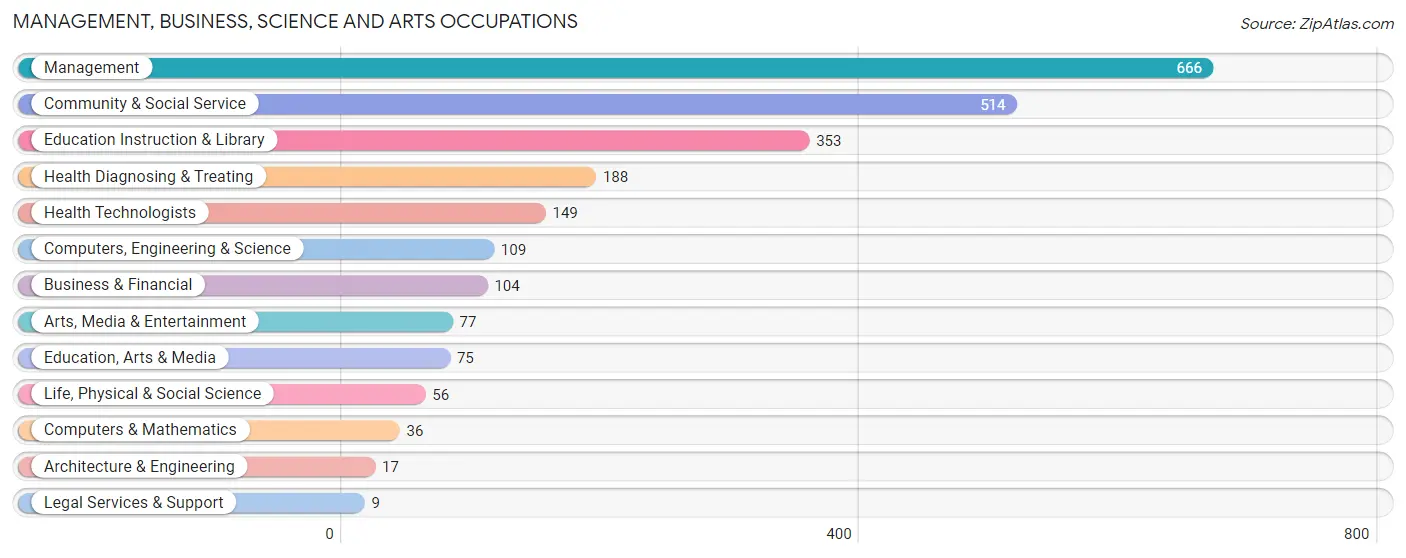
Management, Business, Science and Arts Occupations
The most common Management, Business, Science and Arts occupations in Charles Mix County are Management (666 | 17.3%), Community & Social Service (514 | 13.4%), Education Instruction & Library (353 | 9.2%), Health Diagnosing & Treating (188 | 4.9%), and Health Technologists (149 | 3.9%).
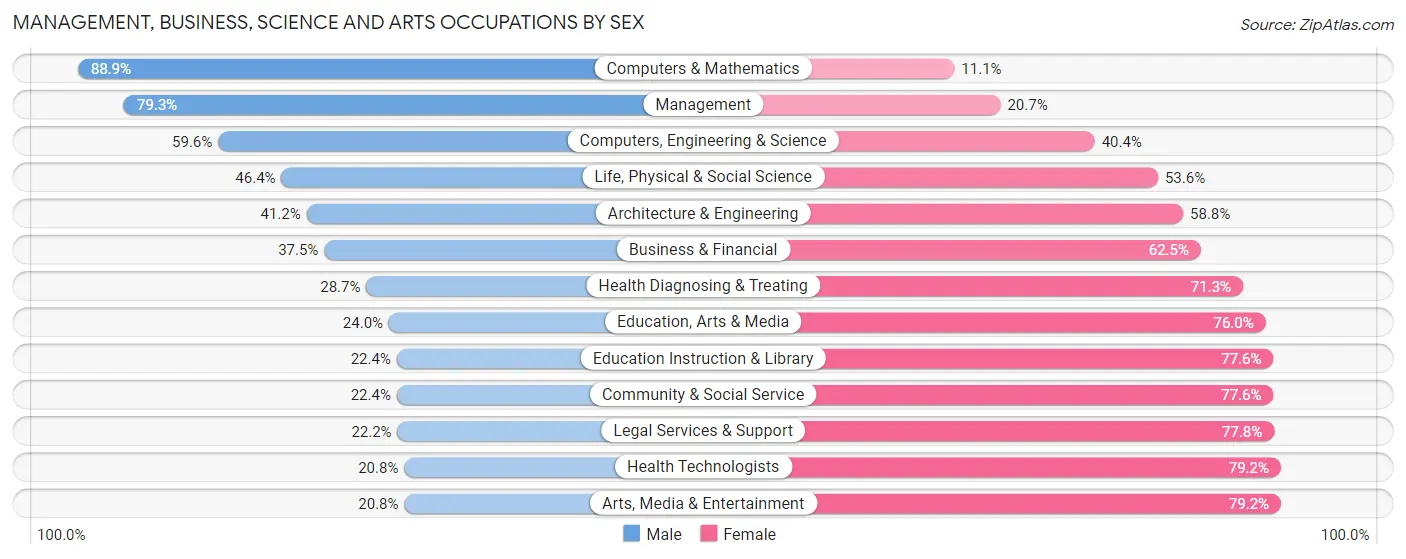
Management, Business, Science and Arts Occupations by Sex
Within the Management, Business, Science and Arts occupations in Charles Mix County, the most male-oriented occupations are Computers & Mathematics (88.9%), Management (79.3%), and Computers, Engineering & Science (59.6%), while the most female-oriented occupations are Arts, Media & Entertainment (79.2%), Health Technologists (79.2%), and Legal Services & Support (77.8%).
| Occupation | Male | Female |
| Management | 528 (79.3%) | 138 (20.7%) |
| Business & Financial | 39 (37.5%) | 65 (62.5%) |
| Computers, Engineering & Science | 65 (59.6%) | 44 (40.4%) |
| Computers & Mathematics | 32 (88.9%) | 4 (11.1%) |
| Architecture & Engineering | 7 (41.2%) | 10 (58.8%) |
| Life, Physical & Social Science | 26 (46.4%) | 30 (53.6%) |
| Community & Social Service | 115 (22.4%) | 399 (77.6%) |
| Education, Arts & Media | 18 (24.0%) | 57 (76.0%) |
| Legal Services & Support | 2 (22.2%) | 7 (77.8%) |
| Education Instruction & Library | 79 (22.4%) | 274 (77.6%) |
| Arts, Media & Entertainment | 16 (20.8%) | 61 (79.2%) |
| Health Diagnosing & Treating | 54 (28.7%) | 134 (71.3%) |
| Health Technologists | 31 (20.8%) | 118 (79.2%) |
| Total (Category) | 801 (50.7%) | 780 (49.3%) |
| Total (Overall) | 2,003 (52.0%) | 1,846 (48.0%) |
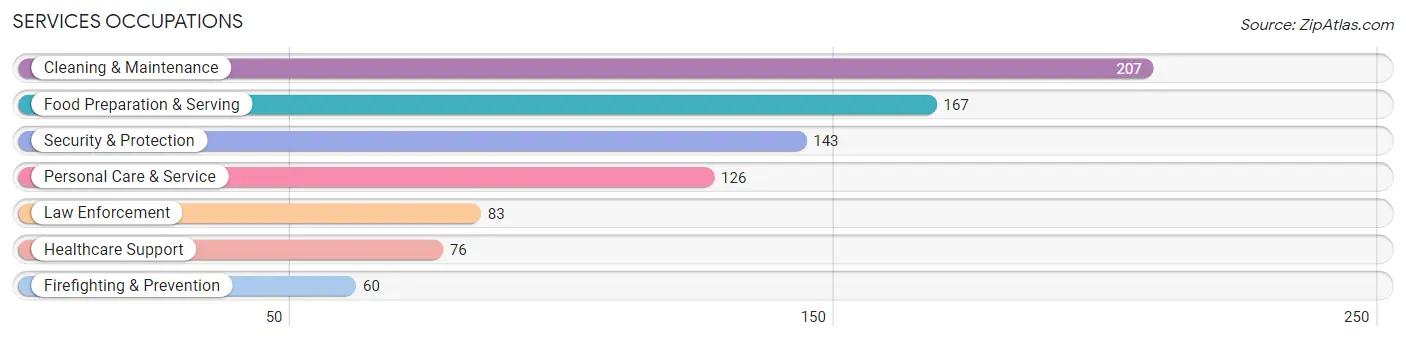
Services Occupations
The most common Services occupations in Charles Mix County are Cleaning & Maintenance (207 | 5.4%), Food Preparation & Serving (167 | 4.3%), Security & Protection (143 | 3.7%), Personal Care & Service (126 | 3.3%), and Law Enforcement (83 | 2.2%).
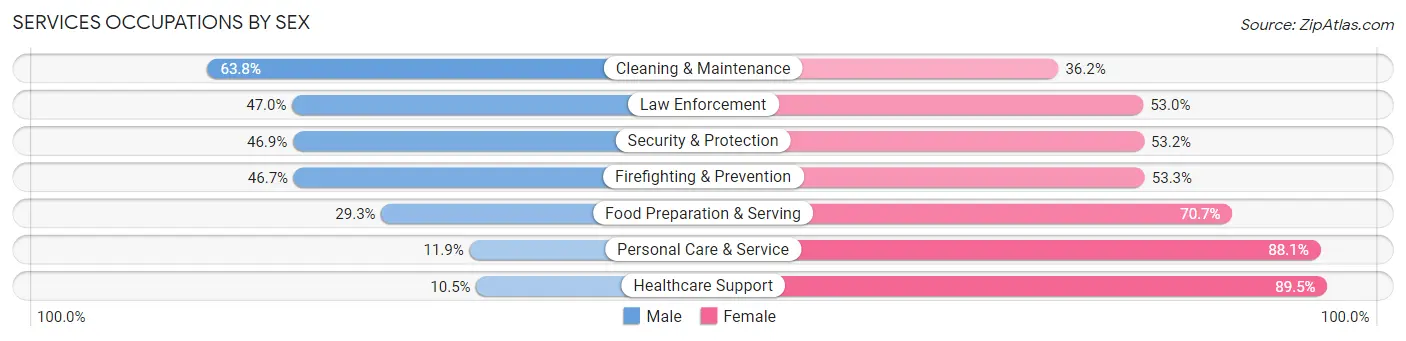
Services Occupations by Sex
Within the Services occupations in Charles Mix County, the most male-oriented occupations are Cleaning & Maintenance (63.8%), Law Enforcement (47.0%), and Security & Protection (46.9%), while the most female-oriented occupations are Healthcare Support (89.5%), Personal Care & Service (88.1%), and Food Preparation & Serving (70.7%).
| Occupation | Male | Female |
| Healthcare Support | 8 (10.5%) | 68 (89.5%) |
| Security & Protection | 67 (46.9%) | 76 (53.1%) |
| Firefighting & Prevention | 28 (46.7%) | 32 (53.3%) |
| Law Enforcement | 39 (47.0%) | 44 (53.0%) |
| Food Preparation & Serving | 49 (29.3%) | 118 (70.7%) |
| Cleaning & Maintenance | 132 (63.8%) | 75 (36.2%) |
| Personal Care & Service | 15 (11.9%) | 111 (88.1%) |
| Total (Category) | 271 (37.7%) | 448 (62.3%) |
| Total (Overall) | 2,003 (52.0%) | 1,846 (48.0%) |
Sales and Office Occupations
The most common Sales and Office occupations in Charles Mix County are Office & Administration (451 | 11.7%), and Sales & Related (316 | 8.2%).
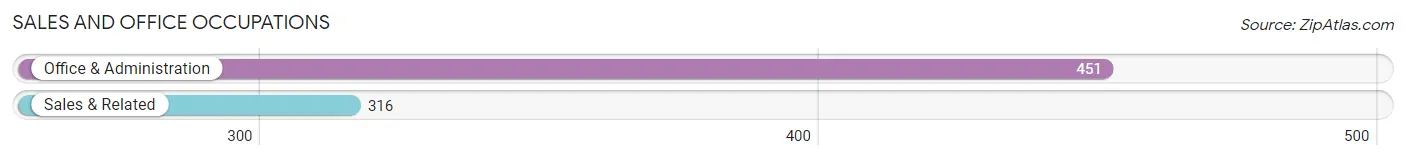
Sales and Office Occupations by Sex
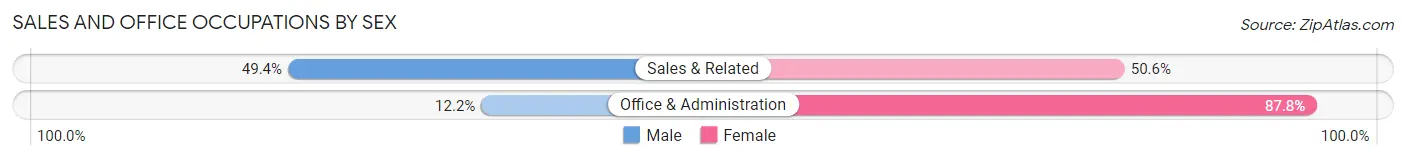
| Occupation | Male | Female |
| Sales & Related | 156 (49.4%) | 160 (50.6%) |
| Office & Administration | 55 (12.2%) | 396 (87.8%) |
| Total (Category) | 211 (27.5%) | 556 (72.5%) |
| Total (Overall) | 2,003 (52.0%) | 1,846 (48.0%) |
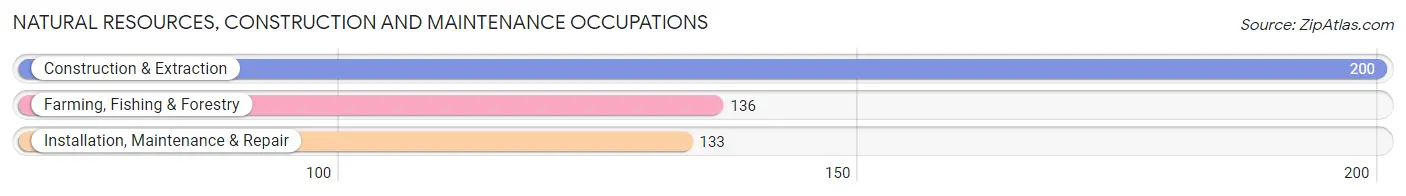
Natural Resources, Construction and Maintenance Occupations
The most common Natural Resources, Construction and Maintenance occupations in Charles Mix County are Construction & Extraction (200 | 5.2%), Farming, Fishing & Forestry (136 | 3.5%), and Installation, Maintenance & Repair (133 | 3.5%).
Natural Resources, Construction and Maintenance Occupations by Sex
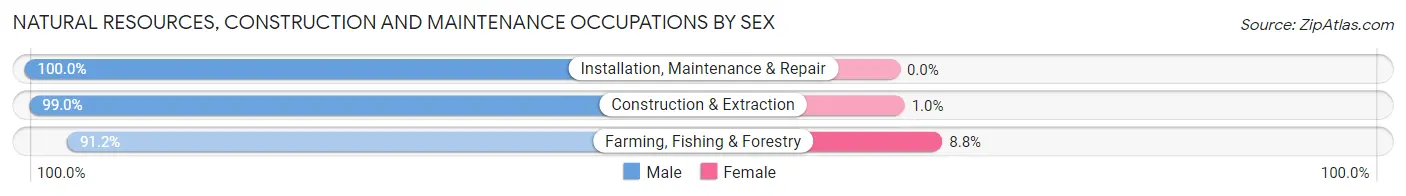
| Occupation | Male | Female |
| Farming, Fishing & Forestry | 124 (91.2%) | 12 (8.8%) |
| Construction & Extraction | 198 (99.0%) | 2 (1.0%) |
| Installation, Maintenance & Repair | 133 (100.0%) | 0 (0.0%) |
| Total (Category) | 455 (97.0%) | 14 (3.0%) |
| Total (Overall) | 2,003 (52.0%) | 1,846 (48.0%) |
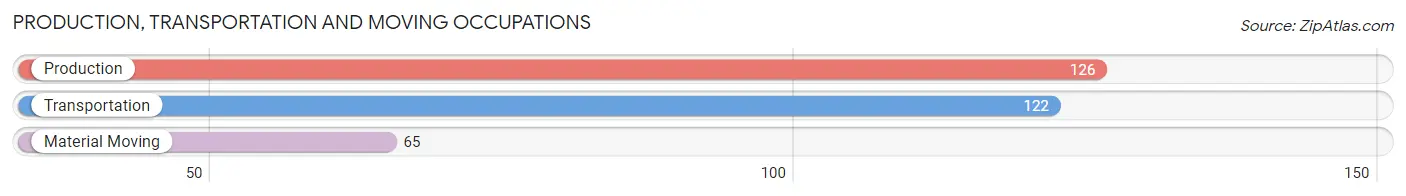
Production, Transportation and Moving Occupations
The most common Production, Transportation and Moving occupations in Charles Mix County are Production (126 | 3.3%), Transportation (122 | 3.2%), and Material Moving (65 | 1.7%).
Production, Transportation and Moving Occupations by Sex
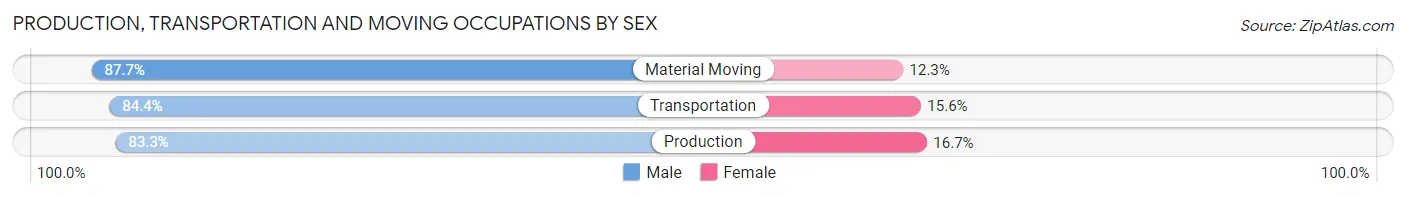
| Occupation | Male | Female |
| Production | 105 (83.3%) | 21 (16.7%) |
| Transportation | 103 (84.4%) | 19 (15.6%) |
| Material Moving | 57 (87.7%) | 8 (12.3%) |
| Total (Category) | 265 (84.7%) | 48 (15.3%) |
| Total (Overall) | 2,003 (52.0%) | 1,846 (48.0%) |
Employment Industries by Sex in Charles Mix County
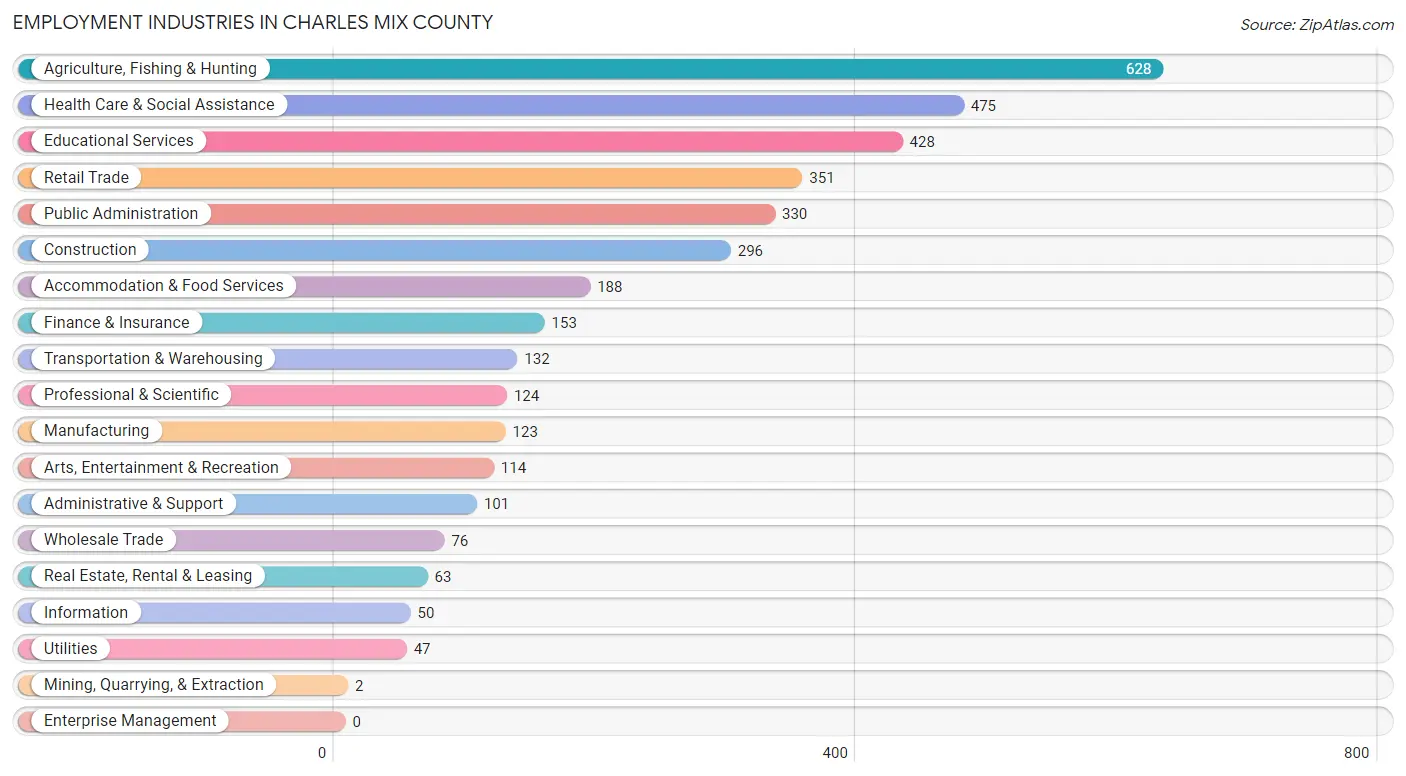
Employment Industries in Charles Mix County
The major employment industries in Charles Mix County include Agriculture, Fishing & Hunting (628 | 16.3%), Health Care & Social Assistance (475 | 12.3%), Educational Services (428 | 11.1%), Retail Trade (351 | 9.1%), and Public Administration (330 | 8.6%).
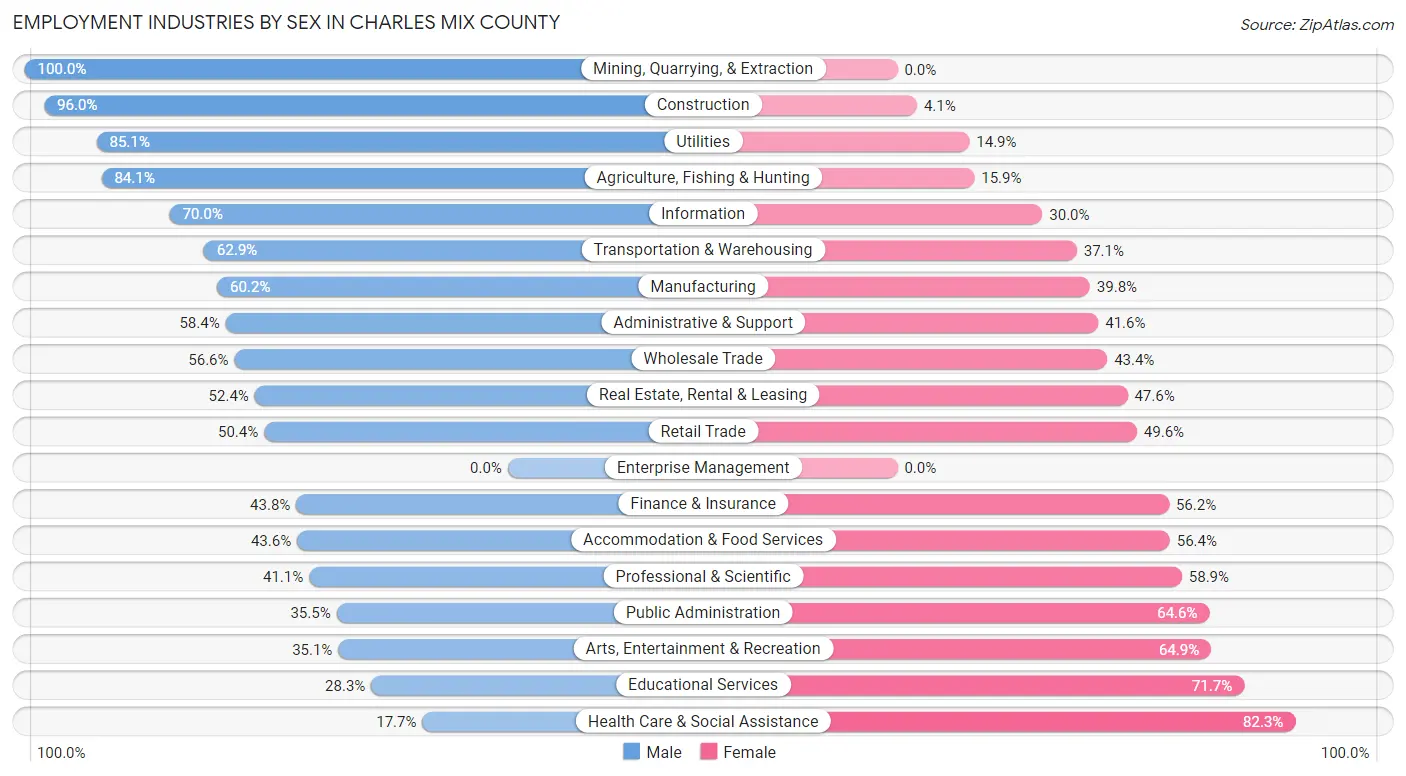
Employment Industries by Sex in Charles Mix County
The Charles Mix County industries that see more men than women are Mining, Quarrying, & Extraction (100.0%), Construction (96.0%), and Utilities (85.1%), whereas the industries that tend to have a higher number of women are Health Care & Social Assistance (82.3%), Educational Services (71.7%), and Arts, Entertainment & Recreation (64.9%).
| Industry | Male | Female |
| Agriculture, Fishing & Hunting | 528 (84.1%) | 100 (15.9%) |
| Mining, Quarrying, & Extraction | 2 (100.0%) | 0 (0.0%) |
| Construction | 284 (96.0%) | 12 (4.1%) |
| Manufacturing | 74 (60.2%) | 49 (39.8%) |
| Wholesale Trade | 43 (56.6%) | 33 (43.4%) |
| Retail Trade | 177 (50.4%) | 174 (49.6%) |
| Transportation & Warehousing | 83 (62.9%) | 49 (37.1%) |
| Utilities | 40 (85.1%) | 7 (14.9%) |
| Information | 35 (70.0%) | 15 (30.0%) |
| Finance & Insurance | 67 (43.8%) | 86 (56.2%) |
| Real Estate, Rental & Leasing | 33 (52.4%) | 30 (47.6%) |
| Professional & Scientific | 51 (41.1%) | 73 (58.9%) |
| Enterprise Management | 0 (0.0%) | 0 (0.0%) |
| Administrative & Support | 59 (58.4%) | 42 (41.6%) |
| Educational Services | 121 (28.3%) | 307 (71.7%) |
| Health Care & Social Assistance | 84 (17.7%) | 391 (82.3%) |
| Arts, Entertainment & Recreation | 40 (35.1%) | 74 (64.9%) |
| Accommodation & Food Services | 82 (43.6%) | 106 (56.4%) |
| Public Administration | 117 (35.4%) | 213 (64.5%) |
| Total | 2,003 (52.0%) | 1,846 (48.0%) |
Education in Charles Mix County
School Enrollment in Charles Mix County
The most common levels of schooling among the 2,440 students in Charles Mix County are elementary school (736 | 30.2%), middle school (578 | 23.7%), and high school (490 | 20.1%).
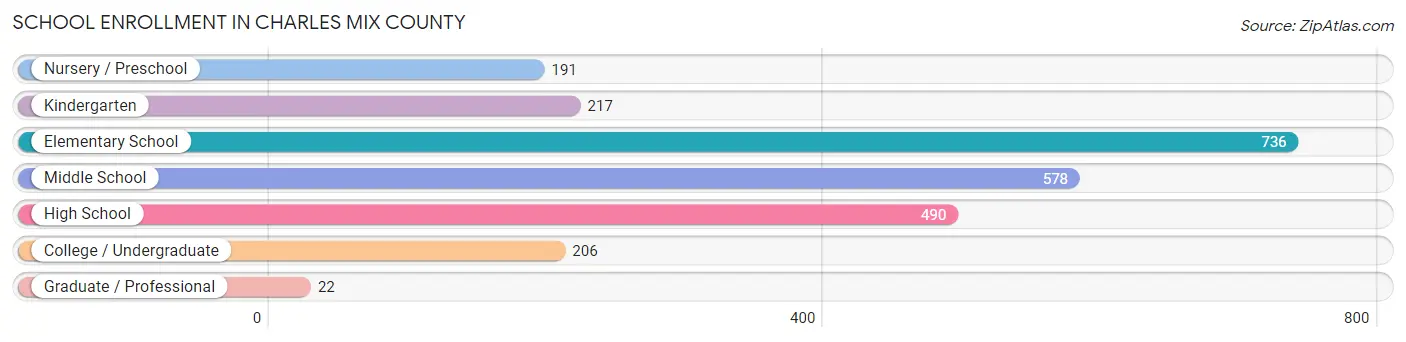
| School Level | # Students | % Students |
| Nursery / Preschool | 191 | 7.8% |
| Kindergarten | 217 | 8.9% |
| Elementary School | 736 | 30.2% |
| Middle School | 578 | 23.7% |
| High School | 490 | 20.1% |
| College / Undergraduate | 206 | 8.4% |
| Graduate / Professional | 22 | 0.9% |
| Total | 2,440 | 100.0% |
School Enrollment by Age by Funding Source in Charles Mix County
Out of a total of 2,440 students who are enrolled in schools in Charles Mix County, 254 (10.4%) attend a private institution, while the remaining 2,186 (89.6%) are enrolled in public schools. The age group of 35 years and over has the highest likelihood of being enrolled in private schools, with 62 (69.7% in the age bracket) enrolled. Conversely, the age group of 3 to 4 year olds has the lowest likelihood of being enrolled in a private school, with 127 (97.7% in the age bracket) attending a public institution.
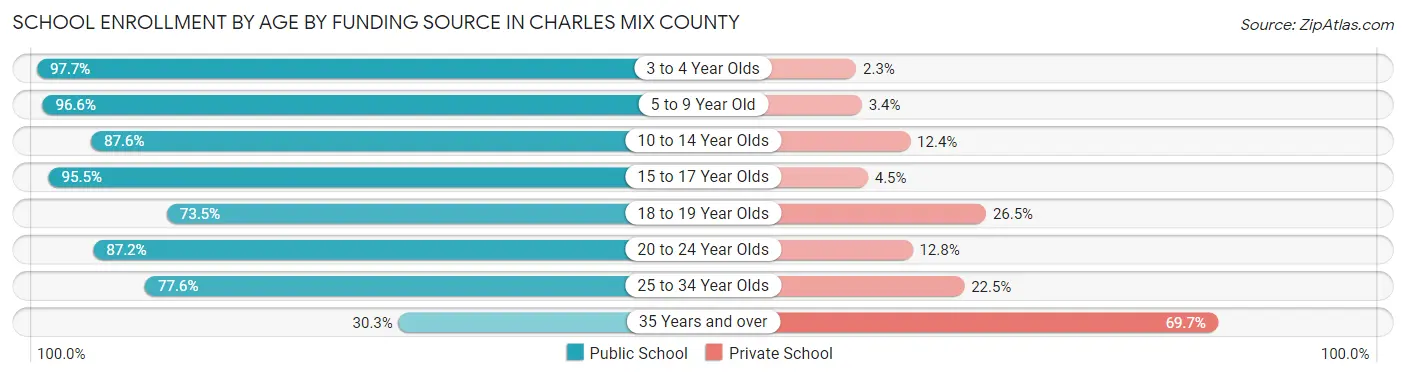
| Age Bracket | Public School | Private School |
| 3 to 4 Year Olds | 127 (97.7%) | 3 (2.3%) |
| 5 to 9 Year Old | 834 (96.6%) | 29 (3.4%) |
| 10 to 14 Year Olds | 644 (87.6%) | 91 (12.4%) |
| 15 to 17 Year Olds | 362 (95.5%) | 17 (4.5%) |
| 18 to 19 Year Olds | 86 (73.5%) | 31 (26.5%) |
| 20 to 24 Year Olds | 68 (87.2%) | 10 (12.8%) |
| 25 to 34 Year Olds | 38 (77.5%) | 11 (22.5%) |
| 35 Years and over | 27 (30.3%) | 62 (69.7%) |
| Total | 2,186 (89.6%) | 254 (10.4%) |
Educational Attainment by Field of Study in Charles Mix County
Education (430 | 28.2%), bio, nature & agricultural (272 | 17.8%), science & technology (260 | 17.1%), business (218 | 14.3%), and social sciences (76 | 5.0%) are the most common fields of study among 1,525 individuals in Charles Mix County who have obtained a bachelor's degree or higher.
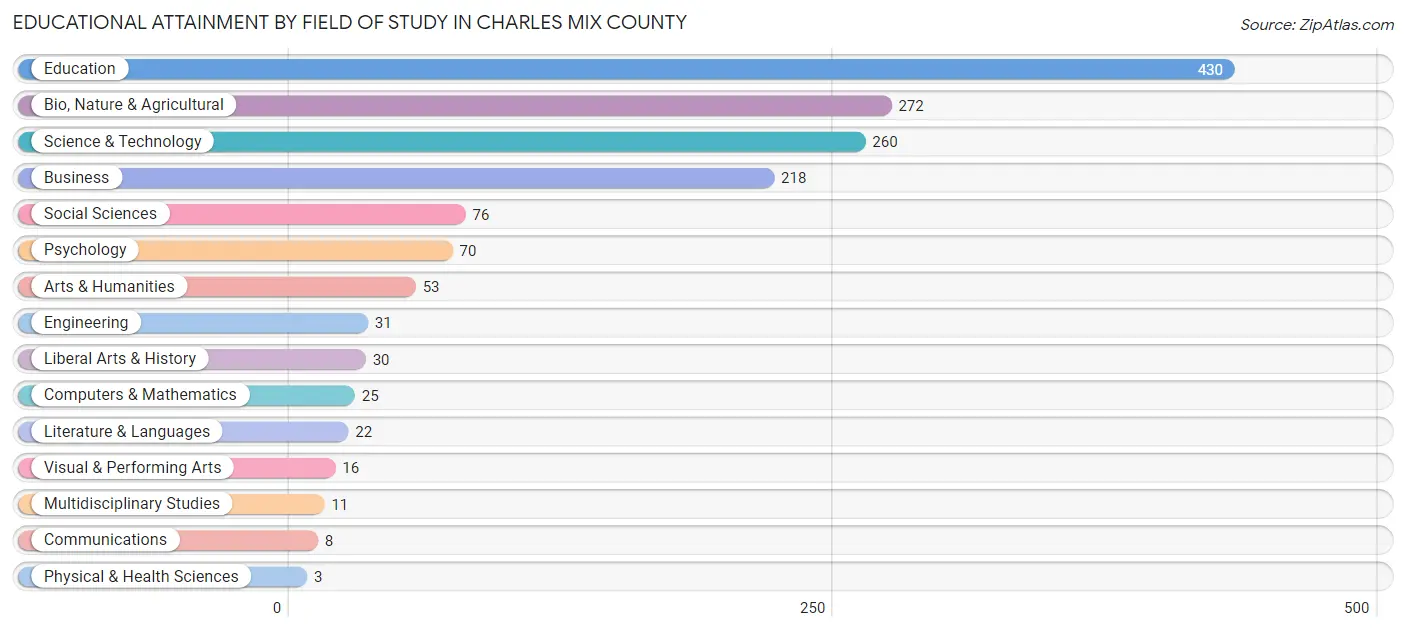
| Field of Study | # Graduates | % Graduates |
| Computers & Mathematics | 25 | 1.6% |
| Bio, Nature & Agricultural | 272 | 17.8% |
| Physical & Health Sciences | 3 | 0.2% |
| Psychology | 70 | 4.6% |
| Social Sciences | 76 | 5.0% |
| Engineering | 31 | 2.0% |
| Multidisciplinary Studies | 11 | 0.7% |
| Science & Technology | 260 | 17.1% |
| Business | 218 | 14.3% |
| Education | 430 | 28.2% |
| Literature & Languages | 22 | 1.4% |
| Liberal Arts & History | 30 | 2.0% |
| Visual & Performing Arts | 16 | 1.1% |
| Communications | 8 | 0.5% |
| Arts & Humanities | 53 | 3.5% |
| Total | 1,525 | 100.0% |
Transportation & Commute in Charles Mix County
Vehicle Availability by Sex in Charles Mix County
The most prevalent vehicle ownership categories in Charles Mix County are males with 2 vehicles (715, accounting for 36.0%) and females with 2 vehicles (599, making up 40.0%).
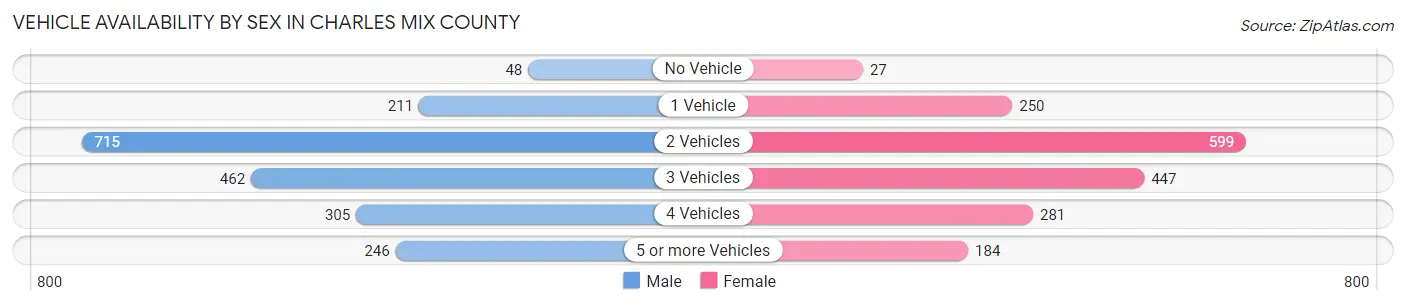
| Vehicles Available | Male | Female |
| No Vehicle | 48 (2.4%) | 27 (1.5%) |
| 1 Vehicle | 211 (10.6%) | 250 (14.0%) |
| 2 Vehicles | 715 (36.0%) | 599 (33.5%) |
| 3 Vehicles | 462 (23.3%) | 447 (25.0%) |
| 4 Vehicles | 305 (15.3%) | 281 (15.7%) |
| 5 or more Vehicles | 246 (12.4%) | 184 (10.3%) |
| Total | 1,987 (100.0%) | 1,788 (100.0%) |
Commute Time in Charles Mix County
The most frequently occuring commute durations in Charles Mix County are 5 to 9 minutes (1,014 commuters, 30.6%), less than 5 minutes (607 commuters, 18.3%), and 10 to 14 minutes (507 commuters, 15.3%).
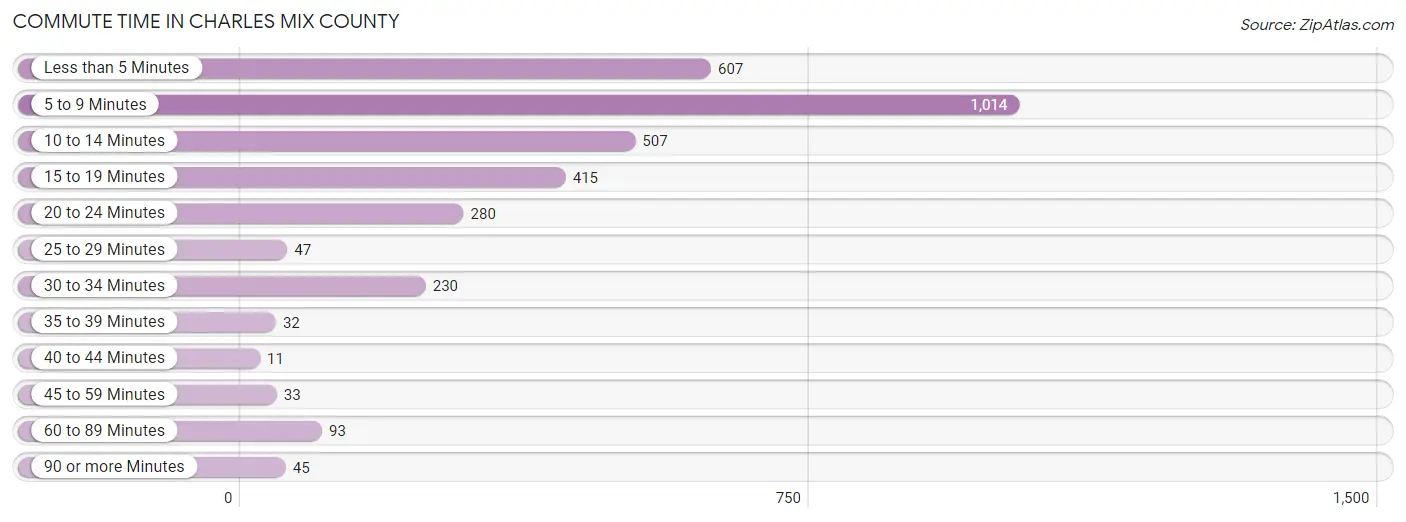
| Commute Time | # Commuters | % Commuters |
| Less than 5 Minutes | 607 | 18.3% |
| 5 to 9 Minutes | 1,014 | 30.6% |
| 10 to 14 Minutes | 507 | 15.3% |
| 15 to 19 Minutes | 415 | 12.5% |
| 20 to 24 Minutes | 280 | 8.5% |
| 25 to 29 Minutes | 47 | 1.4% |
| 30 to 34 Minutes | 230 | 6.9% |
| 35 to 39 Minutes | 32 | 1.0% |
| 40 to 44 Minutes | 11 | 0.3% |
| 45 to 59 Minutes | 33 | 1.0% |
| 60 to 89 Minutes | 93 | 2.8% |
| 90 or more Minutes | 45 | 1.4% |
Commute Time by Sex in Charles Mix County
The most common commute times in Charles Mix County are 5 to 9 minutes (512 commuters, 30.2%) for males and 5 to 9 minutes (502 commuters, 31.0%) for females.
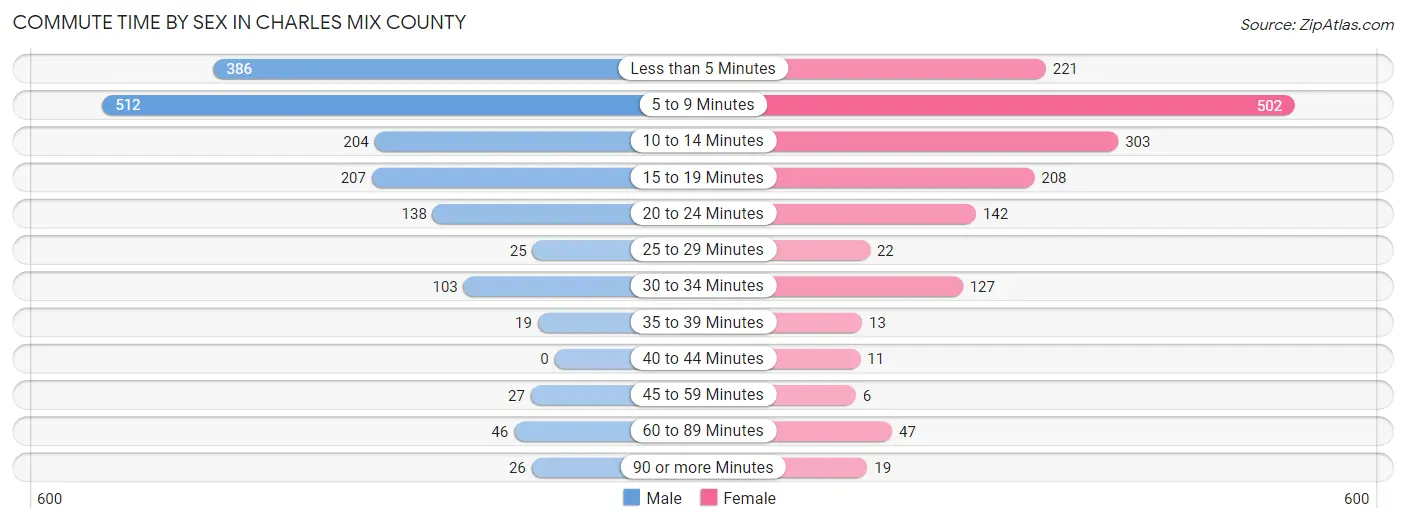
| Commute Time | Male | Female |
| Less than 5 Minutes | 386 (22.8%) | 221 (13.6%) |
| 5 to 9 Minutes | 512 (30.2%) | 502 (31.0%) |
| 10 to 14 Minutes | 204 (12.0%) | 303 (18.7%) |
| 15 to 19 Minutes | 207 (12.2%) | 208 (12.8%) |
| 20 to 24 Minutes | 138 (8.2%) | 142 (8.8%) |
| 25 to 29 Minutes | 25 (1.5%) | 22 (1.4%) |
| 30 to 34 Minutes | 103 (6.1%) | 127 (7.8%) |
| 35 to 39 Minutes | 19 (1.1%) | 13 (0.8%) |
| 40 to 44 Minutes | 0 (0.0%) | 11 (0.7%) |
| 45 to 59 Minutes | 27 (1.6%) | 6 (0.4%) |
| 60 to 89 Minutes | 46 (2.7%) | 47 (2.9%) |
| 90 or more Minutes | 26 (1.5%) | 19 (1.2%) |
Time of Departure to Work by Sex in Charles Mix County
The most frequent times of departure to work in Charles Mix County are 7:30 AM to 7:59 AM (507, 29.9%) for males and 7:30 AM to 7:59 AM (546, 33.7%) for females.
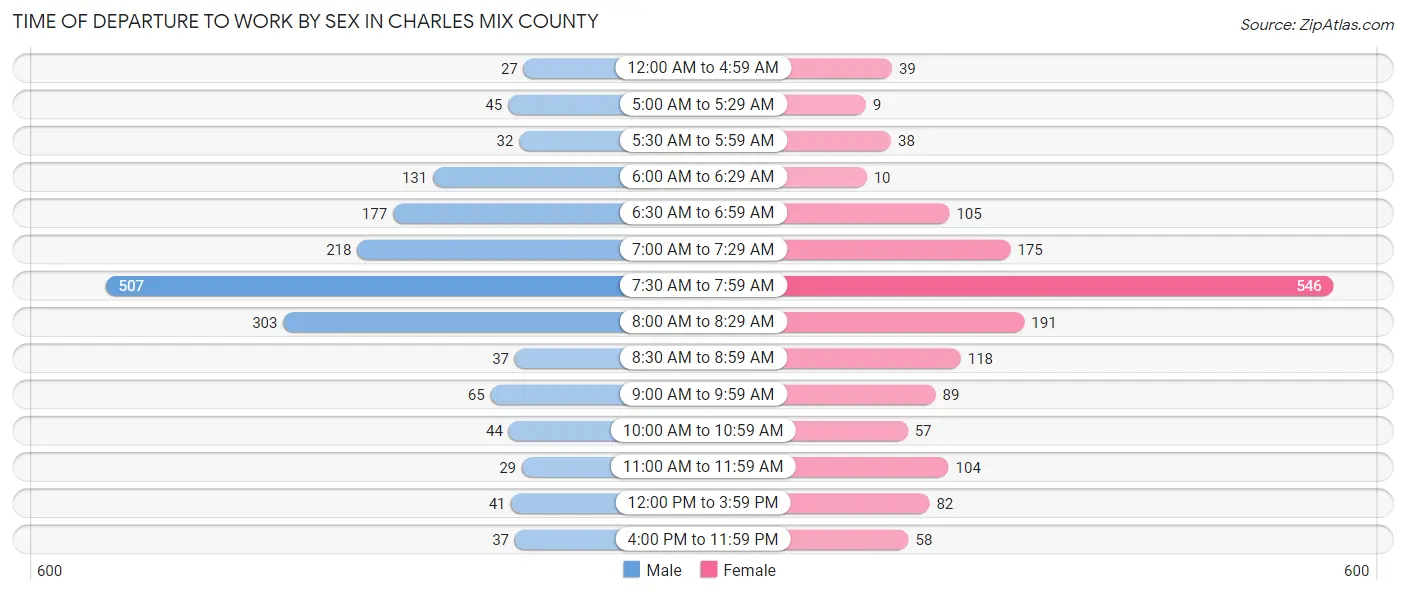
| Time of Departure | Male | Female |
| 12:00 AM to 4:59 AM | 27 (1.6%) | 39 (2.4%) |
| 5:00 AM to 5:29 AM | 45 (2.7%) | 9 (0.6%) |
| 5:30 AM to 5:59 AM | 32 (1.9%) | 38 (2.3%) |
| 6:00 AM to 6:29 AM | 131 (7.7%) | 10 (0.6%) |
| 6:30 AM to 6:59 AM | 177 (10.4%) | 105 (6.5%) |
| 7:00 AM to 7:29 AM | 218 (12.9%) | 175 (10.8%) |
| 7:30 AM to 7:59 AM | 507 (29.9%) | 546 (33.7%) |
| 8:00 AM to 8:29 AM | 303 (17.9%) | 191 (11.8%) |
| 8:30 AM to 8:59 AM | 37 (2.2%) | 118 (7.3%) |
| 9:00 AM to 9:59 AM | 65 (3.8%) | 89 (5.5%) |
| 10:00 AM to 10:59 AM | 44 (2.6%) | 57 (3.5%) |
| 11:00 AM to 11:59 AM | 29 (1.7%) | 104 (6.4%) |
| 12:00 PM to 3:59 PM | 41 (2.4%) | 82 (5.1%) |
| 4:00 PM to 11:59 PM | 37 (2.2%) | 58 (3.6%) |
| Total | 1,693 (100.0%) | 1,621 (100.0%) |
Housing Occupancy in Charles Mix County
Occupancy by Ownership in Charles Mix County
Of the total 2,963 dwellings in Charles Mix County, owner-occupied units account for 2,190 (73.9%), while renter-occupied units make up 773 (26.1%).
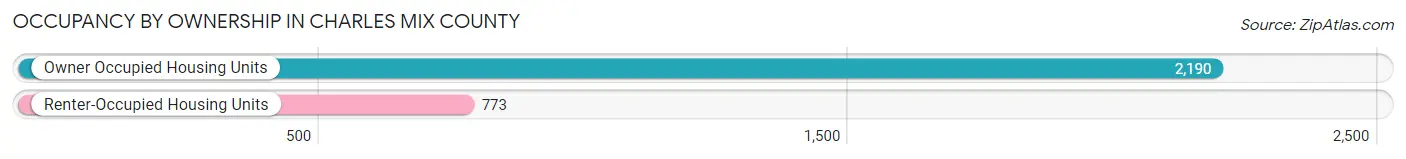
| Occupancy | # Housing Units | % Housing Units |
| Owner Occupied Housing Units | 2,190 | 73.9% |
| Renter-Occupied Housing Units | 773 | 26.1% |
| Total Occupied Housing Units | 2,963 | 100.0% |
Occupancy by Household Size in Charles Mix County
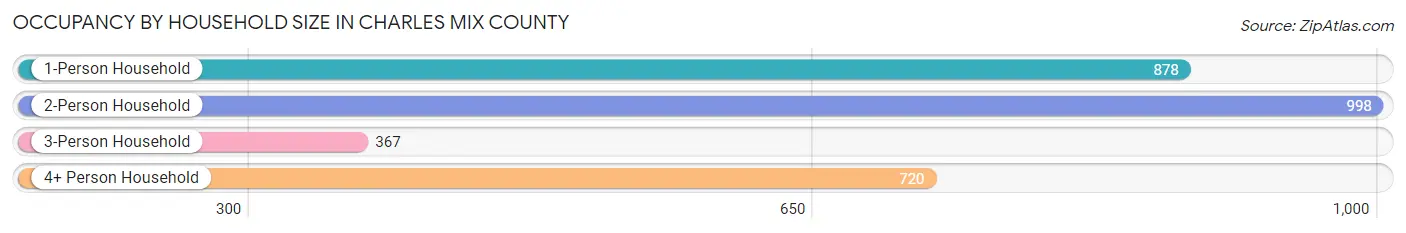
| Household Size | # Housing Units | % Housing Units |
| 1-Person Household | 878 | 29.6% |
| 2-Person Household | 998 | 33.7% |
| 3-Person Household | 367 | 12.4% |
| 4+ Person Household | 720 | 24.3% |
| Total Housing Units | 2,963 | 100.0% |
Occupancy by Ownership by Household Size in Charles Mix County
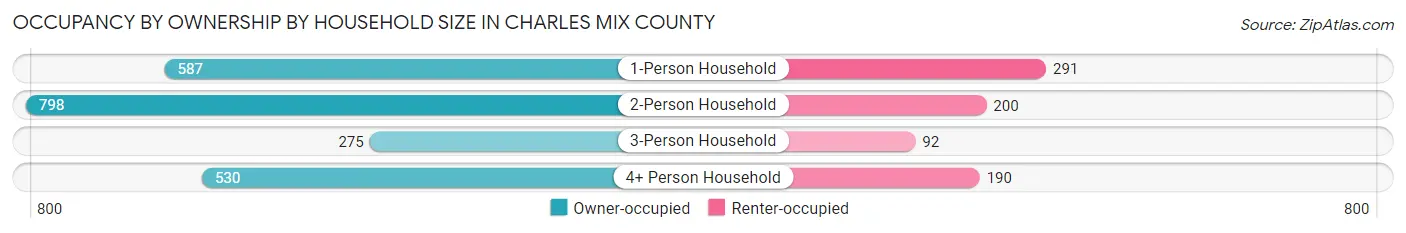
| Household Size | Owner-occupied | Renter-occupied |
| 1-Person Household | 587 (66.9%) | 291 (33.1%) |
| 2-Person Household | 798 (80.0%) | 200 (20.0%) |
| 3-Person Household | 275 (74.9%) | 92 (25.1%) |
| 4+ Person Household | 530 (73.6%) | 190 (26.4%) |
| Total Housing Units | 2,190 (73.9%) | 773 (26.1%) |
Occupancy by Educational Attainment in Charles Mix County
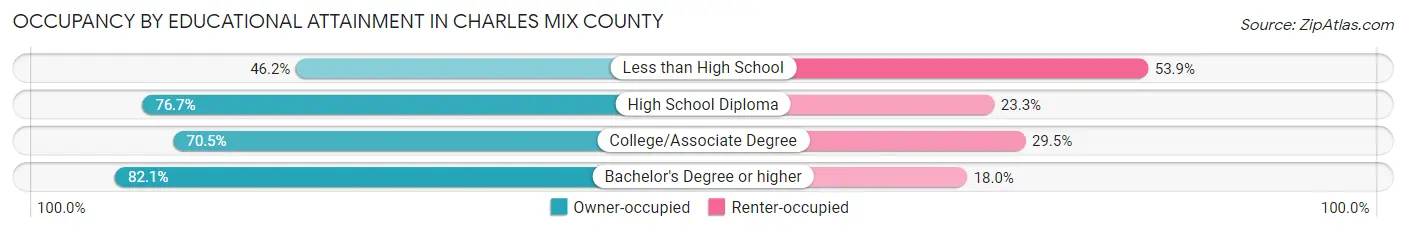
| Household Size | Owner-occupied | Renter-occupied |
| Less than High School | 96 (46.2%) | 112 (53.8%) |
| High School Diploma | 808 (76.7%) | 246 (23.3%) |
| College/Associate Degree | 669 (70.5%) | 280 (29.5%) |
| Bachelor's Degree or higher | 617 (82.1%) | 135 (17.9%) |
Occupancy by Age of Householder in Charles Mix County
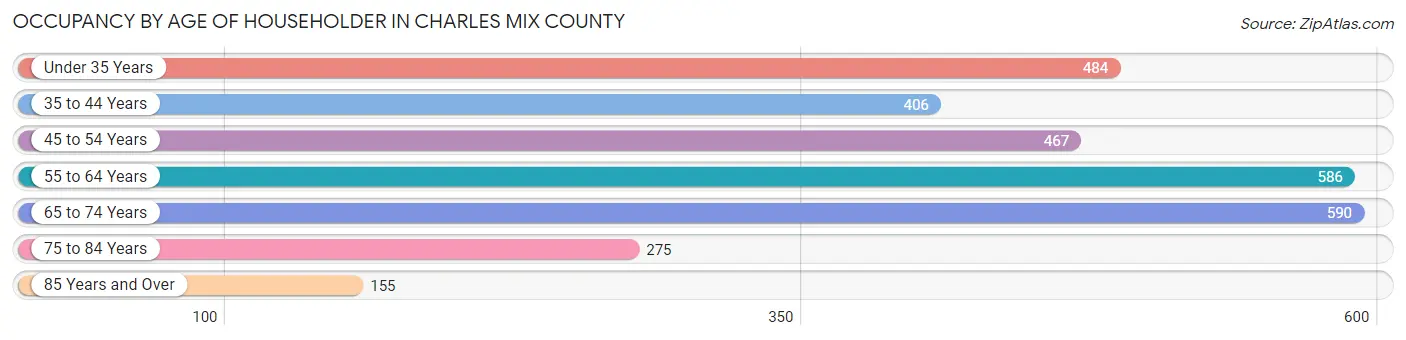
| Age Bracket | # Households | % Households |
| Under 35 Years | 484 | 16.3% |
| 35 to 44 Years | 406 | 13.7% |
| 45 to 54 Years | 467 | 15.8% |
| 55 to 64 Years | 586 | 19.8% |
| 65 to 74 Years | 590 | 19.9% |
| 75 to 84 Years | 275 | 9.3% |
| 85 Years and Over | 155 | 5.2% |
| Total | 2,963 | 100.0% |
Housing Finances in Charles Mix County
Median Income by Occupancy in Charles Mix County
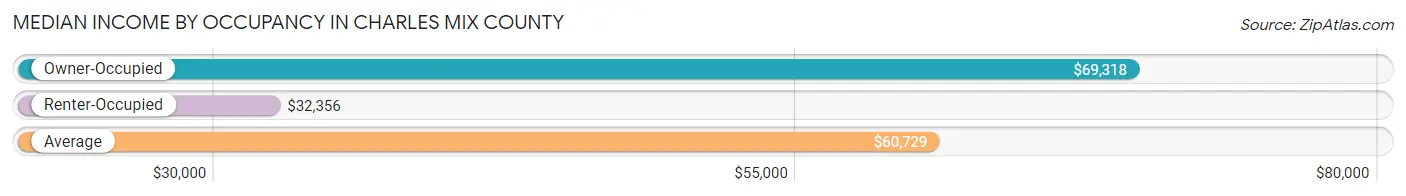
| Occupancy Type | # Households | Median Income |
| Owner-Occupied | 2,190 (73.9%) | $69,318 |
| Renter-Occupied | 773 (26.1%) | $32,356 |
| Average | 2,963 (100.0%) | $60,729 |
Occupancy by Householder Income Bracket in Charles Mix County
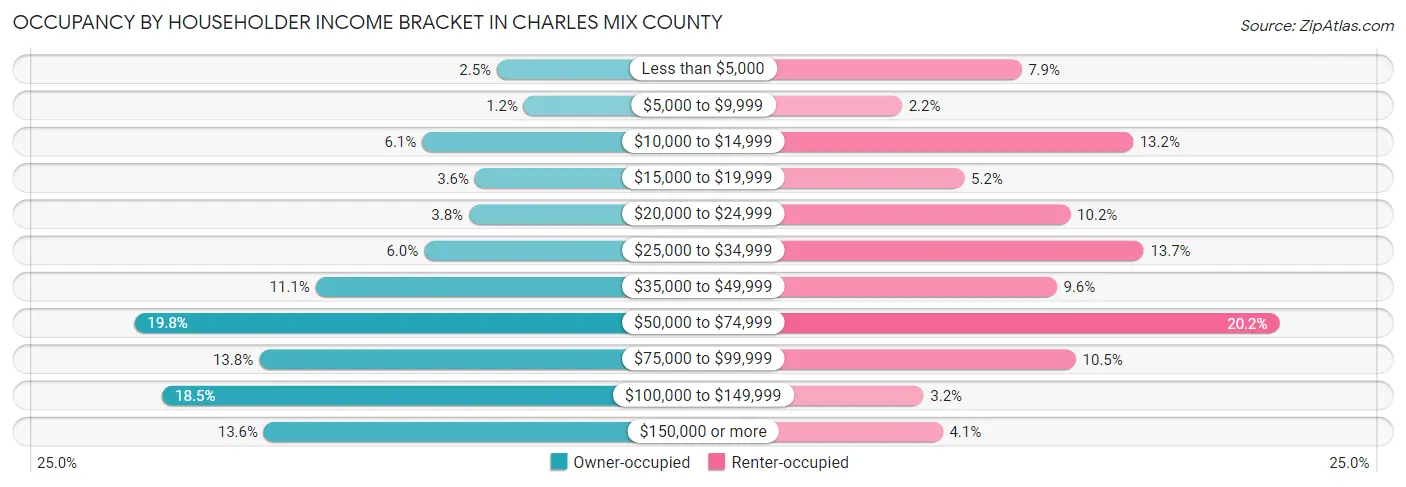
| Income Bracket | Owner-occupied | Renter-occupied |
| Less than $5,000 | 55 (2.5%) | 61 (7.9%) |
| $5,000 to $9,999 | 27 (1.2%) | 17 (2.2%) |
| $10,000 to $14,999 | 133 (6.1%) | 102 (13.2%) |
| $15,000 to $19,999 | 78 (3.6%) | 40 (5.2%) |
| $20,000 to $24,999 | 84 (3.8%) | 79 (10.2%) |
| $25,000 to $34,999 | 131 (6.0%) | 106 (13.7%) |
| $35,000 to $49,999 | 244 (11.1%) | 74 (9.6%) |
| $50,000 to $74,999 | 433 (19.8%) | 156 (20.2%) |
| $75,000 to $99,999 | 303 (13.8%) | 81 (10.5%) |
| $100,000 to $149,999 | 404 (18.4%) | 25 (3.2%) |
| $150,000 or more | 298 (13.6%) | 32 (4.1%) |
| Total | 2,190 (100.0%) | 773 (100.0%) |
Monthly Housing Cost Tiers in Charles Mix County
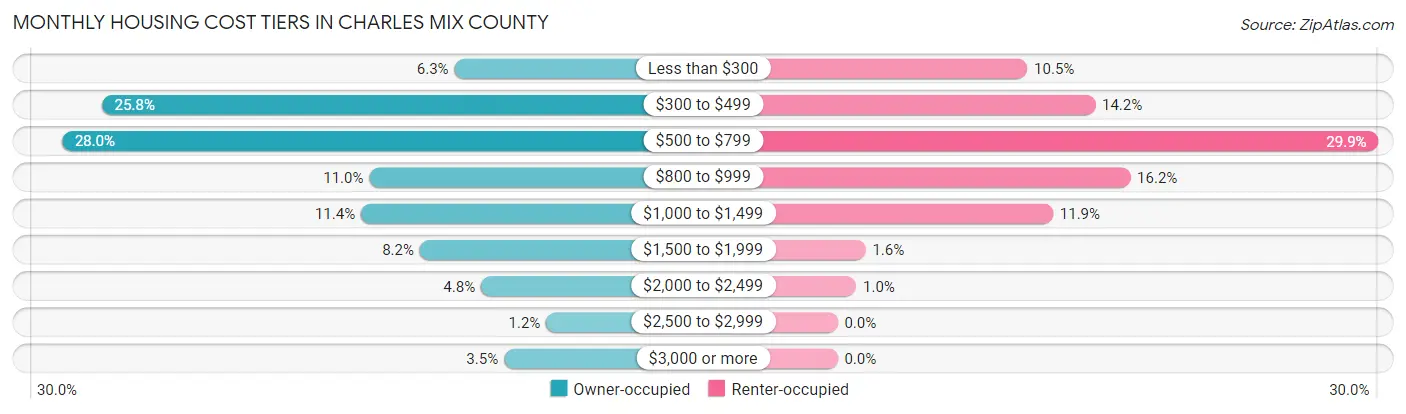
| Monthly Cost | Owner-occupied | Renter-occupied |
| Less than $300 | 137 (6.3%) | 81 (10.5%) |
| $300 to $499 | 564 (25.8%) | 110 (14.2%) |
| $500 to $799 | 612 (28.0%) | 231 (29.9%) |
| $800 to $999 | 240 (11.0%) | 125 (16.2%) |
| $1,000 to $1,499 | 250 (11.4%) | 92 (11.9%) |
| $1,500 to $1,999 | 179 (8.2%) | 12 (1.5%) |
| $2,000 to $2,499 | 105 (4.8%) | 8 (1.0%) |
| $2,500 to $2,999 | 26 (1.2%) | 0 (0.0%) |
| $3,000 or more | 77 (3.5%) | 0 (0.0%) |
| Total | 2,190 (100.0%) | 773 (100.0%) |
Physical Housing Characteristics in Charles Mix County
Housing Structures in Charles Mix County
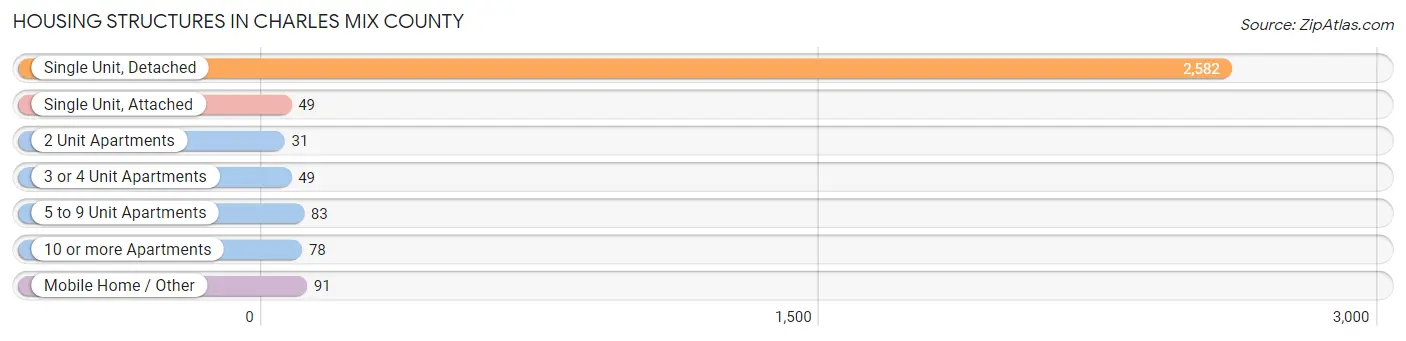
| Structure Type | # Housing Units | % Housing Units |
| Single Unit, Detached | 2,582 | 87.1% |
| Single Unit, Attached | 49 | 1.7% |
| 2 Unit Apartments | 31 | 1.1% |
| 3 or 4 Unit Apartments | 49 | 1.7% |
| 5 to 9 Unit Apartments | 83 | 2.8% |
| 10 or more Apartments | 78 | 2.6% |
| Mobile Home / Other | 91 | 3.1% |
| Total | 2,963 | 100.0% |
Housing Structures by Occupancy in Charles Mix County
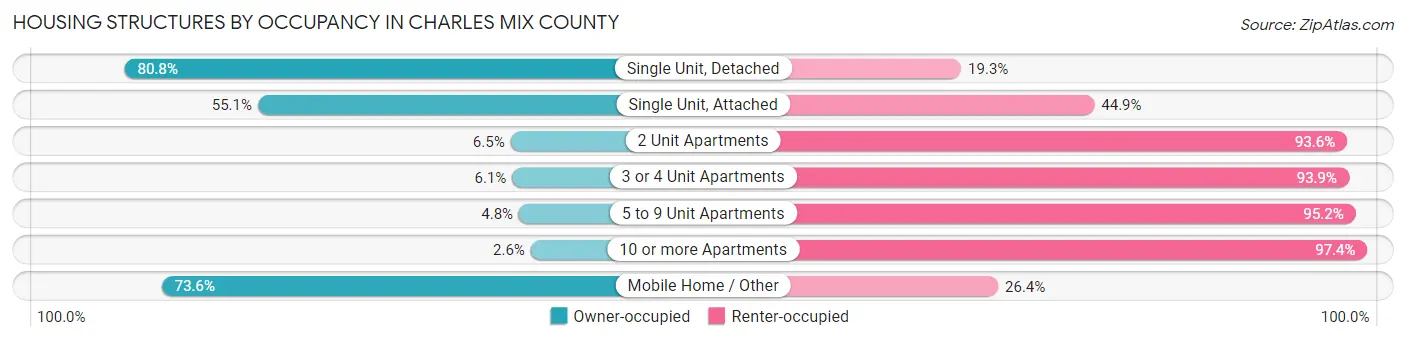
| Structure Type | Owner-occupied | Renter-occupied |
| Single Unit, Detached | 2,085 (80.7%) | 497 (19.3%) |
| Single Unit, Attached | 27 (55.1%) | 22 (44.9%) |
| 2 Unit Apartments | 2 (6.5%) | 29 (93.5%) |
| 3 or 4 Unit Apartments | 3 (6.1%) | 46 (93.9%) |
| 5 to 9 Unit Apartments | 4 (4.8%) | 79 (95.2%) |
| 10 or more Apartments | 2 (2.6%) | 76 (97.4%) |
| Mobile Home / Other | 67 (73.6%) | 24 (26.4%) |
| Total | 2,190 (73.9%) | 773 (26.1%) |
Housing Structures by Number of Rooms in Charles Mix County
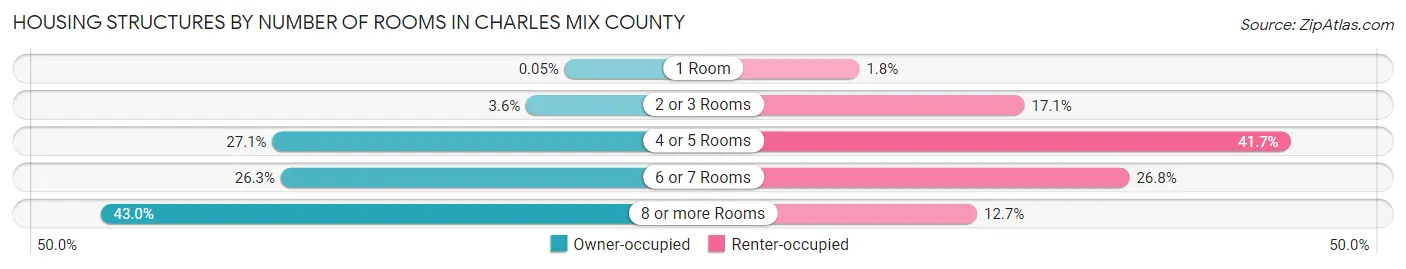
| Number of Rooms | Owner-occupied | Renter-occupied |
| 1 Room | 1 (0.1%) | 14 (1.8%) |
| 2 or 3 Rooms | 79 (3.6%) | 132 (17.1%) |
| 4 or 5 Rooms | 593 (27.1%) | 322 (41.7%) |
| 6 or 7 Rooms | 576 (26.3%) | 207 (26.8%) |
| 8 or more Rooms | 941 (43.0%) | 98 (12.7%) |
| Total | 2,190 (100.0%) | 773 (100.0%) |
Housing Structure by Heating Type in Charles Mix County
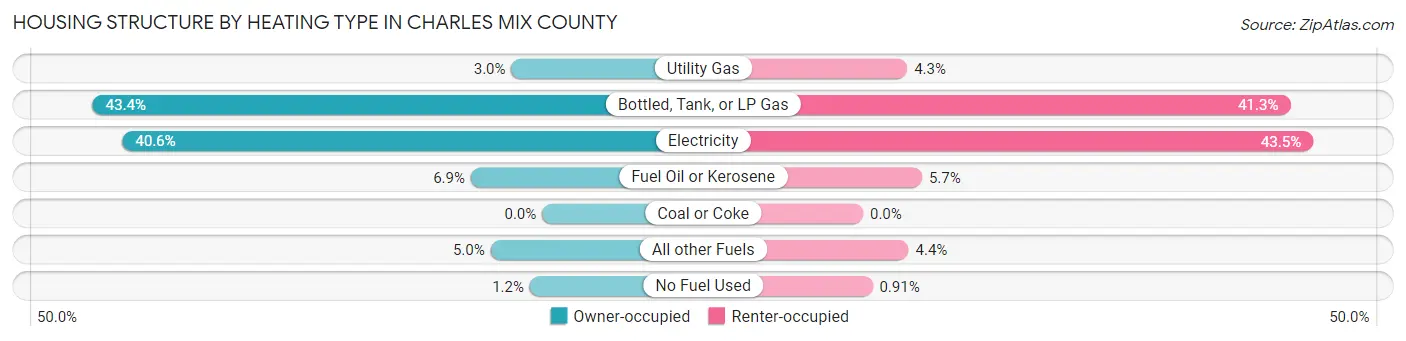
| Heating Type | Owner-occupied | Renter-occupied |
| Utility Gas | 65 (3.0%) | 33 (4.3%) |
| Bottled, Tank, or LP Gas | 951 (43.4%) | 319 (41.3%) |
| Electricity | 888 (40.6%) | 336 (43.5%) |
| Fuel Oil or Kerosene | 151 (6.9%) | 44 (5.7%) |
| Coal or Coke | 0 (0.0%) | 0 (0.0%) |
| All other Fuels | 109 (5.0%) | 34 (4.4%) |
| No Fuel Used | 26 (1.2%) | 7 (0.9%) |
| Total | 2,190 (100.0%) | 773 (100.0%) |
Household Vehicle Usage in Charles Mix County
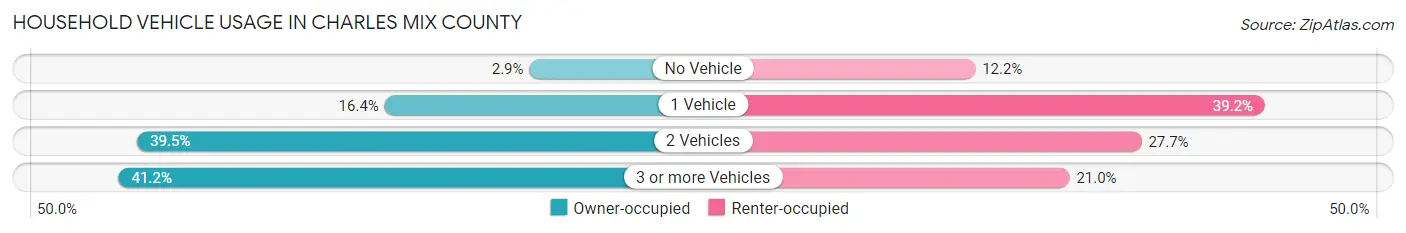
| Vehicles per Household | Owner-occupied | Renter-occupied |
| No Vehicle | 63 (2.9%) | 94 (12.2%) |
| 1 Vehicle | 359 (16.4%) | 303 (39.2%) |
| 2 Vehicles | 865 (39.5%) | 214 (27.7%) |
| 3 or more Vehicles | 903 (41.2%) | 162 (21.0%) |
| Total | 2,190 (100.0%) | 773 (100.0%) |
Real Estate & Mortgages in Charles Mix County
Real Estate and Mortgage Overview in Charles Mix County
| Characteristic | Without Mortgage | With Mortgage |
| Housing Units | 1,473 | 717 |
| Median Property Value | $151,200 | $195,100 |
| Median Household Income | $60,515 | $121 |
| Monthly Housing Costs | $519 | $72 |
| Real Estate Taxes | $1,474 | $39 |
Property Value by Mortgage Status in Charles Mix County
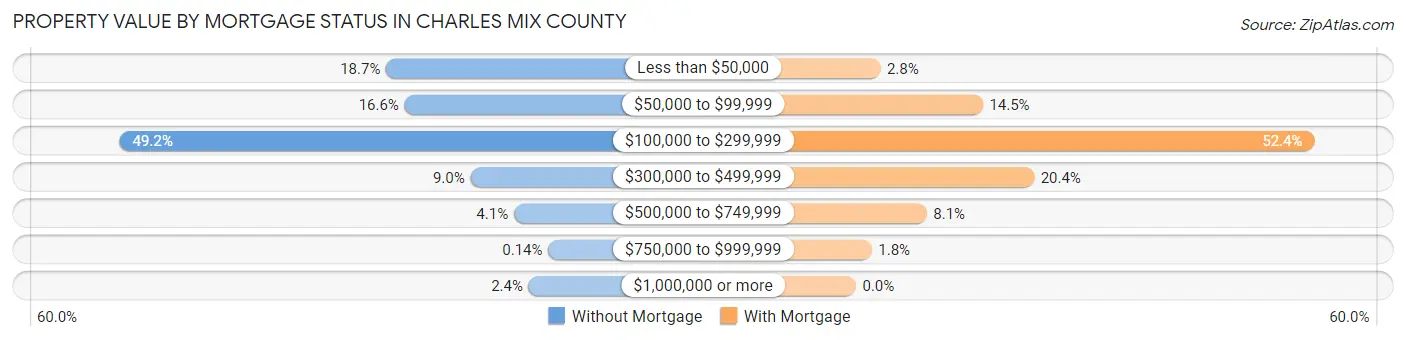
| Property Value | Without Mortgage | With Mortgage |
| Less than $50,000 | 275 (18.7%) | 20 (2.8%) |
| $50,000 to $99,999 | 244 (16.6%) | 104 (14.5%) |
| $100,000 to $299,999 | 724 (49.1%) | 376 (52.4%) |
| $300,000 to $499,999 | 133 (9.0%) | 146 (20.4%) |
| $500,000 to $749,999 | 60 (4.1%) | 58 (8.1%) |
| $750,000 to $999,999 | 2 (0.1%) | 13 (1.8%) |
| $1,000,000 or more | 35 (2.4%) | 0 (0.0%) |
| Total | 1,473 (100.0%) | 717 (100.0%) |
Household Income by Mortgage Status in Charles Mix County
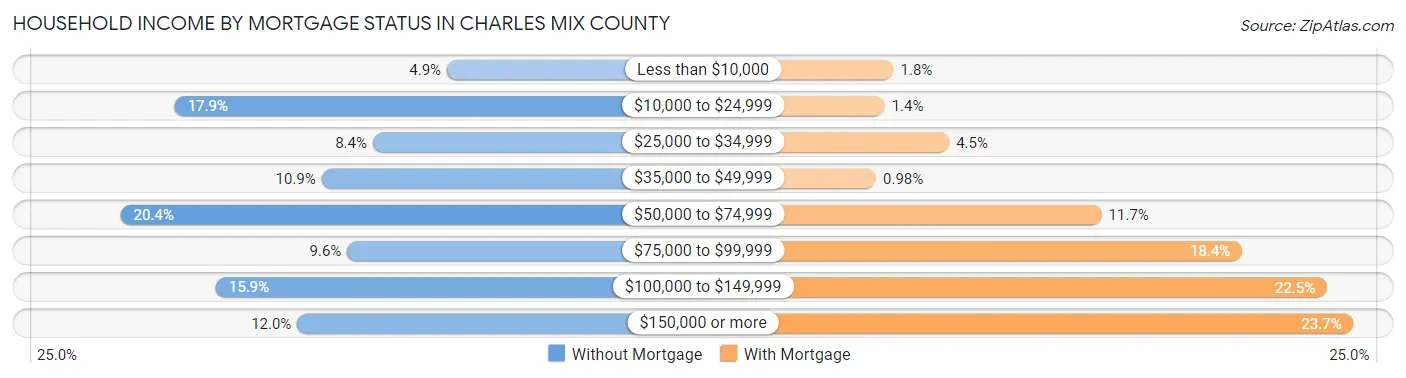
| Household Income | Without Mortgage | With Mortgage |
| Less than $10,000 | 72 (4.9%) | 13 (1.8%) |
| $10,000 to $24,999 | 263 (17.8%) | 10 (1.4%) |
| $25,000 to $34,999 | 124 (8.4%) | 32 (4.5%) |
| $35,000 to $49,999 | 160 (10.9%) | 7 (1.0%) |
| $50,000 to $74,999 | 301 (20.4%) | 84 (11.7%) |
| $75,000 to $99,999 | 142 (9.6%) | 132 (18.4%) |
| $100,000 to $149,999 | 234 (15.9%) | 161 (22.5%) |
| $150,000 or more | 177 (12.0%) | 170 (23.7%) |
| Total | 1,473 (100.0%) | 717 (100.0%) |
Property Value to Household Income Ratio in Charles Mix County
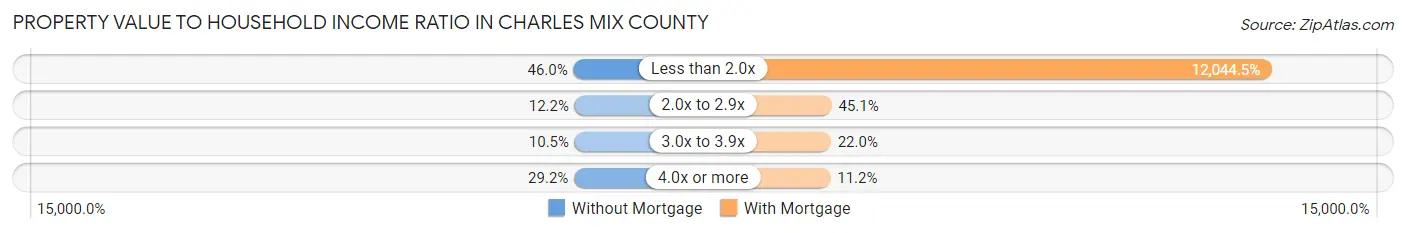
| Value-to-Income Ratio | Without Mortgage | With Mortgage |
| Less than 2.0x | 678 (46.0%) | 86,359 (12,044.5%) |
| 2.0x to 2.9x | 180 (12.2%) | 323 (45.1%) |
| 3.0x to 3.9x | 155 (10.5%) | 158 (22.0%) |
| 4.0x or more | 430 (29.2%) | 80 (11.2%) |
| Total | 1,473 (100.0%) | 717 (100.0%) |
Real Estate Taxes by Mortgage Status in Charles Mix County
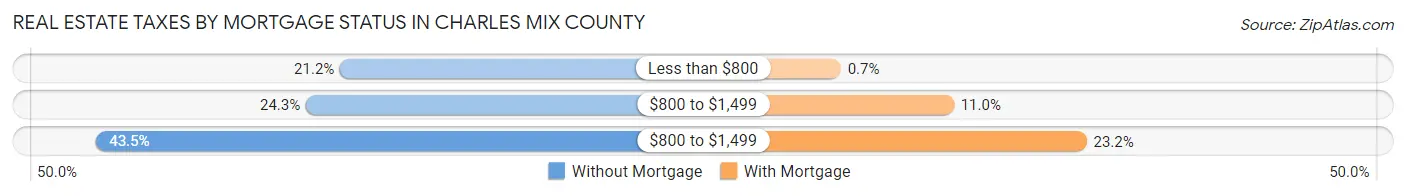
| Property Taxes | Without Mortgage | With Mortgage |
| Less than $800 | 312 (21.2%) | 5 (0.7%) |
| $800 to $1,499 | 358 (24.3%) | 79 (11.0%) |
| $800 to $1,499 | 640 (43.4%) | 166 (23.2%) |
| Total | 1,473 (100.0%) | 717 (100.0%) |
Health & Disability in Charles Mix County
Health Insurance Coverage by Age in Charles Mix County
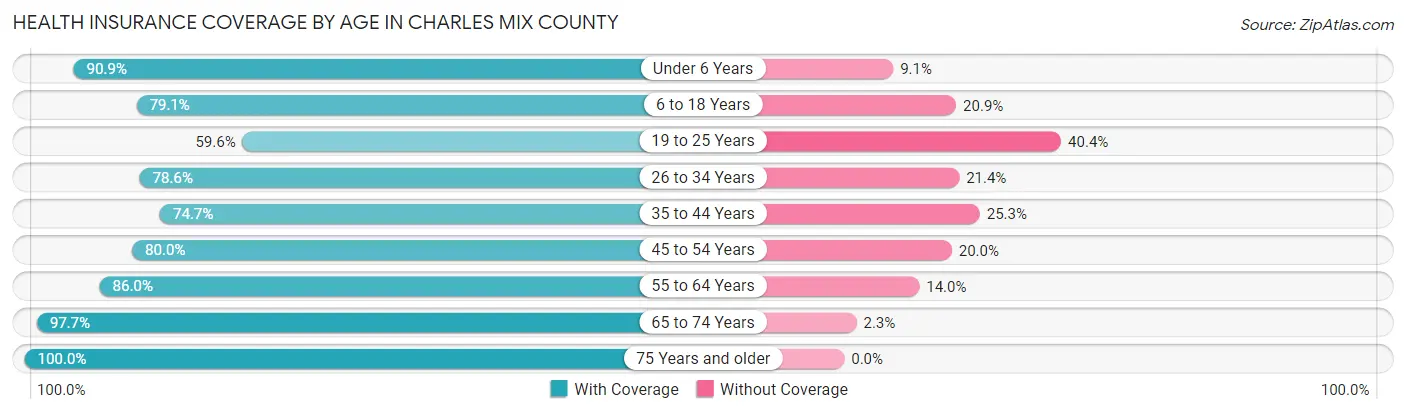
| Age Bracket | With Coverage | Without Coverage |
| Under 6 Years | 846 (90.9%) | 85 (9.1%) |
| 6 to 18 Years | 1,574 (79.1%) | 415 (20.9%) |
| 19 to 25 Years | 514 (59.6%) | 349 (40.4%) |
| 26 to 34 Years | 605 (78.6%) | 165 (21.4%) |
| 35 to 44 Years | 680 (74.7%) | 230 (25.3%) |
| 45 to 54 Years | 714 (80.0%) | 179 (20.0%) |
| 55 to 64 Years | 1,002 (86.0%) | 163 (14.0%) |
| 65 to 74 Years | 857 (97.7%) | 20 (2.3%) |
| 75 Years and older | 626 (100.0%) | 0 (0.0%) |
| Total | 7,418 (82.2%) | 1,606 (17.8%) |
Health Insurance Coverage by Citizenship Status in Charles Mix County
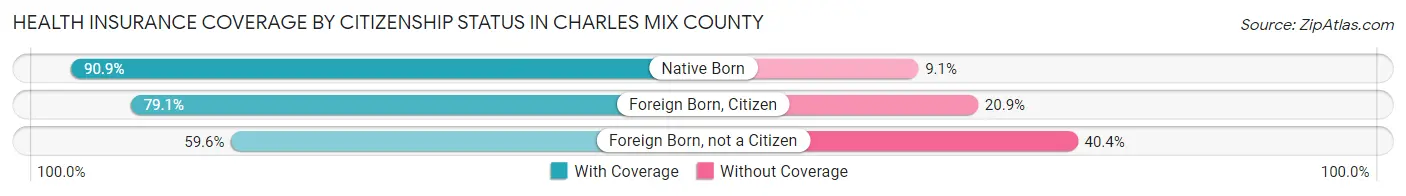
| Citizenship Status | With Coverage | Without Coverage |
| Native Born | 846 (90.9%) | 85 (9.1%) |
| Foreign Born, Citizen | 1,574 (79.1%) | 415 (20.9%) |
| Foreign Born, not a Citizen | 514 (59.6%) | 349 (40.4%) |
Health Insurance Coverage by Household Income in Charles Mix County
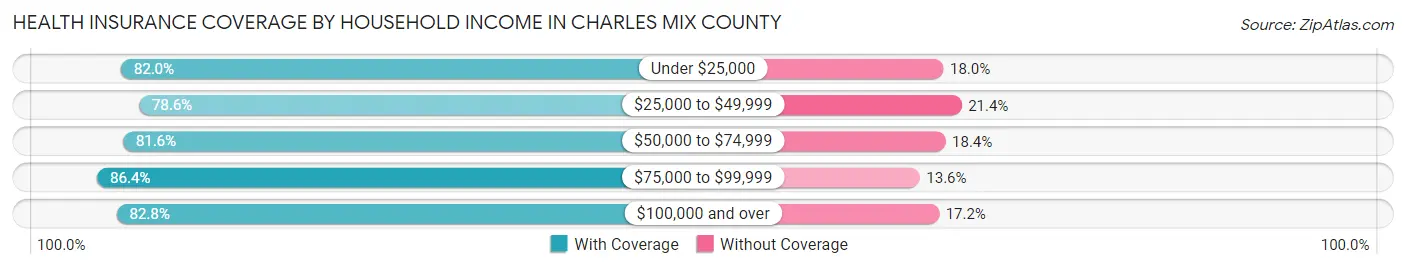
| Household Income | With Coverage | Without Coverage |
| Under $25,000 | 1,436 (82.0%) | 316 (18.0%) |
| $25,000 to $49,999 | 1,089 (78.6%) | 297 (21.4%) |
| $50,000 to $74,999 | 1,555 (81.6%) | 351 (18.4%) |
| $75,000 to $99,999 | 959 (86.4%) | 151 (13.6%) |
| $100,000 and over | 2,331 (82.8%) | 485 (17.2%) |
Public vs Private Health Insurance Coverage by Age in Charles Mix County
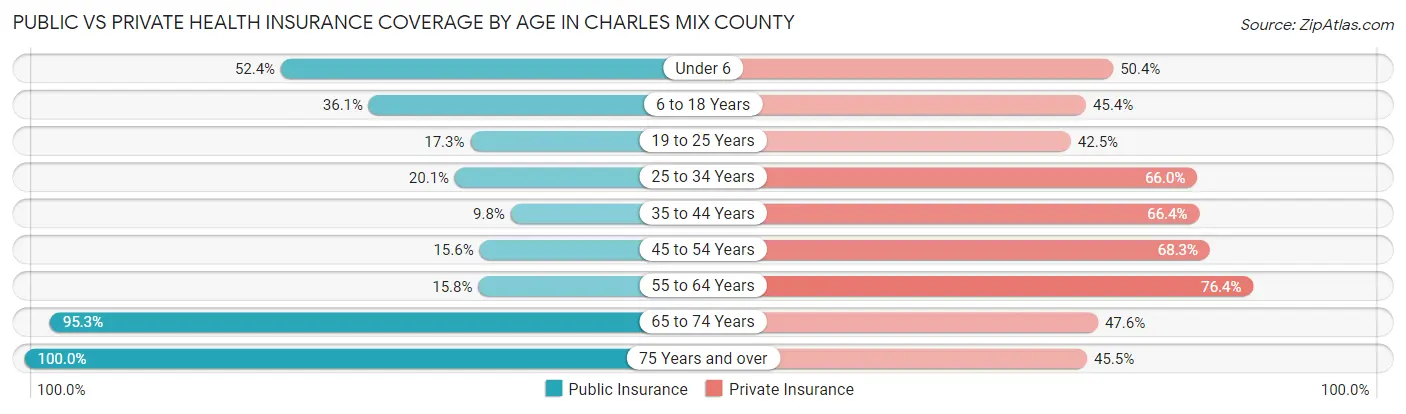
| Age Bracket | Public Insurance | Private Insurance |
| Under 6 | 488 (52.4%) | 469 (50.4%) |
| 6 to 18 Years | 718 (36.1%) | 902 (45.4%) |
| 19 to 25 Years | 149 (17.3%) | 367 (42.5%) |
| 25 to 34 Years | 155 (20.1%) | 508 (66.0%) |
| 35 to 44 Years | 89 (9.8%) | 604 (66.4%) |
| 45 to 54 Years | 139 (15.6%) | 610 (68.3%) |
| 55 to 64 Years | 184 (15.8%) | 890 (76.4%) |
| 65 to 74 Years | 836 (95.3%) | 417 (47.5%) |
| 75 Years and over | 626 (100.0%) | 285 (45.5%) |
| Total | 3,384 (37.5%) | 5,052 (56.0%) |
Disability Status by Sex by Age in Charles Mix County
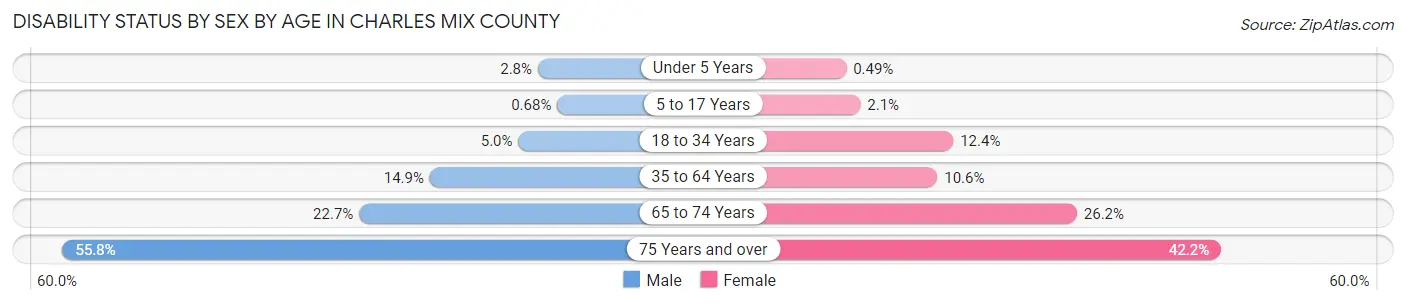
| Age Bracket | Male | Female |
| Under 5 Years | 11 (2.8%) | 2 (0.5%) |
| 5 to 17 Years | 7 (0.7%) | 21 (2.1%) |
| 18 to 34 Years | 43 (5.0%) | 105 (12.4%) |
| 35 to 64 Years | 226 (14.9%) | 154 (10.6%) |
| 65 to 74 Years | 103 (22.7%) | 111 (26.2%) |
| 75 Years and over | 159 (55.8%) | 144 (42.2%) |
Disability Class by Sex by Age in Charles Mix County
Disability Class: Hearing Difficulty
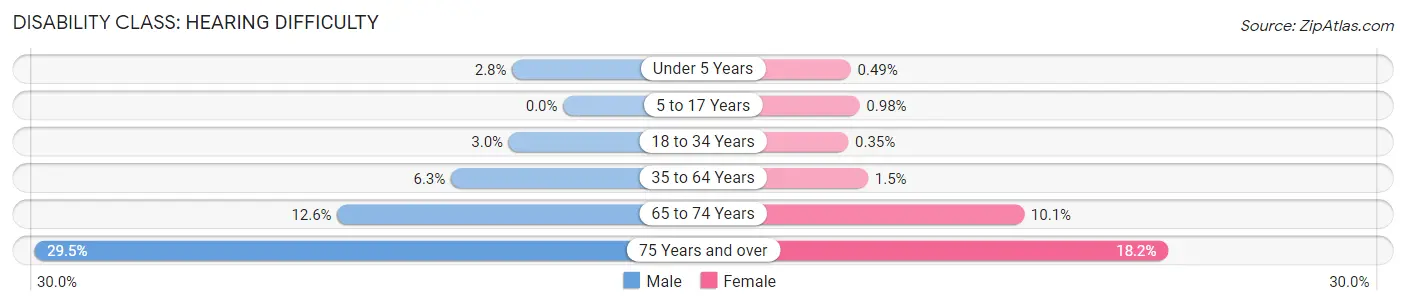
| Age Bracket | Male | Female |
| Under 5 Years | 11 (2.8%) | 2 (0.5%) |
| 5 to 17 Years | 0 (0.0%) | 10 (1.0%) |
| 18 to 34 Years | 26 (3.0%) | 3 (0.4%) |
| 35 to 64 Years | 95 (6.2%) | 21 (1.5%) |
| 65 to 74 Years | 57 (12.6%) | 43 (10.1%) |
| 75 Years and over | 84 (29.5%) | 62 (18.2%) |
Disability Class: Vision Difficulty
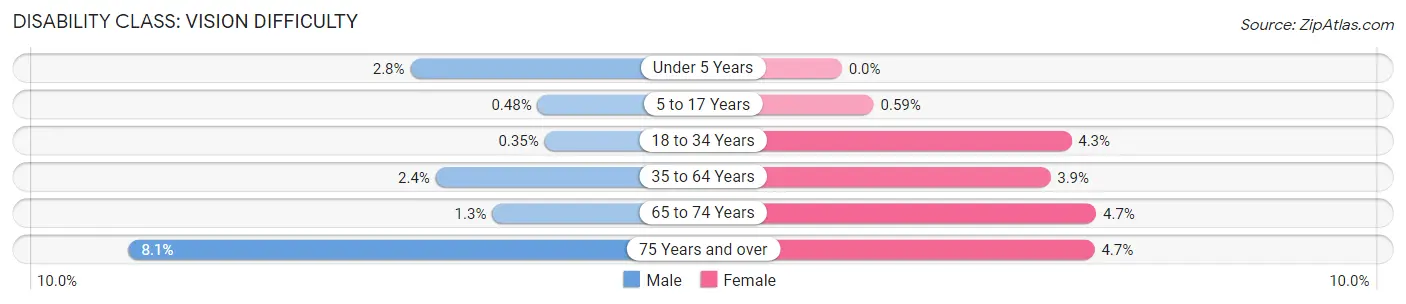
| Age Bracket | Male | Female |
| Under 5 Years | 11 (2.8%) | 0 (0.0%) |
| 5 to 17 Years | 5 (0.5%) | 6 (0.6%) |
| 18 to 34 Years | 3 (0.4%) | 36 (4.3%) |
| 35 to 64 Years | 36 (2.4%) | 56 (3.9%) |
| 65 to 74 Years | 6 (1.3%) | 20 (4.7%) |
| 75 Years and over | 23 (8.1%) | 16 (4.7%) |
Disability Class: Cognitive Difficulty
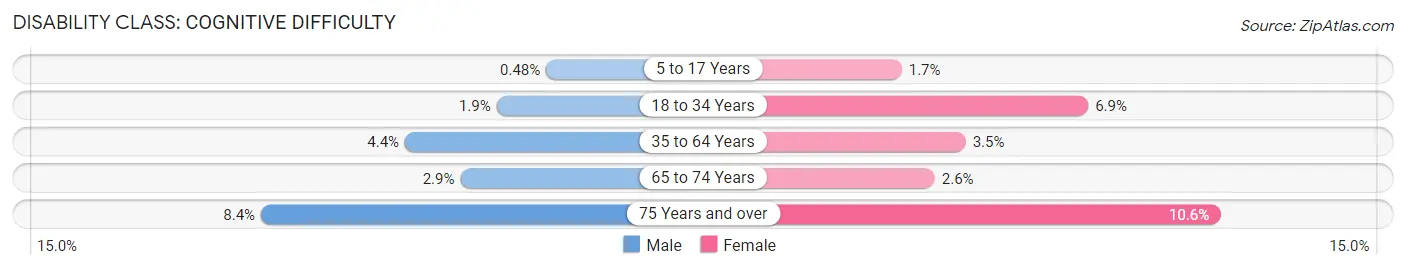
| Age Bracket | Male | Female |
| 5 to 17 Years | 5 (0.5%) | 17 (1.7%) |
| 18 to 34 Years | 16 (1.9%) | 58 (6.9%) |
| 35 to 64 Years | 67 (4.4%) | 50 (3.5%) |
| 65 to 74 Years | 13 (2.9%) | 11 (2.6%) |
| 75 Years and over | 24 (8.4%) | 36 (10.6%) |
Disability Class: Ambulatory Difficulty
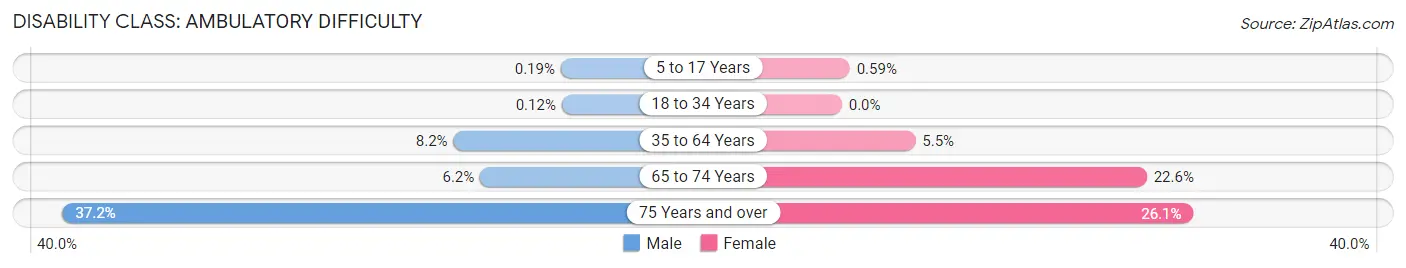
| Age Bracket | Male | Female |
| 5 to 17 Years | 2 (0.2%) | 6 (0.6%) |
| 18 to 34 Years | 1 (0.1%) | 0 (0.0%) |
| 35 to 64 Years | 124 (8.2%) | 79 (5.5%) |
| 65 to 74 Years | 28 (6.2%) | 96 (22.6%) |
| 75 Years and over | 106 (37.2%) | 89 (26.1%) |
Disability Class: Self-Care Difficulty
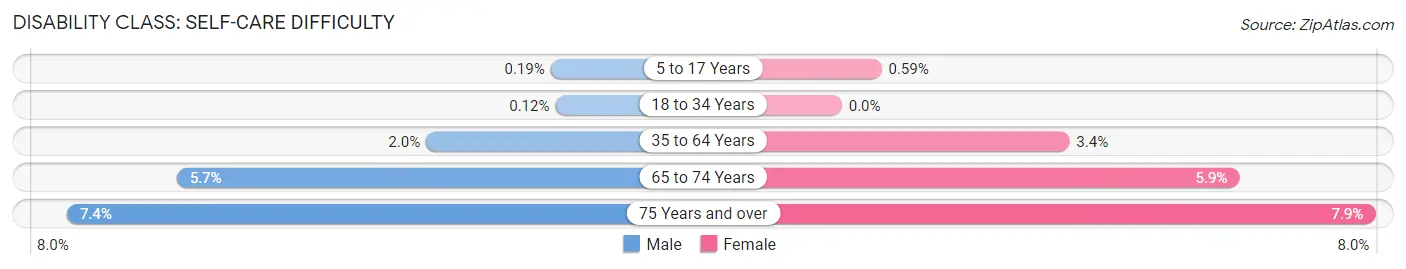
| Age Bracket | Male | Female |
| 5 to 17 Years | 2 (0.2%) | 6 (0.6%) |
| 18 to 34 Years | 1 (0.1%) | 0 (0.0%) |
| 35 to 64 Years | 31 (2.0%) | 49 (3.4%) |
| 65 to 74 Years | 26 (5.7%) | 25 (5.9%) |
| 75 Years and over | 21 (7.4%) | 27 (7.9%) |
Technology Access in Charles Mix County
Computing Device Access in Charles Mix County
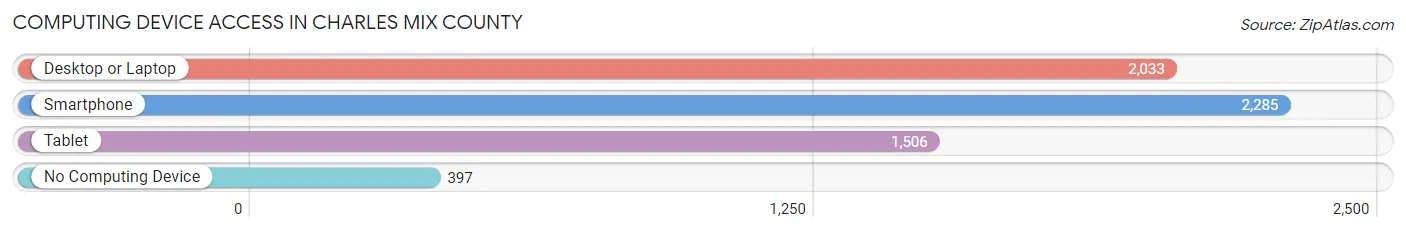
| Device Type | # Households | % Households |
| Desktop or Laptop | 2,033 | 68.6% |
| Smartphone | 2,285 | 77.1% |
| Tablet | 1,506 | 50.8% |
| No Computing Device | 397 | 13.4% |
| Total | 2,963 | 100.0% |
Internet Access in Charles Mix County
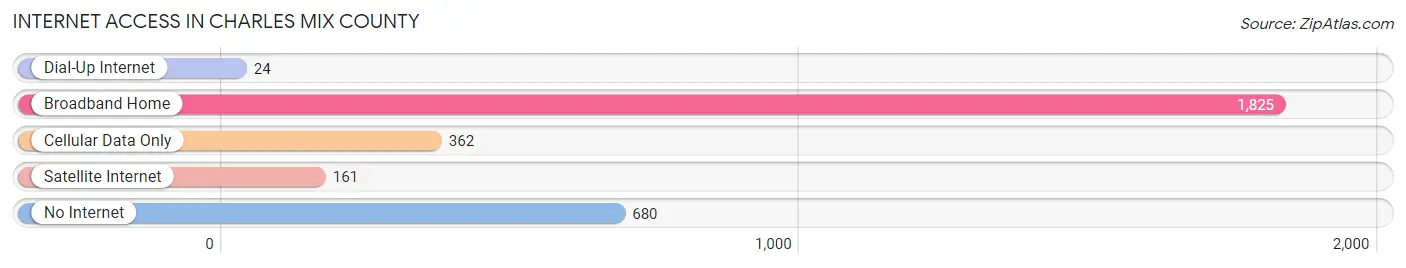
| Internet Type | # Households | % Households |
| Dial-Up Internet | 24 | 0.8% |
| Broadband Home | 1,825 | 61.6% |
| Cellular Data Only | 362 | 12.2% |
| Satellite Internet | 161 | 5.4% |
| No Internet | 680 | 23.0% |
| Total | 2,963 | 100.0% |
Charles Mix County Summary
Introduction
Charles Mix County is located in the southeastern corner of South Dakota, and is bordered by the Missouri River to the east and the Big Sioux River to the south. The county was named after Charles Mix, a prominent politician and lawyer in the state. The county seat is Lake Andes, and the largest city is Wagner. The county has a total area of 845 square miles, and a population of 9,129 as of the 2010 census.
History
Charles Mix County was established in 1862, and was named after Charles Mix, a prominent politician and lawyer in the state. The county was originally part of the Dakota Territory, and was later incorporated into the state of South Dakota in 1889. The county was originally populated by Native American tribes, including the Yankton Sioux, Oglala Sioux, and Santee Sioux.
The first settlers in the area were mostly of European descent, and they began to arrive in the late 1800s. The first permanent settlement in the county was established in 1871, and the county seat was established in Lake Andes in 1873. The county was primarily an agricultural area, and the main crops grown were wheat, corn, and oats.
Geography
Charles Mix County is located in the southeastern corner of South Dakota, and is bordered by the Missouri River to the east and the Big Sioux River to the south. The county has a total area of 845 square miles, and is mostly flat with rolling hills. The county is home to several lakes, including Lake Andes, Lake Francis Case, and Lake Thompson. The county is also home to several wildlife refuges, including the Lake Andes National Wildlife Refuge and the Lake Thompson National Wildlife Refuge.
Economy
The economy of Charles Mix County is primarily based on agriculture. The main crops grown in the county are wheat, corn, and oats. The county is also home to several livestock farms, and the main livestock raised in the county are cattle, hogs, and sheep. The county is also home to several manufacturing companies, including a concrete plant, a grain elevator, and a feed mill.
Demographics
As of the 2010 census, the population of Charles Mix County was 9,129. The population is mostly white (90.2%), with small percentages of Native American (4.2%), African American (2.2%), and Asian (1.2%). The median household income in the county is $41,945, and the median home value is $90,400. The unemployment rate in the county is 4.2%.
Conclusion
Charles Mix County is located in the southeastern corner of South Dakota, and is bordered by the Missouri River to the east and the Big Sioux River to the south. The county has a total area of 845 square miles, and a population of 9,129 as of the 2010 census. The economy of the county is primarily based on agriculture, and the main crops grown in the county are wheat, corn, and oats. The population of the county is mostly white, with small percentages of Native American, African American, and Asian. The median household income in the county is $41,945, and the median home value is $90,400.
Common Questions
What is the Total Population of Charles Mix County?
Total Population of Charles Mix County is 9,302.
What is the Total Male Population of Charles Mix County?
Total Male Population of Charles Mix County is 4,655.
What is the Total Female Population of Charles Mix County?
Total Female Population of Charles Mix County is 4,647.
What is the Ratio of Males per 100 Females in Charles Mix County?
There are 100.17 Males per 100 Females in Charles Mix County.
What is the Ratio of Females per 100 Males in Charles Mix County?
There are 99.83 Females per 100 Males in Charles Mix County.
What is the Median Population Age in Charles Mix County?
Median Population Age in Charles Mix County is 35.4 Years.
What is the Average Family Size in Charles Mix County
Average Family Size in Charles Mix County is 3.8 People.
What is the Average Household Size in Charles Mix County
Average Household Size in Charles Mix County is 3.0 People.
What is Per Capita Income in Charles Mix County?
Per Capita income in Charles Mix County is $27,034.
What is the Median Family Income in Charles Mix County?
Median Family Income in Charles Mix County is $72,837.
What is the Median Household income in Charles Mix County?
Median Household Income in Charles Mix County is $60,729.
What is Income or Wage Gap in Charles Mix County?
Income or Wage Gap in Charles Mix County is 27.2%.
Women in Charles Mix County earn 72.8 cents for every dollar earned by a man.
What is Family Income Deficit in Charles Mix County?
Family Income Deficit in Charles Mix County is $16,365.
Families that are below poverty line in Charles Mix County earn $16,365 less on average than the poverty threshold level.
What is Inequality or Gini Index in Charles Mix County?
Inequality or Gini Index in Charles Mix County is 0.45.
How Large is the Labor Force in Charles Mix County?
There are 4,149 People in the Labor Forcein in Charles Mix County.
What is the Percentage of People in the Labor Force in Charles Mix County?
61.2% of People are in the Labor Force in Charles Mix County.
What is the Unemployment Rate in Charles Mix County?
Unemployment Rate in Charles Mix County is 7.1%.